lebanon poverty and social impact analysis - world...
TRANSCRIPT
LEBANON Social Impact Analysis - Electricity and Water Sectors
March 2009
Social and Economic Development Group Middle East and North Africa Region
Document of the World Bank

CURRENCY EQUIVALENTS (Exchange Rate Effective: March 24, 2009)
Currency Unit = Lebanese Pounds
1 LBP = US$0.00066 US$1 = 1,501 LBP
FISCAL YEAR
January 1 – December 31
ABBREVIATIONS AND ACRONYMS
BML Beirut Mount Lebanon BMLWA Beirut Mount Lebanon Water Authority CAS Country Assistance Strategy CDR Council for Development and Reconstruction CF Circonscription Foncière CVM Contingent Valuation Method EdL Electricité du Liban GDP Gross Domestic Product kWh Kilowatt hour LBP Lebanese Pounds LMIC Lower Middle Income Country MENA Middle East and North Africa MoEW Ministry of Energy and Water MoSA Ministry of Social Affairs O&M Operating and Maintenance OECD Organization for Economic Development and Cooperation PER Public Expenditure Review SIA Social Impact Analysis RWAs Regional Water Authorities UfW Unaccounted for Water UMIC Upper Middle Income Country UNDP United Nations Development Program VAT Value Added Tax WDI World Development Indicators WHO World Health Organization
Vice President: Daniel Gressani Country Director: Hedi Larbi Sector Director: Ritva Reinikka Sector Manager: Farrukh Iqbal Task Team Leader: Sebnem Akkaya
LEBANON Social Impact Analysis-Electricity and Water Sectors
Table of Contents
ACKNOWLEDGMENTS EXECUTIVE SUMMARY ......................................................................................................................................... I
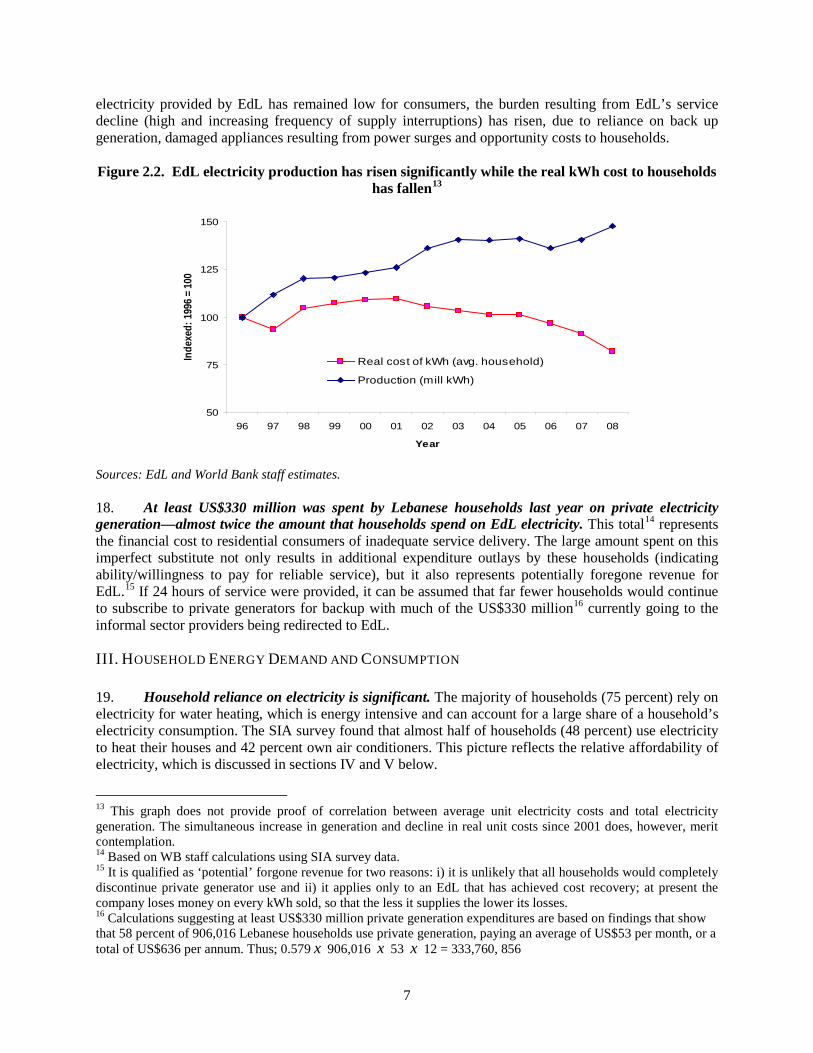
ELECTRICITY ...........................................................................................................................................................II WATER ............................................................................................................................................................ IV CONCLUSIONS ........................................................................................................................................................ VI
CHAPTER 1. INTRODUCTION ............................................................................................................................... 1 OBJECTIVES ............................................................................................................................................................. 1 CONTEXT .............................................................................................................................................................. 1 METHODOLOGY ....................................................................................................................................................... 2 REPORT STRUCTURE ................................................................................................................................................ 3
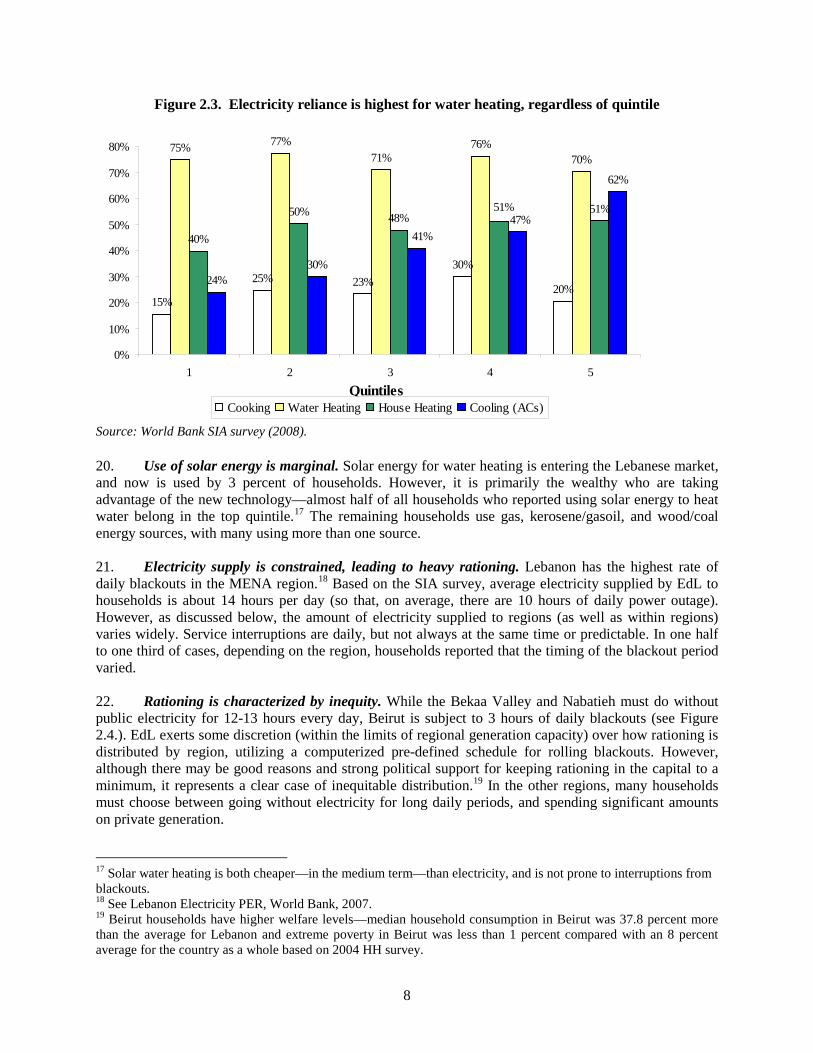
CHAPTER 2. ELECTRICITY ................................................................................................................................... 4 I. INTRODUCTION ............................................................................................................................................... 4 II. KEY SECTOR ISSUES – A SUMMARY OVERVIEW ........................................................................................... 5 III. HOUSEHOLD ENERGY DEMAND AND CONSUMPTION .................................................................................... 7 IV. PUBLIC ELECTRICITY TARIFFS .................................................................................................................... 12 V. HOUSEHOLD ELECTRICITY EXPENDITURES ................................................................................................ 16 VI. WILLINGNESS TO PAY .................................................................................................................................. 19 VII. DISTRIBUTIONAL IMPACT OF TARIFF REFORM OPTIONS ........................................................................... 20 VII. CONCLUSIONS ............................................................................................................................................... 26
CHAPTER 3. WATER .............................................................................................................................................. 28 I. INTRODUCTION ............................................................................................................................................. 28 II. KEY SECTOR ISSUES – A SUMMARY OVERVIEW ......................................................................................... 28 III. PUBLIC WATER SUPPLY ............................................................................................................................... 30 IV. HOUSEHOLD WATER DEMAND AND CONSUMPTION ................................................................................... 32 V. HOUSEHOLD CONNECTIONS TO THE PUBLIC NETWORK ............................................................................ 33 VI. QUALITY OF PUBLIC NETWORK .................................................................................................................. 35 VII. ALTERNATE WATER SOURCES USED BY HOUSEHOLDS .............................................................................. 36 VIII. WATER TARIFFS ........................................................................................................................................... 37 IX. HOUSEHOLD WATER EXPENDITURES .......................................................................................................... 38 X. WILLINGNESS TO PAY .................................................................................................................................. 41 XII. PUBLIC WATER METERING ......................................................................................................................... 42 XII. CONCLUSIONS ............................................................................................................................................... 44
ANNEXES ............................................................................................................................................................ 46 ANNEX I: METHODOLOGY ................................................................................................................................. 46 ANNEX II: THE PRIVATE ELECTRICITY GENERATION BUSINESS ...................................................................... 52 ANNEX III: WILLINGNESS TO PAY-BACKGROUND .............................................................................................. 55 ANNEX IV: LESSONS LEARNED FROM ENERGY SECTOR REFORMS ................................................................... 59 ANNEX V: REFERENCES ...................................................................................................................................... 64
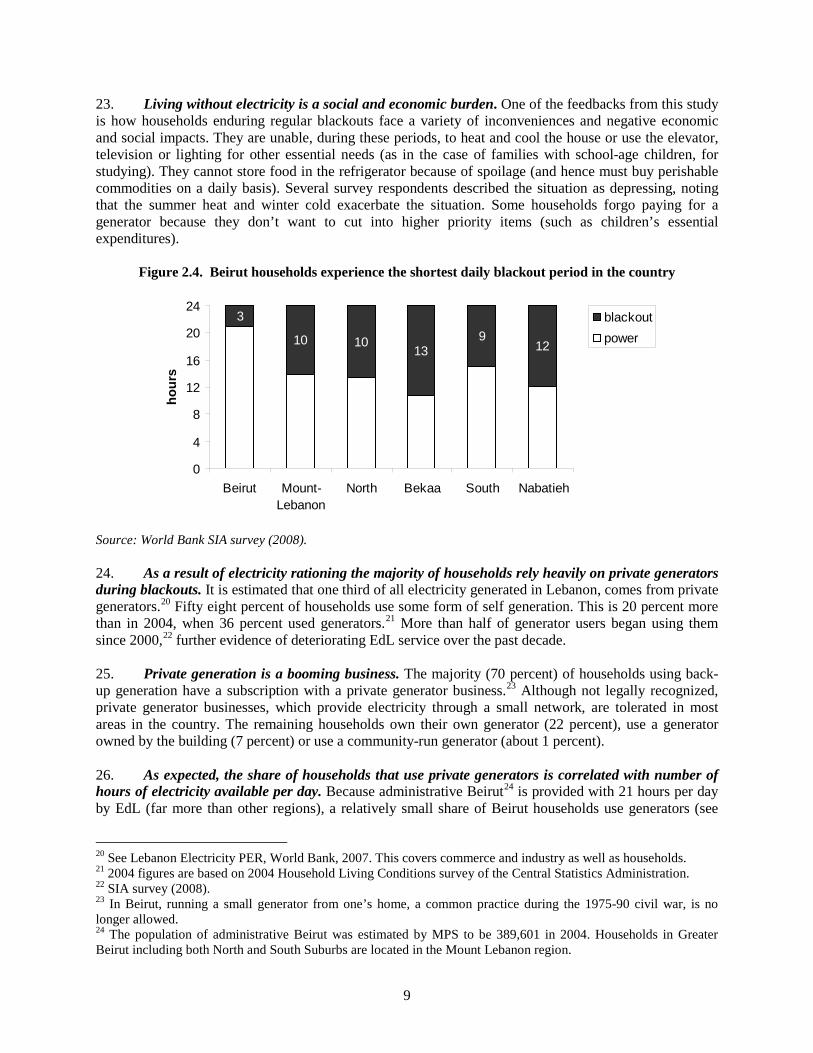
FIGURES FIGURE 1.1. SHARE OF POPULATION UNDER THE OFFICIAL POVERTY LINE .................................................................... 2FIGURE 2.1. TRANSFERS TO EDL HAVE BALLOONED .................................................................................................... 6FIGURE 2.2. EDL ELECTRICITY PRODUCTION HAS RISEN SIGNIFICANTLY WHILE THE REAL KWH COST TO HOUSEHOLDS
HAS FALLEN .............................................................................................................................................. 7FIGURE 2.3. ELECTRICITY RELIANCE IS HIGHEST FOR WATER HEATING, REGARDLESS OF QUINTILE ............................. 8FIGURE 2.4. BEIRUT HOUSEHOLDS EXPERIENCE THE SHORTEST DAILY BLACKOUT PERIOD IN THE COUNTRY ............... 9FIGURE 2.5. USE OF GENERATORS IS INVERSELY CORRELATED WITH PUBLIC ELECTRICITY RATIONING ...................... 10FIGURE 2.6. USE OF GENERATORS IS CORRELATED WITH INCOME ............................................................................... 12FIGURE 2.7. AT FIRST GLANCE, THE INVERTED BLOCK TARIFF SUGGESTS PROGRESSIVITY ......................................... 13FIGURE 2.8. WHEN COMPARING EFFECTIVE VERSUS QUOTED ELECTRICITY CHARGES, REGRESSIVITY (FOR
CONSUMPTION UNDER 300 KWH) BECOMES CLEAR ................................................................................. 15FIGURE 2.9. KWH CONSUMPTION PATTERNS WITHIN QUINTILES (EDL NETWORK), BY TRANCHE ............................... 16FIGURE 2.10. EXPENDITURES BY QUINTILE (EDL NETWORK) ...................................................................................... 16FIGURE 2.11. EXPENDITURES BY REGION (EDL NETWORK) ......................................................................................... 17FIGURE 2.12. AMONG HOUSEHOLDS THAT USE GENERATORS, EXPENDITURES FOR THIS ALTERNATIVE FAR EXCEED
EXPENDITURES GOING TO EDL ................................................................................................................ 19FIGURE 2.13. WILLINGNESS TO PAY IS HIGH ................................................................................................................. 19FIGURE 2.14. WILLINGNESS TO PAY IS GREATER FOR THOSE WITH PRIVATE GENERATORS ........................................... 20FIGURE 2.15. AFFORDABILITY AND PROGRESSIVITY (CUMULATIVE) ............................................................................ 24FIGURE 3.1. NETWORK WATER AVAILABILITY - DEMAND MOSTLY EXCEEDS SUPPLY ................................................. 32FIGURE 3.2. NETWORK WATER AVAILABILITY IS NOT RELATED TO WELFARE ............................................................. 33FIGURE 3.3. CONNECTION RATES ARE HIGHEST IN BEIRUT ......................................................................................... 34FIGURE 3.4. USE OF PUBLIC NETWORK WATER FOR DRINKING SHOWS STRONG REGIONAL VARIATION ....................... 35FIGURE 3.5. PERCEPTIONS OF PUBLIC NETWORK DRINKING WATER QUALITY VARY BY REGION ................................. 36FIGURE 3.6. HOUSEHOLD WATER CONSUMPTION BY SOURCE – ALL HOUSEHOLDS ...................................................... 37FIGURE 3.7. SHARE OF TOTAL WATER EXPENDITURES IN HOUSEHOLD BUDGET .......................................................... 38FIGURE 3.8. EXPENDITURES OF CONNECTED HOUSEHOLDS ON ALTERNATIVE SOURCES ............................................. 39FIGURE 3.9. WATER EXPENDITURES OF CONNECTED VS. UNCONNECTED HOUSEHOLDS .............................................. 39FIGURE 3.10. WILLINGNESS TO PAY ............................................................................................................................. 42 TABLES TABLE 2.1. THE PRIMARY REASON FOR NOT USING A GENERATOR IS AFFORDABILITY ............................................... 11TABLE 2.2. LOW VOLTAGE EDL ELECTRICITY TARIFFS - 2008 (PER KWH) ............................................................... 13TABLE 2.3. BUT EDL’S HIGH FIXED FEES UNDERMINE PROGRESSIVITY (2008) .......................................................... 14TABLE 2.4. AVERAGE KWH AND AMPERE LEVELS (BY QUINTILE) ............................................................................. 15TABLE 2.5. AVERAGE ELECTRICITY PRICE (EDL NETWORK) .................................................................................... 17TABLE 2.6. SHARE OF PUBLIC (EDL) ELECTRICITY EXPENDITURES IN TOTAL HOUSEHOLD EXPENDITURES ................ 18TABLE 2.7. MANY CONSUMERS DISTRUST THE BILLING SYSTEM ............................................................................... 18TABLE 2.8. CHANGES TO NOMINAL TARIFF RATES ..................................................................................................... 24TABLE 2.9. ILLUSTRATIVE SCENARIOS AND THEIR IMPACTS (EDL EXPENDITURES ONLY) ........................................ 25TABLE 2.10. IMPLICATIONS OF KEY ELECTRICITY REFORMS FOR DIFFERENT STAKEHOLDERS ..................................... 26TABLE 3.1. AVERAGE WATER TARIFFS AND DEGREE OF COST RECOVERY ............................................................... 29TABLE 3.2. SUMMARY OF MAIN PERFORMANCE INDICATORS FOR THE RWAS (2004) ............................................... 30TABLE 3.3. PUBLIC NETWORK WATER AVAILABILITY .............................................................................................. 31TABLE 3.4. DAILY WATER SUPPLY APPEARS TO HAVE DECLINED DURING THE SUMMER (HOURS/DAY) ...................... 33TABLE 3.5. REASONS HOUSEHOLD IS NOT CONNECTED TO PUBLIC NETWORK ............................................................ 35TABLE 3.6. WATER TARIFFS BY REGION (ANNUAL FEES, LBP) .................................................................................. 38TABLE 3.7. VOLUME VS. NON-VOLUME BASED WATER COSTS ................................................................................... 40TABLE 3.8. WATER EXPENDITURES BY SOURCE (MILLION US$) ................................................................................ 41TABLE 3.9. MANY HOUSEHOLDS ASSOCIATE METERS WITH HIGHER COSTS ............................................................... 43TABLE 3.10. IMPLICATIONS OF KEY WATER REFORMS FOR DIFFERENT STAKEHOLDERS .............................................. 45

BOXES BOX 2.1. REAL VS. EFFECTIVE ELECTRICITY PRICE ....................................................................................................... 6 BOX 2.2. THE PRIVATE ELECTRICITY GENERATION BUSINESS .................................................................................... 11 BOX 2.3. CONSUMERS EXPLAIN WILLINGNESS TO PAY ................................................................................................. 21 BOX 2.4. SCENARIOS ................................................................................................................................................... 23 BOX 3.1.CONSUMERS EXPLAIN WILLINGNESS TO PAY .................................................................................................. 43

ACKNOWLEDGMENTS This Report was prepared by Sebnem Akkaya (TTL), Nils Junge (Consultant) and Wael Mansour (Economist) with the support of a team including: M. Ananda Covindassamy (electricity sector and survey instrument), Chadi Bou Habib (fiscal analysis and survey instrument), Mohammed Benouahi (water sector), Nanak Kakwani (distributional impact analysis) and Muna Abeid Salim (processing of the Report). Lina Fares (procurement specialist) provided valuable guidance in the organization of the SIA survey. Inputs were received in early draft from Anna Bjerde, (Sector Manager), Demba Ba (Country Manager), Haneen Sayed (Lead Operations Officer), Husam Mohamed Beides (Sr. Energy Specialist), Jonathan Walters (Sector Manager), Lizmara Kirchner (Infrastructure Specialist), Mona Ziade (Communications Officer), and Paul Noumba Um (Lead Economist). Hedi Larbi (Country Director) and Farrukh Iqbal (Sector Manager) sponsored the report and provided valuable suggestions on the design. The team would like to give special thanks to Consultation and Research Group (CRI) who conducted the survey under sometimes difficult circumstances. Their local knowledge and resources were instrumental in bringing the survey to a successful conclusion, while their reliability and inputs with analysis were valuable. The staff of the various ministries and organizations has provided valuable support and cooperation in the preparation of this report particularly those in the Ministry of Energy and Water, Electricité du Liban, Regional Water Authorities, Council for Development and Reconstruction, Ministry of Economy and Trade, Ministry of Finance, and Ministry of Social Affairs.

i
EXECUTIVE SUMMARY i. This study considers implications for the consumer of current service provision and impending reforms in Lebanon’s utility sector. It aims to assess: i) how different categories of households, specifically the poor, are affected by weak electricity and water service; ii) the potential social impact of alternative reform scenarios—concerning tariff changes in the case of electricity, and metering in the case of water; and iii) implications of better cost recovery measures in both sectors on household welfare. ii. The findings are based largely on analysis of primary data collected as part of a household survey specifically designed for this Study; the recent technical sector assessments undertaken by the World Bank and by other domestic or external agencies; and information gathered in the field during the preparation of the Study. Relatively little research on the energy and water sectors in Lebanon has been conducted to date on the household/consumer perspective. Most sector studies have focused on technical aspects on the supply side, which represents just one side of the equation.1
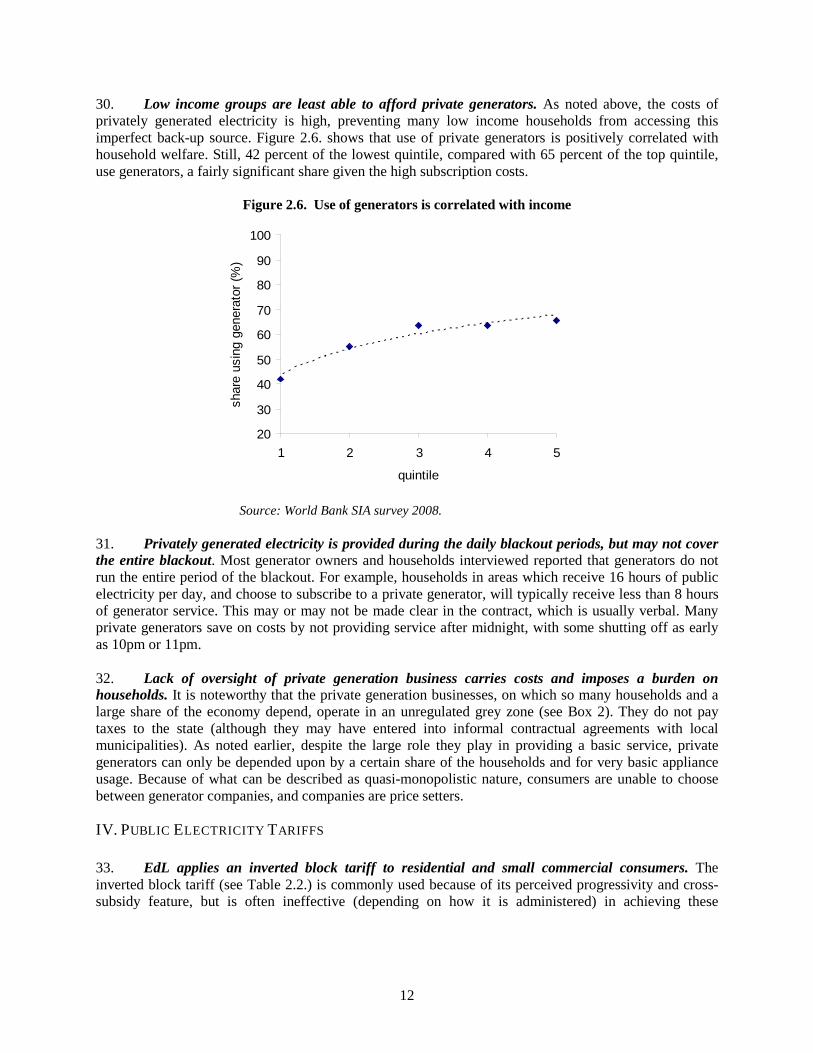
iii. The electricity and water sectors face major challenges in increasing supply and improving service, and they both are in need of significant reforms. One of the most striking aspects in the electricity sector is the heavy dependence on the informal, private generation sector, which nonetheless operates outside any state supervision or guiding framework. Bearing in mind the potential drawbacks of introducing regulation, the fact that such a large and monopolistic energy sector player operates in the grey economy requires attention. In both the formal and informal water sector quality concerns are of paramount importance—quality is a public health issue and there are serious additional socioeconomic consequences. The Study points to the following key similarities and differences between the two sectors from a social impact perspective:
• Both the electricity and water sectors suffer from inadequate supply. In the electricity sector this takes the form of highly uneven rationing. Water supply on the other hand, is constrained in every region by limited infrastructure capacity, population density and demand. Both sectors experience high commercial and technical losses. Beirut households enjoy good electricity supply, with rationing limited to three hours a day, but the city receives the lowest water supply per household in Lebanon.
• A key problem in the water sector is the disconnect between supply and demand. The absence of a metering system means households pay a fixed fee for a fixed amount of water supply (or allotment). Solving this issue would rationalize water consumption to a degree. There appears to be an informal understanding between water companies and households: many households don’t receive their water allotment, and the water companies often don’t pressure households to pay their bills. The key problem in the electricity sector is high cost of alternative supply, which is utilized by 58 percent of households.
• Virtually all households are connected to the electricity network. Connection rates for water are 80 percent. However, given that water supply is inadequate in terms of both quantity and quality, connected households tend to purchase from alternate sources.
• Households have limited choice (on quality and cost) when it comes to electricity generation, with most buying from generator companies operating in the grey economy. There is a
1 The report should be read in conjunction with the “Republic of Lebanon Electricity Sector Public Expenditure Review, Report No. 41421-LB, Washington DC, January 31”; and “World Bank (forthcoming), Republic of Lebanon Water Sector Public Expenditure Review, Washington DC” which provide in-depth analysis of technical and institutional issues.
ii
somewhat larger menu of options for purchasing water, available from tanker trucks, to wells, to large gallon bottles, and small bottles.
• Willingness to pay for improved electricity service is much higher for electricity than for water, reflecting the high cost and limited choice of electricity alternatives.
ELECTRICITY
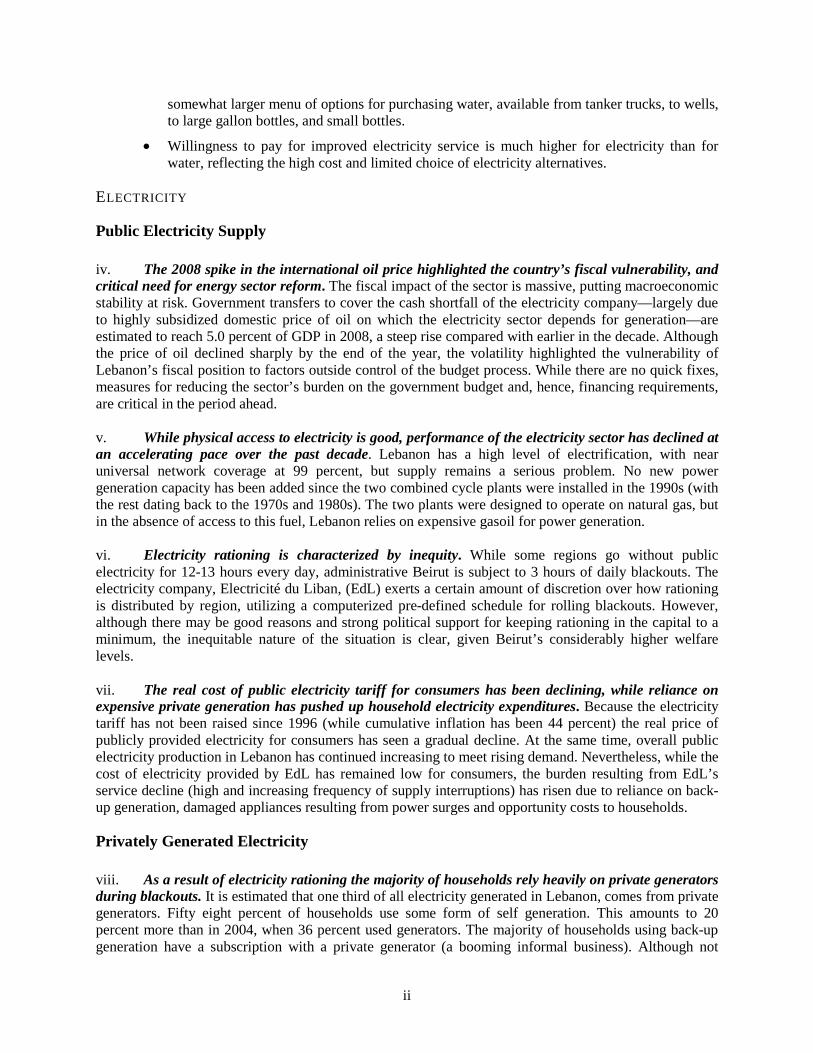
Public Electricity Supply iv. The 2008 spike in the international oil price highlighted the country’s fiscal vulnerability, and critical need for energy sector reform. The fiscal impact of the sector is massive, putting macroeconomic stability at risk. Government transfers to cover the cash shortfall of the electricity company—largely due to highly subsidized domestic price of oil on which the electricity sector depends for generation—are estimated to reach 5.0 percent of GDP in 2008, a steep rise compared with earlier in the decade. Although the price of oil declined sharply by the end of the year, the volatility highlighted the vulnerability of Lebanon’s fiscal position to factors outside control of the budget process. While there are no quick fixes, measures for reducing the sector’s burden on the government budget and, hence, financing requirements, are critical in the period ahead.
v. While physical access to electricity is good, performance of the electricity sector has declined at an accelerating pace over the past decade. Lebanon has a high level of electrification, with near universal network coverage at 99 percent, but supply remains a serious problem. No new power generation capacity has been added since the two combined cycle plants were installed in the 1990s (with the rest dating back to the 1970s and 1980s). The two plants were designed to operate on natural gas, but in the absence of access to this fuel, Lebanon relies on expensive gasoil for power generation.
vi. Electricity rationing is characterized by inequity. While some regions go without public electricity for 12-13 hours every day, administrative Beirut is subject to 3 hours of daily blackouts. The electricity company, Electricité du Liban, (EdL) exerts a certain amount of discretion over how rationing is distributed by region, utilizing a computerized pre-defined schedule for rolling blackouts. However, although there may be good reasons and strong political support for keeping rationing in the capital to a minimum, the inequitable nature of the situation is clear, given Beirut’s considerably higher welfare levels.
vii. The real cost of public electricity tariff for consumers has been declining, while reliance on expensive private generation has pushed up household electricity expenditures. Because the electricity tariff has not been raised since 1996 (while cumulative inflation has been 44 percent) the real price of publicly provided electricity for consumers has seen a gradual decline. At the same time, overall public electricity production in Lebanon has continued increasing to meet rising demand. Nevertheless, while the cost of electricity provided by EdL has remained low for consumers, the burden resulting from EdL’s service decline (high and increasing frequency of supply interruptions) has risen due to reliance on back-up generation, damaged appliances resulting from power surges and opportunity costs to households.
Privately Generated Electricity
viii. As a result of electricity rationing the majority of households rely heavily on private generators during blackouts. It is estimated that one third of all electricity generated in Lebanon, comes from private generators. Fifty eight percent of households use some form of self generation. This amounts to 20 percent more than in 2004, when 36 percent used generators. The majority of households using back-up generation have a subscription with a private generator (a booming informal business). Although not
iii
formally regulated, private generator businesses, which provide electricity through a small network, are tolerated in most areas in the country. ix. Privately provided electricity is more expensive than electricity from EdL at present tariff levels. Because privately generated electricity is not sold by quantity consumed, but by ampere level, direct cost comparisons with EdL charges on a kWh basis are difficult. However, it is clear that electricity purchased from private generators is more expensive. During the SIA survey period (spring 2008) the average bill from a private generator was US$47, compared with US$26 for the EdL bill; but private generators provided just half the number of hours per day (7.2 vs. 14.3) and less than half as many amperes on average (6.5 vs. 14.5) as EdL. x. The burden resulting from EdL’s service decline has increased significantly. This is the case despite the fact that the cost of electricity purchased from EdL has remained low for consumers. This reflects reliance on back up generation and indirect losses incurred at the household level.
xi. Households spent a total of US$330 million on privately generated electricity last year. The informal electricity market serves 58 percent of households with this far more expensive “imperfect substitute.” Generator expenditures (for households that use them) are almost double what households spend on EdL electricity.
Reliance on Electricity
xii. Overall reliance on electricity is significant. Because it is relatively affordable, the majority of households (75 percent) rely on electricity for water heating, which is energy intensive and can account for a large share of a household’s electricity consumption. The SIA found that almost half of households (48 percent) use electricity to heat their houses and 42 percent own air conditioners.
xiii. The tariff structure creates little incentive to constrain one’s electricity consumption. Average household kWh consumption among the lowest-income quintile ranges from 295 kWh (off peak months) to 488 kWh (peak months). During peak months, one third of households in the lowest-income quintile consume above 500 kWh and about one quarter consume below 300 kWh. During off-peak months only 6 percent of households in the lowest-income quintile consume above 500 kWh and more than 60 percent of them consume below 300 KWh.
Tariff and Expenditures xiv. The inverted block tariff does not achieve its objectives. Although designed to be progressive, in practice EdL’s inverted block tariff fails to meaningfully benefit households with low electricity consumption. Because it subsidizes all households and because for households consuming very low amounts of electricity, the fixed cost forms a large share of their bill, the tariff structure does not benefit low electricity consumers—there is a large difference between the quoted kWh price, and the effective price, which is the electricity bill divided by kWh consumed. Most households currently pay an effective price of 6 cents/kWh, rising to an average of only 8.2 cents/kWh for high income households. xv. The share of electricity expenditures to EdL in household budget is relatively low. The share of electricity purchased from EdL in household budgets during peak months ranges from 3.5 percent for the highest-income quintile to 5.0 percent for the lowest-income quintile during peak months. These levels fall well below the 10-15 percent electricity share in household budget, a ceiling considered acceptable in many countries. The addition of private electricity expenditures does not increase the share of expenditures above the ceiling.
iv
xvi. The vast majority of households would be willing to pay more for electricity. Over half of respondents to the SIA (household) survey would be willing to pay double their current expenditures, contingent upon receiving 24 hour service.
xvii. Illustrative simulations show that the most progressive tariff reform would include a steep increase in blocks and reduction or elimination of the rehabilitation fee. A simulation model that demonstrates the poverty/social impacts of how households would be affected by tariff changes in terms of affordability, increase in the household bill, and progressivity showed that even relatively high tariff increases across the board do not lead household expenditures to exceed international norms for any quintile. Use of private generation increases electricity expenditures in the budget share. However if tariff increases are introduced gradually over time, with EdL simultaneously increasing hours of service, households would reduce their need for private generators. Because electricity is currently relatively affordable, distributional impacts of the tariff structure will matter more once the tariffs begin to increase.
WATER
Public Water Supply xviii. Lebanon’s ample water resources do not translate into sufficient water supply. One of the few countries in the region benefiting from plentiful rainfall, Lebanon has potentially sufficient water resources to meet domestic demand. Nonetheless, transforming resources into quality drinking water for the entire population has proved difficult despite Government investments in infrastructure. As a result, water supply service is poor and intermittent in most parts of the country.
xix. In the absence of metering (outside a few limited areas) there is a disconnect between water supply and household demand. As in any country without a metering system, supply and demand for public network water is de-linked at the household level: the amount of water provided to each household is unrelated to the amount of water a household would choose to consume and pay for. Key demand determinants—such as, price, income, quality and consumption needs—do not play a role, except insofar as a household chooses not to connect to the network at all. In short, because public water supply cannot be regulated to meet demand, households cannot adjust their consumption patterns. xx. Lebanon’s cost recovery performance is poor compared to other countries. Three of the four Regional Water Authorities (RWAs) do not have enough revenue to cover operating and maintenance (O&M) costs, and collection rates are as low as 33 percent in some cases. The Government often steps in to pay for operating expenses in additon to financing investments in water infrastructure. Most RWAs also incur high O&M costs arising from inefficient management of services and degraded water networks.
xxi. The effective cost of public water to the households is often much higher than the quoted tariff. The quoted average cost of 1m3/day in Lebanon is US$ 0.37, which is equivalent to the average for MENA countries. Many households, however, pay a higher actual, or effective, rate because they receive considerably less water than 1m3/day. Furthermore, unreliability of supply imposes its own costs, because of storage, and purchase of backup or alternative water supply.
Connections to Public Water Network xxii. Compared with four years ago, connection rates are up, but hours of service are down. An estimated 80 percent of households are connected to the public network system which is an increase from 76 percent from four years earlier. Intermittent water supply is the norm. The average household receives
v
6 hours per day in the summer season and 9 hours in the winter season. Compared with the earlier estimates, this represents an overall decrease in supply, particularly during the winter months. Beirut and Mount Lebanon region is an exception, with an increase in water supplied during the summer.
xxiii. Low-income households are less likely to be connected to the public network, but this is primarily due to location rather than the affordability. In the lowest-income quintile connection rates are 62 percent compared with 86 percent for the highest quintile. However, this has less to do with affordability of the water bill (and even connection rates) than with location, given the pattern of lower connection rates outside of Beirut and the strong regional dimension of the poverty in Lebanon. Less densely populated areas are more difficult and costly to serve. xxiv. Few households don’t connect because they cannot afford it. Although households are not connected to the public network for a variety of reasons, the issue of affordability ranks quite low. Only 3 percent claim they ‘cannot afford’ or ‘don’t want to pay’ for a connection. The most common reason given for not being connected is that the household didn’t have a choice: among the 20 percent of unconnected households, over half report that there is no public network available in their area.
xxv. There is high regional variation across indicators. Population density confers both advantages and disadvantages on connections in Beirut. Although Beirut households may receive relatively little water, they are also the most likely to be connected. This is in stark contrast to the other regions, where up to half of households may not be connected. Perception of drinking water quality likewise varies by region, with reported satisfaction far higher in Bekaa Valley than elsewhere.
Alternative Water Sources
xxvi. Inadequate and unreliable water supply pushes households to purchase water from alternate sources. Only one quarter of Lebanese households receive water every day. Combined with often low water quality, the use of a wide variety of alternate water sources is common. They are used by both connected and unconnected households. Households without connections tend to use artesian wells and delivery trucks more than connected households, but an almost equal number of connected households purchase delivery truck water for service use, and buy water in gallons or bottles for cooking and drinking.
xxvii. Combined water expenditures on public network and other sources are in line with World Bank recommendations on utility affordability. World Bank recommends that not more than 3-5 percent of household budget is spent on water, and most Lebanese households fall within this range. Connected households spend a lower share of their household budget on water than unconnected households. xxviii. If households could rely entirely on network water, they could cut their water expenditures significantly. In absolute terms, reduced water expenditures for the bottom quintile would generate large savings (as much as 220,000 LBP or US$147 on average for connected households), virtually as much as their current average water bill of 201,000 LBP (US$134). Savings could be even larger for the upper quintiles. The convenience of having a household connection has not been quantified but would be an added welfare benefit. However, even under the status quo, simply being connected would lower a household’s water expenditures. xxix. Given the current conditions and alternatives, households are reluctant to pay more for better public service. Despite dissatisfaction with quality and availability, when presented with a scenario of better quality water and sufficient supply, households were generally unwilling to pay more for public
vi
service. Only half said they would be willing to pay more than an additional 21 percent for better service, while one-third would pay 50 percent (approximately US$66) per year more.
CONCLUSIONS xxx. The overarching challenge facing Lebanon’s public electricity and water sectors will be to establish trust with consumers while simultaneously improving performance. Major investments in each sector targeting infrastructure, management and human resources will need to take place while increasing revenue from consumers who have little faith in the system and want to see concrete results or credible action. The following remarks consider each sector separately.
Electricity:
• Design a more effective and simplified tariff structure. The current tariff structure is regressive and will do little to shield the poor from any future tariff increases. The inverted tariff block is not progressive—this is partly because it subsidizes all households and partly because effective kWh prices differ markedly from the quoted prices. This is especially so for low electricity consuming households.
• Ensure proper sequencing in implementing policy measures. The burden resulting from EdL’s
service decline has increased significantly, despite the fact that the cost of electricity purchased from EdL has remained relatively low for consumers. However, increasing tariffs to cost recovery levels without moving to quickly introducing service improvements would likely meet with resistance. Consumers must feel that the burden of reform is not placed squarely on their shoulders but is shared with EdL.
• Improve production and service by reducing rationing, especially in the areas outside Beirut
which experience long blackout hours. Among other things, this will have the effect of readjusting the burden imposed by rationing from the poor to the non-poor. Although there may be good reasons for keeping rationing in the capital to a minimum, it gives rise social inequities. Beirut households have higher welfare levels and they are most able to afford paying for expensive substitutes, yet have the least need for them. Most households in other regions must choose between going without electricity and spending significant amounts on private generation.
• Identify key operating guidelines for informal electricity sector. The informal electricity sector,
served by hundreds of private generator businesses, provides up to 30 percent of Lebanon’s electricity and is an indispensible service to many households. Yet the sector lies entirely outside the legal framework and does not pay taxes to the state. It must be acknowledged that private generation will play a significant role in electricity generation for years to come. Hence, identification of proper operating guidelines that will protect and benefit consumers while ensuring continued availability of this alternative source should be given consideration and merit additional research work. Without dampening private sector activity, or generating an additional and onerous layer of bureaucracy, the guidelines could have several objectives, including:
bring private generator businesses into the formal sector so that customers have access to
means of redress for losses or damage incurred by faulty wiring or through other fault; enable the state to tax the sector like other businesses; set technical standards for service; monitor the sector and either set guidelines on subscription fees (it would be desirable to
assess if the generator businesses operate as a monopolistic structure).
vii
• Harmonize electricity sector reform with social safety net reform over time. Given the ongoing
progress with the design of a social safety net system with an adequate targeting framework in Lebanon, it will be important to consider electricity reforms, in particular tariff structure adjustments, in the context of the objectives and tools of the new social safety net system over time. In some countries social objectives are pursued through social policies and not necessarily through energy pricing. This is an option that should be kept in mind when the new social safety system is up and running, at which point the changes to the tariff structure that are currently being debated for implementation from 2009 onwards could be reconsidered.
Water:
• Invest in improving water quality. In Lebanon, the burden on poor households comes from poor quality and low water supply, rather than high expenditures. Water expenditures by the low income households are in line with World Bank recommendations of 3 to 5 percent of household budget, but could be reduced if households relied less on alternative sources. Although compared to other problems in water provision, reducing expenditures for consumers is not the top priority, the costs which consumers bear in terms of quality of service—poor reliability and potential health risks—are significant. A focus on improving quality and reducing losses, if accompanied by a public awareness campaign, would have a direct effect on welfare.
• A rapid rollout of metering is needed if wastage and equity issues are to be addressed. Both
Regional Water Authorities and consumers lose when supply and demand are delinked by the current flat fee structure. Water companies cannot charge the marginal cost of production, and consumers do not get what they pay for. The pilot metering programs show that metering can be introduced, but unless metering is either region-wide or metered households are able to pay by volume, the benefits of metering will not materialize.
• Adopt a clear framework for reform sequencing by balancing costs and benefits between
consumers and water companies. While the scale and complexity of the improvements precludes them from occurring simultaneously, proper sequencing of reform measures will be crucial to their successful implementation and acceptance by stakeholders. Reform will likely need to be based on negotiating a compromise between water companies increasing supply and quality (representing a gain for households, but additional costs for the companies) and raising the tariff (a loss to households, a gain for the companies).
• To increase revenues, RWAs will need to address household concerns. RWAs can increase
revenues in two ways, through improved bill collection and through tariff increases. In either case, RWAs will need to revise both the informal and the formal contractual agreements with households, raising tariffs and installing meters to link supply with demand, while also investing in improvements in quality. They will also need to strengthen collection enforcement mechanism. To be successful, the new contractual arrangement will need to spread the benefits and costs between consumers and water companies in a manner acceptable to both.

1
CHAPTER 1. INTRODUCTION
OBJECTIVES 1. The purpose of this Social Impact Analysis (SIA) is to probe the social, poverty and equity dimensions of electricity and water sector reforms2
and provide meaningful analysis to policy makers based on recently collected data. With a focus on households, the end users of utility services, the study complements the recent and ongoing studies on the Lebanon water and energy sectors that deal with more technical and supply side issues. The study assesses how poor and vulnerable households are affected by the current utility service situation and how they may be affected by reform proposals under deliberation. The aim is to provide policy makers with a deeper understanding of the social dimensions of water and electricity consumption as well as tools for estimating the distributional impacts of reform measures.
2. This Study followed the Poverty and Social Impact Analysis (PSIA) approach, an increasingly common approach, used both within and outside the World Bank to evaluate the distributional impacts of policy reforms. This approach is a form of evaluation research, typically conducted ex ante, and uses an array of economic and social tools and techniques to provide policy makers with a clearer understanding of how policy design and implementation affects different population groups, particularly the poor and vulnerable. Anticipating in advance potential negative impacts allows mitigation measures to be built into the policy design.
CONTEXT 3. As a middle income country, the entire population of Lebanese households relies on water and electricity to meet its basic needs. With universal connections to the electricity network, and four fifths of the population relying on publicly provided water, all households are potentially affected by changes in utility service. Even in the case of water, many unconnected households will be exposed to reform measures. As access to the network increases, and affordability and quality levels changes, all households will face a new set of choices. As reform measures are rolled out, the cost, affordability, and quality of publicly provided utility services will change in relation to the ‘back-up’ sources that so many households currently rely on. All households will weigh the costs and benefits of using public utility services versus privately provided alternatives. Among middle class and wealthier households, for whom affordability is less of an issue, reforms will be experienced primarily in terms of convenience and quality. For poor and lower income households, however, utility sector reforms will have a more immediate significance. Changes in the availability, reliability and cost of utility services are more likely to affect consumption behavior, with concomitant social as well as expenditure impacts. 4. A study on distributional impacts must begin with a general description of the population which stands to be affected. According to the 2004-05 Living Conditions and Household Budget Survey,3
just under 8 percent of Lebanese households lived below the poverty line, equivalent to US$2.4 per capita per day. These are households that considered extremely poor and unable to meet their basic food and non-food needs. An ‘upper poverty line’, set at US$4 per capita per day, was also set, and 28.5 percent of the population fell under this threshold.
2 For the purpose of this study, sector reform is broadly understood as improved service delivery (reliability, availability and quality) and measures to move the sectors toward cost recovery. 3 See Poverty, Growth and Inequality in Lebanon, UNDP, 2007.
2
5. Poverty in Lebanon has a strong regional dimension. While Beirut had a poverty rate of less than one percent (below the extreme poverty line) in 2004, the share was much larger in the Bekaa Valley (10.8 percent), the South (11.6 percent) and the North (17.8 percent). The significance of regional disparity is immediately apparent when considering distributional impacts of utility service provision. If, as is presently the case with the Lebanese electricity sector, regions are more highly rationed outside the capital, where poor households predominate, the benefits resulting from restoration to full 24 hour service across the country favors the poor. In other words, being most deprived, they have the most to gain.
Figure 1.1. Share of population under the official poverty line
0.72.2
3.8
10.8 11.6
17.8
0.0
4.0
8.0
12.0
16.0
20.0
Beirut Nabatieh MountLebanon
Bekaa South North
perc
enta
ge
Lebanon = 8.0
Source: "Poverty growth and inequality in Lebanon: executive summary", CAS, UNDP and MoSA Living Conditions and Household Budget Survey (2004)
6. In terms of expenditures, households below the poverty line spend significantly more than the non-poor on food (35 versus 23 percent) and slightly more on utilities (34 versus 30 percent). The opposite is true for health and education expenses. It is therefore to be expected that changes in the price, as well as availability, of these categories of consumption items will have differential impacts on welfare groups.
METHODOLOGY 7. Primary data was collected for the study using both quantitative and qualitative research methods. A quantitative survey was conducted targeting 1,804 households, representative at the Mohafaza (region) level. The sample was also selected to be geographically diverse (urban, rural, central, peripheral, densely populated, semi-deserted, etc.). The survey was conducted from April to June 2008.4
The results were analyzed to determine the consumption patterns and the willingness to pay of households according to region, welfare category and other variables of interest. (see Annex I)
8. In addition to the quantitative survey, qualitative in-depth interviews were conducted with selected profiles (households, municipalities, generator owners, EdL collectors and building managers) in order to elicit more in-depth understanding of the issues. These interviews were conducted in three waves: before, during, and after the quantitative survey. 9. Because of the changing poverty levels, which estimates indicate have risen since 2004, the analysis does not use the 8 percent poverty line. Instead it analyzes distributional impacts by comparing
4 It was briefly disrupted by the May political and security crisis.
3
household expenditure quintiles. Aside from avoiding the debate on who is poor, ranking by quintiles (in contrast to comparisons of poor and non-poor households) has two advantages: i) it provides a snapshot of distribution among all expenditure groups; and ii) it allows policymakers to consider the impacts on a larger population segments at the low end of the socio-economic ladder, for example the bottom 20 or bottom 40 percent.
REPORT STRUCTURE 10. The following chapters examine the energy and water sectors. Chapter 2 provides a review of household electricity supply and demand, private generation, tariffs, expenditures, and willingness to pay. It is followed by a discussion of the distributional impact of the tariff structure, including simulations of tariff scenarios for illustrative purposes. Chapter 3 reviews the water sector, public water supply, household connections, water quality issues, alternate water sources, tariffs, expenditures and willingness to pay. Both chapters conclude with recommendations with an emphasis on social implications of key reforms that matters for households. Annexes cover methodology and a description of the private generator business in Lebanon.
4
CHAPTER 2. ELECTRICITY
“Electricity is the mother of all problems in Lebanon. The size of the problem is beginning to pose a danger to public finances.” –Mohammad Chatah, Minister of Finance (quoted in L’orient le jour, July 25, 2008)
I. INTRODUCTION 11. Lebanon’s dysfunctional electricity sector has in recent years become a heavy burden on public finances, the economy and households. For years, the sector has suffered from a serious lack of investment in operation and maintenance and new generation capacity, which combined with poor governance, resulting in a large penalty on the economy, low quality of service, high system losses and inadequate cost recovery. At present the sector is unable to supply the reliable electricity needed by industry, commerce and households with more and more consumers turning to back-up generation at much higher costs. The fiscal impact of the sector is massive, putting macroeconomic stability at risk. Government transfers to cover the cash shortfall of the electricity company—largely due to highly subsidized domestic price of oil on which the electricity sector depends for generation—are estimated to reach 5.0 percent of GDP in 2008, a steep rise compared with earlier in the decade. 12. The sharp increase in international oil price during most of 2008 has highlighted Lebanon’s fiscal vulnerability making sector reform critical. Although the price of oil declined toward the end of 2008, its volatility highlighted the vulnerability of Lebanon’s fiscal position to factors outside control of the budget process. While there are no quick fixes, measures for reducing the sector’s burden on the government budget and, hence, financing requirements, are critical over the period ahead. The key sector reforms are included in the Government’s existing medium-term economic program presented at a donor conference in January 20075
and further developed in the World Bank’s recent Energy Sector Public Expenditure Review (PER). During the summer of 2008, the need to raise tariffs was frequently touched upon by the new Minister of Water and Energy and received prominent coverage in the Lebanese media. The Government’s 2009 budget plan envisages reducing the transfers to the electricity company through introduction of a set of cost recovery measures, including through changes in the tariff structure.
13. The burden imposed by weak public electricity service has not been shared equally. This chapter assesses how different categories of households, specifically the poor, are affected by weak electricity service, what the potential impact of better cost recovery measures would be on different household welfare categories and what sequence of policy options present opportunities for addressing social concerns given supply constraints on the one side, and household consumption behavior on the other.
5 The program was introduced in the months following the devastating summer-2006 hostilities with Israel. It combines fiscal measures needed for stabilization with structural measures needed for higher growth. Participants in Paris III pledged US$7.6 billion to support the implementation of the program. This includes support from the World Bank through policy based operations with major emphasis on key electricity sector reforms. So far, the progress with implementation of reforms has been slow due to long-lasting political impasse and legislative inaction. Over the period ahead, the improved macroeconomic and political environment since May-2008 Doha agreement, recent reversal in the trend of international prices, and Lebanon’s relative insulation from the first-round direct effect of the global financial turmoil, creates a more conducive environment for re-invigorating medium-term economic reform program, as highlighted by the policy reforms that now underpins the Government’s 2009 budget.

5
II. KEY SECTOR ISSUES – A SUMMARY OVERVIEW 14. While access to electricity is good, performance of the electricity sector has deteriorated at an accelerating pace over the past decade. Lebanon has a high level of electrification, with near universal network coverage at 99 percent, but supply remains a serious problem, with heavy costs borne by households. No new power generation capacity has been added since the two combined cycle plants were installed in the 1990s (with the rest dating back to the 1970s and 1980s). The two plants were designed to operate on natural gas, but in the absence of access to this fuel, Lebanon relies on expensive gasoil for power generation. To reduce losses major investments are also required in the medium- and low-voltage transmission and distribution system. 15. Electricité de Liban’s considerable investment needs are widely acknowledged, but reform inertia has kept investors away. Lack of political will with consequent prolonged inaction on reform and restructuring, poorly designed policies (such as those relating to fuel sourcing decisions), and insufficient managerial capacity6 and technical staff7
at Electricité du Liban (EdL), have left its investment needs and regular maintenance underfunded. Technical losses are estimated at 15 percent, and a further estimated 23 percent is consumed through illegal connections. EdL only bills for about 60 percent of its production, and collects about 90 percent of annual billings. Until credible reforms are launched, it is difficult to envision Lebanon attracting significant investments in EdL.
16. The electricity sector acts as a huge fiscal drain on the Government budget, crowding out key social and infrastructure expenditures. The Government’s tariff policy, coupled with significant operational inefficiencies in the sector, has translated into increasing reliance on budgetary transfers.8 At present, a large portion of these transfers can be attributed to a “tariff freeze” in place since 1996, which caps EdL’s tariff at a level derived from an average oil price of US$25/barrel—far below cost recovery levels. Transfers are also explained by other factors that contribute to low revenue (such as inefficient tariff structure, low billings), and very high production costs (such as high O&M cost of power plants due to insufficient regular maintenance and high technical losses). Against a background of sustained high oil prices beginning in 2003, the budgetary transfers to EdL increased dramatically (see Figure 1). When oil prices topped nearly US$150/barrel by August 2008, they were estimated to reach highs of 14.8 percent of total budgetary spending and 5.0 percent of GDP in 2008.9 While the subsequent steep drop in the oil price in late 2008 provided some relief in the near term, the size of the budgetary transfers to EdL clearly limit fiscal space for key public expenditures,10
6 EdL’s legal status as a state owned enterprise does not provide incentives for performance, enabling political interference in day-to-day operations, and inhibiting its ability to collect for consumed electricity. Indirect evidence of these problems comes from the difficulties in obtaining reliable information on the sector, such as financial statements, billing and collection data, and technical performance indicators (See Lebanon Energy Sector PER, World Bank, 2007) 7 Hiring of staff at EdL was frozen in the mid-1990s, leading to a dearth of personnel to manage operations and address financial and administrative issues. The average employee age is about 58 and EdL loses staff each year to retirement. As a result, there has been no renewal of skills to EdL. Problems include lack of planning, maintenance and care of assets, and insufficient capacity to handle billing and collection. (See Lebanon Energy Sector PER, World Bank, 2007) 8 The transfers to EdL cover both fuel payments and debt service. There are also accounts payable to EdL which have not been settled, for instance, Value Added Tax. 9 Under the fixed tariff, the eventual cost to the budget is obviously heavily dependent on the oil price fluctuations over the course of the entire year. The budgetary transfers to the EdL reflect the actual purchase price of oil with a six months lag due to current practice of purchasing oil through letters of credit. 10 Primary expenditures, excluding transfers to EdL, increased by 4.3 percent per year on average between 2003 and 2008 while transfers to EdL increased at an average of 38.3 percent yearly over the same period.
including what could have been spent on social protection through targeted assistance if the tariff reflected fuel cost, consumers had been effectively billed, and

6
service had been stronger. The transfers also push up the fiscal deficit, putting macroeconomic stability at risk given Lebanon’s record high public debt ratio (162 percent of GDP in 2008). Finally, they expose Lebanon’s fiscal position to factors outside the control of the budget process.
Figure 2.1. Transfers to EdL have ballooned Deficit and Tranfers to EdL
0%
2%
4%
6%
8%
10%
12%
14%
2003 2004 2005 2006 2007 2008
Defic
it &
Tran
sfer
s (%
to G
DP)
0%
8%
16%
24%
32%
40%
48%
56%
Ttra
nsfe
rs a
s Sh
are
of D
efic
it
Deficit to GDP o/w Transfers to EdL (% to GDP)Transfers to EdL (% to deficit)
Source: Official data and World Bank staff estimates
17. The real electricity tariff for consumers has declined, while growing reliance on expensive back-up generation has pushed up total household electricity expenditures. Since 1996, cumulative inflation reached 44 percent in Lebanon (showing acceleration since late 2007) driven by increases in international prices particularly for oil. However, as noted above, since the electricity tariff has not been raised over this period, the real price of electricity for the average consumer has seen a gradual decline (see Figure 2.2 and Box 2.1.). The impact of the “tariff freeze’ was somewhat counter-balanced by the introduction of a monthly rehabilitation fee of LBP 5,000 (equivalent to US$3.3) on every bill for low voltage consumers in 1996.11 This led to an increase in the effective kWh price for low voltage consumers (i.e. households and small businesses)12
low-income consumers than large-income consumers (see Box 2.1.). Nevertheless, while the cost of
by 14 percent on average, with a socially regressive effect, as the percentage increase was higher for
11 Originally, a temporary measure added to electricity charges for a seven year period, but maintained thereafter. 12 Of electricity consumed, private low-voltage consumers represent more than half of the demand in Lebanon (according to EdL statistics, Chubu Consulting report and Bank PER estimates). This high proportion reflects the importance of small service businesses in the country and is due to the aggregation in this category of both residential and small business consumption.
Box 2.1. Real vs. effective electricity price The estimated real price of electricity is inflation-adjusted and reflects year-on-year changes in the average price per kWh. It is based on (i) estimated usage by a median household consuming between 200 and 400 kWh per month, using 15 amperes; and (ii) the effective price per unit. The effective price is the household electricity bill divided by kWh consumed. This is in contrast to the quoted price, which is the tariff charge (only a portion of the bill) divided by kWh consumed. From the household perspective, the effective tariff is more important than the quoted tariff. For instance, in a restaurant, it is the total final bill that affects the diner’s pocketbook, not how the bill breaks down according to menu price, tax, service, tips, etc.
7
electricity provided by EdL has remained low for consumers, the burden resulting from EdL’s service decline (high and increasing frequency of supply interruptions) has risen, due to reliance on back up generation, damaged appliances resulting from power surges and opportunity costs to households. Figure 2.2. EdL electricity production has risen significantly while the real kWh cost to households
has fallen13
50
75
100
125
150
96 97 98 99 00 01 02 03 04 05 06 07 08
Year
Inde
xed:
199
6 =
100
Real cost of kWh (avg. household)
Production (mill kWh)
Sources: EdL and World Bank staff estimates. 18. At least US$330 million was spent by Lebanese households last year on private electricity generation—almost twice the amount that households spend on EdL electricity. This total14 represents the financial cost to residential consumers of inadequate service delivery. The large amount spent on this imperfect substitute not only results in additional expenditure outlays by these households (indicating ability/willingness to pay for reliable service), but it also represents potentially foregone revenue for EdL.15 If 24 hours of service were provided, it can be assumed that far fewer households would continue to subscribe to private generators for backup with much of the US$330 million16
III. HOUSEHOLD ENERGY DEMAND AND CONSUMPTION
currently going to the informal sector providers being redirected to EdL.
19. Household reliance on electricity is significant. The majority of households (75 percent) rely on electricity for water heating, which is energy intensive and can account for a large share of a household’s electricity consumption. The SIA survey found that almost half of households (48 percent) use electricity to heat their houses and 42 percent own air conditioners. This picture reflects the relative affordability of electricity, which is discussed in sections IV and V below.
13 This graph does not provide proof of correlation between average unit electricity costs and total electricity generation. The simultaneous increase in generation and decline in real unit costs since 2001 does, however, merit contemplation. 14 Based on WB staff calculations using SIA survey data. 15 It is qualified as ‘potential’ forgone revenue for two reasons: i) it is unlikely that all households would completely discontinue private generator use and ii) it applies only to an EdL that has achieved cost recovery; at present the company loses money on every kWh sold, so that the less it supplies the lower its losses. 16 Calculations suggesting at least US$330 million private generation expenditures are based on findings that show that 58 percent of 906,016 Lebanese households use private generation, paying an average of US$53 per month, or a total of US$636 per annum. Thus; 0.579 x 906,016 x 53 x 12 = 333,760, 856
8
Figure 2.3. Electricity reliance is highest for water heating, regardless of quintile
15%
25% 23%30%
20%
75% 77%71%
76%70%
40%
50% 48%51%
24%30%
62%
51%47%
41%
0%
10%
20%
30%
40%
50%
60%
70%
80%
1 2 3 4 5Quintiles
Cooking Water Heating House Heating Cooling (ACs)
Source: World Bank SIA survey (2008). 20. Use of solar energy is marginal. Solar energy for water heating is entering the Lebanese market, and now is used by 3 percent of households. However, it is primarily the wealthy who are taking advantage of the new technology—almost half of all households who reported using solar energy to heat water belong in the top quintile.17
The remaining households use gas, kerosene/gasoil, and wood/coal energy sources, with many using more than one source.
21. Electricity supply is constrained, leading to heavy rationing. Lebanon has the highest rate of daily blackouts in the MENA region.18
Based on the SIA survey, average electricity supplied by EdL to households is about 14 hours per day (so that, on average, there are 10 hours of daily power outage). However, as discussed below, the amount of electricity supplied to regions (as well as within regions) varies widely. Service interruptions are daily, but not always at the same time or predictable. In one half to one third of cases, depending on the region, households reported that the timing of the blackout period varied.
22. Rationing is characterized by inequity. While the Bekaa Valley and Nabatieh must do without public electricity for 12-13 hours every day, Beirut is subject to 3 hours of daily blackouts (see Figure 2.4.). EdL exerts some discretion (within the limits of regional generation capacity) over how rationing is distributed by region, utilizing a computerized pre-defined schedule for rolling blackouts. However, although there may be good reasons and strong political support for keeping rationing in the capital to a minimum, it represents a clear case of inequitable distribution.19
In the other regions, many households must choose between going without electricity for long daily periods, and spending significant amounts on private generation.
17 Solar water heating is both cheaper—in the medium term—than electricity, and is not prone to interruptions from blackouts. 18 See Lebanon Electricity PER, World Bank, 2007. 19 Beirut households have higher welfare levels—median household consumption in Beirut was 37.8 percent more than the average for Lebanon and extreme poverty in Beirut was less than 1 percent compared with an 8 percent average for the country as a whole based on 2004 HH survey.
9
23. Living without electricity is a social and economic burden. One of the feedbacks from this study is how households enduring regular blackouts face a variety of inconveniences and negative economic and social impacts. They are unable, during these periods, to heat and cool the house or use the elevator, television or lighting for other essential needs (as in the case of families with school-age children, for studying). They cannot store food in the refrigerator because of spoilage (and hence must buy perishable commodities on a daily basis). Several survey respondents described the situation as depressing, noting that the summer heat and winter cold exacerbate the situation. Some households forgo paying for a generator because they don’t want to cut into higher priority items (such as children’s essential expenditures).
Figure 2.4. Beirut households experience the shortest daily blackout period in the country
3
10 1013
912
0
4
8
12
16
20
24
Beirut Mount-Lebanon
North Bekaa South Nabatieh
hour
s
blackoutpower
Source: World Bank SIA survey (2008). 24. As a result of electricity rationing the majority of households rely heavily on private generators during blackouts. It is estimated that one third of all electricity generated in Lebanon, comes from private generators.20 Fifty eight percent of households use some form of self generation. This is 20 percent more than in 2004, when 36 percent used generators.21 More than half of generator users began using them since 2000,22
further evidence of deteriorating EdL service over the past decade.
25. Private generation is a booming business. The majority (70 percent) of households using back-up generation have a subscription with a private generator business.23
Although not legally recognized, private generator businesses, which provide electricity through a small network, are tolerated in most areas in the country. The remaining households own their own generator (22 percent), use a generator owned by the building (7 percent) or use a community-run generator (about 1 percent).
26. As expected, the share of households that use private generators is correlated with number of hours of electricity available per day. Because administrative Beirut24
20 See Lebanon Electricity PER, World Bank, 2007. This covers commerce and industry as well as households. 21 2004 figures are based on 2004 Household Living Conditions survey of the Central Statistics Administration. 22 SIA survey (2008). 23 In Beirut, running a small generator from one’s home, a common practice during the 1975-90 civil war, is no longer allowed. 24 The population of administrative Beirut was estimated by MPS to be 389,601 in 2004. Households in Greater Beirut including both North and South Suburbs are located in the Mount Lebanon region.
is provided with 21 hours per day by EdL (far more than other regions), a relatively small share of Beirut households use generators (see

10
Figure 2.5.). Beirut only became subject to rationing at the beginning of 2007. When households that did not use generators were asked why, a much higher share in the regions—27 percent compared with 10 percent in Beirut—reported it was because they couldn’t afford it.
Figure 2.5. Use of generators is inversely correlated with public electricity rationing
4
8
12
16
20
24
0 20 40 60 80 100
Share of households using generator (%)
Num
ber o
f hou
rs o
f EdL
ser
vice
- da
ily
Beirut
Bekaa
SouthMount Lebanon
Nabatieh
North
Source: World Bank SIA survey 2008.
27. Private generators charge a flat fee based on a maximum ampere level, not kWh usage. In contrast to EdL, households subscribing to private generators are charged a fixed monthly fee that varies depending on the ampere level at which they subscribe25
(see Box 2.2.) and on gasoline used. The vast majority of households subscribe at 5 amperes, which enables them to keep the lights, television and refrigerator on. If a consumer does not use electricity during the blackout, the private generator gains by saving on fuel costs.
28. Privately provided electricity is more expensive than electricity from EdL at present tariff. As noted above, because privately generated electricity is not sold by quantity consumed, but by ampere level, precise cost comparisons with EdL charges on a kWh basis are difficult—households do not use the maximum amperes for the entire period the generator is operating. However, even if they did so, electricity purchased from private generators is at least 8 times as expensive. During the survey period (April-May 2008) the average bill from a private generator was US$47, compared with US$26 from the EdL. Yet although the average expenditures for private generation were almost double those going to EdL, private generators provided just half the number of hours per day (7.2 vs. 14.3) and less than half as many amperes on average (6.5 vs. 14.5)26
as EdL.
29. Affordability is only one of many concerns with respect to reliance on private generators. Among the 42 percent of households that do not use private generation, the main reason was economic—23.7 percent mentioned the high cost of living and bad economic conditions; 9.6 percent mentioned the high subscription fees and bad service, followed by lack of access, since no private generators were
25 The ampere level, a capacity indicator, places a limit on the amount of electricity a household can consume at a given time. 26 Actual amperes are almost always provided in increments of 5, although some cases of 2.5 amperes have been reported by private generator operators.
11
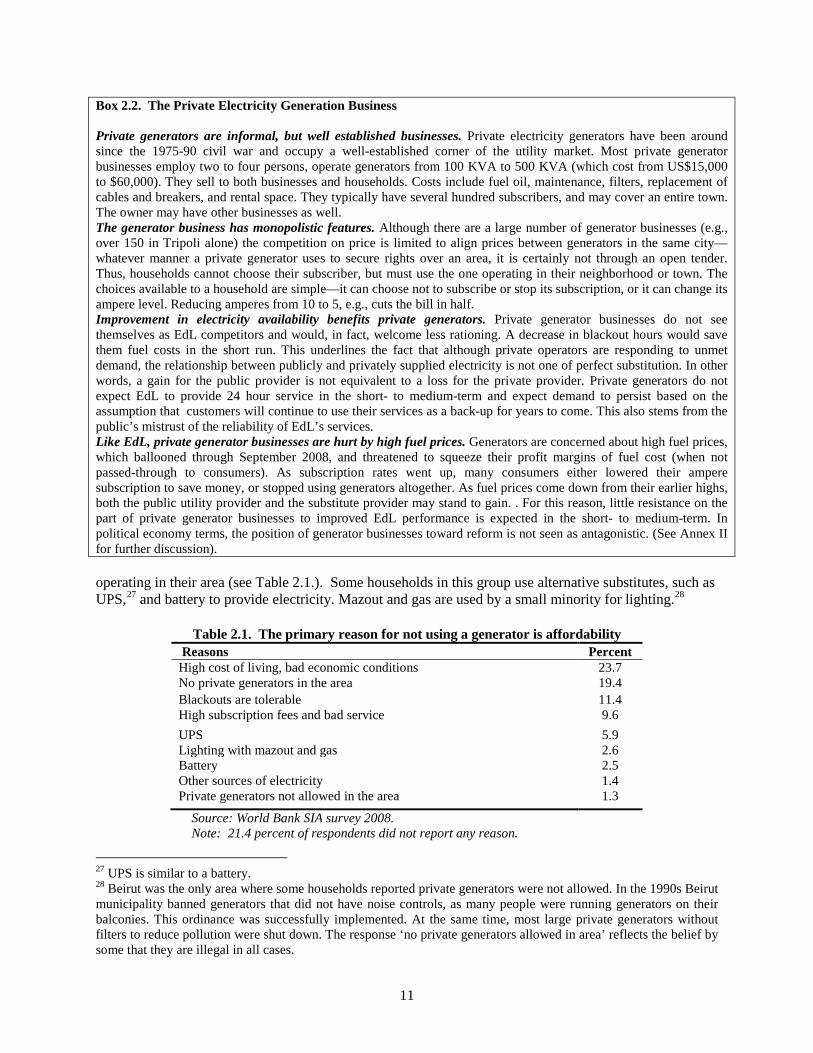
operating in their area (see Table 2.1.). Some households in this group use alternative substitutes, such as UPS,27 and battery to provide electricity. Mazout and gas are used by a small minority for lighting.28
Reasons
Table 2.1. The primary reason for not using a generator is affordability Percent
High cost of living, bad economic conditions 23.7 No private generators in the area 19.4 Blackouts are tolerable 11.4 High subscription fees and bad service 9.6 UPS 5.9 Lighting with mazout and gas 2.6 Battery 2.5 Other sources of electricity 1.4 Private generators not allowed in the area 1.3
Source: World Bank SIA survey 2008. Note: 21.4 percent of respondents did not report any reason.
27 UPS is similar to a battery. 28 Beirut was the only area where some households reported private generators were not allowed. In the 1990s Beirut municipality banned generators that did not have noise controls, as many people were running generators on their balconies. This ordinance was successfully implemented. At the same time, most large private generators without filters to reduce pollution were shut down. The response ‘no private generators allowed in area’ reflects the belief by some that they are illegal in all cases.
Box 2.2. The Private Electricity Generation Business Private generators are informal, but well established businesses. Private electricity generators have been around since the 1975-90 civil war and occupy a well-established corner of the utility market. Most private generator businesses employ two to four persons, operate generators from 100 KVA to 500 KVA (which cost from US$15,000 to $60,000). They sell to both businesses and households. Costs include fuel oil, maintenance, filters, replacement of cables and breakers, and rental space. They typically have several hundred subscribers, and may cover an entire town. The owner may have other businesses as well. The generator business has monopolistic features. Although there are a large number of generator businesses (e.g., over 150 in Tripoli alone) the competition on price is limited to align prices between generators in the same city—whatever manner a private generator uses to secure rights over an area, it is certainly not through an open tender. Thus, households cannot choose their subscriber, but must use the one operating in their neighborhood or town. The choices available to a household are simple—it can choose not to subscribe or stop its subscription, or it can change its ampere level. Reducing amperes from 10 to 5, e.g., cuts the bill in half. Improvement in electricity availability benefits private generators. Private generator businesses do not see themselves as EdL competitors and would, in fact, welcome less rationing. A decrease in blackout hours would save them fuel costs in the short run. This underlines the fact that although private operators are responding to unmet demand, the relationship between publicly and privately supplied electricity is not one of perfect substitution. In other words, a gain for the public provider is not equivalent to a loss for the private provider. Private generators do not expect EdL to provide 24 hour service in the short- to medium-term and expect demand to persist based on the assumption that customers will continue to use their services as a back-up for years to come. This also stems from the public’s mistrust of the reliability of EdL’s services. Like EdL, private generator businesses are hurt by high fuel prices. Generators are concerned about high fuel prices, which ballooned through September 2008, and threatened to squeeze their profit margins of fuel cost (when not passed-through to consumers). As subscription rates went up, many consumers either lowered their ampere subscription to save money, or stopped using generators altogether. As fuel prices come down from their earlier highs, both the public utility provider and the substitute provider may stand to gain. . For this reason, little resistance on the part of private generator businesses to improved EdL performance is expected in the short- to medium-term. In political economy terms, the position of generator businesses toward reform is not seen as antagonistic. (See Annex II for further discussion).
12
30. Low income groups are least able to afford private generators. As noted above, the costs of privately generated electricity is high, preventing many low income households from accessing this imperfect back-up source. Figure 2.6. shows that use of private generators is positively correlated with household welfare. Still, 42 percent of the lowest quintile, compared with 65 percent of the top quintile, use generators, a fairly significant share given the high subscription costs.
Figure 2.6. Use of generators is correlated with income
20
30
40
50
60
70
80
90
100
1 2 3 4 5
quintile
shar
e us
ing
gene
rato
r (%
)
Source: World Bank SIA survey 2008.
31. Privately generated electricity is provided during the daily blackout periods, but may not cover the entire blackout. Most generator owners and households interviewed reported that generators do not run the entire period of the blackout. For example, households in areas which receive 16 hours of public electricity per day, and choose to subscribe to a private generator, will typically receive less than 8 hours of generator service. This may or may not be made clear in the contract, which is usually verbal. Many private generators save on costs by not providing service after midnight, with some shutting off as early as 10pm or 11pm. 32. Lack of oversight of private generation business carries costs and imposes a burden on households. It is noteworthy that the private generation businesses, on which so many households and a large share of the economy depend, operate in an unregulated grey zone (see Box 2). They do not pay taxes to the state (although they may have entered into informal contractual agreements with local municipalities). As noted earlier, despite the large role they play in providing a basic service, private generators can only be depended upon by a certain share of the households and for very basic appliance usage. Because of what can be described as quasi-monopolistic nature, consumers are unable to choose between generator companies, and companies are price setters.
IV. PUBLIC ELECTRICITY TARIFFS 33. EdL applies an inverted block tariff to residential and small commercial consumers. The inverted block tariff (see Table 2.2.) is commonly used because of its perceived progressivity and cross-subsidy feature, but is often ineffective (depending on how it is administered) in achieving these
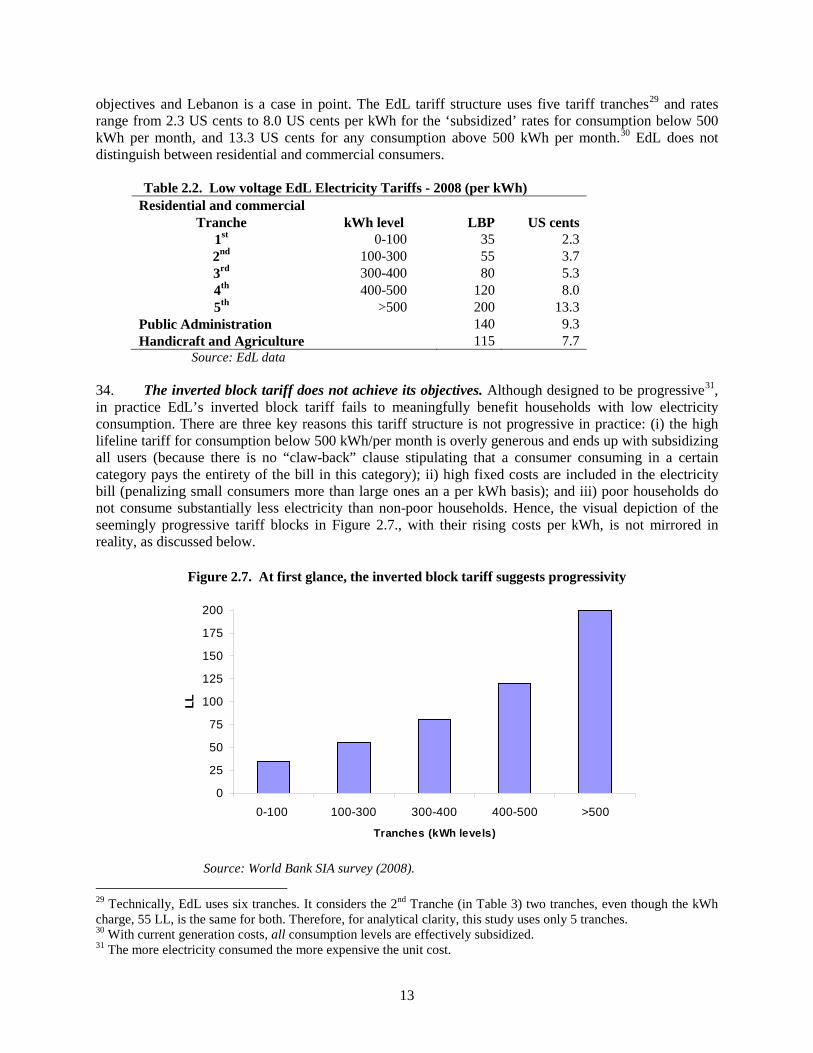
13
objectives and Lebanon is a case in point. The EdL tariff structure uses five tariff tranches29 and rates range from 2.3 US cents to 8.0 US cents per kWh for the ‘subsidized’ rates for consumption below 500 kWh per month, and 13.3 US cents for any consumption above 500 kWh per month.30
EdL does not distinguish between residential and commercial consumers.
Table 2.2. Low voltage EdL Electricity Tariffs - 2008 (per kWh) Residential and commercial
Tranche kWh level LBP US cents 1st 0-100 35 2.3 2nd 100-300 55 3.7 3rd 300-400 80 5.3 4th 400-500 120 8.0 5th >500 200 13.3
Public Administration 140 9.3 Handicraft and Agriculture 115 7.7
Source: EdL data 34. The inverted block tariff does not achieve its objectives. Although designed to be progressive31
Figure 2.7. At first glance, the inverted block tariff suggests progressivity
, in practice EdL’s inverted block tariff fails to meaningfully benefit households with low electricity consumption. There are three key reasons this tariff structure is not progressive in practice: (i) the high lifeline tariff for consumption below 500 kWh/per month is overly generous and ends up with subsidizing all users (because there is no “claw-back” clause stipulating that a consumer consuming in a certain category pays the entirety of the bill in this category); ii) high fixed costs are included in the electricity bill (penalizing small consumers more than large ones an a per kWh basis); and iii) poor households do not consume substantially less electricity than non-poor households. Hence, the visual depiction of the seemingly progressive tariff blocks in Figure 2.7., with their rising costs per kWh, is not mirrored in reality, as discussed below.
0
25
50
75
100
125
150
175
200
0-100 100-300 300-400 400-500 >500
Tranches (kWh levels)
LL
Source: World Bank SIA survey (2008).
29 Technically, EdL uses six tranches. It considers the 2nd Tranche (in Table 3) two tranches, even though the kWh charge, 55 LL, is the same for both. Therefore, for analytical clarity, this study uses only 5 tranches. 30 With current generation costs, all consumption levels are effectively subsidized. 31 The more electricity consumed the more expensive the unit cost.
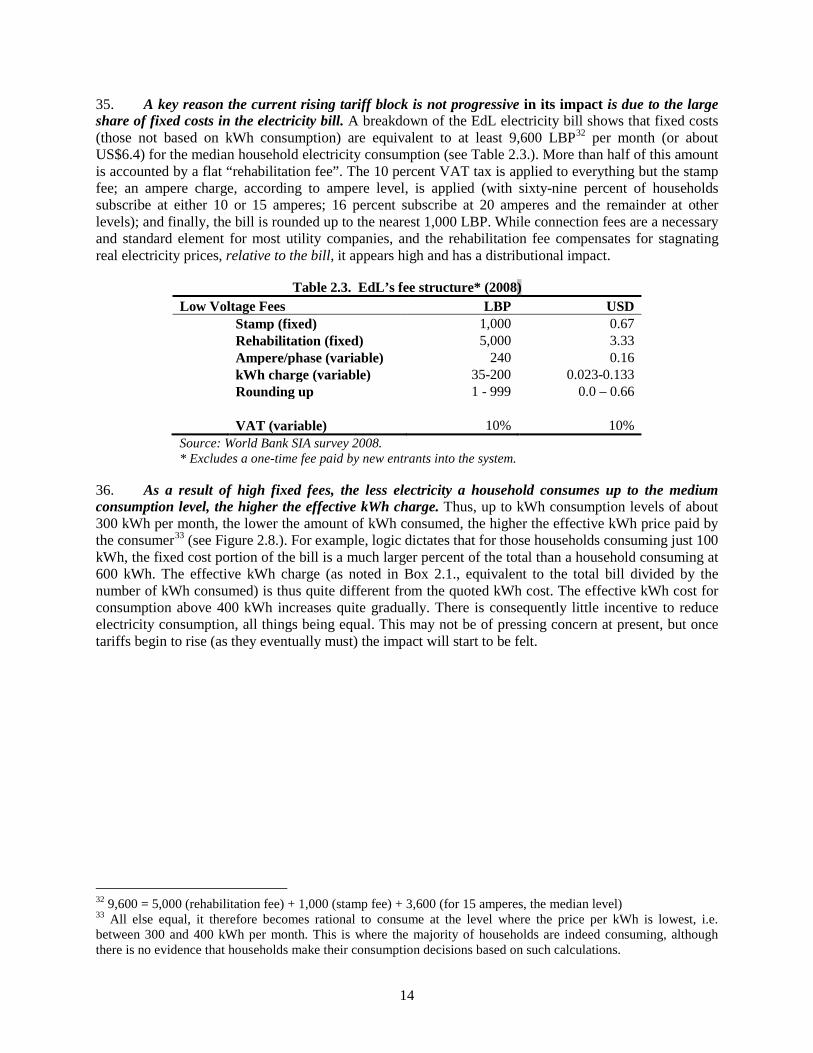
14
35. A key reason the current rising tariff block is not progressive in its impact is due to the large share of fixed costs in the electricity bill. A breakdown of the EdL electricity bill shows that fixed costs (those not based on kWh consumption) are equivalent to at least 9,600 LBP32
per month (or about US$6.4) for the median household electricity consumption (see Table 2.3.). More than half of this amount is accounted by a flat “rehabilitation fee”. The 10 percent VAT tax is applied to everything but the stamp fee; an ampere charge, according to ampere level, is applied (with sixty-nine percent of households subscribe at either 10 or 15 amperes; 16 percent subscribe at 20 amperes and the remainder at other levels); and finally, the bill is rounded up to the nearest 1,000 LBP. While connection fees are a necessary and standard element for most utility companies, and the rehabilitation fee compensates for stagnating real electricity prices, relative to the bill, it appears high and has a distributional impact.
Table 2.3. EdL’s fee structure* (2008) Low Voltage Fees LBP USD Stamp (fixed) 1,000 0.67 Rehabilitation (fixed) 5,000 3.33 Ampere/phase (variable) 240 0.16 kWh charge (variable) 35-200 0.023-0.133 Rounding up 1 - 999 0.0 – 0.66 VAT (variable) 10% 10% Source: World Bank SIA survey 2008. * Excludes a one-time fee paid by new entrants into the system.
36. As a result of high fixed fees, the less electricity a household consumes up to the medium consumption level, the higher the effective kWh charge. Thus, up to kWh consumption levels of about 300 kWh per month, the lower the amount of kWh consumed, the higher the effective kWh price paid by the consumer33
(see Figure 2.8.). For example, logic dictates that for those households consuming just 100 kWh, the fixed cost portion of the bill is a much larger percent of the total than a household consuming at 600 kWh. The effective kWh charge (as noted in Box 2.1., equivalent to the total bill divided by the number of kWh consumed) is thus quite different from the quoted kWh cost. The effective kWh cost for consumption above 400 kWh increases quite gradually. There is consequently little incentive to reduce electricity consumption, all things being equal. This may not be of pressing concern at present, but once tariffs begin to rise (as they eventually must) the impact will start to be felt.
32 9,600 = 5,000 (rehabilitation fee) + 1,000 (stamp fee) + 3,600 (for 15 amperes, the median level) 33 All else equal, it therefore becomes rational to consume at the level where the price per kWh is lowest, i.e. between 300 and 400 kWh per month. This is where the majority of households are indeed consuming, although there is no evidence that households make their consumption decisions based on such calculations.

15
Figure 2.8. When comparing effective versus quoted electricity charges, regressivity (for consumption under 300 kWh) becomes clear
0.0
2.0
4.0
6.0
8.0
10.0
12.0
14.0
16.0
18.0
50 100 150 200 250 300 350 400 450 500 550 600 650 700 750 800 850 900 950 1000
kWh/month
cent
s/kW
h
Effective kWh chargeQuoted kWh charge
Source: World Bank SIA survey (2008).
37. Low welfare households in Lebanon consume electricity at levels similar to the middle class. As seen in Table 2.4, households in the bottom quintile consume on average from 295 to 488 from peak to off peak, while 3rd quintile households consume from 338 to 540. This is in part because the effective tariff for the average households is low and has not changed in over a decade. The implication, as noted above, is that the pricing structure creates little incentive to constrain electricity consumption. Nonetheless, few households think of their electricity bills as low, given the huge inconvenience associated with the service.
Table 2.4. Average kWh and ampere levels (by quintile) Lowest 2nd 3rd 4th Highest Peak (kWh/month) 488 532 540 585 755 Off-peak (kWh/month) 295 317 338 419 489 Amperes 12.9 13.4 14.0 15.2 16.8 Source: World Bank SIA survey 2008.
38. During peak months, many poor households consume above 300 kWh. Although during off-peak months 37 percent of the bottom quintile consumes over 300 kWh per month, during peak months, three quarters of this group does, and about one quarter consume more than 500 kWh (Figure 2.9.). While the large fluctuations are found for every quintile, it is noteworthy how elastic—in response to seasonal changes—demand for electricity is among the poorest consumers. It suggests that for many households the cost of electricity does not inhibit them from using electricity-intensive appliances.
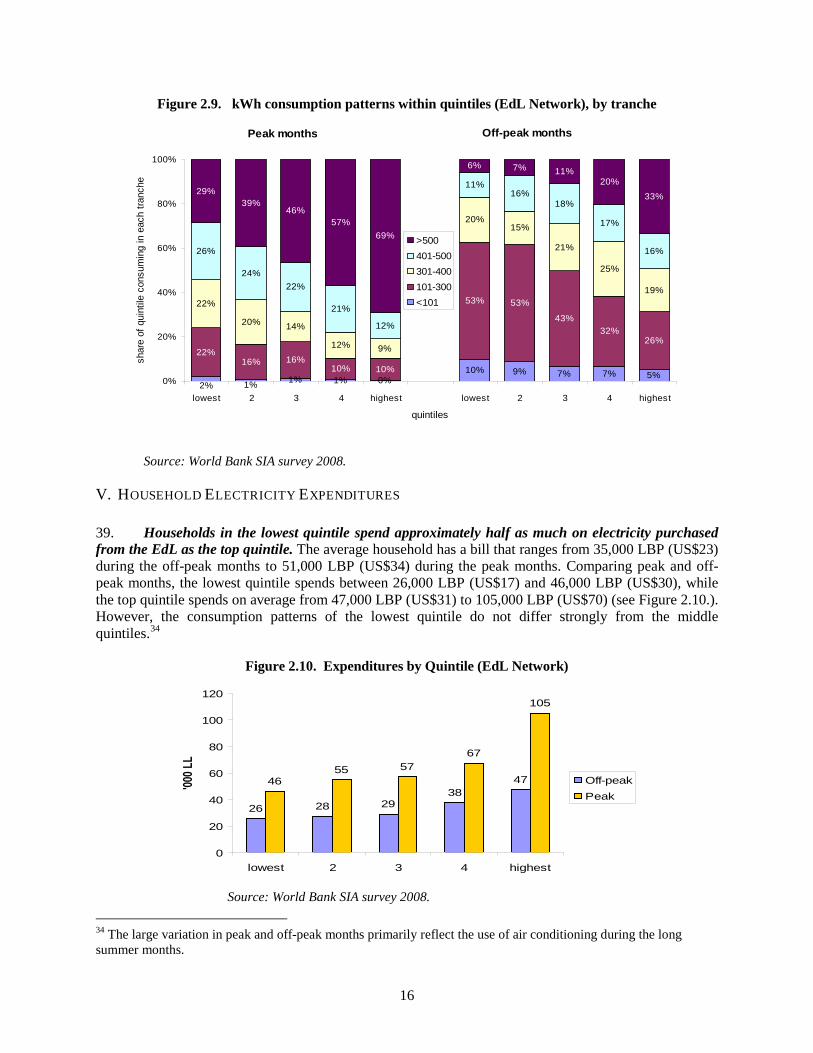
16
Figure 2.9. kWh consumption patterns within quintiles (EdL Network), by tranche
1% 1% 0%10% 9% 7% 7% 5%
22%16% 16%
10% 10%
53% 53%
43%32%
26%
22%
20% 14%
12% 9%
20%15%
21%
25%
19%
26%
24%22%
21%
12%
11%16%
18%
17%
16%
29%39%
46%57%
69%
6% 7% 11%20%
33%
2% 1%0%
20%
40%
60%
80%
100%
lowest 2 3 4 highest lowest 2 3 4 highest
quintiles
shar
e of
qui
ntile
con
sum
ing
in e
ach
tranc
he
>500401-500301-400101-300<101
Peak months Off-peak months
Source: World Bank SIA survey 2008.
V. HOUSEHOLD ELECTRICITY EXPENDITURES 39. Households in the lowest quintile spend approximately half as much on electricity purchased from the EdL as the top quintile. The average household has a bill that ranges from 35,000 LBP (US$23) during the off-peak months to 51,000 LBP (US$34) during the peak months. Comparing peak and off-peak months, the lowest quintile spends between 26,000 LBP (US$17) and 46,000 LBP (US$30), while the top quintile spends on average from 47,000 LBP (US$31) to 105,000 LBP (US$70) (see Figure 2.10.). However, the consumption patterns of the lowest quintile do not differ strongly from the middle quintiles.34
Figure 2.10. Expenditures by Quintile (EdL Network)
26 28 2938
474655 57
67
105
0
20
40
60
80
100
120
lowest 2 3 4 highest
'000 L
L
Off-peakPeak
Source: World Bank SIA survey 2008.
34 The large variation in peak and off-peak months primarily reflect the use of air conditioning during the long summer months.
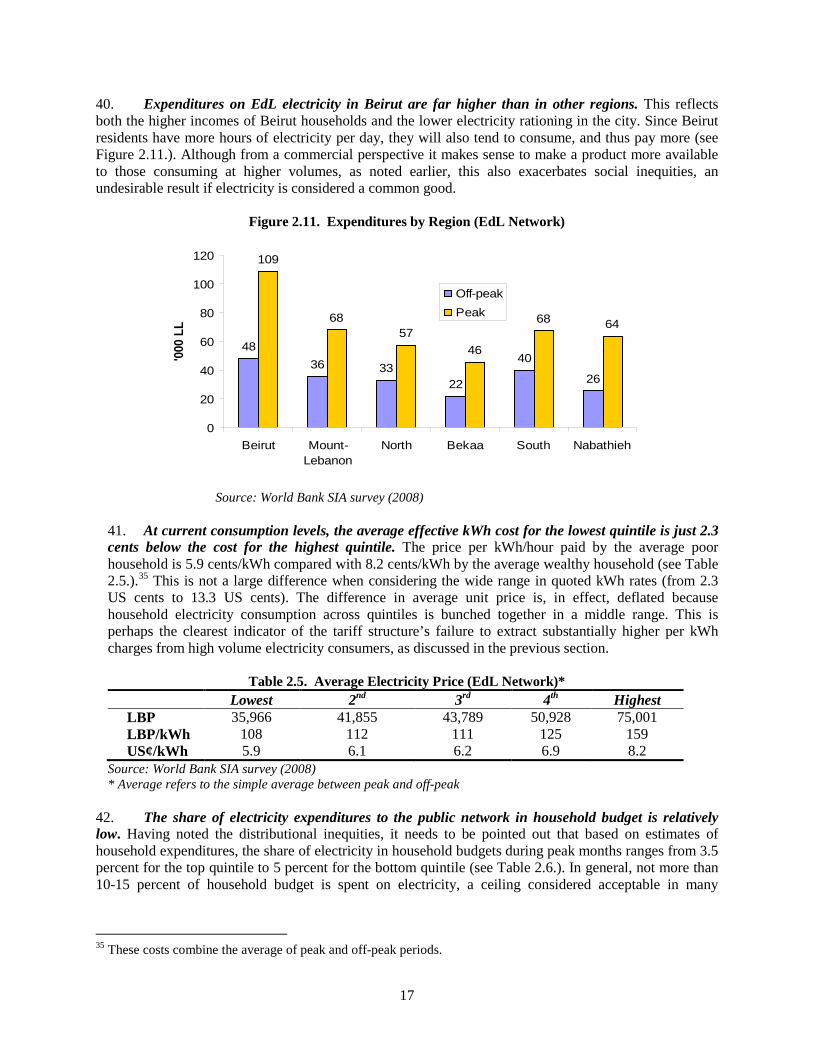
17
40. Expenditures on EdL electricity in Beirut are far higher than in other regions. This reflects both the higher incomes of Beirut households and the lower electricity rationing in the city. Since Beirut residents have more hours of electricity per day, they will also tend to consume, and thus pay more (see Figure 2.11.). Although from a commercial perspective it makes sense to make a product more available to those consuming at higher volumes, as noted earlier, this also exacerbates social inequities, an undesirable result if electricity is considered a common good.
Figure 2.11. Expenditures by Region (EdL Network)
4836 33
22
40
26
109
6857
46
68 64
0
20
40
60
80
100
120
Beirut Mount-Lebanon
North Bekaa South Nabathieh
'000
LL
Off-peakPeak
Source: World Bank SIA survey (2008)
41. At current consumption levels, the average effective kWh cost for the lowest quintile is just 2.3 cents below the cost for the highest quintile. The price per kWh/hour paid by the average poor household is 5.9 cents/kWh compared with 8.2 cents/kWh by the average wealthy household (see Table 2.5.).35
This is not a large difference when considering the wide range in quoted kWh rates (from 2.3 US cents to 13.3 US cents). The difference in average unit price is, in effect, deflated because household electricity consumption across quintiles is bunched together in a middle range. This is perhaps the clearest indicator of the tariff structure’s failure to extract substantially higher per kWh charges from high volume electricity consumers, as discussed in the previous section.
Table 2.5. Average Electricity Price (EdL Network)* Lowest 2nd 3rd 4th Highest LBP 35,966 41,855 43,789 50,928 75,001 LBP/kWh 108 112 111 125 159 US¢/kWh 5.9 6.1 6.2 6.9 8.2
Source: World Bank SIA survey (2008) * Average refers to the simple average between peak and off-peak
42. The share of electricity expenditures to the public network in household budget is relatively low. Having noted the distributional inequities, it needs to be pointed out that based on estimates of household expenditures, the share of electricity in household budgets during peak months ranges from 3.5 percent for the top quintile to 5 percent for the bottom quintile (see Table 2.6.). In general, not more than 10-15 percent of household budget is spent on electricity, a ceiling considered acceptable in many
35 These costs combine the average of peak and off-peak periods.

18
countries.36 In Lebanon, even the lowest quintile comes in significantly below that level. And when electricity expenditures on private generation are taken into account, the share of expenditures still does not surpass 7.3 percent combined peak and off peak for the lowest quintile37
(see Table 2.6.). This highlights the fact that electricity in Lebanon is, at present, not a cost issue but a reliability and availability issue. It also suggests there is considerable room for raising tariffs, but first, consumers would need to see credible and sustained improvements in service, as the SIA survey makes clear (see Box 2.3). Second, from the discussion on tariff structure impacts above and in Section VII, it follows that as tariffs increase, these impacts will begin to matter.
Table 2.6. Share of public (EdL) electricity expenditures in total household expenditures Percentages Expenditures Quintiles Lowest 2nd 3rd 4th Highest Public electricity (EDL) Peak 5.0 4.3 3.7 4.0 3.5
Off peak 2.8 2.2 1.9 2.3 1.7 Combined private and public
Peak 7.3 6.9 6.6 7.0 5.6
Off peak 4.7 4.3 4.2 4.5 3.3 Source: World Bank SIA survey 2008.
43. A large share of the population believes their electricity bill is neither fair nor accurate. Based on in-depth interviews, the billing system and billing procedures are perceived to be inaccurate and many consumers are suspicious of their bills (see Table 2.7.)—over half (56 percent) check for accuracy every time they pay it. Comparison with neighbors’ bills may show large differences even though they believe their consumption patterns are similar. Alternatively, some households report that the bill may change dramatically when a new bill collector starts. Some households find that others have connected to their line and are stealing their electricity. Finally, the bill may change for no apparent reason.
Table 2.7. Many consumers distrust the billing system Percentage Quintiles Lowest 2nd 3rd 4th Highest Ave Do not believe their bill is accurate 36 42 36 28 31 35
Do not believe their bill is fair 45 49 44 43 40 44
Source: World Bank SIA survey (2008). 44. Households spend considerably more on private generation. As discussed above, the top quintile spends considerably more on this expensive alternative (see Figure 12). Since the main difference in fees charged by private generators relates to ampere levels, these higher expenditures are explained by the fact that wealthier households subscribe at higher (more expensive) ampere levels.
36 World Bank (2002), Sourcebook for poverty reduction strategies, core techniques and crosscutting issues, Washington DC. 37 Note that the averages for this includes
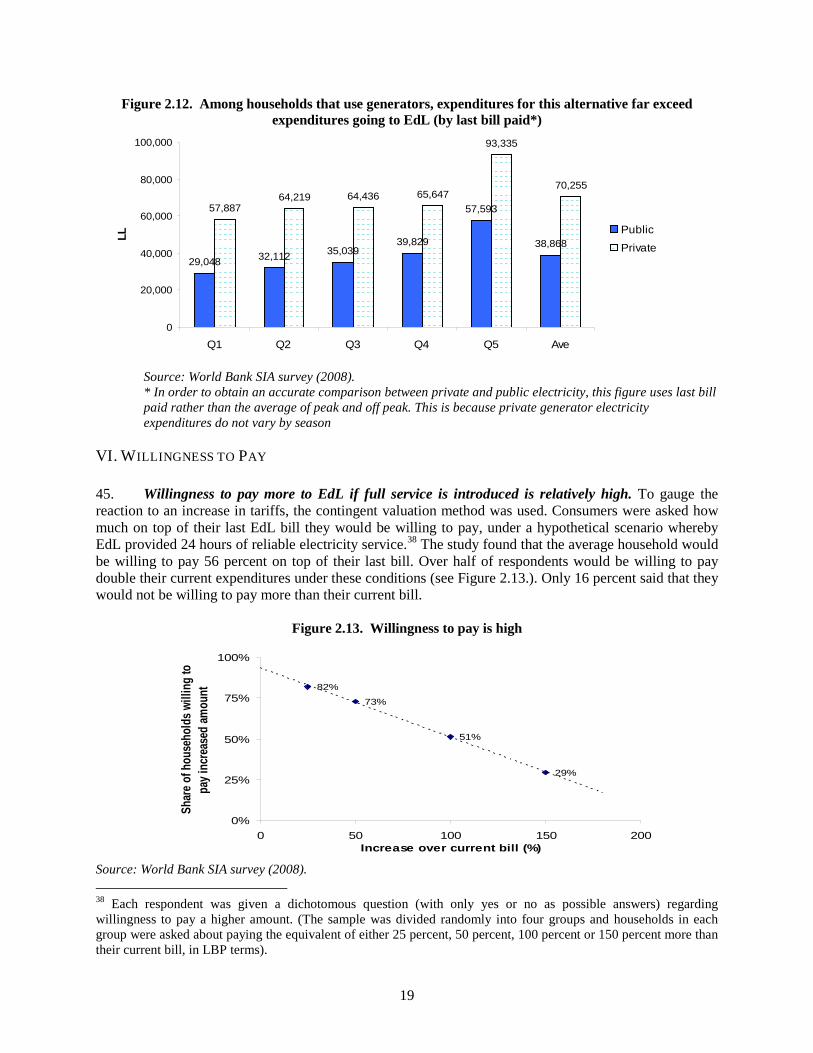
19
Figure 2.12. Among households that use generators, expenditures for this alternative far exceed expenditures going to EdL (by last bill paid*)
29,048 32,112 35,03939,829
57,593
38,868
57,88764,219 64,436 65,647
93,335
70,255
0
20,000
40,000
60,000
80,000
100,000
Q1 Q2 Q3 Q4 Q5 Ave
LL Public
Private
Source: World Bank SIA survey (2008). * In order to obtain an accurate comparison between private and public electricity, this figure uses last bill paid rather than the average of peak and off peak. This is because private generator electricity expenditures do not vary by season
VI. WILLINGNESS TO PAY 45. Willingness to pay more to EdL if full service is introduced is relatively high. To gauge the reaction to an increase in tariffs, the contingent valuation method was used. Consumers were asked how much on top of their last EdL bill they would be willing to pay, under a hypothetical scenario whereby EdL provided 24 hours of reliable electricity service.38
The study found that the average household would be willing to pay 56 percent on top of their last bill. Over half of respondents would be willing to pay double their current expenditures under these conditions (see Figure 2.13.). Only 16 percent said that they would not be willing to pay more than their current bill.
Figure 2.13. Willingness to pay is high
82%
73%
51%
29%
0%
25%
50%
75%
100%
0 50 100 150 200Increase over current bill (%)
Shar
e of h
ouse
hold
s will
ing
to
pay i
ncre
ased
amou
nt
Source: World Bank SIA survey (2008). 38 Each respondent was given a dichotomous question (with only yes or no as possible answers) regarding willingness to pay a higher amount. (The sample was divided randomly into four groups and households in each group were asked about paying the equivalent of either 25 percent, 50 percent, 100 percent or 150 percent more than their current bill, in LBP terms).
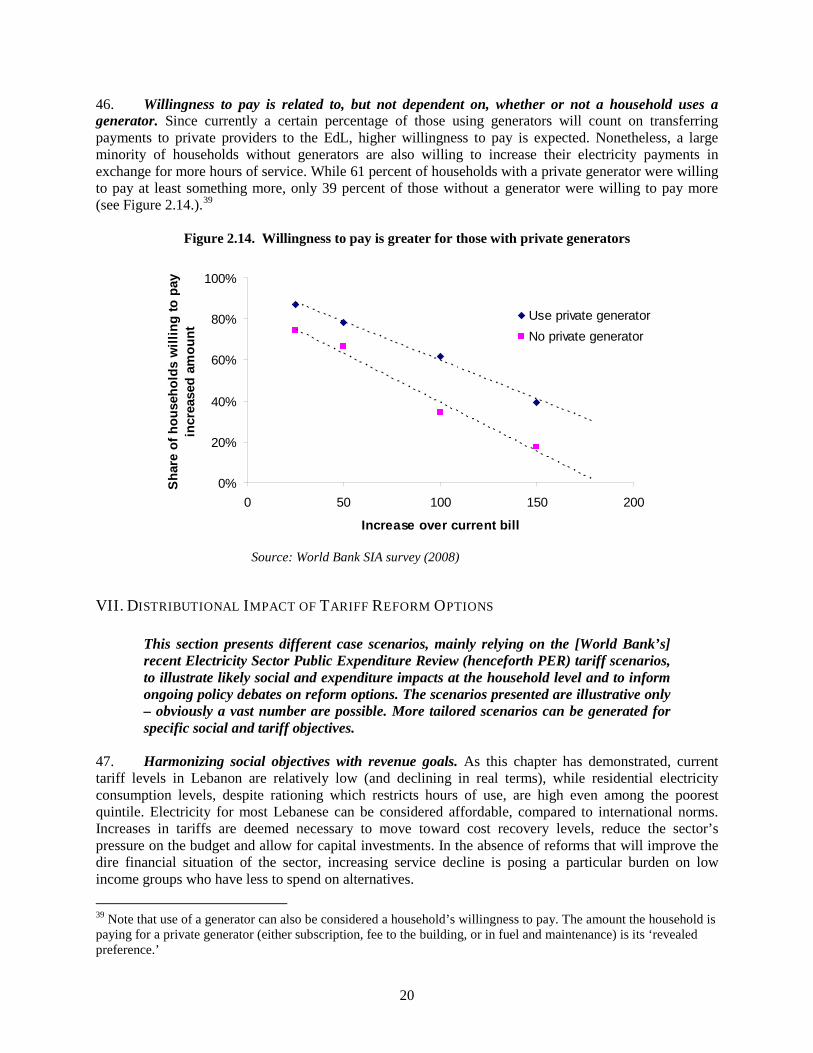
20
46. Willingness to pay is related to, but not dependent on, whether or not a household uses a generator. Since currently a certain percentage of those using generators will count on transferring payments to private providers to the EdL, higher willingness to pay is expected. Nonetheless, a large minority of households without generators are also willing to increase their electricity payments in exchange for more hours of service. While 61 percent of households with a private generator were willing to pay at least something more, only 39 percent of those without a generator were willing to pay more (see Figure 2.14.).39
Figure 2.14. Willingness to pay is greater for those with private generators
0%
20%
40%
60%
80%
100%
0 50 100 150 200
Increase over current bill
Shar
e of
hou
seho
lds
will
ing
to p
ay
incr
ease
d am
ount
Use private generatorNo private generator
Source: World Bank SIA survey (2008)
VII. DISTRIBUTIONAL IMPACT OF TARIFF REFORM OPTIONS
This section presents different case scenarios, mainly relying on the [World Bank’s] recent Electricity Sector Public Expenditure Review (henceforth PER) tariff scenarios, to illustrate likely social and expenditure impacts at the household level and to inform ongoing policy debates on reform options. The scenarios presented are illustrative only – obviously a vast number are possible. More tailored scenarios can be generated for specific social and tariff objectives.
47. Harmonizing social objectives with revenue goals. As this chapter has demonstrated, current tariff levels in Lebanon are relatively low (and declining in real terms), while residential electricity consumption levels, despite rationing which restricts hours of use, are high even among the poorest quintile. Electricity for most Lebanese can be considered affordable, compared to international norms. Increases in tariffs are deemed necessary to move toward cost recovery levels, reduce the sector’s pressure on the budget and allow for capital investments. In the absence of reforms that will improve the dire financial situation of the sector, increasing service decline is posing a particular burden on low income groups who have less to spend on alternatives. 39 Note that use of a generator can also be considered a household’s willingness to pay. The amount the household is paying for a private generator (either subscription, fee to the building, or in fuel and maintenance) is its ‘revealed preference.’
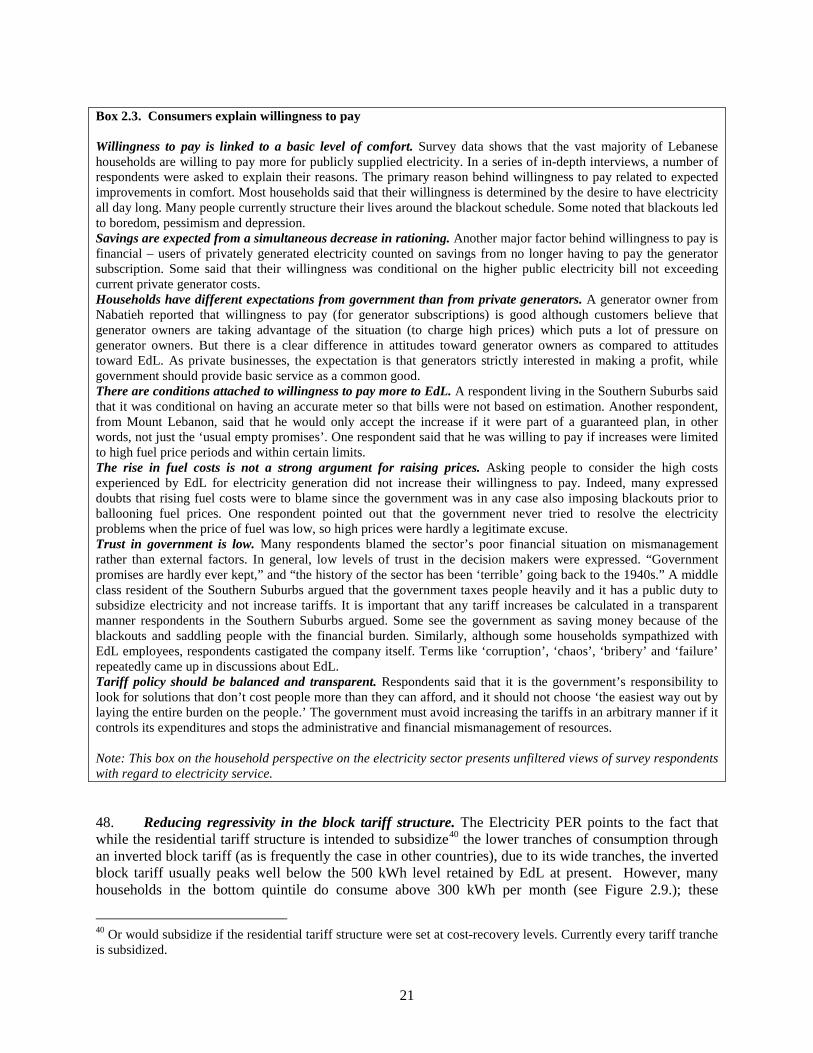
21
48. Reducing regressivity in the block tariff structure. The Electricity PER points to the fact that while the residential tariff structure is intended to subsidize40
40 Or would subsidize if the residential tariff structure were set at cost-recovery levels. Currently every tariff tranche is subsidized.
the lower tranches of consumption through an inverted block tariff (as is frequently the case in other countries), due to its wide tranches, the inverted block tariff usually peaks well below the 500 kWh level retained by EdL at present. However, many households in the bottom quintile do consume above 300 kWh per month (see Figure 2.9.); these
Box 2.3. Consumers explain willingness to pay Willingness to pay is linked to a basic level of comfort. Survey data shows that the vast majority of Lebanese households are willing to pay more for publicly supplied electricity. In a series of in-depth interviews, a number of respondents were asked to explain their reasons. The primary reason behind willingness to pay related to expected improvements in comfort. Most households said that their willingness is determined by the desire to have electricity all day long. Many people currently structure their lives around the blackout schedule. Some noted that blackouts led to boredom, pessimism and depression. Savings are expected from a simultaneous decrease in rationing. Another major factor behind willingness to pay is financial – users of privately generated electricity counted on savings from no longer having to pay the generator subscription. Some said that their willingness was conditional on the higher public electricity bill not exceeding current private generator costs. Households have different expectations from government than from private generators. A generator owner from Nabatieh reported that willingness to pay (for generator subscriptions) is good although customers believe that generator owners are taking advantage of the situation (to charge high prices) which puts a lot of pressure on generator owners. But there is a clear difference in attitudes toward generator owners as compared to attitudes toward EdL. As private businesses, the expectation is that generators strictly interested in making a profit, while government should provide basic service as a common good. There are conditions attached to willingness to pay more to EdL. A respondent living in the Southern Suburbs said that it was conditional on having an accurate meter so that bills were not based on estimation. Another respondent, from Mount Lebanon, said that he would only accept the increase if it were part of a guaranteed plan, in other words, not just the ‘usual empty promises’. One respondent said that he was willing to pay if increases were limited to high fuel price periods and within certain limits. The rise in fuel costs is not a strong argument for raising prices. Asking people to consider the high costs experienced by EdL for electricity generation did not increase their willingness to pay. Indeed, many expressed doubts that rising fuel costs were to blame since the government was in any case also imposing blackouts prior to ballooning fuel prices. One respondent pointed out that the government never tried to resolve the electricity problems when the price of fuel was low, so high prices were hardly a legitimate excuse. Trust in government is low. Many respondents blamed the sector’s poor financial situation on mismanagement rather than external factors. In general, low levels of trust in the decision makers were expressed. “Government promises are hardly ever kept,” and “the history of the sector has been ‘terrible’ going back to the 1940s.” A middle class resident of the Southern Suburbs argued that the government taxes people heavily and it has a public duty to subsidize electricity and not increase tariffs. It is important that any tariff increases be calculated in a transparent manner respondents in the Southern Suburbs argued. Some see the government as saving money because of the blackouts and saddling people with the financial burden. Similarly, although some households sympathized with EdL employees, respondents castigated the company itself. Terms like ‘corruption’, ‘chaos’, ‘bribery’ and ‘failure’ repeatedly came up in discussions about EdL. Tariff policy should be balanced and transparent. Respondents said that it is the government’s responsibility to look for solutions that don’t cost people more than they can afford, and it should not choose ‘the easiest way out by laying the entire burden on the people.’ The government must avoid increasing the tariffs in an arbitrary manner if it controls its expenditures and stops the administrative and financial mismanagement of resources. Note: This box on the household perspective on the electricity sector presents unfiltered views of survey respondents with regard to electricity service.
22
households also spend less than 5 percent of their income on electricity. This suggests that tariff increases would not impose an unreasonable burden on this group, if designed appropriately and coupled with service improvements.
49. A socially-responsible framework for designing tariff structure changes. Several parameters are considered when designing changes to tariff structure. Affordability for low income groups and the distributional impact of tariff changes on different welfare groups (this is to understand relative pro-poorness of different tariff adjustments scenarios, not to advocate equalizing expenditure shares across all welfare groups), should all be given a weight among these parameters. Accordingly, the SIA assesses the impact of changes to the tariff rates and tariff structure with respect to the following three parameters:
• Affordability. This is measured in terms of the share of electricity expenditures in the budget
of low income households. Affordability is shown using deciles (as opposed to quintiles) to more clearly demonstrate the impact on the very poorest households.
• Increase in consumer bill. The increase in the consumer bill (by quintile) as well as the US$
amount, is related to affordability, but it shows the percentage change in electricity bill compared with the present case. This is how the household will experience the tariff change.
• Progressivity index.41 The progressivity index helps us assess how the share of electricity
expenditure for the lowest decile or quintile compares to the average share of the whole population. If the index equals 1.0, then the share is equal, if <1 it is progressive and if >1 it is regressive.42
An index of below 1.0 would indicate regressivity, and greater than 1.0 progressivity. Note that the outcome is graphed in deciles (as opposed to quintiles) to give a more disaggregated picture of the results.
50. Tariff change scenarios. In the simulations, changes are made to the existing tariff structure43 to assess four (out of a possible large number of) tariff change scenarios along each parameter described above. Scenarios 1 and 2 maintain the current tariff structure and apply across the board tariff increases of 40 percent and 100 percent, respectively along the lines described in the electricity PER.44
Scenario 3 changes the tariff structure by raising substantially the tariff rate for consumption above 300 kWh/month, while Scenario 4 raises the tariff substantially above 100 kWh month level, and also eliminates the regressive “rehabilitation fee” (see Box 4). The choice of simulations for Scenarios 3 and 4 was based on attaining the same level of revenue (from households) that would be raised by Scenario 2.
41 The index is based on the ratio of: share of electricity expenditure at the mean of selected percentages of sample cumulative distribution to the mean share of electricity expenditure of the entire sample. It is not necessary that all shares for various deciles or quintiles be equal. The objective is to compare the average of the poorest to the average of the whole sample. This formula explains the slope and the difference between the curve and the horizontal line in Figure 2.15 42 The measure here provides an additional assessment tool and does not target such unrealistic and utopian goals as equal electricity shares in expenditures for all. It is important to bear in mind that the key issue is affordability as tariffs are raised, not affordability at current prices. While this study finds that electricity is generally affordable for virtually all households, as tariffs rise it will be important to assess whether lower income groups are being asked to share a disproportionate share of the increase, as measured against their overall expenditures. 43 The projected revenue increases was held roughly constant for scenarios 2, 3 and 4. 44 Although PER oil price assumptions (US$66/barrel) are above current international oil prices (at around US$45/barrel), they are still significantly below the average oil price/barrel in 2008 (US$100l according to the most recent World Bank assumptions); in addition, given recent volatility in price trends, they still serve to the purpose of providing indicative illustrative simulations.
23
51. The illustrative simulations do not take into account gradual implementation, which is a reasonable policy choice. The gradual or incremental introduction of tariff increases is prudent and commonly used tariff reform strategy. Especially in the case of Lebanon, because of the substantial increases required, tariff changes might need to be phased in over a longer period. The average (peak and off-peak) bill of each quintile is used for the simulations.
Box 2.4. Scenarios
SCENARIO 1: 40 percent tariff increase. Increase of 40 percent in tariff rates at all levels (draws on Scenario 1 in the Electricity PER, designed to break even before debt service and capital cost). SCENARIO 2: 100 percent tariff increase. Increase of 100 percent in tariff rates at all levels (draws on Scenario 2 in the Electricity PER, designed to break even after debt service and capital cost). SCENARIO 3: Tariff structure change. Increases the tariff levels for each block, by 50 percent, 75 percent, 100 percent, 150 percent, and 100 percent, respectively.
SCENARIO 4: Tariff structure change with removal of fee: Increases the tariff levels for each block, by 75 percent, 100 percent, 100 percent, 150 percent, and 125 percent, respectively, and eliminates the rehabilitation fee of 5,000 LBP.
Key Findings of Tariff Reform Simulations 52. The tables and Figure 15 below present the simulation outcomes with the following main findings:
• Affordability. In none of the scenarios does the average electricity share of expenditures reach
the internationally accepted norm of 10 percent. The highest increase for the lowest quintile is observed under Scenario 2 where the electricity share of expenditures reaches a maximum of 7 percent. The outcomes of all four scenarios considered in the study are within the norms for affordability.
• Increase in electricity bill. Overall, across all 4 scenarios, the average monthly bill for the
lowest quintile increases within the range of US$6.29 to US$15.72 (or 26 percent to 66 percent). Looking at Scenario 2 (relatively least ‘affordable’ for the poor), we see that the 100 percent increase in tariffs across the board translates into a 66 percent increase in the bill of lowest quintile. The least regressive scenario is Scenario 4, where tariffs are increased by 75 percent to 150 percent, yet bottom lowest quintile sees a 50 percent increase in their bill (with their electricity share of expenditures below 6.5 percent). This is largely explained by the elimination of the rehabilitation fee under this scenario. The highest average increase of US$42.34 in the bill is experienced by the highest quintile under Scenario 4 (with their electricity share of expenditures at 5.4 percent). However, if electricity rationing is decreased as tariffs are raised in tandem with supply improvement (over a period of years), households will be able to transfer what they currently spend on private generation to EdL, which will partially compensate for increase in their electricity bill.
• Progressivity index. The progressivity index shows that that Scenario 4 (removing 5,000 LBP
rehabilitation fee) comes the closest to moving the tariff structure in a progressive direction. This is largely because removal of the rehabilitation fee lowers the average cost per kWh for low electricity consumers considerably, while revenues from the reform of the tariff structure compensate for forgone revenues from this source.
24
Figure 2.15. Affordability and progressivity (cumulative)
2.5%
3.0%
3.5%
4.0%
4.5%
5.0%
5.5%
6.0%
6.5%
7.0%
10 20 30 40 50 60 70 80 90 100
Sample Distribution (pcexp)
Budg
et S
hare
Base CaseScenario 1Scenario 2Scenario 3Scenario 4
,
Table 2.8. Changes to nominal tariff rates Tariff block Base case Scenario 1 Scenario 2 Scenario 3 Scenario 4 kWh kWh
cost Change kWh
cost Tariff
change kWh cost
Tariff change
kWh cost
Tariff change
kWh cost
<100 2.3 40% 3.3 100% 4.7 50% 3.5 75% 4.1 100-300 3.7 40% 5.1 100% 7.3 75% 6.4 100% 7.3 300-400 5.3 40% 7.5 100% 10.7 100% 10.7 100% 10.7 400-500 8 40% 11.2 100% 16 150% 20 150% 20
>500 13.3 40% 18.7 100% 26.7 100% 26.7 125% 30 Source: SIA survey (2008) and World Bank staff calculations
25
Table 2.9. Illustrative Scenarios and their Impacts (EDL expenditures only)
SCENARIO 1 Progressivity
index: 0.920
Quintile Increase in
bill (%) Increase in bill
(US$) Share of
household expenditure (%)
Lowest 26 6.29 5.05 2 28 7.68 4.26 3 28 8.11 3.57 4 29 9.75 4.20
Highest 31 15.46 3.48
SCENARIO 2 Progressivity
index: 0.927
Quintile Increase in
bill (%) Increase in bill
(US$) Share of
household expenditure (%)
Lowest 66 15.72 6.7 2 69 19.19 5.7 3 70 20.26 4.8 4 72 24.38 5.7
Highest 78 38.65 4.8
SCENARIO 3 Progressivity
index: 0.935
Quintile Increase in
bill (%) Increase in bill
(US$) Share of
household expenditure (%)
Lowest 55 13.13 5.9 2 66 18.34 5.3 3 69 19.95 4.4 4 75 25.38 5.5
Highest 80 39.64 4.9
SCENARIO 4 Progressivity
index: 0.948
Quintile Increase in
bill Increase in bill
(US$) Share of
household budget (%)
Lowest 50 11.89 5.3 2 62 17.1 4.8 3 64 18.7 4.0 4 73 24.5 5.2
Highest 85 42.34 4.7
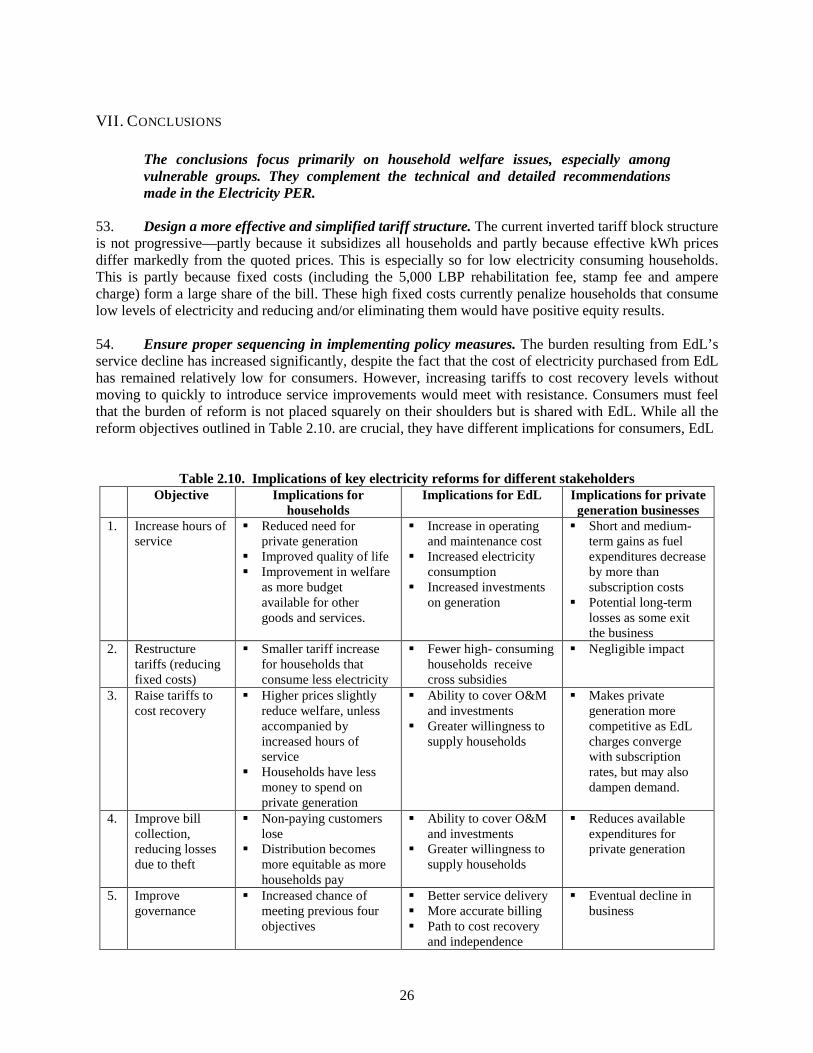
26
VII. CONCLUSIONS
The conclusions focus primarily on household welfare issues, especially among vulnerable groups. They complement the technical and detailed recommendations made in the Electricity PER.
53. Design a more effective and simplified tariff structure. The current inverted tariff block structure is not progressive—partly because it subsidizes all households and partly because effective kWh prices differ markedly from the quoted prices. This is especially so for low electricity consuming households. This is partly because fixed costs (including the 5,000 LBP rehabilitation fee, stamp fee and ampere charge) form a large share of the bill. These high fixed costs currently penalize households that consume low levels of electricity and reducing and/or eliminating them would have positive equity results. 54. Ensure proper sequencing in implementing policy measures. The burden resulting from EdL’s service decline has increased significantly, despite the fact that the cost of electricity purchased from EdL has remained relatively low for consumers. However, increasing tariffs to cost recovery levels without moving to quickly to introduce service improvements would meet with resistance. Consumers must feel that the burden of reform is not placed squarely on their shoulders but is shared with EdL. While all the reform objectives outlined in Table 2.10. are crucial, they have different implications for consumers, EdL
Table 2.10. Implications of key electricity reforms for different stakeholders Objective
Implications for
households Implications for EdL Implications for private
generation businesses 1. Increase hours of
service
Reduced need for private generation
Improved quality of life Improvement in welfare
as more budget available for other goods and services.
Increase in operating and maintenance cost
Increased electricity consumption
Increased investments on generation
Short and medium-term gains as fuel expenditures decrease by more than subscription costs
Potential long-term losses as some exit the business
2. Restructure tariffs (reducing fixed costs)
Smaller tariff increase for households that consume less electricity
Fewer high- consuming households receive cross subsidies
Negligible impact
3. Raise tariffs to cost recovery
Higher prices slightly reduce welfare, unless accompanied by increased hours of service
Households have less money to spend on private generation
Ability to cover O&M and investments
Greater willingness to supply households
Makes private generation more competitive as EdL charges converge with subscription rates, but may also dampen demand.
4. Improve bill
collection, reducing losses due to theft
Non-paying customers lose
Distribution becomes more equitable as more households pay
Ability to cover O&M and investments
Greater willingness to supply households
Reduces available expenditures for private generation
5. Improve governance
Increased chance of meeting previous four objectives
Better service delivery More accurate billing Path to cost recovery
and independence
Eventual decline in business
27
and private generators, and how they are sequenced is important in terms of acceptability and short-term gains and losses. 55. Improve service by reducing rationing, especially in the areas outside Beirut which experience long blackout hours. Among other things, this will have the effect of readjusting the burden imposed by rationing from the poor to the non-poor. Although there may be good reasons for keeping rationing in the capital to a minimum, it gives rise to social inequities. Beirut households have higher welfare levels and they are most able to afford paying for expensive substitutes, yet have the least need for them. Most households in other regions must choose between going without electricity and spending significant amounts on private generation. 56. Identify key operating guidelines for informal electricity sector. The informal electricity sector, served by hundreds of private generator businesses, provides up to 30 percent of Lebanon’s electricity and is an indispensible service to many households. Yet the sector lies entirely outside the legal framework and does not pay taxes to the state. It must be acknowledged that private generation will play a significant role in electricity generation for years to come. Hence, identification of proper operating guidelines that will protect and benefit consumers while ensuring continued availability of this alternative source should be given consideration and merit additional research work. Without dampening private sector activity, or generating an additional and onerous layer of bureaucracy, the guidelines could have several objectives, including:
• bring private generator businesses into the formal sector so that customers have access to means of redress for losses or damage incurred by faulty wiring or through other fault;
• enable the state to tax the sector like other businesses; • set technical standards for service; • monitor the sector and either set guidelines on subscription fees (it would be desirable to
assess if the generator businesses operate as a monopolistic structure). 57. Harmonize electricity sector reform with social safety net reform over time. Given the ongoing progress with the design of a social safety net system with an adequate targeting framework in Lebanon, it will be important to consider electricity reforms, in particular tariff structure adjustments, in the context of the objectives and tools of the new social safety net system over time. In some countries social objectives are pursued through social policies and not necessarily through energy pricing. This is an option that should be kept in mind when the new social safety system is up and running, at which point the changes to the tariff structure that are currently being debated for implementation from 2009 onwards could be reconsidered. Given the generally fragmented and non-governmental nature of social safety net provision in Lebanon, any new arrangements would likely need to deal with political economy issues, which are beyond the scope of this paper.45
45 See Lebanon Energy Sector PER, World Bank, 2007.
28
CHAPTER 3. WATER
“The water sector is one of the most important sectors in Lebanon due to its huge impact on the economy, growth, environment and poverty alleviation…Attention should be given to the long term planning and management of urban and rural development to secure sustainable development and to ensure that adequate and equitable services are rendered to the population.” – Water and Wastewater sector: Sector Reform Strategy Workshop. January 15, 2007. Grand Serail- Lebanon
I. INTRODUCTION 58. Lebanon’s ample water resources have not translated into sufficient water supply. One of the few countries in the region benefiting from plentiful rainfall, Lebanon has potentially sufficient water resources to meet domestic demand. Nonetheless, transforming resources into quality drinking water for the entire population has proved difficult despite Government investments in infrastructure. As a result, much of Lebanon’s groundwater simply flows out to the sea, and water supply and service remains poor and intermittent in most parts of the country. Water tariffs do not allow for cost recovery and although low, they are regressive. Furthermore, in the absence of metering (outside a few limited areas) there is a disconnect between water supply and household demand. 59. Much of the sector’s infrastructure is old and deteriorated, and its operation and management are inefficient. Despite reform measures undertaken earlier in the decade, lack of cost recovery in the sector is reflected in the financial deficits run by three of the four Regional Water Authorities46
, inhibiting their ability to cover operating and maintenance costs. As a result the Government often steps in to pay for operational expenses in additon to directly financing investment in infrastructure. Existing weakneses in institutional capacity delay adressing these key problems and improving the management and supply of water services.
60. Deficiencies in existing water supply services affect some household groups more than others. Obviously, not every household is affected to the same degree by the water situation. This chapter assesses impacts of water provision in Lebanon on different categories of households and what sequence of policy options present opportunities for addressing social concerns given supply constraints on the one side and household consumption behavior on the other.
II. KEY SECTOR ISSUES – A SUMMARY OVERVIEW 61. The water sector reforms initiated in 2000 have only partially been realized. A new Water Sector Law (Water Law 221) was promulgated by Parliament in May 2000 leading to the eventual consolidation of the 22 separate public water servicing authorities into four autonomous Regional Water Authorities (RWAs) in 2005. One of the key objectives of this measure was to improve efficiency, but this has proved elusive. According to the law, the new RWAs have the following responsibilities: operate and maintain the hydraulic systems that are located in the areas under their respective jurisdiction, implement the required investments in line with the Country’s Master Plan to be prepared by Ministry of Energy and Water (MOEW), secure the replacement of water systems, achieve cost recovery and propose
46 Since RWAs do not have audited financial statements, prepared according to standard accounting practices the financial information remains incomplete for most of them and the financial indicators are only indicative. However, al the estimates confirm that with the exception of BMLWA the Authorities have been faced with financial difficulties.

29
tariff adjustments. The law states that RWAs should aim for financial sustainability while taking into account the country’s general socio-economic conditions and the population living in their region. The reforms have not yet achieved the desired results, in part due to the aforementioned lack of institutional capacity of the RWAs, and in part due to the lack of an enabling environment. Beirut Mount Lebanon Water Authority (BMLWA) is an exception, having achieved a certain measure of financial soundness and self-sufficiency. However, this achievement needs to be considered within the context of BMLWA providing the lowest per household water supply among all four RWAs. 62. Most Lebanese households have access to improved water, but this does not mean they rely on it. The UN estimates that 100 percent of Lebanese households use an improved water source47
compared with 88 percent of households in the MENA region. However, the SIA survey finds that while access to improved water may be (nearly) universal, the actual number of households relying on an improved water source is below 100 percent. This is because many use bottled water and tanker truck water, which are not considered an improved source (because of concerns about quality and problems with availability).
63. The effective cost of public water to households is often much higher than the quoted tariff. The quoted average cost of 1m3/day public water is US$0.37 in Lebanon, which is equivalent to the average for MENA countries and slightly above the Upper Middle Income Country (UMIC) average (see Table 3.1.).48
Many households, however, pay a higher actual, or effective, rate because they receive considerably less water than 1m3/day. A significant amount of the costs of unaccounted for water (UFW), which exceeds 50 percent of water produced in Lebanon, is, hence, borne by consumers.. Furthermore, unreliability of supply imposes its own costs, because of purchase of alternative supplies, storage, etc.
Table 3.1. Average Water Tariffs and Degree of Cost Recovery
Percentage of water utilities whose average tariffs
appears to be:
Region Average Water
Tariffs (US$/m3)*
Too low to cover basic
O&M Enough to cover
most O&M
Enough for O&M and
partial capital UMIC 0.34 39 22 39 LMIC 0.31 37 41 22 OECD 1.04 6 43 51 MENA 0.37 58 25 17 Lebanon 0.37** 75 25 0
Source: ADB 2004, ADESAS 2005, GWI 2004, NIUA 1999, WB staff calculation *Average tariff are based on residential consumption of 15 m3. ** The actual tariff varies by RWA.
64. Water tariffs do not cover operation and maintenamce costs, while collection rates are low. As shown in Table 3.1., Lebanon’s cost recovery performance is very poor compared to other countries. Three of the four RWAs—BMLWA is the exception—do not have enough revenue to cover operating and maintenance (O&M) costs, and the Government often steps in to pay for operating expenses49
47 Improved drinking water sources include: piped water into dwelling, plot or yard; public tap/standpipe; tube well/borehole; protected dug well; protected spring; and rainwater collection. Unimproved drinking water sources include: unprotected dug well; unprotected spring; cart with small tank/drum; bottled water; tanker-truck; surface water (river, dam, lake, pond, stream, canal, irrigation channels). Bottled water is considered an unimproved source due to limitations in potential quantity, not quality. Source: United Nations Millennium Development Goal Indicators. Available online:
in
http://mdgs.un.org/unsd/mdg/Metadata.aspx?IndicatorId=0&SeriesId=710. 48 2008 World Development Indicators. 49 Including electricity arrears and in some cases staff salaries.

30
additon to financing investments in water infrastructure. Most RWAs also incur high O&M costs arising from inefficient management of services and degraded water networks. The collection rates are low due in part to an inefficient yearly billing system and in part to the unwillingness of some customers to pay for service because of unreliability or other reasons50
(see Table 3.2.).
Table 3.2. Summary of main performance indicators for the RWAs (2004)
Water Authority Subscribers* (000)
Employees/1000 connections
Working Ratio
(percent)**
Bill Collection (percent)
BML 440 2,6 76 73 North Na 3,7 202 49 Bekaa 67 5,9 547 47 South 120 2,2 188 70 Best Practice*** Na <5 70 100
*Subscribers include residential, commercial and industrial clients. ** International Water Association. **Operational costs divided by revenues. ***International Water Association. Source: World Bank Water Sector Public Expenditure Review, (forthcoming).
65. Weak institutional capacity constrains the RWAs’ ability to operate on a commercially sustainable basis. RWAs have difficulty in building a skilled employee base, especially given a government-mandated hiring freeze and low remuneration. This, combined with lack of appropriate resources for operation to an acceptable level, limits their ability to improve services. 66. Dependence of water pumping stations on an unreliable electricity supply hampers operations and can cause damage. Unreliable electricity supply limits water pumping to the regions and fluctuations in supply damage equipment, which cannot easily be repaired or replaced under the RWAs tight budget. This affects the efficiency and quality of the services offered by the water authorities, imposing a further burden on their finances and weakening overall performance.
III. PUBLIC WATER SUPPLY 67. In Lebanon, public water is supplied to connected households on a subscription basis. As noted above, a fixed annual fee is charged to each household based on the allotted quota. There are no meters (aside from a few urban areas under pilot projects) and the amount delivered is regulated by a gauge system (restricted flow mechanism). Under this system, the volume is controlled via a combination of pipe diameter and water pressure: the gauge sets an upper limit on the amount of water the system can deliver to each household. The SIA survey results show that the vast majority of households have a 1m3 gauge connection—less than 2 percent have the larger 2m3 gauge.51
68. RWAs are obliged to provide 1m3 of water per day per connection, an amount designed to cover household needs. Nevertheless, not all households receive the same amount of water. The amount delivered depends both on the amount of time water flows through the pipes, and on water pressure. These indicators vary between regions, within regions, and even within apartment buildings, since water pressure tends to be lower on the upper floors. Billing is, on the other hand, based on a contractual fixed
50 Bill collection rates are changing, in both directions. While BMLWA has achieved a collection rate of above 80 percent, World Bank calculations suggest that the Bekaa Water Authority collected from only 33 percent of customers in 2007, a significant decrease from 2004 levels (see Table 2). 51 According to RWAs, households can apply for a 2 m3 gauge if they have a dwelling larger than 200 m2 but in practice the survey found that gauge size was not related to domicile area

31
consumption of 1m3 per household per day, regardless of the amount actually delivered. Aside from a small number of houses, where new meters have been installed under pilot programs in Tripoli and Saida, actual household water consumption is neither monitored nor used to calculate charges. Nevertheless, even those households with meters still pay fixed charges for water (see section XII below). 69. Many households do not receive water on a daily basis. The SIA survey revealed that, on average, only one quarter of connected households receive water every day, with 40 percent receiving it every other day and the rest less frequently. Some connected households reported that they do not receive water from the public network for several months out of the year (see Table 3). Given that the gauge system is designed to allow delivery of 1m3 per day, it is obvious that, based on the number of days of water supply in some areas, this target is not being met. It is not possible, for example, to compensate in one day for water not delivered the previous day by delivering twice as much water. The gauge will not permit it.
Table 3.3. Public Network Water Availability Households (percentage) Beirut ML North Bekaa South Nabatieh Average
Every day 10 14 59 43 38 20 26 Every other day 52 51 14 24 44 21 40 Every 3 days 37 27 17 14 17 31 25 Once a week 1 7 9 11 1 17 7 Never 1 2 2 8 0 10 3 Source: World Bank SIA survey (2008)
70. In the absence of metering systems, supply of and demand for public network water is de-linked at the household level. The amount of water provided to each household is unrelated to the amount of water a household would consume and pay for if it had a choice. The key factors behind household demand—such as, price, income, quality and consumption needs—do not play a role, except insofar as a household chooses not to connect to the network at all.52
(i) Waste and inefficiency:, The system cannot ‘redistribute’ water from those who have access to more water than they need to those who do not receive enough;
(ii) Built-in inequities in the system. Aside from the fact that households receive different amounts of water depending on their location, inequity appears in various ways:
This leads to problems including:
Larger families receive less water per capita, and lower income households tend to be larger (5.6 members in bottom quintile) than higher income counterparts (4.4 members in top quintile);
Since households have no means of controlling their water expenditures. To increase water consumption beyond what the gauge supplies, they must purchase water from outside the public network. If they choose to consume less, they must still pay the same amount as their higher consuming neighbor.
Either choice constitutes an economic cost to households that would be avoidable under a metered system.
52 Approximately 10 percent of households have not connected to the system although they have access.

32
IV. HOUSEHOLD WATER DEMAND AND CONSUMPTION 71. The current levels of household water supply target do not seem to corroborate with the household demand. In some sub-regions RWAs have sufficient supply to meet the 1m3 target, in other areas they do not (especially during the summer). However, the targeted volume per household of 1m3/day reflects a somewhat arbitrary benchmark set by the RWAs, and does not reflect actual household demand. One cubic meter of water per day per household implies an average per capita consumption of about 220 liters (based on the average household size of 4.4753
), which is, in fact, above average for a middle income country. According to an unpublished study conducted by the Beirut Mount Lebanon Water Authority, it is estimated that a Lebanese family of five requires 700-800 liters of water per day, or 140-160 liters per person. The 1m3 target is probably unrealistically high and not the best metric in any case.
72. Estimates show that water demand exceeds effective water supply in most parts of the country. Although, as noted above, volume of water is difficult to measure, consumers have a general idea of how many hours of water they require to meet their household needs. Self-reporting of hours of water supply per week allows a rough estimation of differences between water received and water demanded. According to this proxy measure, 80 percent of connected households report that during summer months (high season), their demand (in terms of hours they need per week to meet their needs) exceeds supply. This ratio decreases somewhat in the low season (winter months), when 60 percent of households report not having enough water. The greatest water deficit is found in the Bekaa Valley region, while in the North supply actually appears to exceed demand (see Figure 3.1.).54
Figure 3.1. Network water availability - demand mostly exceeds supply
0
2
4
68
10
12
14
16
hour
s/da
y
Low season 4.1 6.0 8.0 4.6 8.4 4.4
High season 6.4 10.9 8.2 6.1 10.0 7.1
Required to meet needs 7.8 10.7 6.6 14.2 10.9 5.7
Beirut ML North Bekaa South Nabatieh
Source: World Bank SIA survey (2008)
73. Hours of service per day is not correlated with welfare levels. Another consequence of the disconnect between supply and demand is that household public water consumption is not linked to welfare but to regional capacity. As noted above, the Beirut-Mount Lebanon region, where overall welfare levels are highest, receives very restricted hours of service relative to other regions (see Figure 3.2.). This is in contrast to electricity provision, as noted in Chapter 2, which is strongly correlated with 53 ibid. 54 Availability has been translated into hours per day to harmonize it with previous analyses.
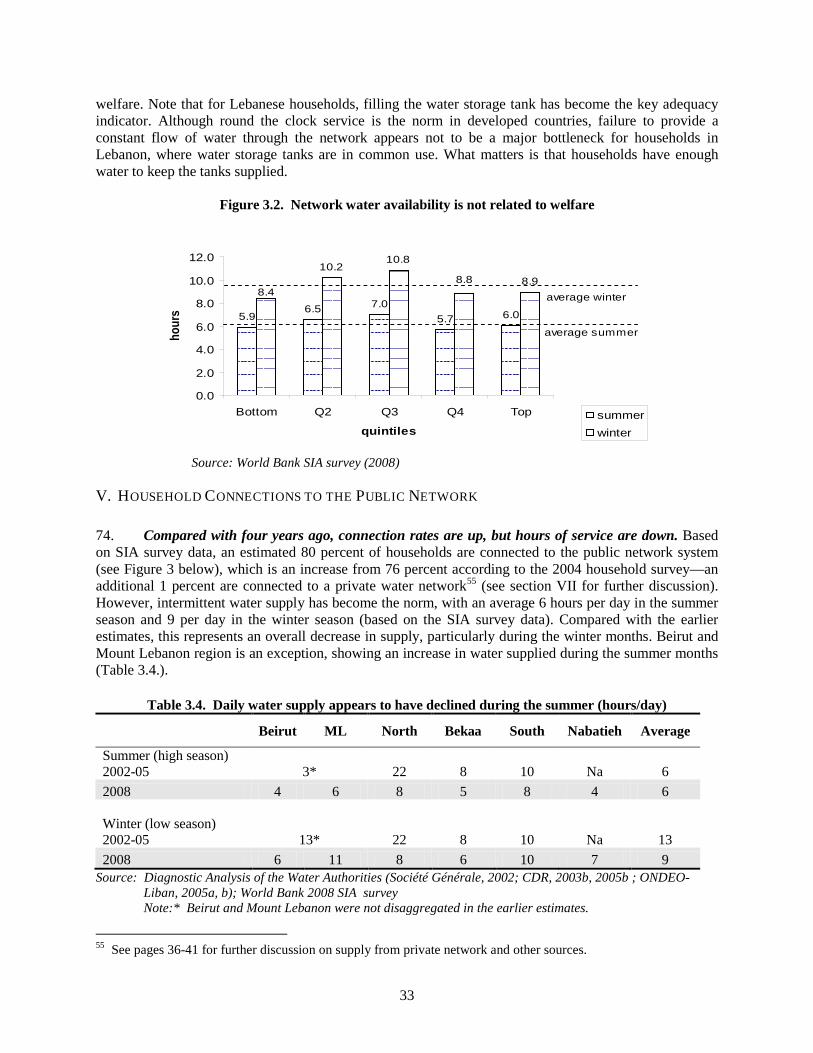
33
welfare. Note that for Lebanese households, filling the water storage tank has become the key adequacy indicator. Although round the clock service is the norm in developed countries, failure to provide a constant flow of water through the network appears not to be a major bottleneck for households in Lebanon, where water storage tanks are in common use. What matters is that households have enough water to keep the tanks supplied.
Figure 3.2. Network water availability is not related to welfare
5.96.5 7.0
5.7 6.0
10.210.8
8.98.4
8.8
0.0
2.0
4.0
6.0
8.0
10.0
12.0
Bottom Q2 Q3 Q4 Top
quintiles
hour
s
summerwinter
average summer
average winter
Source: World Bank SIA survey (2008)
V. HOUSEHOLD CONNECTIONS TO THE PUBLIC NETWORK 74. Compared with four years ago, connection rates are up, but hours of service are down. Based on SIA survey data, an estimated 80 percent of households are connected to the public network system (see Figure 3 below), which is an increase from 76 percent according to the 2004 household survey—an additional 1 percent are connected to a private water network55
(see section VII for further discussion). However, intermittent water supply has become the norm, with an average 6 hours per day in the summer season and 9 per day in the winter season (based on the SIA survey data). Compared with the earlier estimates, this represents an overall decrease in supply, particularly during the winter months. Beirut and Mount Lebanon region is an exception, showing an increase in water supplied during the summer months (Table 3.4.).
Table 3.4. Daily water supply appears to have declined during the summer (hours/day) Beirut ML North Bekaa South Nabatieh Average
Summer (high season) 2002-05 3* 22 8 10 Na 6 2008 4 6 8 5 8 4 6 Winter (low season) 2002-05 13* 22 8 10 Na 13 2008 6 11 8 6 10 7 9
Source: Diagnostic Analysis of the Water Authorities (Société Générale, 2002; CDR, 2003b, 2005b ; ONDEO-Liban, 2005a, b); World Bank 2008 SIA survey
Note:* Beirut and Mount Lebanon were not disaggregated in the earlier estimates.
55 See pages 36-41 for further discussion on supply from private network and other sources.
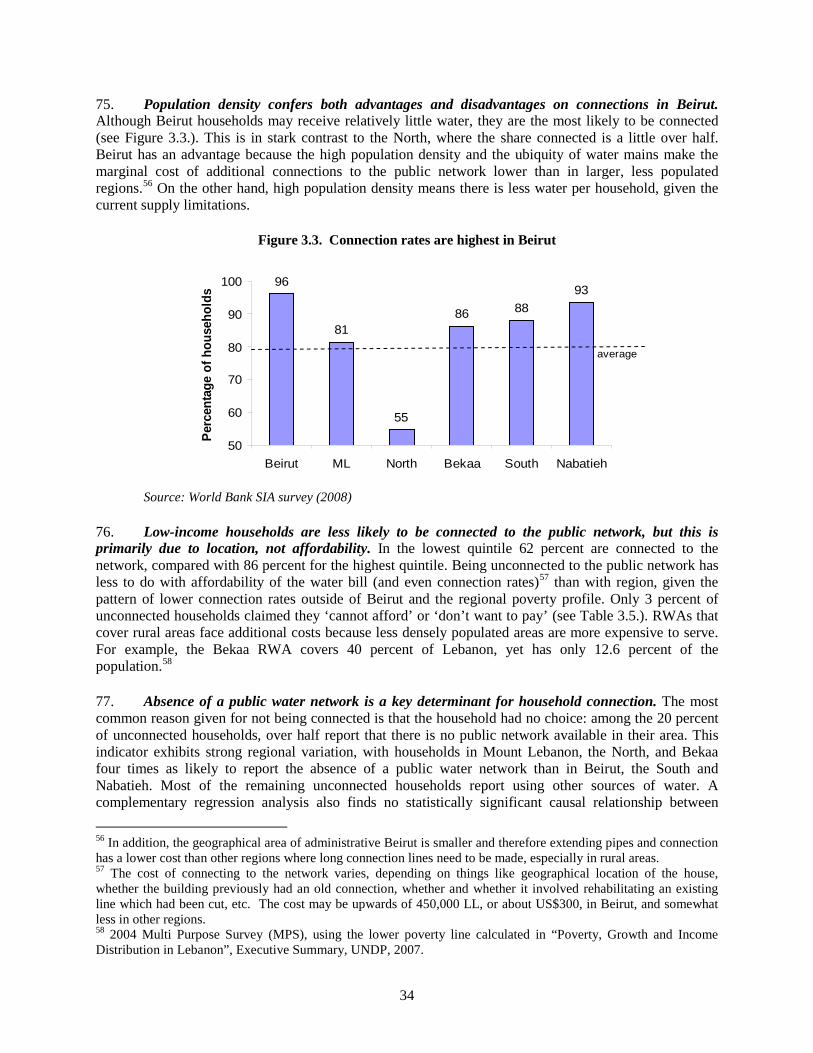
34
75. Population density confers both advantages and disadvantages on connections in Beirut. Although Beirut households may receive relatively little water, they are the most likely to be connected (see Figure 3.3.). This is in stark contrast to the North, where the share connected is a little over half. Beirut has an advantage because the high population density and the ubiquity of water mains make the marginal cost of additional connections to the public network lower than in larger, less populated regions.56
On the other hand, high population density means there is less water per household, given the current supply limitations.
Figure 3.3. Connection rates are highest in Beirut
96
81
55
86 8893
50
60
70
80
90
100
Beirut ML North Bekaa South Nabatieh
Perc
enta
ge o
f hou
seho
lds
average
Source: World Bank SIA survey (2008)
76. Low-income households are less likely to be connected to the public network, but this is primarily due to location, not affordability. In the lowest quintile 62 percent are connected to the network, compared with 86 percent for the highest quintile. Being unconnected to the public network has less to do with affordability of the water bill (and even connection rates)57 than with region, given the pattern of lower connection rates outside of Beirut and the regional poverty profile. Only 3 percent of unconnected households claimed they ‘cannot afford’ or ‘don’t want to pay’ (see Table 3.5.). RWAs that cover rural areas face additional costs because less densely populated areas are more expensive to serve. For example, the Bekaa RWA covers 40 percent of Lebanon, yet has only 12.6 percent of the population.58
77. Absence of a public water network is a key determinant for household connection. The most common reason given for not being connected is that the household had no choice: among the 20 percent of unconnected households, over half report that there is no public network available in their area. This indicator exhibits strong regional variation, with households in Mount Lebanon, the North, and Bekaa four times as likely to report the absence of a public water network than in Beirut, the South and Nabatieh. Most of the remaining unconnected households report using other sources of water. A complementary regression analysis also finds no statistically significant causal relationship between 56 In addition, the geographical area of administrative Beirut is smaller and therefore extending pipes and connection has a lower cost than other regions where long connection lines need to be made, especially in rural areas. 57 The cost of connecting to the network varies, depending on things like geographical location of the house, whether the building previously had an old connection, whether and whether it involved rehabilitating an existing line which had been cut, etc. The cost may be upwards of 450,000 LL, or about US$300, in Beirut, and somewhat less in other regions. 58 2004 Multi Purpose Survey (MPS), using the lower poverty line calculated in “Poverty, Growth and Income Distribution in Lebanon”, Executive Summary, UNDP, 2007.
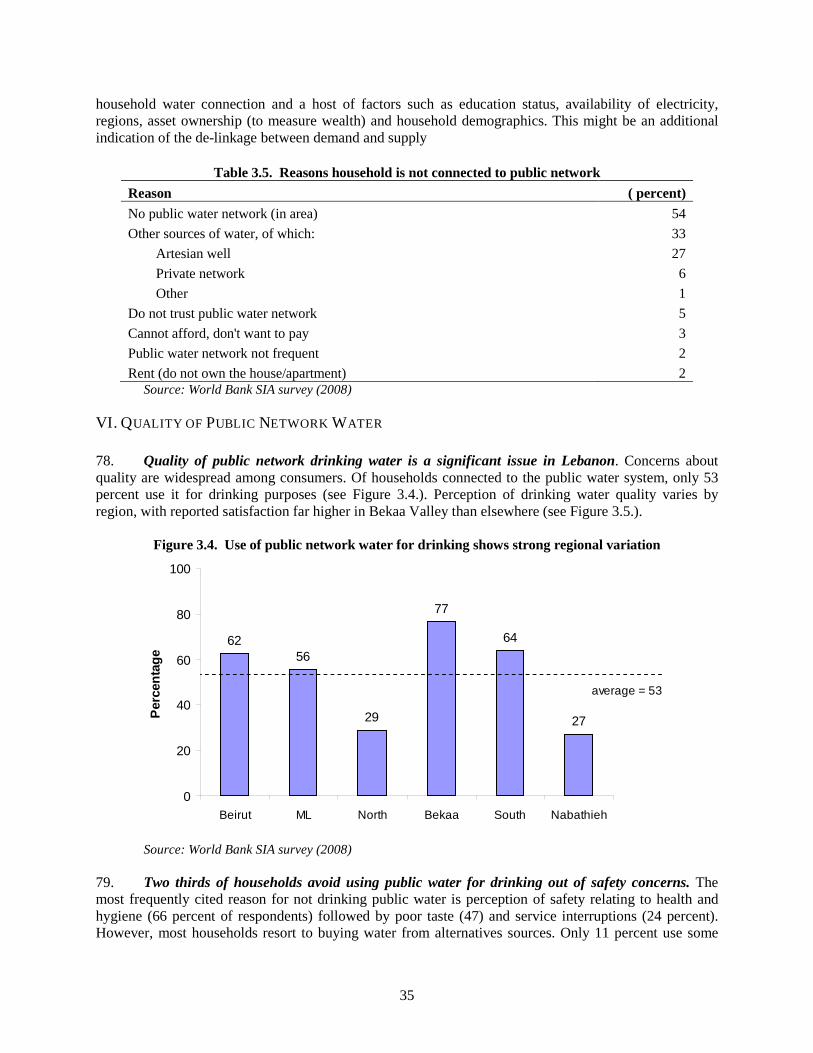
35
household water connection and a host of factors such as education status, availability of electricity, regions, asset ownership (to measure wealth) and household demographics. This might be an additional indication of the de-linkage between demand and supply
Table 3.5. Reasons household is not connected to public network Reason ( percent) No public water network (in area) 54 Other sources of water, of which: 33
Artesian well 27 Private network 6 Other 1
Do not trust public water network 5 Cannot afford, don't want to pay 3 Public water network not frequent 2 Rent (do not own the house/apartment) 2
Source: World Bank SIA survey (2008)
VI. QUALITY OF PUBLIC NETWORK WATER 78. Quality of public network drinking water is a significant issue in Lebanon. Concerns about quality are widespread among consumers. Of households connected to the public water system, only 53 percent use it for drinking purposes (see Figure 3.4.). Perception of drinking water quality varies by region, with reported satisfaction far higher in Bekaa Valley than elsewhere (see Figure 3.5.).
Figure 3.4. Use of public network water for drinking shows strong regional variation
6256
29
77
64
27
0
20
40
60
80
100
Beirut ML North Bekaa South Nabathieh
Perc
enta
ge
average = 53
Source: World Bank SIA survey (2008)
79. Two thirds of households avoid using public water for drinking out of safety concerns. The most frequently cited reason for not drinking public water is perception of safety relating to health and hygiene (66 percent of respondents) followed by poor taste (47) and service interruptions (24 percent). However, most households resort to buying water from alternatives sources. Only 11 percent use some

36
form of sterilization-purification method, for which they spend around 247,000 LBP (US$165) per year on average.
Figure 3.5. Perceptions of public network drinking water quality vary by region
24% 18% 19%2%
21% 22%
27% 31% 34%
15%
28% 32%
49% 51% 47%
83%
51% 47%
0%
20%
40%
60%
80%
100%
Beirut ML North Bekaa South Nabatieh
Poor or very poor Adequate Good or very good
Source: World Bank SIA survey (2008)
80. Multiple factors contribute to poor water quality. First, Lebanon’s water resources are overexploited due to excessive pumping. There are an estimated 40,000 private wells, compared with 3,000 in 197059 which is factor in contamination of the groundwater by seawater. Most of these wells are illegal and were dug during the civil war between 1975 and 1990. Second, inadequate provision of sanitation services has led to polluted streams, rivers and aquifers. Up to 70 percent60 of all natural sources are affected by bacterial contamination. Lebanon’s potable water was ranked below World Health Organization (WHO) standards for drinking water.61
VII. ALTERNATE WATER SOURCES USED BY HOUSEHOLDS
81. Inadequate and unreliable water supply pushes households to purchase water from alternate sources. There are a wide variety of alternate water sources available to households, and these are used by both connected and unconnected households (Figure 3.6.). This covers water used for all purposes, including drinking. Households without connections tend to use artesian wells and delivery trucks more than connected households, but an almost equal number of connected households purchase delivery truck water for service use, and buy water in gallons or bottles for cooking and drinking. Among all connected households, a small share (4 percent) does not use public water at all, whether for service or drinking purposes. 82. The market for alternative water supply provides a greater range of price and quality choices than the alternative market for electricity. While most urban households seeking back-up electricity supply can only buy from their local private generator business, when it comes to water, households have a larger number of options. Depending on the importance of quality, they can buy bottled or gallon water for drinking and cooking, and still use public water or well water for other needs. Still, as with the
59 Source: Water PER report, draft, World Bank. 60 Republic of Lebanon Policy Note on Irrigation Sector Sustainability, World Bank, April 2004. 61 WHO.
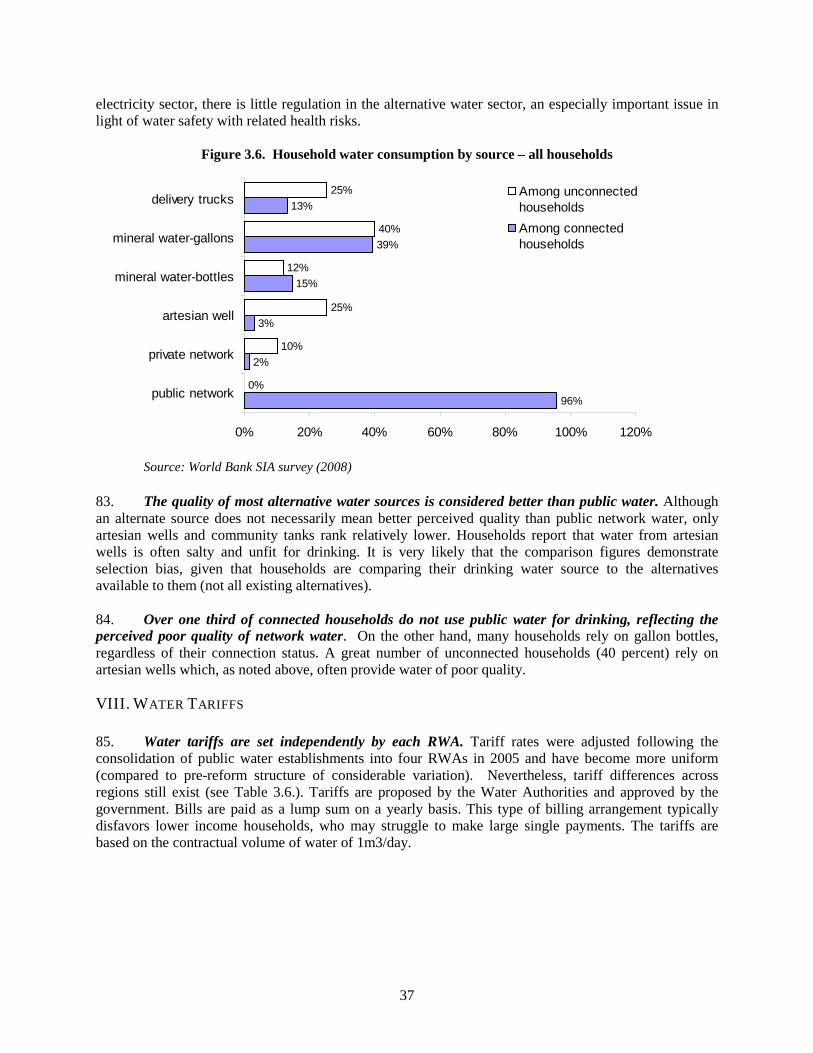
37
electricity sector, there is little regulation in the alternative water sector, an especially important issue in light of water safety with related health risks.
Figure 3.6. Household water consumption by source – all households
96%
2%
3%
15%
39%
13%
0%
10%
25%
12%
40%
25%
0% 20% 40% 60% 80% 100% 120%
public network
private network
artesian well
mineral water-bottles
mineral water-gallons
delivery trucks Among unconnectedhouseholdsAmong connectedhouseholds
Source: World Bank SIA survey (2008)
83. The quality of most alternative water sources is considered better than public water. Although an alternate source does not necessarily mean better perceived quality than public network water, only artesian wells and community tanks rank relatively lower. Households report that water from artesian wells is often salty and unfit for drinking. It is very likely that the comparison figures demonstrate selection bias, given that households are comparing their drinking water source to the alternatives available to them (not all existing alternatives). 84. Over one third of connected households do not use public water for drinking, reflecting the perceived poor quality of network water. On the other hand, many households rely on gallon bottles, regardless of their connection status. A great number of unconnected households (40 percent) rely on artesian wells which, as noted above, often provide water of poor quality.
VIII. WATER TARIFFS 85. Water tariffs are set independently by each RWA. Tariff rates were adjusted following the consolidation of public water establishments into four RWAs in 2005 and have become more uniform (compared to pre-reform structure of considerable variation). Nevertheless, tariff differences across regions still exist (see Table 3.6.). Tariffs are proposed by the Water Authorities and approved by the government. Bills are paid as a lump sum on a yearly basis. This type of billing arrangement typically disfavors lower income households, who may struggle to make large single payments. The tariffs are based on the contractual volume of water of 1m3/day.
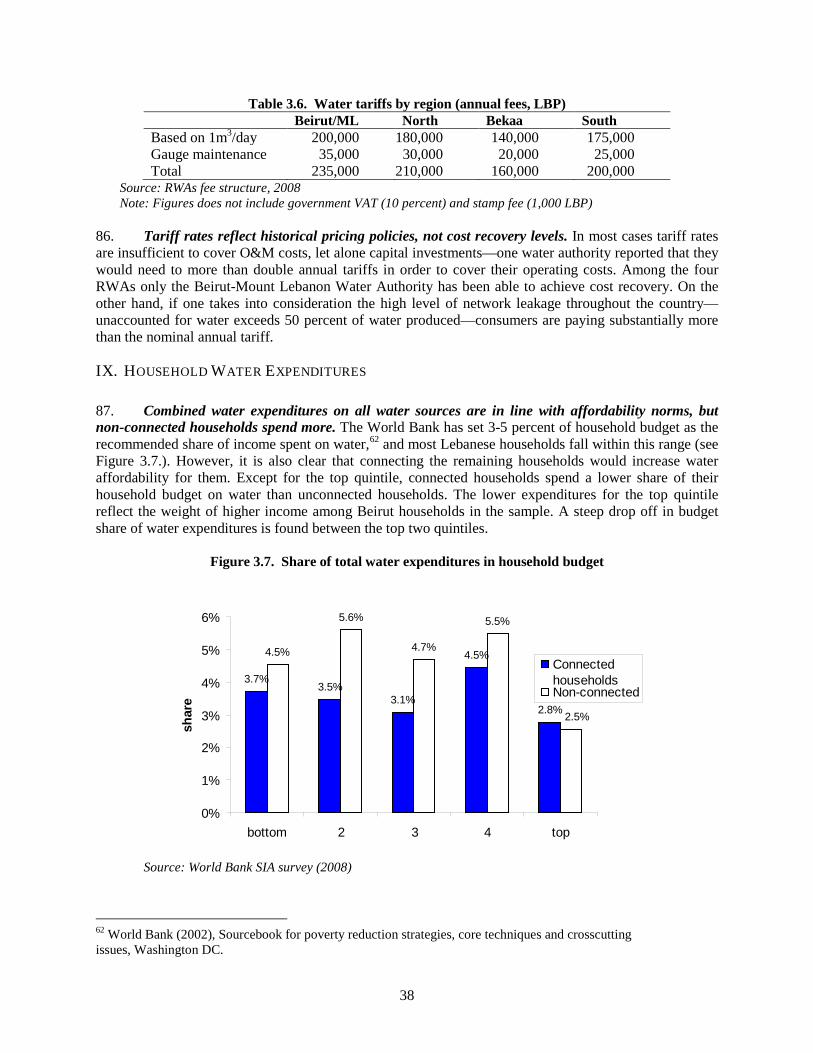
38
Table 3.6. Water tariffs by region (annual fees, LBP) Beirut/ML North Bekaa South Based on 1m3/day 200,000 180,000 140,000 175,000 Gauge maintenance 35,000 30,000 20,000 25,000 Total 235,000 210,000 160,000 200,000
Source: RWAs fee structure, 2008 Note: Figures does not include government VAT (10 percent) and stamp fee (1,000 LBP)
86. Tariff rates reflect historical pricing policies, not cost recovery levels. In most cases tariff rates are insufficient to cover O&M costs, let alone capital investments—one water authority reported that they would need to more than double annual tariffs in order to cover their operating costs. Among the four RWAs only the Beirut-Mount Lebanon Water Authority has been able to achieve cost recovery. On the other hand, if one takes into consideration the high level of network leakage throughout the country—unaccounted for water exceeds 50 percent of water produced—consumers are paying substantially more than the nominal annual tariff.
IX. HOUSEHOLD WATER EXPENDITURES 87. Combined water expenditures on all water sources are in line with affordability norms, but non-connected households spend more. The World Bank has set 3-5 percent of household budget as the recommended share of income spent on water,62
and most Lebanese households fall within this range (see Figure 3.7.). However, it is also clear that connecting the remaining households would increase water affordability for them. Except for the top quintile, connected households spend a lower share of their household budget on water than unconnected households. The lower expenditures for the top quintile reflect the weight of higher income among Beirut households in the sample. A steep drop off in budget share of water expenditures is found between the top two quintiles.
Figure 3.7. Share of total water expenditures in household budget
3.7%3.5%
3.1%
4.5%
2.8%
4.5%
5.6%
4.7%
5.5%
2.5%
0%
1%
2%
3%
4%
5%
6%
bottom 2 3 4 top
shar
e
ConnectedhouseholdsNon-connected
Source: World Bank SIA survey (2008)
62 World Bank (2002), Sourcebook for poverty reduction strategies, core techniques and crosscutting issues, Washington DC.
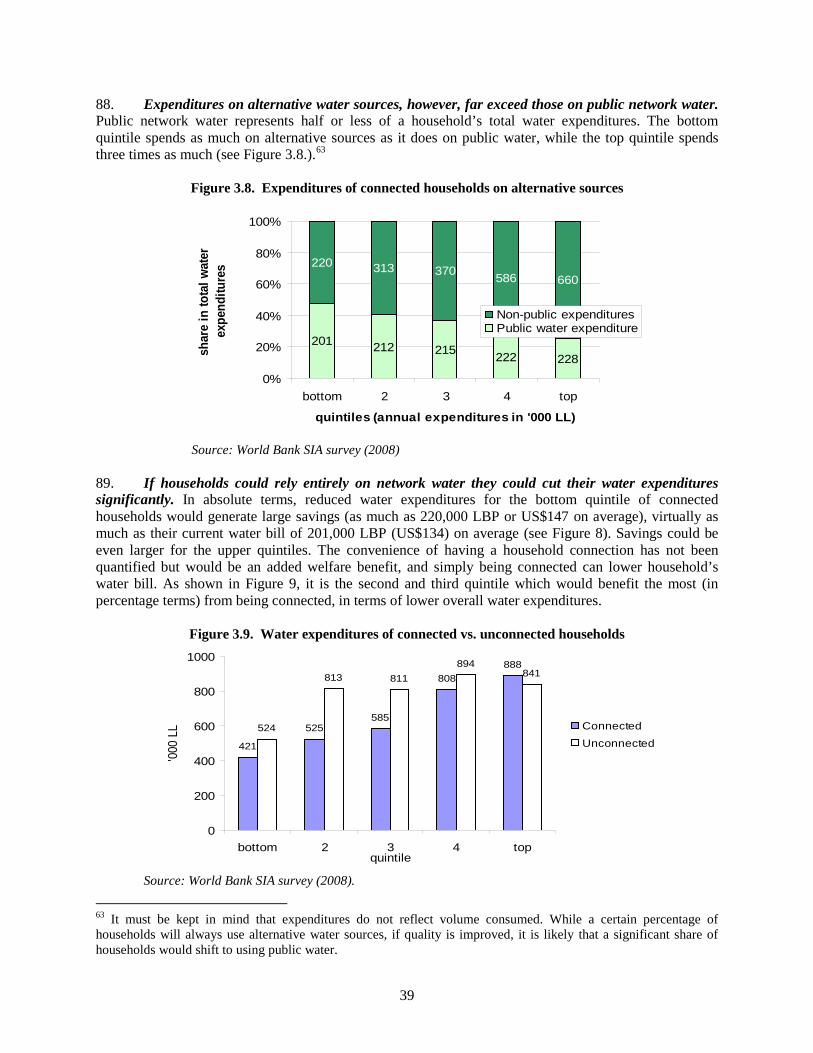
39
88. Expenditures on alternative water sources, however, far exceed those on public network water. Public network water represents half or less of a household’s total water expenditures. The bottom quintile spends as much on alternative sources as it does on public water, while the top quintile spends three times as much (see Figure 3.8.).63
Figure 3.8. Expenditures of connected households on alternative sources
201 212 215 222 228
220 313 370 586 660
0%
20%
40%
60%
80%
100%
bottom 2 3 4 top
quintiles (annual expenditures in '000 LL)
shar
e in
tota
l wat
er
expe
nditu
res
Non-public expendituresPublic water expenditure
Source: World Bank SIA survey (2008)
89. If households could rely entirely on network water they could cut their water expenditures significantly. In absolute terms, reduced water expenditures for the bottom quintile of connected households would generate large savings (as much as 220,000 LBP or US$147 on average), virtually as much as their current water bill of 201,000 LBP (US$134) on average (see Figure 8). Savings could be even larger for the upper quintiles. The convenience of having a household connection has not been quantified but would be an added welfare benefit, and simply being connected can lower household’s water bill. As shown in Figure 9, it is the second and third quintile which would benefit the most (in percentage terms) from being connected, in terms of lower overall water expenditures.
Figure 3.9. Water expenditures of connected vs. unconnected households
421
525585
808888
524
813 811894
841
0
200
400
600
800
1000
bottom 2 3 4 topquintile
'000
LL Connected
Unconnected
Source: World Bank SIA survey (2008).
63 It must be kept in mind that expenditures do not reflect volume consumed. While a certain percentage of households will always use alternative water sources, if quality is improved, it is likely that a significant share of households would shift to using public water.

40
90. Public network water is inexpensive in financial terms, but the cost of unreliability is considerable. Public water might appear relatively cheap, but higher effective price and the indirect costs of unreliable supply make more expensive options attractive. Lebanese households spend approximately US$208 million total per year on bottled water (in small bottles or gallons) over the past year. The unit cost of water purchased in gallon bottles, ranges from US$100 to US$220 per m3, while bottled water in small bottles (1.5 liter) costs up to US$ 500 per m3 (see Table 3.7.).64 If households could rely entirely on network water it would cost them US$0.29 – 0.42 per 1 m3, but since very few receive 1 m3/day, and many are not satisfied with the quality, they essentially pay considerably more.65
Artesian wells and private networks are already cheaper but, at least in the former case, quality is often quite poor.
Table 3.7. Estimated volume vs. non-volumetric unit costs for water Water source Range of costs (US$/m3)
Low High Public network 0.29 – 0.42 na Water truck 3 6 Gallon bottles 100 220 Small bottles 440 500
Average annual payment (US $) Public network 143 Artesian well 126 Private network 82
Source: World Bank SIA survey (2008) and informal market assessment 91. Lebanese households with a public water connection spend twice as much on alternative water sources than they are billed by RWAs. Estimates based on the SIA survey suggest that connected households spend US$219 million on all kinds of alternative water sources, far more than the maximum of US$104 million which RWAs collect annually (on the assumption of full payment compliance).66
64 Of course, the comparison must be understood within context – no one consumes bottled water in cubic meters. Still, the potentially ‘unnecessary’ cost adds up to a significant additional household budget item. 65 The low range for public network water is based on the best case scenario of a household receiving 1m3/day in Bekaa (the annual cost of 160,000 LBP divided by 365 days) and in BML (235,000 LBP divided by 365 days). The high range cannot be calculated, but can be summarized as: the less water received per day, the higher the volumetric cost. A household that receives no water over the course of the year would, in theory, face an infinite cost per m3. In practice, such households do not pay their bills. 66 Because non-payment among residential consumers is a widespread problem, the amount RWAs actually collect will be considerably less than this amount.
This is in addition to the US$88 million spent on alternative, non-network water sources by non-connected households.
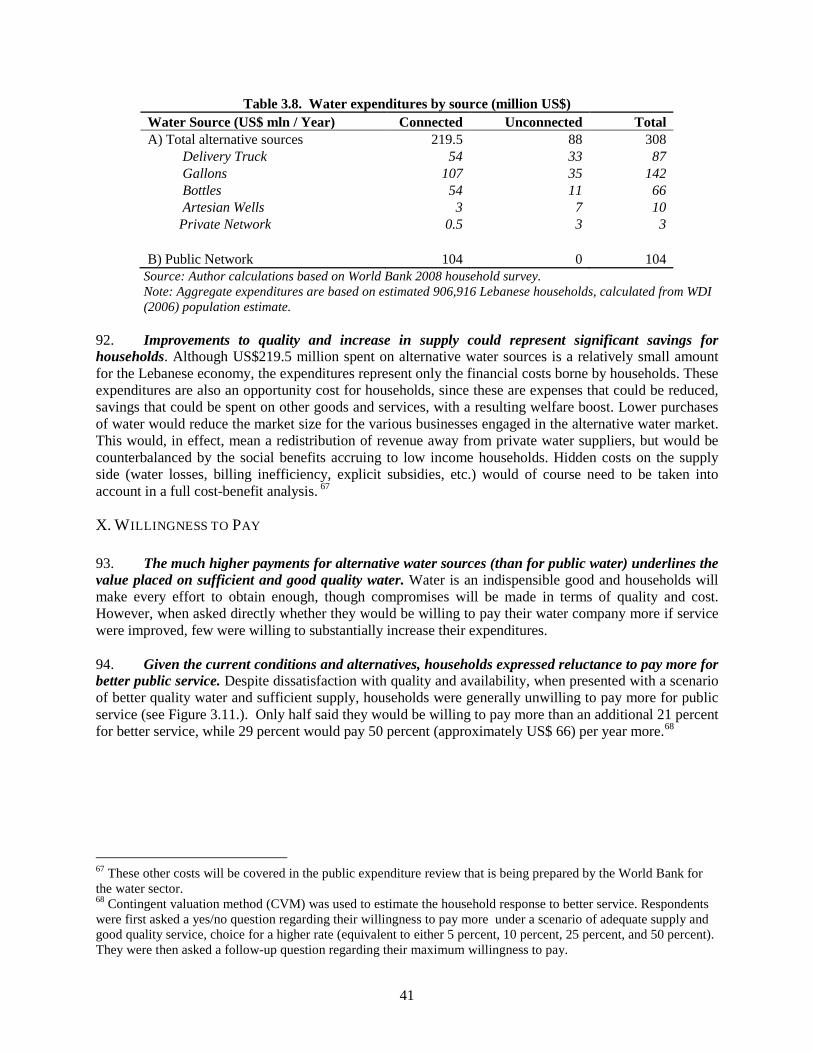
41
Table 3.8. Water expenditures by source (million US$) Water Source (US$ mln / Year) Connected Unconnected Total A) Total alternative sources 219.5 88 308 Delivery Truck 54 33 87 Gallons 107 35 142 Bottles 54 11 66 Artesian Wells 3 7 10 Private Network 0.5 3 3 B) Public Network 104 0 104
Source: Author calculations based on World Bank 2008 household survey. Note: Aggregate expenditures are based on estimated 906,916 Lebanese households, calculated from WDI (2006) population estimate.
92. Improvements to quality and increase in supply could represent significant savings for households. Although US$219.5 million spent on alternative water sources is a relatively small amount for the Lebanese economy, the expenditures represent only the financial costs borne by households. These expenditures are also an opportunity cost for households, since these are expenses that could be reduced, savings that could be spent on other goods and services, with a resulting welfare boost. Lower purchases of water would reduce the market size for the various businesses engaged in the alternative water market. This would, in effect, mean a redistribution of revenue away from private water suppliers, but would be counterbalanced by the social benefits accruing to low income households. Hidden costs on the supply side (water losses, billing inefficiency, explicit subsidies, etc.) would of course need to be taken into account in a full cost-benefit analysis. 67
X. WILLINGNESS TO PAY
93. The much higher payments for alternative water sources (than for public water) underlines the value placed on sufficient and good quality water. Water is an indispensible good and households will make every effort to obtain enough, though compromises will be made in terms of quality and cost. However, when asked directly whether they would be willing to pay their water company more if service were improved, few were willing to substantially increase their expenditures. 94. Given the current conditions and alternatives, households expressed reluctance to pay more for better public service. Despite dissatisfaction with quality and availability, when presented with a scenario of better quality water and sufficient supply, households were generally unwilling to pay more for public service (see Figure 3.11.). Only half said they would be willing to pay more than an additional 21 percent for better service, while 29 percent would pay 50 percent (approximately US$ 66) per year more.68
67 These other costs will be covered in the public expenditure review that is being prepared by the World Bank for the water sector. 68 Contingent valuation method (CVM) was used to estimate the household response to better service. Respondents were first asked a yes/no question regarding their willingness to pay more under a scenario of adequate supply and good quality service, choice for a higher rate (equivalent to either 5 percent, 10 percent, 25 percent, and 50 percent). They were then asked a follow-up question regarding their maximum willingness to pay.
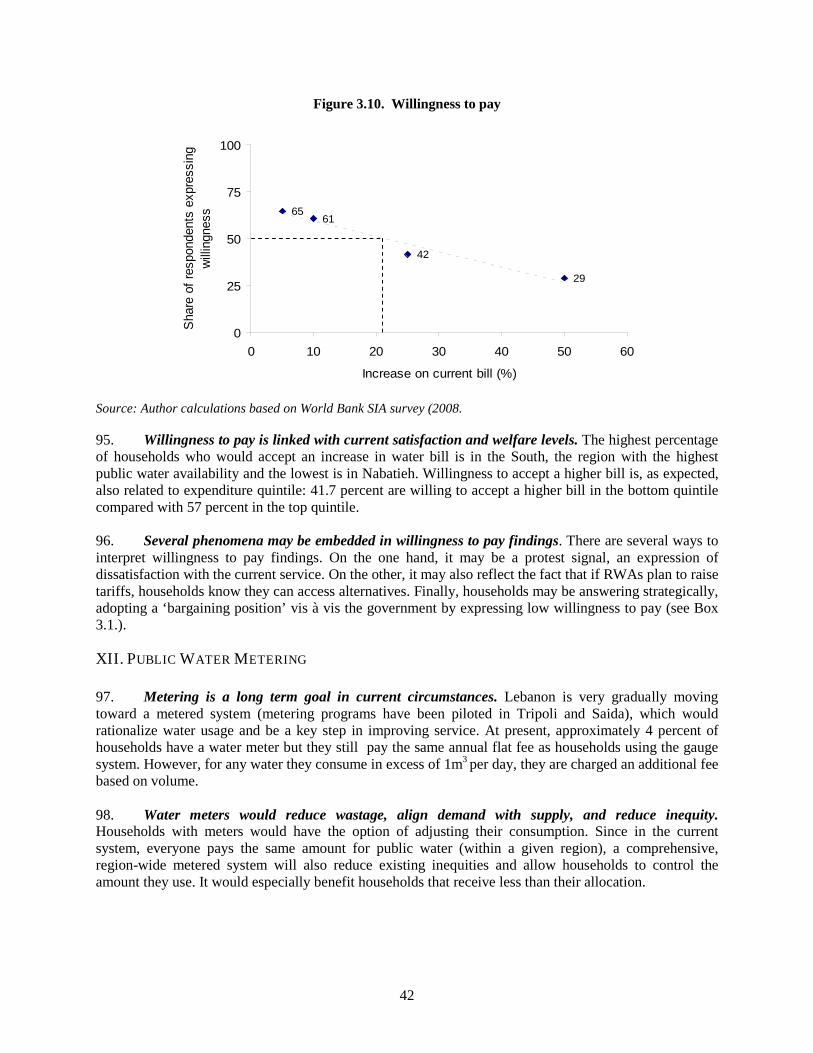
42
Figure 3.10. Willingness to pay
6561
42
29
0
25
50
75
100
0 10 20 30 40 50 60
Increase on current bill (%)
Sha
re o
f res
pond
ents
exp
ress
ing
will
ingn
ess
Source: Author calculations based on World Bank SIA survey (2008. 95. Willingness to pay is linked with current satisfaction and welfare levels. The highest percentage of households who would accept an increase in water bill is in the South, the region with the highest public water availability and the lowest is in Nabatieh. Willingness to accept a higher bill is, as expected, also related to expenditure quintile: 41.7 percent are willing to accept a higher bill in the bottom quintile compared with 57 percent in the top quintile. 96. Several phenomena may be embedded in willingness to pay findings. There are several ways to interpret willingness to pay findings. On the one hand, it may be a protest signal, an expression of dissatisfaction with the current service. On the other, it may also reflect the fact that if RWAs plan to raise tariffs, households know they can access alternatives. Finally, households may be answering strategically, adopting a ‘bargaining position’ vis à vis the government by expressing low willingness to pay (see Box 3.1.).
XII. PUBLIC WATER METERING 97. Metering is a long term goal in current circumstances. Lebanon is very gradually moving toward a metered system (metering programs have been piloted in Tripoli and Saida), which would rationalize water usage and be a key step in improving service. At present, approximately 4 percent of households have a water meter but they still pay the same annual flat fee as households using the gauge system. However, for any water they consume in excess of 1m3
per day, they are charged an additional fee based on volume. 98. Water meters would reduce wastage, align demand with supply, and reduce inequity. Households with meters would have the option of adjusting their consumption. Since in the current system, everyone pays the same amount for public water (within a given region), a comprehensive, region-wide metered system will also reduce existing inequities and allow households to control the amount they use. It would especially benefit households that receive less than their allocation.
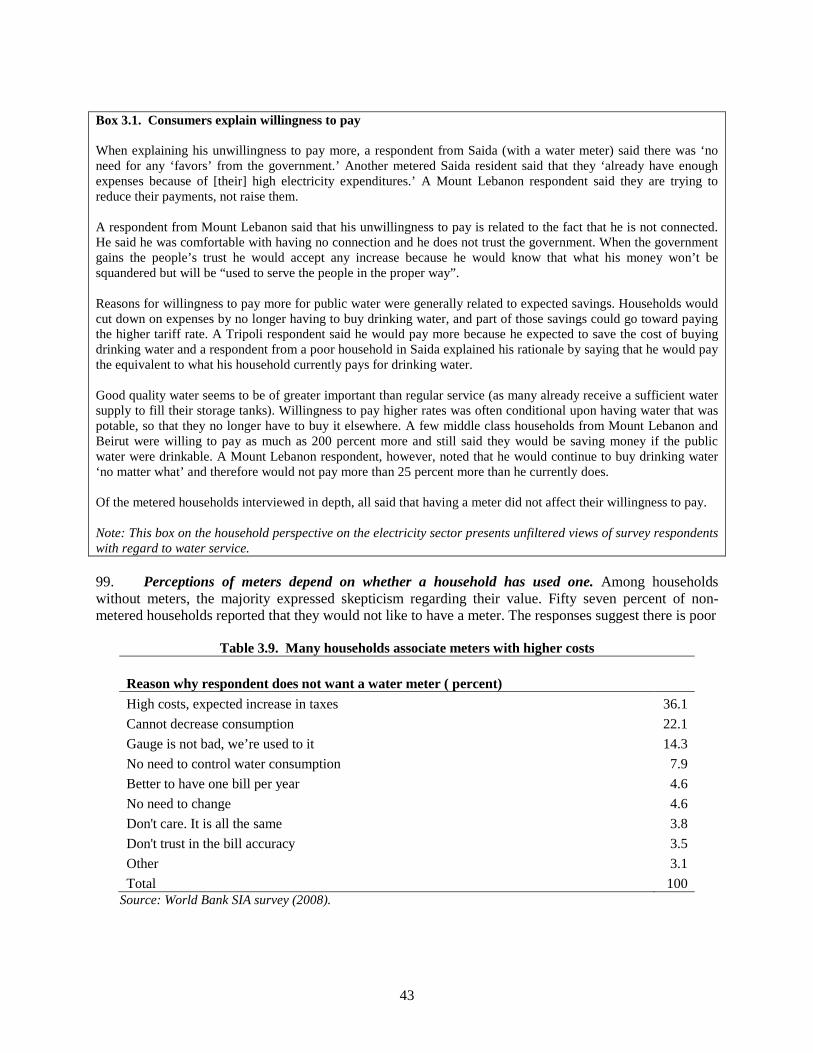
43
Box 3.1. Consumers explain willingness to pay When explaining his unwillingness to pay more, a respondent from Saida (with a water meter) said there was ‘no need for any ‘favors’ from the government.’ Another metered Saida resident said that they ‘already have enough expenses because of [their] high electricity expenditures.’ A Mount Lebanon respondent said they are trying to reduce their payments, not raise them. A respondent from Mount Lebanon said that his unwillingness to pay is related to the fact that he is not connected. He said he was comfortable with having no connection and he does not trust the government. When the government gains the people’s trust he would accept any increase because he would know that what his money won’t be squandered but will be “used to serve the people in the proper way”. Reasons for willingness to pay more for public water were generally related to expected savings. Households would cut down on expenses by no longer having to buy drinking water, and part of those savings could go toward paying the higher tariff rate. A Tripoli respondent said he would pay more because he expected to save the cost of buying drinking water and a respondent from a poor household in Saida explained his rationale by saying that he would pay the equivalent to what his household currently pays for drinking water. Good quality water seems to be of greater important than regular service (as many already receive a sufficient water supply to fill their storage tanks). Willingness to pay higher rates was often conditional upon having water that was potable, so that they no longer have to buy it elsewhere. A few middle class households from Mount Lebanon and Beirut were willing to pay as much as 200 percent more and still said they would be saving money if the public water were drinkable. A Mount Lebanon respondent, however, noted that he would continue to buy drinking water ‘no matter what’ and therefore would not pay more than 25 percent more than he currently does. Of the metered households interviewed in depth, all said that having a meter did not affect their willingness to pay. Note: This box on the household perspective on the electricity sector presents unfiltered views of survey respondents with regard to water service. 99. Perceptions of meters depend on whether a household has used one. Among households without meters, the majority expressed skepticism regarding their value. Fifty seven percent of non-metered households reported that they would not like to have a meter. The responses suggest there is poor
Table 3.9. Many households associate meters with higher costs
Reason why respondent does not want a water meter ( percent) High costs, expected increase in taxes 36.1 Cannot decrease consumption 22.1 Gauge is not bad, we’re used to it 14.3 No need to control water consumption 7.9 Better to have one bill per year 4.6 No need to change 4.6 Don't care. It is all the same 3.8 Don't trust in the bill accuracy 3.5 Other 3.1 Total 100
Source: World Bank SIA survey (2008).

44
understanding of the benefits of moving to a metered system, specifically how it would affect household consumption and expenditures. Many see them as part of a new initiative aimed at raising prices. Some believe it will restrict them to a certain consumption level. 100. In contrast, households with meters consider themselves better off. Of the small group that has meters,69
95.5 percent consider themselves better off than before. Those who support meters note that it allows households to control consumption levels, and introduce fairness into the system.
101. Increasing water supply and improving its quality has cost implications for RWAs. Unless such reform measures are combined with tariff increases, RWAs have little incentive (from a commercial operations perspective) to increase supply since it will not translate into increased revenue—the flat fee structure means that the water company is not rewarded for increasing supply. It is therefore likely that water production and distribution will continue to require subsidies. Meters, by linking supply and demand, would go some way toward addressing this problem, but universal roll-out of a metering program is a long term process.
XII. CONCLUSIONS 102. Invest in improving water quality to generate positive health and financial returns for households. A focus on improving quality and reducing losses, if accompanied by a public awareness campaign, would have direct effect on welfare. In Lebanon, the burden on poor households comes from poor quality and low public water supply, rather than high expenditures. Water expenditures by the low income households are in line with international norms but could be reduced if households relied less on alternative sources. Although compared to other problems in water provision, reducing expenditures for consumers is not the top priority, the costs which consumers bear in terms of quality of service—poor reliability and potential health risks—are significant. Among the sector’s reform requirements, this may be a relatively inexpensive step to take. The benefits of this type of intermediate measures, while a metering program is rolled out, would accrue to all households, but many of the poorest would experience the most immediate impact because of the constraints they face in sometimes costly alternative water sources. 103. A rapid rollout of metering is needed if wastage and equity issues are to be addressed. Both Regional Water Authorities and consumers lose when supply and demand are delinked by the current flat fee structure. Water companies cannot charge the marginal cost of production, and consumers do not get what they pay for. The pilot metering programs show that metering can be introduced, but unless metering is either region-wide (so that all households under a RWA use the same billing system) or metered households are able to pay by volume, the benefits of metering will not materialize. 104. To increase revenues, RWAs will need to revisit household concerns. RWAs can increase revenues in two ways, through improved bill collection and through tariff increases. In either case, RWAs will need to revise both the informal and the formal contractual agreements with households, raising tariffs and installing meters to link supply with demand, while also investing in improvements in quality. They will also need to strengthen collection enforcement mechanism. 105. Adopt a clear framework for reform sequencing by balancing costs and benefits between consumers and water companies. While the scale and complexity of the improvements precludes them from occurring simultaneously, proper sequencing of reform measures will be crucial to their successful implementation and acceptance by stakeholders. Reform will likely need to be based on negotiating a
69 N = 66 in the SIA survey
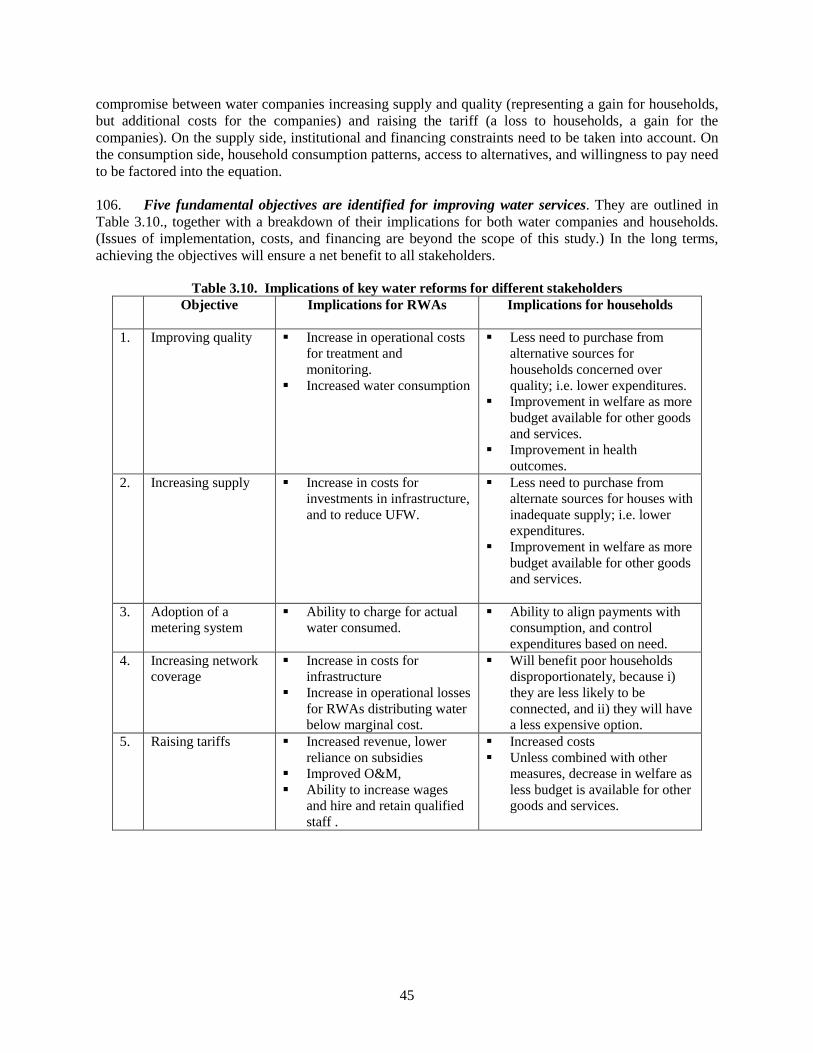
45
compromise between water companies increasing supply and quality (representing a gain for households, but additional costs for the companies) and raising the tariff (a loss to households, a gain for the companies). On the supply side, institutional and financing constraints need to be taken into account. On the consumption side, household consumption patterns, access to alternatives, and willingness to pay need to be factored into the equation. 106. Five fundamental objectives are identified for improving water services. They are outlined in Table 3.10., together with a breakdown of their implications for both water companies and households. (Issues of implementation, costs, and financing are beyond the scope of this study.) In the long terms, achieving the objectives will ensure a net benefit to all stakeholders.
Table 3.10. Implications of key water reforms for different stakeholders
Objective
Implications for RWAs Implications for households
1. Improving quality
Increase in operational costs for treatment and monitoring.
Increased water consumption
Less need to purchase from alternative sources for households concerned over quality; i.e. lower expenditures.
Improvement in welfare as more budget available for other goods and services.
Improvement in health outcomes.
2. Increasing supply
Increase in costs for investments in infrastructure, and to reduce UFW.
Less need to purchase from alternate sources for houses with inadequate supply; i.e. lower expenditures.
Improvement in welfare as more budget available for other goods and services.
3. Adoption of a
metering system Ability to charge for actual
water consumed. Ability to align payments with
consumption, and control expenditures based on need.
4. Increasing network coverage
Increase in costs for infrastructure
Increase in operational losses for RWAs distributing water below marginal cost.
Will benefit poor households disproportionately, because i) they are less likely to be connected, and ii) they will have a less expensive option.
5. Raising tariffs Increased revenue, lower reliance on subsidies
Improved O&M, Ability to increase wages
and hire and retain qualified staff .
Increased costs Unless combined with other
measures, decrease in welfare as less budget is available for other goods and services.
46
ANNEXES
ANNEX I: METHODOLOGY I. SUMMARY OF SURVEY METHODOLOGY 1. Primary data was collected for the study using both quantitative and qualitative research methods. A quantitative survey was conducted targeting 1804 households, representative at the Mohafaza (region) level. The sample was also selected to be geographically diverse (urban, rural, central, peripheral, densely populated, semi-deserted, etc.). The survey was conducted from April to June 2008 (and was only briefly disrupted by the May crisis). The results were analyzed to determine the consumption patterns and the willingness to pay of households according to region, welfare category and other variables of interest. The selected welfare indicator is expenditure per adult equivalent. 2. In addition to the quantitative survey, qualitative in-depth interviews were conducted with selected profiles (households, municipalities, generator owners, EDL collectors and building managers) in order to elicit more in-depth understanding of the issues. These interviews were conducted in three waves: before (10), during (21) and following the quantitative survey (20). New questions were added for the final wave based on the quantitative analysis. II. QUANTITATIVE SURVEY 3. The absence of a sampling base in Lebanon necessitates the development of a tailored for every study. Thus, for the purpose of this World Bank study, the Consultation and Research Institute designed an approach that takes into account lack of access to the latest data from official sources.
i) A target sample size of 1800 was established. The unit of observation was the household, with the Palestinian refugee camps excluded. Only primary dwellings were targeted. ii) The sample was stratified by Mohafaza (region) based on the household distribution by Mohafaza published in 2004 by the Central Administration for Statistics (CAS). For instance, the Mohafaza of North Lebanon accounts for 18.45% of households in Lebanon; therefore 332 of the 1800 questionnaires were completed in North Lebanon. iii) Within each Mohafaza, the sample was stratified by Caza following the population distribution published by CAS in 1997.70
For instance, the Caza of Akkar accounts for 31.35% of the residents of North Lebanon; therefore 104 of the 332 questionnaires were completed in Akkar.
iv) At the Caza level, the sample was stratified by Circonscription Foncière (CF) the smallest administrative unit in Lebanon. Sampling was based on the CAS 1997 population distribution. On the CF level, two steps were followed in order to obtain a good representation of the population, both in densely populated and in the more ‘peripheral’ areas. The proposed approach allowed the inclusion of peripheral areas in the sample while keeping transportation costs and commuting effort under control. Based on this estimation, the most densely populated CFs were first selected and the number of questionnaires completed was determined based on their relative weights in terms of population. In CFs where 3 questionnaires would have completed, the number was increased to 4 questionnaires. In a second step, the remaining questionnaires were distributed
70 2004 survey is limited only to Mohafazat level
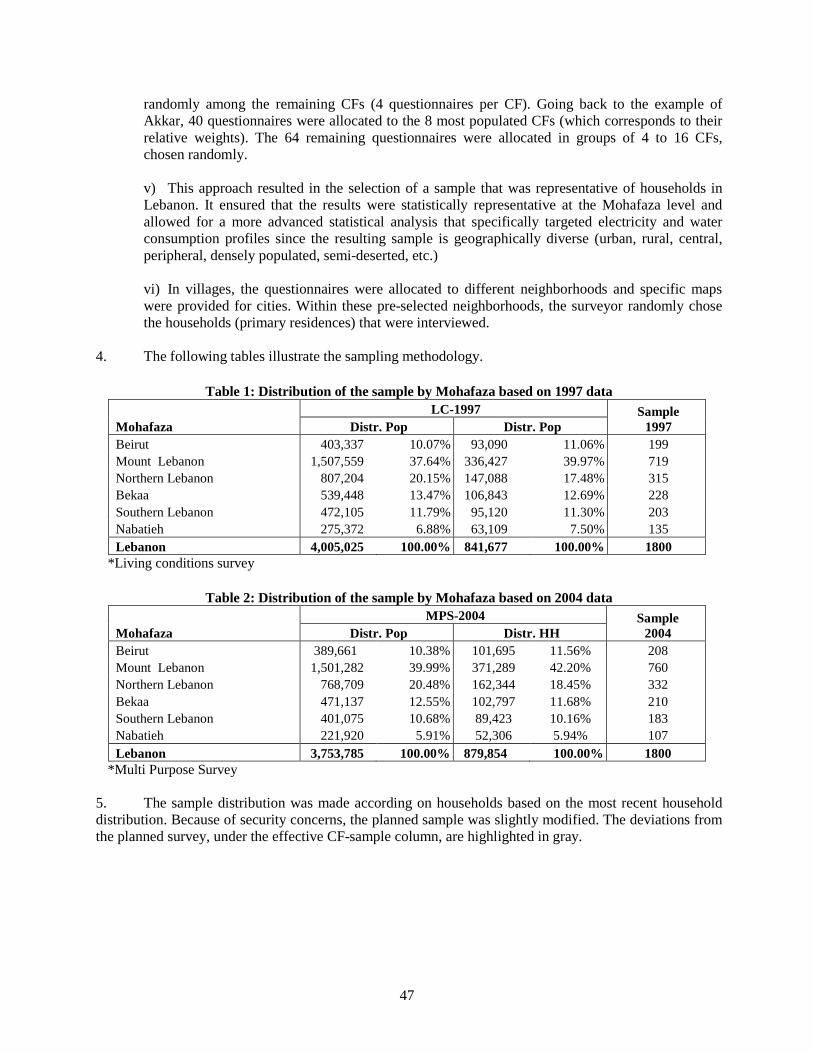
47
randomly among the remaining CFs (4 questionnaires per CF). Going back to the example of Akkar, 40 questionnaires were allocated to the 8 most populated CFs (which corresponds to their relative weights). The 64 remaining questionnaires were allocated in groups of 4 to 16 CFs, chosen randomly. v) This approach resulted in the selection of a sample that was representative of households in Lebanon. It ensured that the results were statistically representative at the Mohafaza level and allowed for a more advanced statistical analysis that specifically targeted electricity and water consumption profiles since the resulting sample is geographically diverse (urban, rural, central, peripheral, densely populated, semi-deserted, etc.) vi) In villages, the questionnaires were allocated to different neighborhoods and specific maps were provided for cities. Within these pre-selected neighborhoods, the surveyor randomly chose the households (primary residences) that were interviewed.
4. The following tables illustrate the sampling methodology.
Table 1: Distribution of the sample by Mohafaza based on 1997 data LC-1997 Sample
1997 Mohafaza Distr. Pop Distr. Pop Beirut 403,337 10.07% 93,090 11.06% 199 Mount Lebanon 1,507,559 37.64% 336,427 39.97% 719 Northern Lebanon 807,204 20.15% 147,088 17.48% 315 Bekaa 539,448 13.47% 106,843 12.69% 228 Southern Lebanon 472,105 11.79% 95,120 11.30% 203 Nabatieh 275,372 6.88% 63,109 7.50% 135 Lebanon 4,005,025 100.00% 841,677 100.00% 1800
*Living conditions survey
Table 2: Distribution of the sample by Mohafaza based on 2004 data MPS-2004 Sample
2004 Mohafaza Distr. Pop Distr. HH Beirut 389,661 10.38% 101,695 11.56% 208 Mount Lebanon 1,501,282 39.99% 371,289 42.20% 760 Northern Lebanon 768,709 20.48% 162,344 18.45% 332 Bekaa 471,137 12.55% 102,797 11.68% 210 Southern Lebanon 401,075 10.68% 89,423 10.16% 183 Nabatieh 221,920 5.91% 52,306 5.94% 107 Lebanon 3,753,785 100.00% 879,854 100.00% 1800
*Multi Purpose Survey 5. The sample distribution was made according on households based on the most recent household distribution. Because of security concerns, the planned sample was slightly modified. The deviations from the planned survey, under the effective CF-sample column, are highlighted in gray.
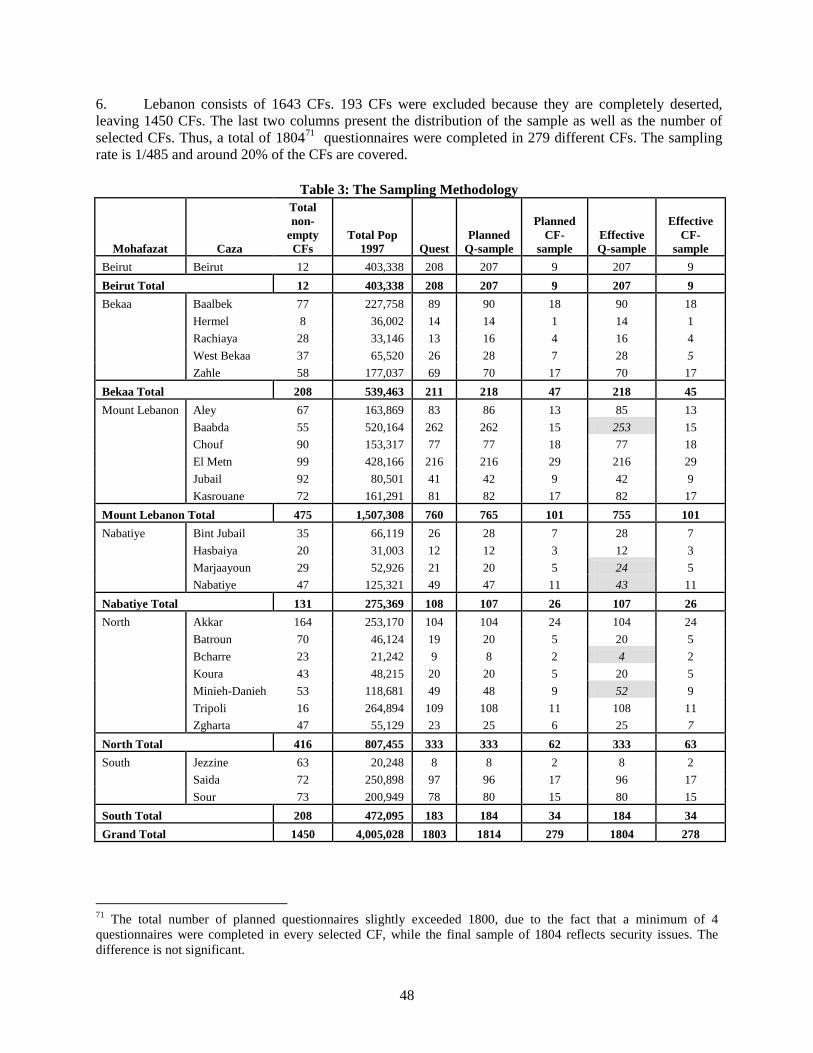
48
6. Lebanon consists of 1643 CFs. 193 CFs were excluded because they are completely deserted, leaving 1450 CFs. The last two columns present the distribution of the sample as well as the number of selected CFs. Thus, a total of 180471
Table 3: The Sampling Methodology
questionnaires were completed in 279 different CFs. The sampling rate is 1/485 and around 20% of the CFs are covered.
Mohafazat Caza
Total non-
empty CFs
Total Pop 1997 Quest
Planned Q-sample
Planned CF-
sample Effective Q-sample
Effective CF-
sample Beirut Beirut 12 403,338 208 207 9 207 9 Beirut Total 12 403,338 208 207 9 207 9 Bekaa Baalbek 77 227,758 89 90 18 90 18 Hermel 8 36,002 14 14 1 14 1 Rachiaya 28 33,146 13 16 4 16 4 West Bekaa 37 65,520 26 28 7 28 5 Zahle 58 177,037 69 70 17 70 17 Bekaa Total 208 539,463 211 218 47 218 45 Mount Lebanon Aley 67 163,869 83 86 13 85 13 Baabda 55 520,164 262 262 15 253 15 Chouf 90 153,317 77 77 18 77 18 El Metn 99 428,166 216 216 29 216 29 Jubail 92 80,501 41 42 9 42 9 Kasrouane 72 161,291 81 82 17 82 17 Mount Lebanon Total 475 1,507,308 760 765 101 755 101 Nabatiye Bint Jubail 35 66,119 26 28 7 28 7 Hasbaiya 20 31,003 12 12 3 12 3 Marjaayoun 29 52,926 21 20 5 24 5 Nabatiye 47 125,321 49 47 11 43 11 Nabatiye Total 131 275,369 108 107 26 107 26 North Akkar 164 253,170 104 104 24 104 24 Batroun 70 46,124 19 20 5 20 5 Bcharre 23 21,242 9 8 2 4 2 Koura 43 48,215 20 20 5 20 5 Minieh-Danieh 53 118,681 49 48 9 52 9 Tripoli 16 264,894 109 108 11 108 11 Zgharta 47 55,129 23 25 6 25 7 North Total 416 807,455 333 333 62 333 63 South Jezzine 63 20,248 8 8 2 8 2 Saida 72 250,898 97 96 17 96 17 Sour 73 200,949 78 80 15 80 15 South Total 208 472,095 183 184 34 184 34 Grand Total 1450 4,005,028 1803 1814 279 1804 278
71 The total number of planned questionnaires slightly exceeded 1800, due to the fact that a minimum of 4 questionnaires were completed in every selected CF, while the final sample of 1804 reflects security issues. The difference is not significant.
49
III. FIELD LIMITATIONS 7. During the field survey, surveyors were faces with some difficulties. These difficulties were related to two reasons: (a) the security situation that arose during the first half of May, and (b) the non-responses of some households.
i) Delays due to security reasons and political instability. The field survey was launched in April 28, 2008. An interruption took place between May 7 and May 19, mainly in Beirut and some areas of Mount-Lebanon, then later on in Tripoli and its surrounding areas, due to security reasons, where it was not safe to go to the field during the period of armed tensions in those areas. The field surveyors had to wait for a few days after the end of the armed conflict in order for the situation settle and the residents to have gone back to their normal daily lives.
ii) Non-responses. Surveyors faced some problems related to the cooperation of some households. There were five main problems pertaining to this issue: a. Rich areas: Response rates appeared to be lower in richer areas where the surveyors had
sometimes to visit around 10 households before getting a positive response. It should be noted however that the quotas were respected and the households were selected within the determined clusters.
b. Political instability and high tensions: People were sometime afraid to answer the questions due to security reasons and were hesitant in receiving the surveyors.
c. Electricity issue: This is a sensitive issue in general in the country and thus some people were reluctant to go into details in answering the questions
d. Long Questionnaire: The questionnaire was considered too long by some respondents, so they sometimes did not want to continue answering the entire questionnaire. Questionnaires filled by these households were excluded from the sample.
IV. EXPENDITURE DATA 8. The survey collected household expenditure data using recall methodology. The questionnaire identified 18 expenditure categories comparable to the 2004 household living conditions survey. These categories are: food, clothing and footwear, rent or mortgage, fixed line telephone, mobile telephone, internet fees, cable fee televisions, gas, house maintenance and cleaning supplies, housekeeping and nanny services, durable goods, healthcare and medicine, public transport, gas for automobile, repairs for automobile, automobile insurance and taxes, education, leisure and travel. The survey asked the household members responsible for family budget to recall spending on each category for the most convenient time period (daily, weekly, monthly or yearly). To improve recall outcomes, assistance was given to interviewed individuals in listing the various components of each spending category especially when it came to recalling expenditure on durable goods, and to a lesser extent for education and leisure and travel. 9. Data collected was adjusted to reflect yearly household expenditure on a per capita basis. The total sample of households that recalled all expenditure categories is 1,389 accounting for around 77% of the total sample surveyed. This is the sample size that was used to construct per capita expenditure quintiles which are used in the analysis to rank households according to welfare status. It should be noted that control variables were used to check for the consistency and validity of the responses obtained. These measures include comparing expenditure declared to questions on asset ownership especially when it comes to spending related to cars; and comparing expenditure on some services such as telephone and internet to current market prices for those services. Regional representativeness of the survey was not affected as the 1,389 households in the sample maintained a similar distribution on a Mohafaza level as the complete sample of 1804 households.

50
10. It should be noted that the 2008 SIA might be underestimating household expenditures. First, households tend to under-report spending when using recall, and second, fieldwork found that the highest rate of non-responses or unwillingness to participate in the survey came from rich households. 11. Due to time and budget limitations a more detailed expenditure survey based on expenditure diaries and price adjustments was not possible at this stage. However, comparisons to the Lebanon 2004 Household Conditions Survey, which used such methodology on around 7,000 households, revealed the validity of the expenditure data collected by the 2008 SIA. Although validity with 2004 was assessed and found to be good, the expenditures are nonetheless not comparable at an absolute level since different methodologies were used (recall vs. expenditure diary). However, households distribution across quintiles was not affected as families in same quintiles had similar characteristics in both surveys. This was validated by looking at household ownership of various assets in both surveys. 12. It should be noted that the study uses household quintiles rather that population quintiles. While in either case the bottom quintile includes the poorest members of society, using the household unit as a point of comparison means that quintiles will not represent equal shares of the population. Because lower income households are larger (in Lebanon there are on average 5.6 household members in the bottom quintile against 4.4 top quintile) this means that the bottom household quintile comprises a larger share o the total population than the bottom population quintile would. To be precise, there are 1.02 million persons in the bottom quintile compared with 0.79 million persons in the top quintile. V. ELECTRICITY CONSUMPTION TARIFF SIMULATION MODEL Database
Based on data collected from survey of 1804 households in Lebanon, May-June, 2008. Stratified random sample representative at the Circonscription Foncière (the smallest
administrative unit in Lebanon) level.72
Uses data on electricity expenditures (LBP), consumption (kWh), and ampere levels from 754 households.
Generates consumption estimates at representative level. Uses household expenditure data (generated by recall questions on 18 expenditure items) to
disaggregate households by welfare category. Description: 13. The model disaggregates fixed and variable costs of electricity bills. The quantity of kWh consumed is derived from the price per kWh, the stamp fee, the rehabilitation fee, the ampere charge, and the tax (which applies to everything except the stamp fee). 14. From the household survey, data was collected on the total electricity bill (average peak, off-peak, and last bill paid), amperes and phase (mono or tri). Not all respondents could or would reveal the actual kWh consumed, based on the last month’s bill. Thus, it was first necessary to determine how many kWh the household consumed. The total expenditures and amperes are entered; and quintile and regional category averages are calculated. 15. Two models were used. Model 1 does not include an estimator for elasticity, but allows changing the levels of individual tariff tranches, as well as other parameters. Model 2 includes an estimator for 72 There are 1450 inhabited Circonscription Foncière in Lebanon. 193 are uninhabited and were excluded from the sample.
51
elasticity based on analysis from the Energy Sector PER. However, it does not allow for changing individual tariff levels; only across the board tariff changes are possible, i.e. all tranches are changed by the same amount. Simulations 16. The model allows: Calculation of household electricity consumption based on expenditure and ampere data Calculation of what tariff tranche household x is consuming. Calculation of mean tariff (LBP/kWh) paid by household x. Calculation of mean tariff paid by all households in Lebanon. Translation of willingness to pay (WTP) from responses in LBPs relative to their total bill into
percentage tariff increases. Estimates of how changes in tariffs, either overall or per tranche, impact households in terms of
electricity expenditures, for each welfare group.

52
ANNEX II: THE PRIVATE ELECTRICITY GENERATION BUSINESS 1. Private electricity generator businesses have been around since the 1990s and occupy a well-established corner of the energy market. In the absence of reliable electricity, they play an essential role in Lebanon by filling the gap in service provided by EdL. They are far more expensive than public electricity but many individuals and businesses could not manage without them. 2. Most generator businesses employ two to four persons, operate generators from 100 KVA to 350 KVA and more (which cost from US$15,000 to $60,000). They sell electricity back-up service to both businesses and households, with the latter predominating. As with EdL, they cannot always distinguish between business and residential clients since many clients run businesses from their homes. Private generator businesses typically have several hundred subscribers, and may cover an entire village or town. The owner may have other businesses as well. 3. A potential subscriber contacts the generator service in his or her area and enters a contract for a fixed amount of amperes per month, typically 5 or 10 kVa. A collector comes by to collect the payment. The generator owner installs boxes in subscribing buildings and equips them with breakers. Although these businesses are informal, and not covered by any legislation (there is no law in Lebanon which either allows or prohibits private generator businesses), they fill an important and recognized need in the market and thus are tolerated. 4. In some cases the private generator businesses pay a modest monthly fee (e.g. US$100) to the municipality, as in the case of Shiah. Several years ago in Saida a proposal was put forward to tax generators, taking a small percentage of their profits, but when they protested the idea was dropped. In Tripoli a proposal to charge generator owners US$1per kVa was also not followed through. These examples suggest that private generators not only operate outside the legal framework, but have been generally successful at thwarting local government attempts at imposing fairly modest taxes. The generators owners interviewed for this study reported revenues ranging from LBP 10 million to 30 million (USD6,000 to 20,000) per month although all complained that their profit margins had eroded with the increase in oil prices (during spring and summer 2008) and subsequent drop off in subscriptions as they had to raise the monthly price to consumers. 5. Costs include fuel oil, maintenance, oil, filters, replacement of cables and breakers, and rental space. In Table 1 information on the business models of two generators, from Sfeir neighborhood of Beirut and from Tripoli is provided for illustrative purposes. 6. According to a generator owner in Sfeir, prices have stabilized: at 65,000 LBPs for every 5 amperes. Two years ago the price was 40,000 LBPs for 5 amperes and the price of fuel oil was 15,000 LBPs and blackouts only lasted 4 hours. Now, blackouts last a minimum of 8 hours in addition to the fuel oil price increase. For the last two months, [in the spring of 2008] the Ministry [of Energy and Water] has been raising prices every week. As a result, “generators are turning into a free service instead of a profitable business.” 7. The generator business has monopolistic features. Although there are a large number of generator businesses (for example, over 150 in Tripoli alone) there is virtually no competition on price. (In whatever manner a private generator secures rights over an area, it is not through an open tender.) Thus, households cannot choose their subscriber, but must use the one operating in their neighborhood or town. The choices available to a household are straightforward – it can choose to subscribe or not, or it can change its ampere level. Reducing amperes from 10 to 5 kVa, for example, cuts the bill in half. Some households even cut their ampere level to 2.5 kVa.
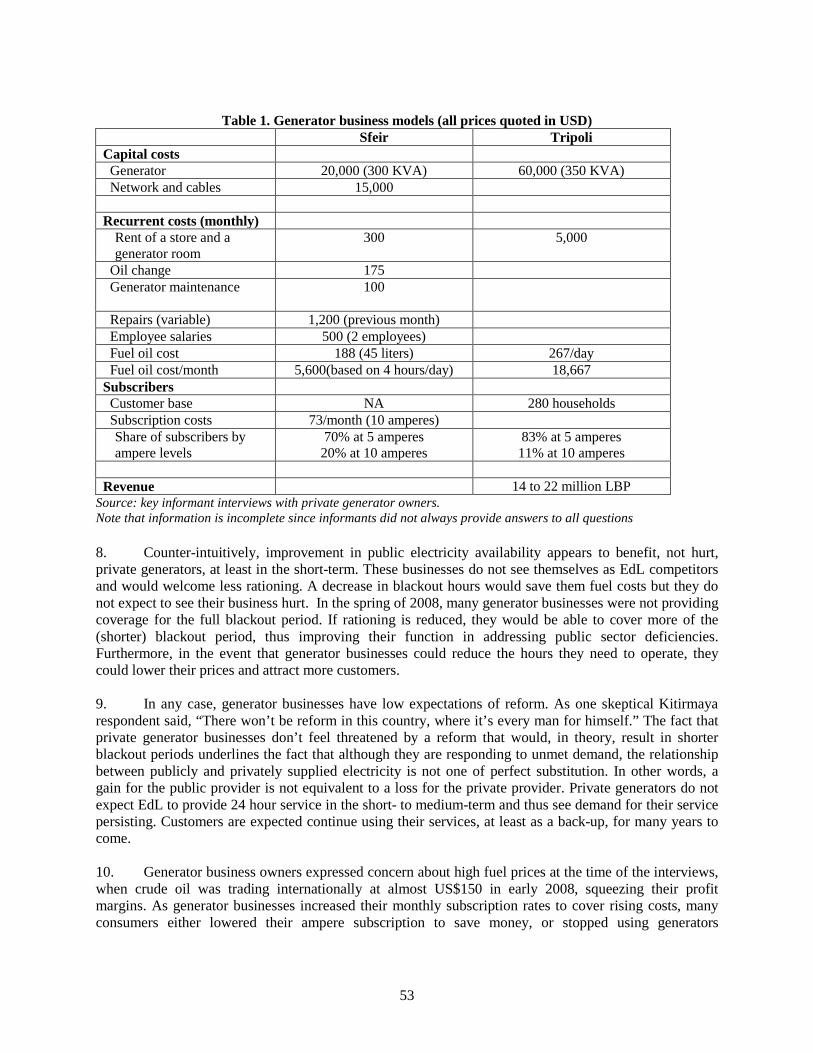
53
Table 1. Generator business models (all prices quoted in USD)
Sfeir Tripoli Capital costs Generator 20,000 (300 KVA) 60,000 (350 KVA) Network and cables 15,000 Recurrent costs (monthly)
Rent of a store and a generator room
300 5,000
Oil change 175 Generator maintenance
100
Repairs (variable) 1,200 (previous month) Employee salaries 500 (2 employees) Fuel oil cost 188 (45 liters) 267/day Fuel oil cost/month 5,600(based on 4 hours/day) 18,667 Subscribers Customer base NA 280 households Subscription costs 73/month (10 amperes)
Share of subscribers by ampere levels
70% at 5 amperes 20% at 10 amperes
83% at 5 amperes 11% at 10 amperes
Revenue 14 to 22 million LBP
Source: key informant interviews with private generator owners. Note that information is incomplete since informants did not always provide answers to all questions 8. Counter-intuitively, improvement in public electricity availability appears to benefit, not hurt, private generators, at least in the short-term. These businesses do not see themselves as EdL competitors and would welcome less rationing. A decrease in blackout hours would save them fuel costs but they do not expect to see their business hurt. In the spring of 2008, many generator businesses were not providing coverage for the full blackout period. If rationing is reduced, they would be able to cover more of the (shorter) blackout period, thus improving their function in addressing public sector deficiencies. Furthermore, in the event that generator businesses could reduce the hours they need to operate, they could lower their prices and attract more customers. 9. In any case, generator businesses have low expectations of reform. As one skeptical Kitirmaya respondent said, “There won’t be reform in this country, where it’s every man for himself.” The fact that private generator businesses don’t feel threatened by a reform that would, in theory, result in shorter blackout periods underlines the fact that although they are responding to unmet demand, the relationship between publicly and privately supplied electricity is not one of perfect substitution. In other words, a gain for the public provider is not equivalent to a loss for the private provider. Private generators do not expect EdL to provide 24 hour service in the short- to medium-term and thus see demand for their service persisting. Customers are expected continue using their services, at least as a back-up, for many years to come. 10. Generator business owners expressed concern about high fuel prices at the time of the interviews, when crude oil was trading internationally at almost US$150 in early 2008, squeezing their profit margins. As generator businesses increased their monthly subscription rates to cover rising costs, many consumers either lowered their ampere subscription to save money, or stopped using generators
54
altogether. On the other hand, as prices come down from their earlier highs, both the public utility provider and the substitute provider stand to gain. 11. The relationship between generator owners and their customers is not without its tensions. It was hypothesized that because private generators are strictly for-profit businesses, unlike EdL which is a state entity providing a common good, households would have fewer complaints: there tend to be fewer illusions in a transaction based on mutual self-interest. However, although consumers clearly exhibit a higher willingness to pay for privately generated electricity than EdL (indicated by the much higher monthly costs for fewer hours of electricity and lower ampere levels), this does not translate directly into customer satisfaction. Very few households were completely satisfied with the service they received from the generator owner, and this was mainly because they do not cover the entire blackout period. One rural household complained that the generator he subscribes to rations electricity just like EdL and turns the generator off at 10 or 11 at night. A Saida household said that the generator owner exploits people by charging a stiff rate and then decreasing the hours of service. Another head of household made the point that he had to cooperate with the generator owner because he had no choice. Even boycotts are contemplated. A woman from a rural area noted that she has an agreement with other subscribers that they would stop their subscriptions if prices went up. 12. Generator owners complain about their customers as well. Some customers don’t pay regularly. Some pay in installments and others are late paying their subscriptions. There is also a tendency (among about 10% of customers) to decrease the subscription size to even 2.5 amperes for 30,000 LBPs. In early 2008 the number dropping their subscriptions was increasing month by month. 13. The relationship between generator owners and EdL can be described as one of mutual tolerance. Unable to provide constant electricity service, EdL must accept that the gap will be filled by another actor. The generators, on the other hand, need EdL to provide the bulk of electricity because they would be unable to provide full, 24-hour service, except at prohibitive prices that few households would be willing to pay. Typically, cooperation with EdL is limited to the private generator’s use of EdL’s electricity poles. The generator owner may even be the first to call EdL to notify the company when an electricity pole is down – as this disruption affects his business as well. On the other hand, until EdL is reformed, it can be said that private generators are providing a benefit to EdL as well. By filling a huge unmet demand, the pressure on the public company to provide more hours (and incur even greater losses) is eased.
55
ANNEX III: WILLINGNESS TO PAY-BACKGROUND I. WILLINGNESS TO PAY VARIABLES The SIA survey included three different variables for willingness to pay (WTP) each of which can be used to estimate demand for improved services
1. Revealed WTP • For electricity - reported expenditures on private generators (Do you subscribe/use a
generator and how much is your monthly payment?) • For water – payments for non-network water (What are your expenditures on bottled
water and tank water?) 2. Stated WTP closed-ended
• Direct questioning method – dichotomous choice (would you pay x more if service were reliable? yes/no)
3. Stated WTP open-ended • Direct questioning method – maximum amount (What is the maximum you would pay if
service were reliable and constant?) All three variables for WTP are referred to in the report. II. HYPOTHESES
1. Stated WTP is positively correlated with household income/expenditures and with blackout hours (i.e. higher the number of blackout hours with higher WTP levels). 2. Stated WTP is positively correlated with revealed WTP. (Households that use private generators will be more willing to pay for 24 hour public electricity service, because they have already demonstrated that they value uninterrupted electricity service). 3. Differences between stated and revealed WTP can be explained by: • Different expectations of private and public service providers, i.e. consumers factor in a profit
for private providers or, conversely, expect private providers to be more efficient; • Some households in a multi-unit building pay for a private generator as part of a package of
utilities and cannot opt out without moving to a different building; and their revealed WTP is therefore inflated.
III. LIMITATIONS AND POTENTIAL WEAKNESSES - VALIDITY As always, with open-ended questions, potential validity problems arise. The dichotomous question was included to reduce the likelihood of respondents answering strategically. At the same time, the closed-ended question, based as it is on the current electricity bill, may not provide ‘true’ WTP since respondents are using current payments as an ‘anchor point.’ A rebuttal to this problem would be that although the answer may be anchored, it also presents a real world scenario, since households will, necessarily, relate (and react to) any future tariff increases based on their current payments. Interestingly, for the pilot-test, several respondents answered that, under the ‘ideal’ scenario, they would actually be willing to pay less than they were paying currently. This could be interpreted to mean that they felt that their current bill was too high already, for the service they received.
56
IV. OPTIONS CONSIDERED AND REJECTED For electricity, we considered asking WTP for an increase of x hours of electricity (compared with current availability) as to full 24 hour coverage. The rationale for this proposed formulation was that the scenario would be more ‘realistic’ given the unlikelihood of attaining reliable, 24 service in Lebanon for many years. The problem with this is that the length of electricity service on a 24 hour basis varies widely between regions. This means that for some households an additional 6 hours could mean uninterrupted service, while for others it might mean just 18 hours of service, and potentially continued reliance (for some) on generators. The answer would be ambiguous – some households would still have to/want to rely on generators – and comparisons difficult. As it is, comparing WTP between households with different hours of service will mean controlling for this factor – we expect lower WTP where hours of service are longer on average. V. SUBSTITUTABILITY BETWEEN PUBLIC AND PRIVATE ELECTRICITY In terms of analyzing WTP, how much does a household’s private generator subscription ampere level matter? Lower ampere levels mean fewer appliances can be run, and the generator-supplied electricity is therefore a less perfect substitute. We believe it should not matter, because lower ampere levels are reflected in lower private generator subscription fees. However, we may be missing out on some interesting information. The qualitative research indicates that many households are either reducing their ampere levels (typically from 10 to 5 amps) or have stopped using generator services altogether. (and rising generator fuel costs are leading some generator businesses to consider exiting the business.) This information provides an additional indicator of the threshold at which households are no longer WTP. VI. THE UNEVEN RELATIONSHIP BETWEEN PUBLICLY AND PRIVATELY SUPPLIED ELECTRICITY The relationship between publicly supplied electricity and generators is not straightforward. Fewer public service hours do not translate directly into more generator service hours. This is partly due to increasing fuel prices, which appear to have driven a wedge between the one-to-one substitution relationship. Most generator owners and households interviewed reported that generators do not run the entire period of the blackout. For example, households in areas which receive 16 hours of public electricity per day, and choose to subscribe to a private generator, will typically receive less than 8 hours of generator service. This may or may not be stated in the contract. Generator businesses report that they benefit (in the short-term at least) when the length of service interruptions decreases, because it means they can run their generator for fewer hours, reducing their fuel costs. It is also apparent that as the price of fuel rises, some households are discontinuing their private generator subscriptions. There are several implications. First, privately generated electricity is not a perfect substitute; private generated electricity will not fill the gap in an environment of rising fuel costs – which means even better off households will choose to forgo electricity and some private generator businesses will exit the market. In terms of analysis, however, subscription prices should still be a valid input in determining the cost of blackouts. This is because revealed WTP can be calculated for electricity at various prices. A household willing to pay x for 5 amps of privately generated electricity but not x + y is signaling their value for one blackout hour. VII. SOURCE OF ELECTRICITY AND EXPECTATIONS It should be noted that WTP is likely to be colored by attitudes toward the electricity provider. (Behavioral economists have identified expectations of fairness as a factor in economic decision-making.) Qualitative research reveals that customers expect generator businesses to operate on a for-profit basis and EDL to provide a public service. Although customers are not always happy with generator service,

57
complaining that they do not get as many hours of electricity as they believe they should, they also accept that as businesses the generators will look out for themselves first, and are furthermore squeezed by high fuel prices. But with regard to EDL, customers expect decent service as a basic right. In conclusion, WTP is likely to be colored by expectations toward the service provider, with the implication that WTP to EDL may be lower than to a private provider. VIII. ANALYZING REVEALED WTP
Definition: households that use private generators are considered to be ‘willing to pay’ and those who do not ‘unwilling to pay.’ Assumption: all households have the option of using private generators; no households that have zero expenditures on private generators reflect lack of choice. (We may need to investigate this assumption – and if we can identify these households, exclude them.) Demand function:
y-axis - expenditures on private generator as % of EDL bill x-axis – percentage of the sample
Correlations: income level, number of blackout hours Note: For all approaches, without controlling for income and hours of blackouts we do not expect to see a downward sloping demand curve
IX. ANALYZING STATED WTP – CLOSED-ENDED
Definition: if answered ‘yes’ household is WTP, if answered ‘no’ they are not Assumption: for those answering ‘yes’ reported WTP reflects minimum WTP under hypothetical scenario Sample characteristics: sample was divided into four parts, each with a different amount of increase (25%, 75%, 100%, and 150% for electricity) and each household was given a simple yes/no option Demand function:
y-axis - expenditures on private generator as % of EDL bill x-axis – percentage of the sample answering ‘yes’ under each increase amount
Correlations: income level, number of blackout hours Limitation: not capturing all of consumer surplus since some households will be WTP more than indicated by their ‘yes’ response
X. ANALYZING STATED WTP – OPEN-ENDED
Definition: maximum amount reflects WTP Assumption: reported WTP reflects full WTP under hypothetical scenario Sample characteristics: this question followed the closed-ended question, for both ‘yes’ and ‘no’ responders. Demand function:
y-axis - expenditures on private generator as % of EDL bill x-axis – percentage of the sample
Correlations: income level, number of blackout hours Limitation: respondents may be anchoring their ‘maximum’ response to the proposed threshold.
XI. TRANSLATING WTP INTO POLICY IMPLICATIONS

58
Care must be taken in translating WTP results into policy recommendations for tariff increases. To take a simple example, if a household receives 12 hours of electricity from EDL at $20/month, it would naturally expect to pay EDL more if it received 24 hours, since it would be using more kWh. The first question is, how much more, compared to its current expenditure? The amount would depend on two things – the variable cost (depending on kWh consumed) and the intensity of usage during the additional 12 hours. (Electricity bills include fixed fees for maintenance, tax, etc. and variable fees for usage.) To start, we can make the simple assumption that, for an additional 12 hours, the variable cost would double, i.e. be equal to the current variable cost. If the original bill is $10 fixed + $10 variable = $20, the new bill under 24 hour service will be $10 fixed + $20 variable = $30. Next, the presumed intensity of usage during the blackout hours needs to be estimated. If any of those blackout hours are during the night, or when no one is home or during daylight hours when lighting is not needed, the intensity will be less than 100%. (The estimation is beyond the scope of this note.) Thus, for any level of blackout hours, the expected change in payment would be as follows:
Equation 1: PE = PF +PV + PV(24 – TB)*β Where PE is the expected payment for full, 24 service, PF is the fix fee, PV is the variable fee, TB is time in hours, and β is the coefficient for intensity of use. The second question is – should we adjust the stated WTP of respondents by the amount that they would be paying if they had 24 hour service? If the answer is yes, their WTP could be changed as follows:
Equation 2: WTPR - PE = WTPA
Where WTPR
is reported WTP and WTPA is adjusted WTP.
In conclusion, simply because a household states they are willing to pay an additional 50% of their current bill for improved service, it does not mean that tariffs can be raised by 50%. The above adjustment should be made. Note: This discussion has not included looking at the impacts of changing tariff tranche levels, a separate topic of analysis.

59
ANNEX IV: LESSONS LEARNED FROM ENERGY SECTOR REFORMS73
BACKGROUND About 70 of the 150 developing countries and transition economies have embarked on reforming their power markets since the early 1990s. The drivers of this reform movement are disenchanted with the poor performance of state-owned power utilities, the need for new investments and modernization to meet rapid growth in demand, and fiscal pressure, along with the desire to protect and help the poor. The reforms have generally been tentative and incomplete, however, particularly in relation to market structure, degree of private participation, and development of the regulatory framework. The countries that have embarked on power market reform cover a broad range in physical, economic, and institutional terms. The most advanced countries in reform are located in Latin America and in Eastern Europe, where they also have relatively larger power systems and higher levels of per capita national income compared with other developing countries and transition economies (referred to here collectively as “developing countries”). Strategic elements of power market reform in developing countries should be assessed against three outcomes that reflect the drivers of reform. These outcomes are:
• better service quality for electricity consumers to support economic growth and welfare, • improvement in government’s fiscal position, and • more affordable access to electricity for the poor.
They reflect the main drivers of reform. The main elements of reform—restructuring power utilities and markets, regulation, competition, and the roles of public and private participants—are the means for achieving these outcomes. In order to show how implementation affects design, this section brings together the design lessons under the following four strategic elements for implementing reforms: 2 Power market reform:
1. Has many dimensions. 2. Must be adapted to starting conditions. 3. Is a process—not an event 4. Is an opportunity to help the poor.
ELEMENT 1: POWER MARKET REFORM HAS MANY DIMENSIONS Many dimensions of power market reform are important in developing countries. Under mounting experience, power market reform in developing countries has increasingly emphasized the social, legal, and political dimensions of reform in defining the techno-economic dimension. Change to commercially oriented governance is fundamental to achieving sustainable reform of power markets. Power market reform in a broad sense can be viewed as a means to improve governance of the power market and its participants. The traditional model of governance under ministry departmental organization is not sustainable in most developing countries. Commercially oriented governance
73 This Note is based on the World Bank publication Reforming Power Markets in Developing Countries: “What Have We Learned?” Energy and Mining Sector Board Discussion Paper No. 19, September 2006
60
irreversibly removes the management and development of power supply from political and bureaucratic control to achieve commercial standards in management practices, financial performance, and the pricing of products and services. Social and political factors are important for all power market reform programs. Government must generate public acceptance and stakeholder consensus for these programs. Power market reform based on market restructuring and private sector participation involves complex social and political issues for market investors, utility employees, and electricity consumers. The complexity of these issues can sometimes match the complexity of the technical issues involved in reforming power markets. Distributional issues are often at the heart of designing power reform programs. Reforms must not only offer benefits that substantially outweigh the costs, but also provide the means for compensating losers. Although reforms in power markets have delivered substantial benefits to society overall through efficiency gains, most of these benefits have been shared by power producers, service providers, and commercial businesses, but have not reached other segments of society, including the poor. The impact of power market reform on the poor is a critical distributional issue. The poor have obtained a low share of the benefits of power market reform in developing countries, and some have even suffered welfare losses. Some of the poor who have lost from reform were obtaining some electricity service before reform—albeit illegally and of poor quality— but were disconnected or now have to pay for their consumption. Other groups of the poor continued to receive legal service, but at higher tariffs as subsidies and cross-subsidies were removed under the commercial pressure on service providers introduced by reform. On the other hand, some poor have gained from reform by receiving otherwise unavailable connections to electricity supply. ELEMENT 2: POWER MARKET REFORM MUST BE ADAPTED TO STARTING CONDITIONS Starting conditions in the power market are important for designing power reform programs. These conditions include the size of the country and its power system and market, the country’s location relative to other power markets, its income level and macroeconomic condition, its political situation, and the capacity of its domestic financial markets and institutions. The variety of market structures is one indicator of the range of reforms in power markets. From the pre-reform structure of a monopoly, market structures can be categorized according to the increasing degree of competition, starting from a purchasing agency— also known as a single buyer—through whom all or most trade in wholesale passes and who therefore manages competition for market share among generators and independent power producers. In developing countries the competitive structures are based on trading arrangements in the wholesale power market that allow distribution companies and large users of electricity to purchase electricity directly from generators either in a power exchange or bilaterally. The economic case for breaking up a vertically integrated power utility rests on various factors. The gains from breaking up (or “unbundling”) the utility by separating the generation component from the distribution component are worthwhile when they exceed the costs of transactions among the separated segments introduced by unbundling. The relevant factors are power system size and country institutional capacity to manage complex trading mechanisms. The case for unbundling is strongest in large power systems in countries well endowed institutionally. The case for unbundling is weakest in small systems in countries with undeveloped institutional capacity and weak economic conditions. The numerous countries whose power systems are too small for a competitive power market have intermediate reform options. Unbundling the generation and distribution segments of the power supply chain into tiny entities would not make sense in these systems, because economies of scale and scope
61
would be lost without realizing the benefits of competition. Even in small power systems, however, separation of these components helps regulation of power service providers by revealing information about their costs, and increasing the transparency of price setting. These systems can adopt a purchasing agency or single buyer model until they can reap the benefits from greater separation of the supply chain. The variety of ways for the private sector to participate in the supply and delivery of electricity services is another indicator of the range of reforms. The role of private participants should match their capacity to take on investment risks under specific country conditions. Their roles can range from virtually no at-risk investment under management contracts through some investment risk under long-term concessions to accepting all investment risks under divestiture of ownership to the private sector. Problems—even failures—as well successes, have been associated with these forms of private participation in power markets. The case for bringing the private sector into power supply functions rests on how well this would achieve the desired reform outcomes under the prevailing operating conditions. Latin American experience shows that privatization of power market assets can improve services at reduced costs and with fiscal benefits, provided that stable macroeconomic conditions prevail. However, many developing countries do not offer the necessary conditions for attracting substantial amounts of private investment in this way to their power markets. Many of them have attracted substantial investments by independent power producers, but only by giving contractual protection against most noncommercial risks to these producers. The public sector will remain an important source, and often for the medium term the main source, of investment for a power market where country and market risks deter private investors. In many countries, some public investment will be needed to rehabilitate nonviable generation and distribution businesses as a prerequisite for attracting private investment in them or during the early years of concessions for distribution businesses. The public sector can play a financing or risk-bearing role by means of investment financing and the provision of subsidies and guarantees under public-private partnerships through management contracts, leases, and concessions. The range of approaches to establishing the credibility of power market regulation is an indicator of the range of reforms to power markets. Credibility of regulation is needed to attract long-term private at-risk investment in electricity services. It covers autonomy to carry out duties, transparency in procedures and processes, and accountability to government and consumers. A means for developing credibility is a designated regulatory agency or separate governmental department that discharges its duties in a neutral and depoliticized manner. Specific contractual arrangements may be needed to provide stability and credibility for private investors. Private investors place importance on the stability and enforceability of laws and contracts, and they contend that a credible regulatory system (including contracts) requires more than a newly formed regulatory entity (“regulation by contract”). Empirical analysis indicates that a clear threshold exists among developing countries in relation to size and income for the composition of power market reform. This threshold is formed by a combination of system size larger than 1,000 MW and national per capita income above US$900. A large middle-income group of countries is formed by a combination of size and income above these threshold values, and a small low-income group is formed by a combination of size and income below these threshold values. Country income level has a relatively stronger influence than power system size on the roles of the public and private sectors and on access and affordability to electricity services. It also has a stronger influence on the regulation of power markets on the basis that institutional capacity increases with income level. Power system size has a relatively stronger influence on market structure.
62
ELEMENT 3: POWER MARKET REFORM IS A PROCESS—NOT AN EVENT Pressure for rapid results should not obscure the point that reforming power markets is a long-term process that requires patience to achieve the desired outcomes. This is because such outcomes as improving service quality for electricity consumers, strengthening the government’s fiscal position, and providing affordable access to electricity for the poor take time to accomplish. This situation applies especially to countries starting with weak governance structures for power utilities and poor investment climates. Power market reforms in developing countries are generally tentative and incomplete, and are still works in progress. To date, most reform programs have reached interim positions—such as the single buyer model of energy trade—and still need to find ways to attract private investment sustainably and develop their regulatory capacity. The initial transition stage is critical to the success of power market reform and the most vulnerable period for derailment of the reform process by many developing countries. For market structure, transition concerns the separation of the industry structure into its main components and the adoption of a single buyer trader for wholesale power. For private sector participation, transition focuses on private sector roles that fall short of full risk taking, such as management contracts and other forms of private participation, with temporary risk mitigation mechanisms, such as by setting limits on the amount of financial risk initially faced by private operators of power distribution and generation facilities. Transition arrangements to provide stability and credibility for a new regulatory regime revolve around regulation by contract under which regulatory rules and procedures are incorporated into concession agreements. Sequencing of power market reform should follow a sound strategy: • The legal and regulatory framework necessary for creating the new market structure and trading
arrangements is put in place before privatizing power supply entities and setting up new market trading arrangements. Restructuring of power markets progresses from an integrated structure to partially unbundled structures.
• Restructuring of wholesale power trading arrangements progresses from only internal transactions within an integrated power utility to the entry of IPPs selling their output to a single buyer, then to opening access to power networks by large users of power, and eventually to bilateral trading between generators and distributors or to a central power pool under competitive trading.
• Major organizational and financial restructuring precede the creation of private ownership rights to avoid problems with stranded costs.
Some countries have skipped the early stages of these sequences, and others may do so in the future. A sequenced process, however, is less risky and more sustainable than a single-staged (“big bang”) process for reforming power markets in the conditions of developing countries. Sequencing of power market reform also raises tactical issues. Tactics should be specifically designed to address problematical issues, such as the following. • Whether to increase tariffs before or after investments to improve the quality of service. • Whether to try improving the commercial performance of loss-making utilities and distribution
entities before bringing in private participation or with private participation. • The sequencing of privatization in one or more rounds of transactions. • Whether to start the privatization sequence for poorly performing power markets with distribution
entities before privatizing generation entities.
63
• Whether to give investments in new generating capacity lower priority than investments in distribution, especially in a situation of bulk power shortages.
Reform benefits take longer than expected. Consumers usually expect better services from private companies than from state-owned enterprises. Consumers understandably lose patience and blame the regulators if tariffs go up immediately but service improvements lag behind. Therefore, it is not surprising that most regulators, when faced with this situation, will try to find ways not to raise tariffs. The preservation of protective features, such as “life-line” rates, may be necessary, even if they mean continuing subsidies within income classes, as well as from industry to residential consumers. ELEMENT 4: POWER MARKET REFORM IS AN OPPORTUNITY TO HELP THE POOR Extending access to affordable modern energy services—including electricity services—for poor households is one of the most practicable ways of improving their welfare. This is because expanding access to these services helps to increase household incomes and meet basic needs, such as improved health and primary education, as well as support social empowerment and environmental sustainability. The cost of these services to users is often considerably lower than the corresponding traditional energy alternatives used by poor households without access to these services. Reform provides an opportunity to rectify the policy and regulatory constraints on electricity access and service for low-income households. Reform can overcome entrenched attitudes to providing electricity services and introduce different kinds of electricity services better suited to the poor. Opening up the main power market to new entrants can stimulate incentives specifically designed to attract new entrants into markets serving poor areas. The establishment of a new regulatory system for the main power market provides an opportunity to introduce regulations that help the poor. Reforms that place the power market on a sound commercial footing, however, will not automatically improve access and affordability of electricity services to low-income households. They may make little difference to this situation, or even worsen it. It is important to ensure that reform does not adversely impact access and affordability. Access and affordable consumption of electricity by poor households can be promoted by various policy instruments. Instruments that promote access require service providers to extend access, reduce connection costs, and increase supply options. Extending electricity service to urban low-income households requires improvement to the existing power system. Instruments that promote affordability protect low income households from general increases in tariffs and costs of service and facilitate payment of bills. They stimulate services through nonstandard service delivery mechanisms, service types, and tariff and payment mechanisms appropriate to low-income households. Even under successful power market reform, poor households need help with financing the costs of connecting their premises to the network and installing meters at the points of consumption. Well-designed subsidies provide good incentives to service providers— both specifically for serving low-income areas, as well as generally—to attract private sector participation through concessions and asset sales. The substantial empirical evidence, however, questions the effectiveness of many existing subsidy schemes as a means of helping low-income electricity consumers. A number of approaches (mainly input-based) have been developed to improve the targeting and cost-effectiveness of subsidy delivery.
64
ANNEX V: REFERENCES Chubu Electric Power Company Ltd (CEPCO), Consulting Report in World Bank (2004), Republic of Lebanon Hydrocarbon Strategy Study, Report No. 29579-LE, Washington DC, June 30. Central Administration of Statistics (2004), Household Living Conditions Survey, Beirut. United Nations (2008), Millennium Development Goal Indicators, available online at: http://mdgs.un.org/unsd/mdg/Metadata.aspx?IndicatorId=0&SeriesId=710. United Nation Development Program (2007), Poverty Growth and Inequality in Lebanon, Executive Summary, October. World Bank (2008), Republic of Lebanon Electricity Sector Public Expenditure Review, Report No. 41421-LB, Washington DC, January 31. World Bank (2007), Lebanon Reform Implementation Development Policy Loan, Washington DC, August 2. World Bank (2007), Lebanon Economic and Social Impact Assessment, Chapter 2 -Electricity, Washington DC, January 22. World Bank (2007), Lebanon Economic and Social Impact Assessment, Chapter 3 –Water Supply and Sanitation, Washington DC, January 22. World Bank (2003), Republic of Lebanon Policy Note on Irrigation Sector Sustainability, Policy Note No. 28766, Washington DC, November. World Bank (2002), Sourcebook for Poverty Reduction Strategies: Core Techniques and Crosscutting Issues, Washington DC. World Bank (forthcoming), Republic of Lebanon Water Sector Public Expenditure Review, Washington DC. World Bank (2008), World Development Indicators. World Bank (2006), Reforming Power Markets in Developing Countries: What Have We Learned? Energy and Mining Sector Board Discussion Paper No. 19, September 2006.