lec 2 aug 31 review of lec 1 continue ch 1 course overview performance measures ch 1 exercises quiz...
Post on 19-Dec-2015
219 views
TRANSCRIPT

Lec 2 Aug 31
• review of lec 1
• continue Ch 1
• course overview
• performance measures
• Ch 1 exercises
• quiz 1

Levels of Program Code High-level language
Level of abstraction closer to problem domain
Provides for productivity and portability
Assembly language Textual representation of
instructions Hardware representation
Binary digits (bits) Encoded instructions and data

Components of a Computer Same components for
all kinds of computer Desktop, server,
embedded Input/output includes
User-interface devices Display, keyboard, mouse
Storage devices Hard disk, CD/DVD, flash
Network adapters For communicating with
other computers
§1.3 Under the C
overs
The BIG Picture

Inside the Processor (CPU) Datapath: performs operations on data Control: sequences datapath, memory, ... Cache memory
Small fast SRAM memory for immediate access to data Several levels of cache

Inside the Processor AMD Barcelona: 4 processor cores

AMD Barcelona – some features

Abstractions
Abstraction helps us deal with complexity Hide lower-level detail
Instruction set architecture (ISA) The hardware/software interface
Application binary interface The ISA plus system software interface
Implementation The details underlying and interface
The BIG Picture
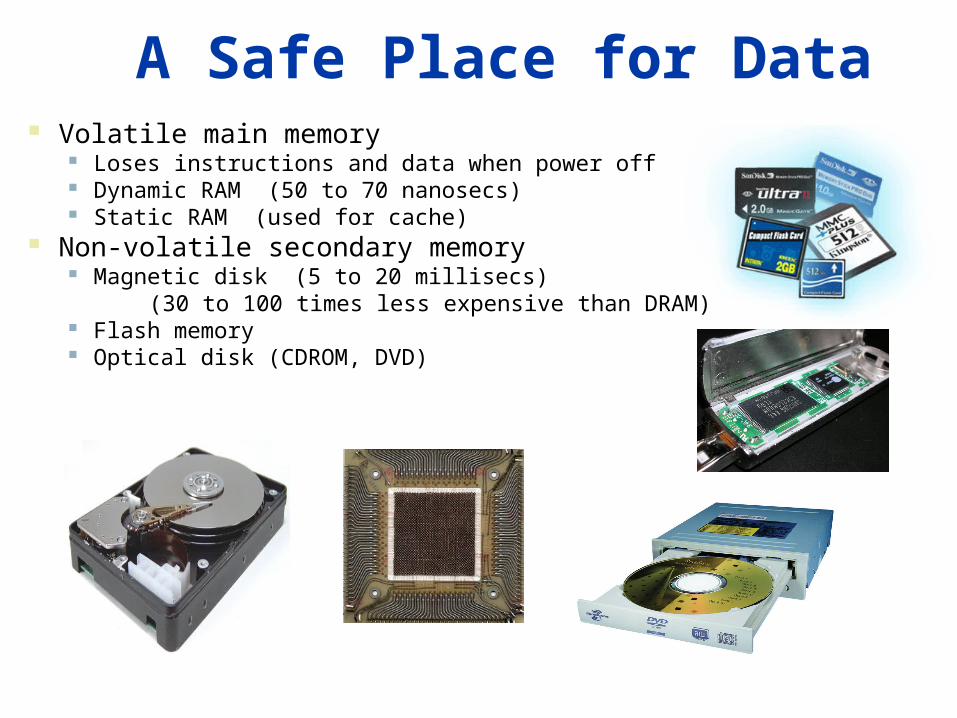
A Safe Place for Data Volatile main memory
Loses instructions and data when power off Dynamic RAM (50 to 70 nanosecs) Static RAM (used for cache)
Non-volatile secondary memory Magnetic disk (5 to 20 millisecs) (30 to 100 times less expensive than DRAM) Flash memory Optical disk (CDROM, DVD)

Technology Trends Electronics
technology continues to evolve Increased capacity
and performance Reduced cost
Year Technology Relative performance/cost
1951 Vacuum tube 1
1965 Transistor 35
1975 Integrated circuit (IC) 900
1995 Very large scale IC (VLSI) 2,400,000
2005 Ultra large scale IC 6,200,000,000
DRAM capacity


Defining Performance Which airplane has the best performance?
0 100 200 300 400 500
DouglasDC-8-50
BAC/ SudConcorde
Boeing 747
Boeing 777
Passenger Capacity
0 2000 4000 6000 8000 10000
Douglas DC-8-50
BAC/ SudConcorde
Boeing 747
Boeing 777
Cruising Range (miles)
0 500 1000 1500
DouglasDC-8-50
BAC/ SudConcorde
Boeing 747
Boeing 777
Cruising Speed (mph)
0 100000 200000 300000 400000
Douglas DC-8-50
BAC/ SudConcorde
Boeing 747
Boeing 777
Passengers x mph
§1.4 Perform
ance

Response Time and Throughput Response time
How long it takes to do a task Throughput
Total work done per unit time e.g., tasks/transactions/… per hour
How are response time and throughput affected by Replacing the processor with a faster version? Adding more processors?

Relative Performance Define Performance = 1/Execution Time “X is n time faster than Y”
n XY
YX
time Executiontime Execution
ePerformancePerformanc
Example: time taken to run a program 10s on A, 15s on B Execution TimeB / Execution TimeA
= 15s / 10s = 1.5 So A is 1.5 times faster than B

Measuring Execution Time Elapsed time
Total response time, including all aspects Processing, I/O, OS overhead, idle time
Determines system performance CPU time
Time spent processing a given job Discounts I/O time, other jobs’ shares
Comprises user CPU time and system CPU time Different programs are affected differently by
CPU and system performance

CPU Clocking Operation of digital hardware governed by a
constant-rate clock
Clock (cycles)
Data transferand computation
Update state
Clock period
Clock period: duration of a clock cycle e.g., 250ps = 0.25ns = 250×10–12s
Clock frequency (rate): cycles per second e.g., 4.0GHz = 4000MHz = 4.0×10⁹Hz

CPU Time
Performance improved by Reducing number of clock cycles Increasing clock rate Hardware designer must often trade off clock
rate against cycle count
Rate Clock
Cycles Clock CPU
Time Cycle ClockCycles Clock CPUTime CPU

CPU Time Example Computer A: 2GHz clock, 10s CPU time Designing Computer B
Aim for 6s CPU time Can do faster clock, but causes 1.2 × clock cycles
How fast must Computer B clock be?
4GHz6s
1024
6s
10201.2Rate Clock
10202GHz10s
Rate ClockTime CPUCycles Clock
6s
Cycles Clock1.2
Time CPU
Cycles ClockRate Clock
99
B
9
AAA
A
B
BB

Instruction Count and CPI
Instruction Count for a program Determined by program, ISA and compiler
Average cycles per instruction Determined by CPU hardware If different instructions have different CPI
(weighted) average CPI affected by instruction mix
Rate Clock
CPICount nInstructio
Time Cycle ClockCPICount nInstructioTime CPU
nInstructio per CyclesCount nInstructioCycles Clock

CPI Example Computer A: Cycle Time = 250ps, CPI = 2.0 Computer B: Cycle Time = 500ps, CPI = 1.2 Same ISA Which is faster, and by how much?
1.2500psI
600psI
ATime CPUBTime CPU
600psI500ps1.2IBTime CycleBCPICount nInstructioBTime CPU
500psI250ps2.0IATime CycleACPICount nInstructioATime CPU
A is faster…
…by this much

CPI in More Detail If different instruction classes take different
numbers of cycles
n
1iii )Count nInstructio(CPICycles Clock
Weighted average CPI
n
1i
ii Count nInstructio
Count nInstructioCPI
Count nInstructio
Cycles ClockCPI
Relative frequency

CPI Example Alternative compiled code sequences using
instructions in classes A, B, C
Class A B C
CPI for class 1 2 3
IC in sequence 1 2 1 2
IC in sequence 2 4 1 1
Sequence 1: IC = 5 Clock Cycles
= 2×1 + 1×2 + 2×3= 10
Avg. CPI = 10/5 = 2.0
Sequence 2: IC = 6 Clock Cycles
= 4×1 + 1×2 + 1×3= 9
Avg. CPI = 9/6 = 1.5

Check yourself
A given application written in Java runs in 15 seconds on a desktop processor. A new Java compiler is released that requires only 0.6 as many instructions as the old compiler. Unfortunately, it increases the CPI by 1.1. How long do we expect the application to take to complete when compiled with the new compiler?
(a) 15 x 0.6 / 1.1 = 8.2 sec
(b) 15 x 0.6 x 1.1 = 9.9 sec
(c) 15 x 1.1 / 0.6 = 27.5 sec

Performance Summary
Performance depends on Algorithm: affects IC, possibly CPI Programming language: affects IC, CPI Compiler: affects IC, CPI Instruction set architecture: affects IC, CPI, Tc
The BIG Picture
cycle Clock
Seconds
nInstructio
cycles Clock
Program
nsInstructioTime CPU
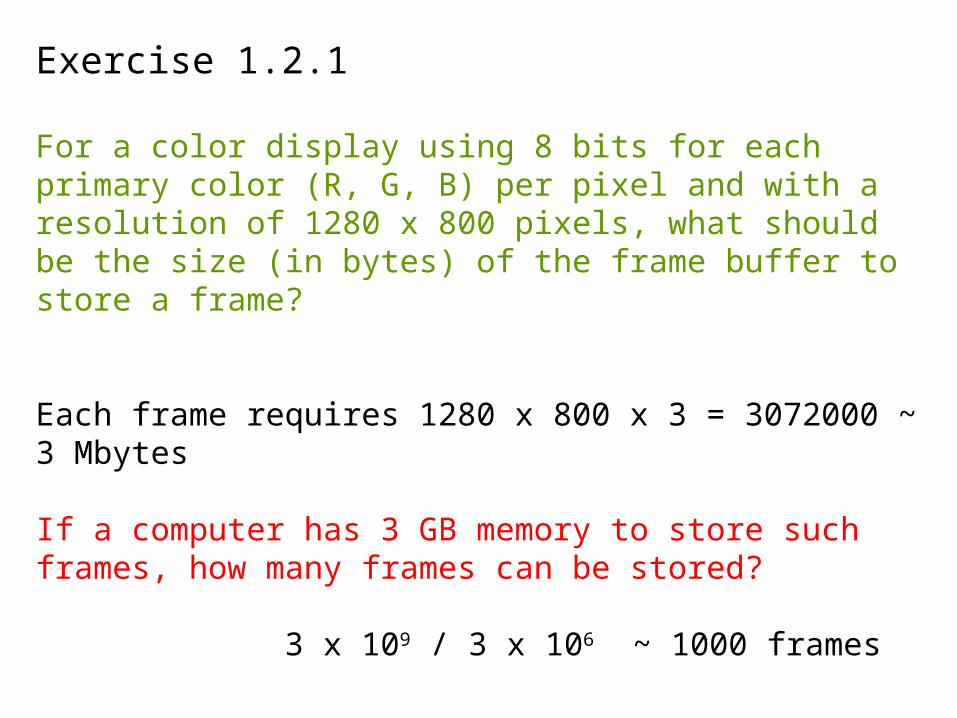
Exercise 1.2.1
For a color display using 8 bits for each primary color (R, G, B) per pixel and with a resolution of 1280 x 800 pixels, what should be the size (in bytes) of the frame buffer to store a frame?
Each frame requires 1280 x 800 x 3 = 3072000 ~ 3 Mbytes
If a computer has 3 GB memory to store such frames, how many frames can be stored?
3 x 10⁹ / 3 x 10⁶ ~ 1000 frames

Exercise 1.3
Consider 3 processors P1, P2 and P3 with same instruction set with clock rates and CPI given below:
clock rate CPI
P1 2 GHz 1.5P2 1.5 GHz 1.0P3 3 GHz 2.5

Exercise 1.3
Consider 3 processors P1, P2 and P3 with same instruction set with clock rates and CPI given below:
clock rate CPI
P1 2 GHz 1.5P2 1.5 GHz 1.0P3 3 GHz 2.5
1.3.1. Which processor has the highest performance?
Suppose the program has N instructions. Time taken to execute on P1 is = 1.5 N / (2 x 10⁹) = 0.75 N x 10-9
Time taken to execute on P2 is = N/ (1.5 x 10⁹) = 0.66 N x 10-9
etc.

Exercise 1.3
Consider 3 processors P1, P2 and P3 with same instruction set with clock rates and CPI given below:
clock rate CPI
P1 2 GHz 1.5P2 1.5 GHz 1.0P3 3 GHz 2.5
1.3.2. If the processors each execute a program in 10 seconds, find the number of cycles and the number of instructions.

Exercise 1.3
Consider 3 processors P1, P2 and P3 with same instruction set with clock rates and CPI given below:
clock rate CPI
P1 2 GHz 1.5P2 1.5 GHz 1.0P3 3 GHz 2.5
1.3.2. If the processors each execute a program in 10 seconds, find the number of cycles and the number of instructions.
Time taken to execute on P1 is = 1.5 N / (2 x 10⁹) = 0.75 N x 10-9
= 10So N = 1.33 x 10¹⁰

Power Trends
In CMOS IC technology
§1.5 The P
ower W
all
FrequencyVoltageload CapacitivePower 2
×1000×30 5V → 1V

Reducing Power Suppose a new CPU has
85% of capacitive load of old CPU 15% voltage and 15% frequency reduction
0.520.85FVC
0.85F0.85)(V0.85C
P
P 4
old2
oldold
old2
oldold
old
new
The power wall We can’t reduce voltage further We can’t remove more heat
How else can we improve performance?

Uniprocessor Performance§1.6 T
he Sea C
hange: The S
witch to M
ultiprocessors
Constrained by power, instruction-level parallelism, memory latency

Multiprocessors Multicore microprocessors
More than one processor per chip Requires explicitly parallel programming
Compare with instruction level parallelism Hardware executes multiple instructions at once Hidden from the programmer
Hard to do Programming for performance Load balancing Optimizing communication and synchronization

Manufacturing ICs
Yield: proportion of working dies per wafer
§1.7 Real S
tuff: The A
MD
Opteron X
4

AMD Opteron X2 Wafer
X2: 300mm wafer, 117 chips, 90nm technology X4: 45nm technology

Integrated Circuit Cost
Nonlinear relation to area and defect rate Wafer cost and area are fixed Defect rate determined by manufacturing process Die area determined by architecture and circuit design
2area/2)) Diearea per (Defects(1
1Yield
area Diearea Wafer waferper Dies
Yield waferper Dies
waferper Costdie per Cost

SPEC CPU Benchmark Programs used to measure performance
Supposedly typical of actual workload Standard Performance Evaluation Corp (SPEC)
Develops benchmarks for CPU, I/O, Web, …
SPEC CPU2006 Elapsed time to execute a selection of programs
Negligible I/O, so focuses on CPU performance Normalize relative to reference machine Summarize as geometric mean of performance ratios
CINT2006 (integer) and CFP2006 (floating-point)
n
n
1iiratio time Execution

CINT2006 for Opteron X4 2356
Name Description IC×109 CPI Tc (ns) Exec time Ref time SPECratio
perl Interpreted string processing 2,118 0.75 0.40 637 9,777 15.3
bzip2 Block-sorting compression 2,389 0.85 0.40 817 9,650 11.8
gcc GNU C Compiler 1,050 1.72 0.47 24 8,050 11.1
mcf Combinatorial optimization 336 10.00 0.40 1,345 9,120 6.8
go Go game (AI) 1,658 1.09 0.40 721 10,490 14.6
hmmer Search gene sequence 2,783 0.80 0.40 890 9,330 10.5
sjeng Chess game (AI) 2,176 0.96 0.48 37 12,100 14.5
libquantum Quantum computer simulation 1,623 1.61 0.40 1,047 20,720 19.8
h264avc Video compression 3,102 0.80 0.40 993 22,130 22.3
omnetpp Discrete event simulation 587 2.94 0.40 690 6,250 9.1
astar Games/path finding 1,082 1.79 0.40 773 7,020 9.1
xalancbmk XML parsing 1,058 2.70 0.40 1,143 6,900 6.0
Geometric mean 11.7
High cache miss rates

SPEC Power Benchmark Power consumption of server at different
workload levels Performance: ssj_ops/sec Power: Watts (Joules/sec)
10
0ii
10
0ii powerssj_ops Wattper ssj_ops Overall

SPECpower_ssj2008 for X4
Target Load % Performance (ssj_ops/sec) Average Power (Watts)
100% 231,867 295
90% 211,282 286
80% 185,803 275
70% 163,427 265
60% 140,160 256
50% 118,324 246
40% 920,35 233
30% 70,500 222
20% 47,126 206
10% 23,066 180
0% 0 141
Overall sum 1,283,590 2,605
∑ssj_ops/ ∑power 493

Pitfall: Amdahl’s Law Improving an aspect of a computer and
expecting a proportional improvement in overall performance
§1.8 Fallacies and P
itfalls
2080
20 n
Can’t be done!
unaffectedaffected
improved Tfactor timprovemen
TT
Example: multiply accounts for 80s/100s How much improvement in multiply performance to
get 5× overall?
Corollary: make the common case fast

Fallacy: Low Power at Idle Look back at X4 power benchmark
At 100% load: 295W At 50% load: 246W (83%) At 10% load: 180W (61%)
Google data center Mostly operates at 10% – 50% load At 100% load less than 1% of the time
Consider designing processors to make power proportional to load

Pitfall: MIPS as a Performance Metric
MIPS: Millions of Instructions Per Second Doesn’t account for
Differences in ISAs between computers Differences in complexity between instructions
66
6
10CPI
rate Clock
10rate Clock
CPIcount nInstructiocount nInstructio
10time Execution
count nInstructioMIPS
CPI varies between programs on a given CPU

Concluding Remarks Cost/performance is improving
Due to underlying technology development Hierarchical layers of abstraction
In both hardware and software Instruction set architecture
The hardware/software interface Execution time: the best performance
measure Power is a limiting factor
Use parallelism to improve performance
§1.9 Concluding R
emarks

Anatomy of a Computer
Output device
Input device
Input device
Network cable
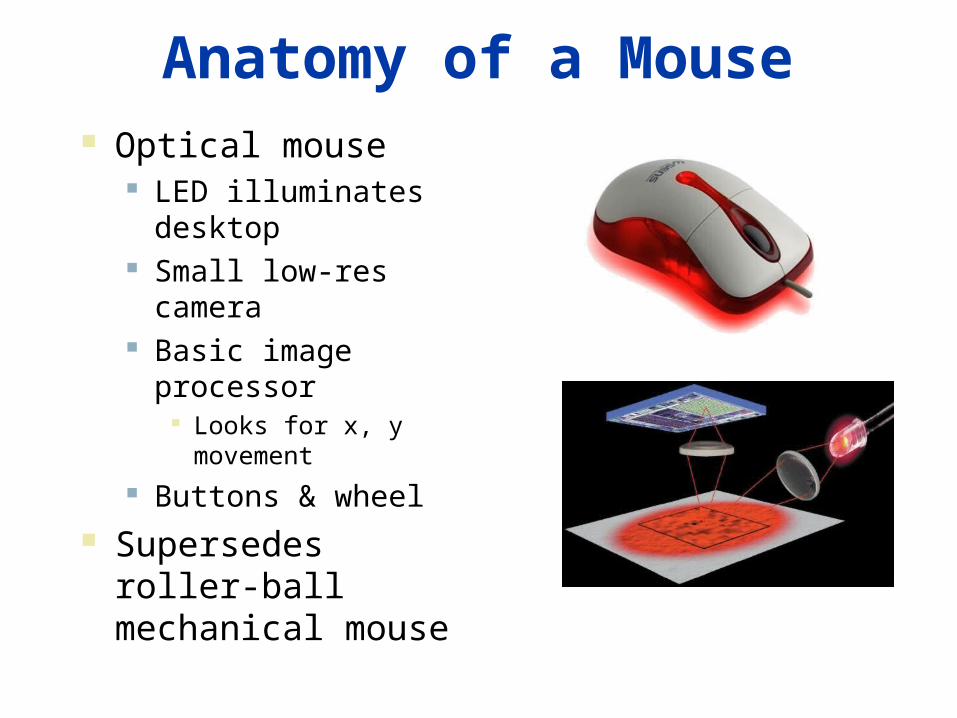
Anatomy of a Mouse Optical mouse
LED illuminates desktop
Small low-res camera Basic image processor
Looks for x, y movement
Buttons & wheel Supersedes roller-ball
mechanical mouse

Through the Looking Glass LCD screen: picture elements (pixels)
Mirrors content of frame buffer memory

Opening the Box