lecture 3 the horizontal boundaries of the firm:...
TRANSCRIPT

1
Lecture 3The Horizontal Boundaries of the Firm:
Economies of Scale and Scope
Overview
Where do economies of scale come from?– Definition of economies of scale– Definition of economies of scope
Special sources of economies of scopeSources of diseconomies of scaleThe learning curveDiversification
2

Economies of Scale
Economies of scale occur when the average cost of producing additional output falls as you produce more– The cost of producing an additional unit is
less than the cost of producing the previous unit
3

Economies of Scale
Diseconomies of scale occur when the average cost of producing additional output rises as you produce more output– The cost of producing an additional unit is
more than the cost of producing the previous unit
4

Economies of Scale
Quantity of Output
Cost($ per unitof output
LAC
LMC
A
Economies of Scale
Diseconomies of Scale
Q*5
Q* is the minimum efficient size of the firm

6
Another Example
AC
Quantity
Pric
e pe
r uni
t
Economies of scale Constant
average cost
MES

MES and market structure
How many fast-food restaurants are there in Athens? In Kalamata? Why?
The relationship between minimum efficient scale of production and market demand explains a lot of what we observe about market structure.
If MES is large relative to market demand, there is limited room in the market for efficient-sized producers. In the limit we have natural monopoly—a market that will support only one MES firm.
If MES is small relative to market demand, there is room for many efficient-sized producers.

Horizontal vs. Vertical Boundaries of the Firm Vertical boundaries have to do with the vertical chain of
production: the relevant question is how vertically integrated will an efficient producer be? For example, in the aluminum industry, should a primary aluminum smelting company be vertically integrated upstream into alumina refining and bauxite mining? Should it be vertically integrated downstream into rolling, casting, and extruding and then into finished aluminum products?
Horizontal boundaries have to do with how big (scale of operations) does a firm producing at any given stage in the vertical chain, e.g. aluminum smelting, need to be to attain MES? A related question is whether the firm should produce a single product or a set of related products.

Vertical Boundaries: The Vertical Chain of Aluminum Production
Bauxite ore
Alumina
Molten aluminum
Ingots
Plate Sheet Foil Wire Rod Bar
Final goods (examples)
Transportation, Building and Construction, Machinery, Containers and Packing, Etc.
Refining
Smelting
Casting / Alloying
Initial fabrication
Further fabrication
Recycling
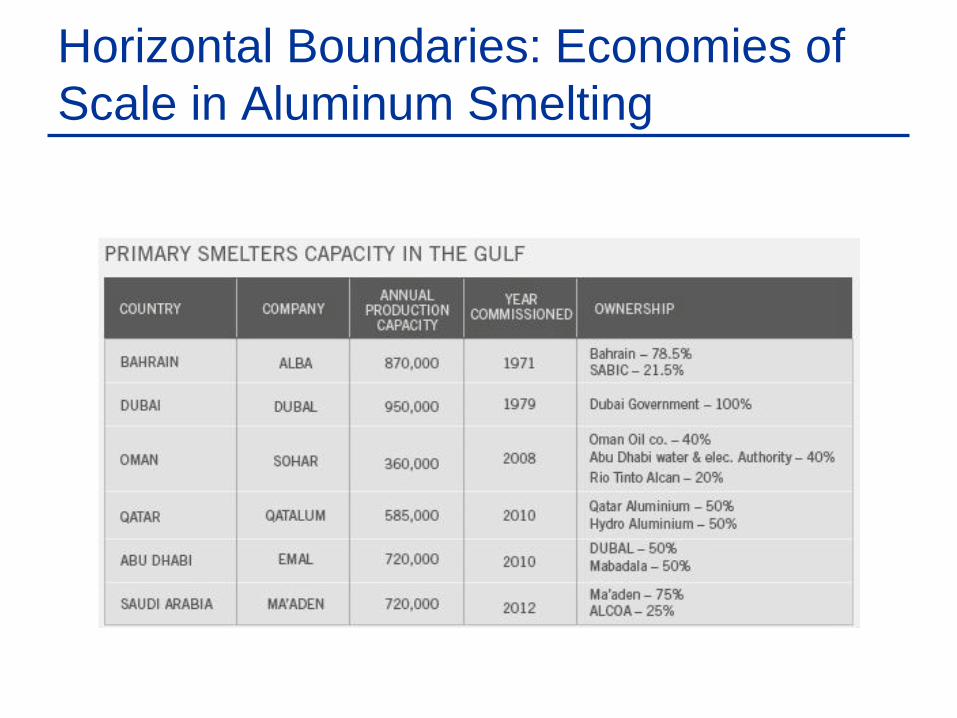
Horizontal Boundaries: Economies of Scale in Aluminum Smelting
Jointly Producing Two Outputs
Sometimes firms produce more than one product simultaneously. Examples
– Book publishers—text books and novels– Airline manufactures—passenger planes and
fighter jets.– Clothing manufacturers—pants and shirts.
11

Production with Two Outputs—Economiesof Scope
Economies of scope exist when a single firm can produce two products at a lower cost than could be achieved by two different firms each producing one of the products.
What are the advantages of joint production?– Consider an automobile company producing
cars and tanks
12

Production with Two Outputs—Economiesof Scope
Advantages
1) Both use similar capital and labor.
2) The firms share management resources.
3) Both use the same labor skills and type of machinery.
13

Production with Two Outputs—Economiesof Scope
Want some way to measure economies of scope.
The degree of economies of scope measures the savings in cost and can be written:
– C(Q1) is the cost of producing Q1
– C(Q2) is the cost of producing Q2
– C(Q1Q2) is the joint cost of producing both products
)()()()C( SC
2,1
2,121
QQCQQCQCQ −+
=
14

Production with Two Outputs—Economiesof Scope
If SC > 0 -- Economies of scope If SC < 0 -- Diseconomies of scope There is no direct relationship between
economies of scope and economies of scale.– May experience economies of scope and
diseconomies of scale– May have economies of scale and not have
economies of scope 15
Production with Two Outputs—Economiesof Scope
Example—Merger between AOL and Time-Warner.Biggest merger in history at the timeAOL a profitable provider of internet
services.Time Warner a profitable entertainment
company.
16

Economies of Scope—AOL/Time Warner
Both parties believed that the production of these goods used similar inputs, so they could save costs by producing them jointly.In the end it proved too difficult to merge
two different management structures (which is one of the inputs into production). May have been diseconomies of scope.
17

Diseconomy of Scope—GM & GMAC
In 2006 GM was losing money, -$10.6BMost profitable part of the company was
GMAC—it’s financing armDecided to sell 51% of GMAC to Cerberus
for $7.4BFelt GMAC could obtain better access to
money if they were separate from GM
18

Diseconomy of Scope—GM & GMAC
GMAC promptly began to make sub-prime home loansU.S. Treasury invested $16.3B in GMAC
through TARPCurrently, Federal Government owns 37%
of Ally Financial (new name for GMAC)
19

20
21
Comparing Scale and Scope
Economies of scale– Looks at production of one good– Focuses on average cost of that good
Economies of scope– Looks at production of multiple goods– Focuses on total costs for multiple goods or
“set” of goods

Economies of Scope in the Trucking Industry
Issues– Truckload versus less than truck load– Direct versus indirect routing– Length of haul
22

Questions:– Economies of Scale
• Are large-scale, direct hauls cheaper and more profitable than indirect hauls by small trucks?
• Are there cost advantages from operating both direct and indirect hauls?
Economies of Scope in the Trucking Industry
23
Empirical Findings– An analysis of 105 trucking firms examined
four distinct outputs.• Short hauls with partial loads• Intermediate hauls with partial loads• Long hauls with partial loads• Hauls with total loads
Economies of Scope in the Trucking Industry
24

Empirical Findings– Results
• SC = 1.576 for reasonably large firm• SC = 0.104 for very large firms
– Interpretation• Combining partial loads at an intermediate location
lowers costs, management difficulties with very large firms.
Economies of Scope in the Trucking Industry
25

Reasons why economies of scale or scope may occur Aspects of economies of scale: Product-level economies Fixed set-up costs Specialization of inputs Learning by doing
Plant-level economies Engineering relationships Economies of massed reserves (inventories) “Meshing” or indivisibilities
Firm-level economiesMulti-plant operations Economies in input procurement Economies in sales promotion

Product-level economies: fixed setup costs Setup costs: for many production processes there are
setup costs that do not vary with the length of the production run.– firm has to pay the same costs of renting / owning the factory if
they operate the factory 8 or 24 hours a day Example:
https://www.youtube.com/watch?v=9ZnOScQUGKo Fixed setup costs are obviously smaller on a per unit
basis the longer the production run. Tradeoff: inventory holding costs vs. per unit production
costs—a problem for us to solve in operations management.
Product-level economies: specialization of inputs With greater output, it makes sense to break down the
production process into smaller and smaller steps and to specialize tasks among inputs.
This applies to both human inputs (labor) and machinery and equipment (capital).
https://www.youtube.com/watch?v=PKG_TObuyNk https://www.youtube.com/watch?v=SXEsDq7JAMI European Union? “Power Pork: Corporations Begin to Turn Hog Business
into an Assembly Line,” WSJ, 3/28/94. http://gattonweb.uky.edu/faculty/troske/teaching/eco411/articles/Power Pork WSJ 28-03-94.pdf
29
Specialization – Examples
Adam Smith’s pin factoryOne man draws out the wire, another straights it, a third cuts it, a fourth points it, a fifth grinds it at the top for receiving the head; to make the head requires two or three distinct operations; to put it on, is a peculiar business, to whiten the pins is another; it is even a trade by itself to put them into the paper; and the important business of making a pin is, in this manner, divided into about eighteen distinct operations …
Those ten persons, therefore, could make among them upwards of forty-eight thousand pins in a day. Each person, therefore, making a tenth part of forty-eight thousand pins, might be considered as making four thousand eight hundred pins in a day. But if they had all wrought separately and independently, and without any of them having been educated to this peculiar business, they certainly could not each of them have made twenty, perhaps not one pin in a day; that is, certainly, not the two hundred and fortieth, perhaps not the four thousand eight hundredth part of what they are at present capable of performing, in consequence of a proper division and combination of their different operations.

Plant-level economies: engineering relationships
The output of a processing unit tends within certain physical limits to be roughly proportional to the volume of the unit, while the amount of materials and fabrication effort required to construct the unit is more closely proportional to the surface area of the unit’s reaction chambers, storage tanks, connecting pipes, etc.
Rule of two-thirds: the area of a sphere or cylinder varies as the two-thirds power of volume.
What does it all mean, if all you want to do is brew some beer?


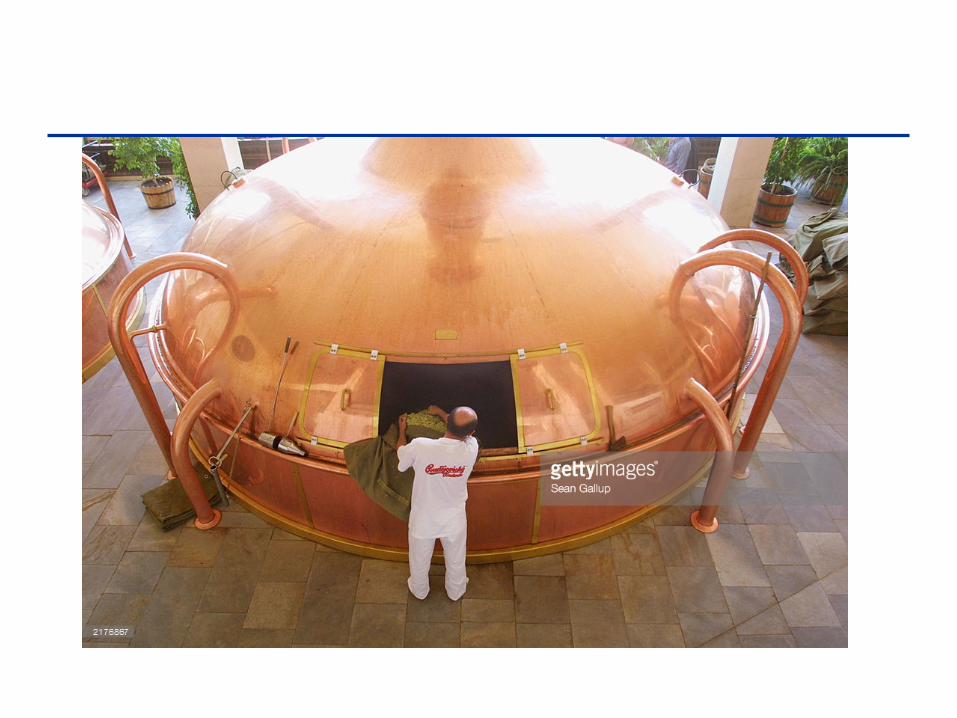

Plant-level economies: engineering relationships
“Meet the World’s Largest Cargo Ships,” WSJ, 1/8/13. http://gattonweb.uky.edu/faculty/troske/teaching/eco411/articles/Cargo Ships WSJ 08-01-13.pdf
Here is an example of how a simple idea, such as putting things in a box, can revolutionize markets: https://www.vox.com/2015/1/22/7869319/largest-container-ship.

Plant-level economies: economies of massed reserves (inventories) Machines sometimes break down. Employees sometimes
don’t show up for work. Input suppliers sometimes don’t deliver. What to do? Shut down? Hold inventories?
How do the reserves (machines, workers, inputs) that you must hold to attain a certain level of reliability vary with the scale of your operations?
Probability of a robot welding machine breaking down (or a line worker not showing up) is 5%, i.e. one day out of twenty. If you have one robot welder in your production line, how many robot welders do you need to hold in reserve in order to reduce the probability of a factory shutdown to 1%? Suppose you scale up by a factor of ten, and have ten robot welders? How many do you need to hold in reserve now?
36
Inventories – Examples
Example 1 – Wal-Mart Superstores, Sam’s Club, Neighborhood Markets– All part of Wal-Mart– They share inventories, reducing each store’s
inventory needExample 2 – Skyteam Alliance
– Co-operation of 20 airlines– If they share airplanes, they can reduce their
inventory of extra airplanes

37
Purchasing
Large buyers receive volume discount– Reduced transaction costs– Cost of service (per unit) is lower for large
buyers– Assured flow of business for the supplier
Example: large brewery may be able to buy glass (for bottles) at lower prices than small micro-breweries

38
Advertising
Larger firms may experience lower cost per potential customer when compared with small regional firms– Consider Meijer vs. Kroger
• If two ads cost the same per-unit (the same price per 1,000 print ads), then, because Kroger has a larger market, they have a lower cost per potential customer

39
Advertising (Continued)
Large firms may convert larger share of potential customers into actual customers– Example: Starbucks vs. Pete’s Coffee
Umbrella branding– New products easier to introduce when the
brand name is already established– Example: Apple started out producing
computers before introducing iPods, iPhones and iPads

40
Advertising (Continued)
Umbrella branding– Doesn't benefit products with much different
perceived quality• Volkswagen, Porsche, Bentley

41
Research and Development
It is not clear whether small firms or large firms have advantage for R&D– Average cost of innovations is smaller at large
firms– Smaller firms may be more suitable for
motivated researchers
Hiring
Large firms have HR departments– Have workers who specialize in hiring– More information about the going wage &
benefits– Better able to hire workers who are a good
match with the firm– Lower average cost for hiring workers
42

Firm-level economies: multi-plant operations Suppose the firm serves a market of non-zero geographic
expanse, and the costs of delivering output to customers (or bringing customers to the place where service is provided) are non-trivial.
If it must reach out to more distant customers in order to increase output, then the firm faces a tradeoff between transportation costs, which increase with distance, and per-unit production costs, which may vary with scale of production.
If shipping costs are low (high value-to-weight ratio) and economies of scale are significant, what configuration of plants is optimal?
If shipping costs are high (low value-to-weight ratio) and economies of scale are not significant, what configuration of plants is optimal?

Multi-plant operations: ABInbev vs. P&G A market of considerable geographic expanse is
served and outbound transportation costs are appreciable: http://www.budweiser.com/en/our-brand/brewery-
locations.html Shipping costs are low relative to the value of the
product, but the firm has complex product lines: http://www.pglocations.com/ http://www.pglocations.com/cape-girardeau/welcome http://www.cincinnati.com/story/money/2014/12/06/pg-
closes-factory-in-north-american-consolidation/20016711/ http://www.bizjournals.com/cincinnati/news/2015/02/10/p-
g-to-build-500m-manufacturing-plant.html

Economies of Scale and Scope in Airlines
In the past airlines seemed to exhibit economies of scale and scopeOperating a plane primarily involves fixed
costs– Want planes to be full– With sufficient number of customers operate
one big plane instead of two small planes
45

Economies of Scale and Scope in Airlines
Led to the hub-and-spoke system– Smaller planes flying passengers going
multiple places from smaller towns to hub in big city
– Larger planes at hub to take passengers from a variety of places to one common location
Discount airlines and lower cost regional jets are changing the size of scope economies
46

47
Diseconomies of Scale
In some situations products produced by larger firms may be more expensive (per unit) than smaller firmsSources of diseconomies of scale
– Labor intensive firms– Bureaucracy– Scarcity of specialized resources– Conflicts of interest
48
Labor Intensive Firms
Firms that are labor-intensive are less likely to benefit from economies of scaleWorkers in large firms are paid more than
“identical” workers in small firms– Workers may be more productive– Larger firms more likely to be unionized– Workers may prefer smaller firms
However, turnover is lower in larger firms

49
Bureaucracy
As firm size grows, managers have more difficulty:– Monitoring and communicating with workers– Evaluating and rewarding individual
performanceLarger firms may discourage creativity of
workers– Xerox & Windows
50
Scarcity of Specialized Resources
Some resources have limited availability, so larger firms will have less access to this resourceExamples:
– Talented managers– Coastline (or desirable location more
generally)

51
Conflict of Interest
Professional services firms may find it difficult to sign up a client if a competitor is already a client of the firmThe need to share sensitive information
may impose a limit to the growth of the firmExamples include advertising agencies,
management consultants, and lawyers– Growth of multi-national law firms—Bingham
52
Diseconomies of Scale
“McDonald's Menu Problem: It's Supersized,” WSJ, 12/4/14. http://gattonweb.uky.edu/faculty/troske/teaching/eco411/articles/McDonalds Menu Problems WSJ 12-4-14.pdf
“Starbucks Aims to Boost Its Food Sales in the U.S.,” WSJ 12/5/14. http://gattonweb.uky.edu/faculty/troske/teaching/eco411/articles/Starbucks Boosts Food Sales WSJ 12-5-14.pdf

Dynamic Changes inCosts--The Learning Curve
When intricate labor operations must be performed or when complex adjustments must worked out by trial and error, per unit costs fall as the cumulative volume of production increases and workers learn by doing.
This phenomenon is known as the Learning Curve.
The learning curve measures the impact of workers’ experience on the costs of production.
– It describes the relationship between a firm’s cumulative output and amount of inputs needed to produce a unit of output.
53

The Learning Curve
Cumulative units of output produced
Hours of laborper unit of output
10 20 30 40 500
2
4
6
8
10
54
The Learning Curve
Hours of laborper unit of output
10 20 30 40 500
2
4
6
8
10
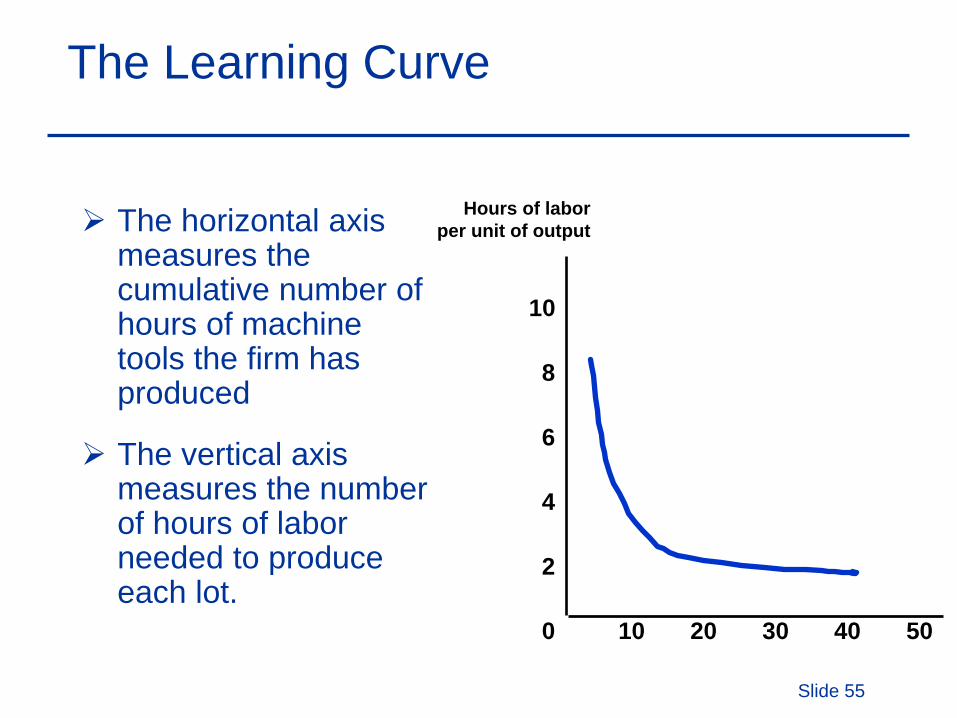
The horizontal axis measures the cumulative number of hours of machine tools the firm has produced
The vertical axis measures the number of hours of labor needed to produce each lot.
Slide 55

The learning curve in the figure is based on the relationship:
β−+= BNAL
1 and 0between is and positive are constants are and
output ofunit per input labor producedoutput of units cumulative
ββ
B & ABA,
LN==
Dynamic Changes inCosts--The Learning Curve
56

– L equals A + B and this measures labor
input to produce the first unit of output
– Labor input remains constant as the cumulative level of output increases, so there is no learning
:0=βIf
:1=NIf
Dynamic Changes inCosts--The Learning Curve
57

– L approaches A, and A represent minimum
labor input/unit of output after all learning has taken place.
– The more important the learning effect.
:increases and 0 NIf >β
:larger The β
Dynamic Changes inCosts--The Learning Curve
58

The Learning Curve
Cumulative units ofoutput produced
Hours of laborper unit of output
10 20 30 40 500
2
4
6
8
10
31.0−=β
The chart shows a sharp dropin lots to a cumulative amount of
20, then small savings at higher levels.
Doubling cumulative output causesa 20% reduction in the difference between the input required and
minimum attainable input requirement.
59

Observations
1) New firms may experience a learning curve, not economies of scale.
2) Older firms have relatively smallgains from learning.
Dynamic Changes inCosts--The Learning Curve
60

Economies ofScale Versus Learning
Output
Cost($ per unitof output)
AC1
B
Economies of ScaleA
AC2
Learning C
61

Predicting the LaborRequirements of Producing a Given Output
10 1.00 10.020 .80 18.0 (10.0 + 8.0)30 .70 25.0 (18.0 + 7.0)40 .64 31.4 (25.0 + 6.4)50 .60 37.4 (31.4 + 6.0)60 .56 43.0 (37.4 + 5.6)70 .53 48.3 (43.0 + 5.3)80 and over .51 53.4 (48.3 + 5.1)
Cumulative Output Per-Unit Labor Requirement Total Labor(N) for each 10 units of Output (L) Requirement
62
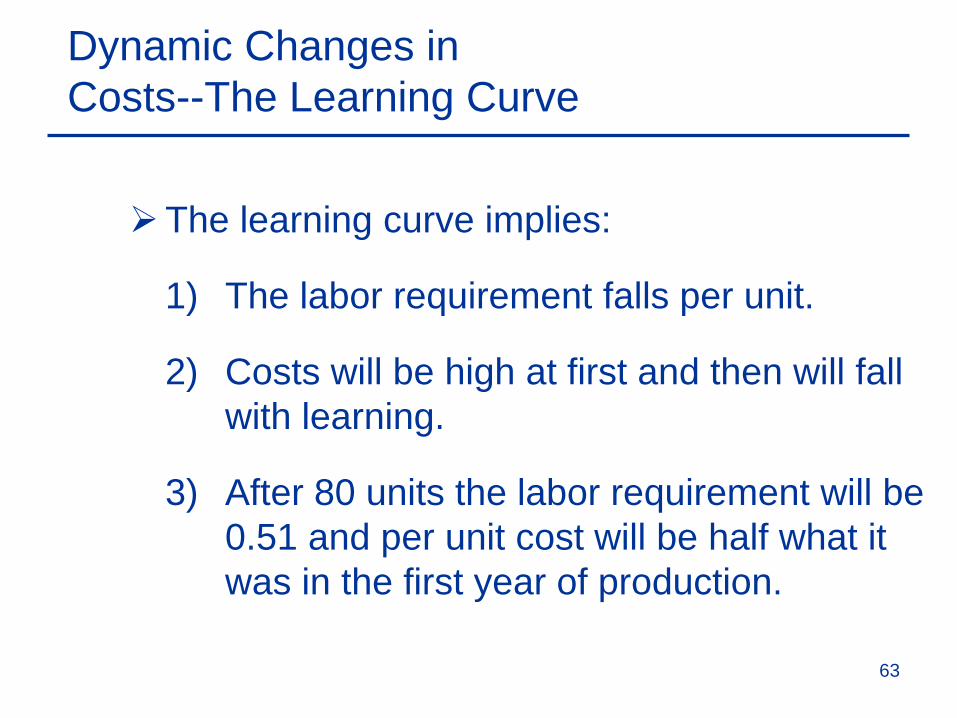
The learning curve implies:
1) The labor requirement falls per unit.
2) Costs will be high at first and then will fall with learning.
3) After 80 units the labor requirement will be 0.51 and per unit cost will be half what it was in the first year of production.
Dynamic Changes inCosts--The Learning Curve
63
Scenario– A new firm enters the chemical processing industry.
Do they:
1) Produce a low level of output and sell at a high price?
2) Produce a high level of output and sell at a low price?
The Learning Curve in Practice
64

The Learning Curve in Practice
How would the learning curve influence your decision?
65

The Empirical Findings– Study of 37 chemical products
• Average cost fell 5.5% per year• For each doubling of plant size, average
production costs fall by 11%• For each doubling of cumulative output, the
average cost of production falls by 27%
Which is more important, the economies of scale or learning effects?
The Learning Curve in Practice
66

Other Empirical Findings– In the semi-conductor industry a study of
seven generations of DRAM semiconductors from 1974-1992 found learning rates averaged 20%.
– In the aircraft industry the learning rates are as high as 40%.
The Learning Curve in Practice
67

Would you, as an airline passenger, like to be part of the learning process that Boeing workers go through?
http://online.wsj.com/articles/boeing-struggles-to-find-buyers-for-early-version-dreamliners-1409347948?mod=WSJ_hp_LEFTWhatsNewsCollection.
Is there a similar learning curve phenomenon associated with Toyota’s introduction of a new model of the Camry?
The Learning Curve in Practice
68

Recent study of production of a new car in an unnamed car manufacturer showed substantial evidence of learning-by-doing:– Defects per car fell from 70 to 20 in the initial 8 weeks
of production– Defects per car fell to 10 in the remaining weeks of
the production year– Estimate show β = -0.3
The Learning Curve in Practice
69

Applying Learning Curves
1) To determine if it is profitable to enter an industry.
2) To determine when profits will occur based on plant size and cumulative output.
The Learning Curve in Practice
70

Product Life Cycle
Introduction Growth Maturity Decline
Sale
s
Time
Learning by doing and economies of scale often lead to this product lifecycle
71

Diversification
So far we have focused firms operating in a single line of businessMany firms operate in multiple lines of
business– General Electric– PepsiCo– Siemens– Mitsubishi Group
72

Why Do Firms Diversity?
Want to ask why firms chose to operate in multiple lines of businessWhat is the primary responsibility of a
corporate CEO?What does Coase’s Theory of the Firm tell
us?Are there other reasons firms might
diversity?
73

Why Do Firms Diversity?
Efficiency reasons for firms to diversity– Scope economies represent main justification
for diversification• Exploit some underutilized resource with large
fixed cost– Managerial talent is often one resource
• Steve Jobs & Apple• Bill Gates, Steve Balmer & Microsoft
74

Why Do Firms Diversity?
Efficiency reasons for firms to diversity– Internal Capital Markets
• Some firms can use internal capital markets to finance diversification
• Firms have excess working capital• Is this a good idea?
– Recent debates at GM and Yahoo
75
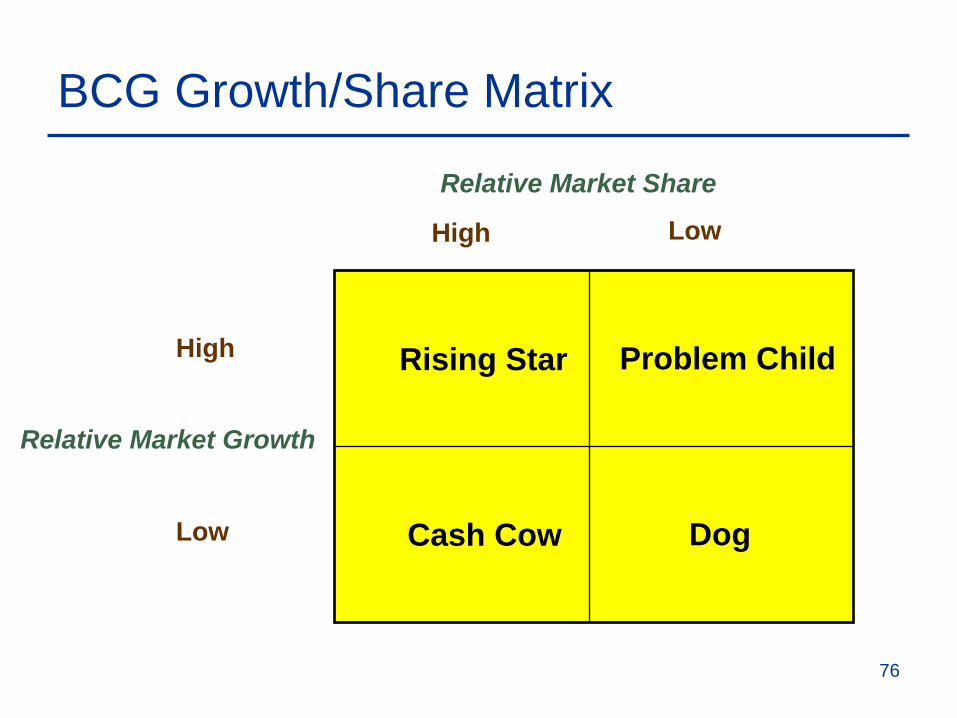
BCG Growth/Share Matrix
Relative Market Share
Relative Market Growth
High Low
High
Low
Rising Star Problem Child
DogCash Cow
76

BCG Growth/Share Matrix
Matrix based on taking advantage of learning curves and product lifecycle– Use money generated by cash cows to
finance growth of problem-child and rising starDoes this work?
– Sometimes yes; sometimes noAlready seen that learning-by-doing does
not always occurWhy not just borrow from the market?
77

Internal Capital Markets
When should firms use internal capital markets?– Firm may have asymmetric information– Lemons problem—use external financing for
least profitable opportunities– Hard to borrow more money if you already
have debt– May be able to allocate best workers to new
projects
78

Internal Capital Markets
Problems with using internal capital markets?– Market provides discipline
• If market is unwilling to finance a project is it really all that profitable?
– How do managers decide among competing projects without prices?
– Opportunity cost of capital
79

Why Do Firms Diversity?
Questionable reasons for diversification– Help shareholders diversify their portfolio– Identifying undervalued firms
• Why are managers of a firm better at spotting undervalued firms than professional investors?
• Winner’s curse
Reasons not to diversify– Diversification only works if there are scope
economies– Increased bureaucracy
80

Why Do Firms Diversity?
Managerial reasons to diversity– Increase growth (but not necessarily profits)– More stable growth– Prestige
81

Corporate Governance
What are managers supposed to do?How do shareholders/owners ensure that
managers act in their own best interest?
82
Market for Corporate Control
Publicly traded firms are vulnerable to hostile takeovers Market for corporate control is an important
constraint on the managersIf managers undertake unwise acquisitions,
the stock price drops, reflecting– Overpayment for the acquisition– Potential future overpayment by the incumbent
management

Market for Corporate Control
In an LBO, debt is used to buy out most of the equityFuture free cash flows are committed to
debt serviceDebt burden limits manager’s ability to
expand the business

Market for Corporate Control
Gains in efficiencies in LBOs were substantialEven when firms defaulted on their debt the
net effect was beneficialCorporate raiders profited handsomely for
taking over and busting up firms that pursued unprofitable diversification

Market for Corporate Control
LBOs may hurt other stakeholders– Employees– Bondholders– Suppliers
Wealth created by LBO may be quasi-rents extracted from stakeholdersRedistribution of wealth may adversely
affect economic efficiency

Diversifying Acquisitions
Shareholders of the acquiring firms do not benefit from the acquisitions Negative effects on the acquiring firms are
more severe when: – the managers of the acquiring firms were
performing poorly before the acquisition– the CEOs of the acquiring firms hold smaller
share of the firms’ equity
Diversification & Long-Term Performance
Long term performance of diversified firms appears to be poor.A third to half of all acquisitions and over
half of all new business acquisitions are eventually divested.Corporate refocusing of the 1980s could be
viewed as a correction to the conglomerate merger wave of the 1960s.Has to be a good economic reason for
diversifying—economies of scope
Diversification
Why might a large beer producer buy a craft beer producer?http://gattonweb.uky.edu/faculty/troske/tea
ching/eco411/articles/Beer Conglomerates Crafty WSJ 12-29-14.pdf
89

Summary
Economies of scale occur when the average cost of producing additional output falls as you produce moreThe minimum efficient scale is the size of
a plant at which the long-run average costs in minimized
90

Summary
Economies of scope exist when it costs less to produce multiple products in the same factory than it costs to produce the products separatelyAn important source of economies of scale
and scope is the spreading of indivisible fixed costs
91
Summary
The learning curve shows how costs change as we produce more outputExploiting economies is the principle
reason for diversificationOften hard to exploit economies of scope
through diversification
92