trade policy and firm boundaries - ecares
TRANSCRIPT

Do Prices Determine Vertical Integration?Evidence from Trade Policy∗
Laura AlfaroHarvard Business School and NBER
Paola ConconiUniversite Libre de Bruxelles (ECARES) and CEPR
Harald FadingerUniversity of Vienna
Andrew F. NewmanBoston University and CEPR
July 2012
Abstract
This paper shows that product prices determine organizational design by studying howtrade policy affects vertical integration. Property rights theory asserts that firm bound-aries are chosen by stakeholders to mediate organizational goals (e.g., profits) and privatebenefits (e.g., operating in preferred ways). We present an incomplete-contracts model inwhich vertical integration raises output at the expense of lower private benefits. A keyimplication is that higher prices should result in more integration, since the organizationalgoal becomes relatively more valuable than private benefits. Trade policy provides a sourceof exogenous price variation to test this proposition: higher tariffs should lead to morevertical integration; moreover, ownership structures should be more alike across countrieswith similar levels of protection. To assess the evidence, we construct firm-level indices ofvertical integration for a large set of countries and industries and exploit cross-section andtime-series variation in import tariffs to examine the impact of prices on organizationalchoices. Our empirical results provide strong support for the predictions of the model.
JEL classifications: D2, L2,
Keywords: theory of the firm, incomplete contracts, vertical integration, product prices.
∗We wish to thank for their comments participants at the the 2010 AEA conference in Atlanta, the 2010MWIEG meeting at Northwestern University, the 2010 Hitotsubashi COE Conference on International Tradeand FDI, the 2011 CEPR ERWIT conference, the 2012 International Research Conference at Harvard BusinessSchool, the 2012 FREIT Ljubljana, the 2012 NBER Summer Institute on Development and Productivity, andseminar participants at ETH Zurich, Universite Catholique de Louvain (CORE), University of Munich, Universityof Innsbruck, K.U. Leuven, University of Vienna, London School of Economics, and MIT. We are particularlygrateful to Robby Akerlof, Nick Bloom, Holger Breinlich, Bob Gibbons, Gene Grossman, Maria Guadalupe,Oleg Itskhoki, Margaret Mcmillan, Emanuel Ornelas, Ralph Ossa, Steve Redding, Raffaella Sadun, John VanReenen, and Chris Woodruff for their valuable suggestions. Research funding from the FNRS and the EuropeanCommission (PEGGED collaborative project) is gratefully acknowledged by Paola Conconi. We thank FranciscoPino, Andrea Colombo and Qiang Wang for excellent research assistance.

1 Introduction
What determines firm boundaries? How many links in a supply chain are to be integrated
into a single firm? Answering these questions has been a fundamental concern of organization
economics since Coase’s (1937)’s seminal paper. As emphasized by the modern theory of the
firm (Grossman and Hart 1986, Hart and Moore, 1990, Holmstrom and Milgrom 1991), firm
boundaries affect incentives and therefore are likely to have significant productivity impacts on
individual firms. More recently, these firm-level effects have been shown theoretically to have
implications for industry performance as well (Legros and Newman, 2009). Thus, an under-
standing of the determinants of vertical integration has implications far beyond the boundaries
of organizational economics.
In incomplete contracts models, property rights over assets, which define firm boundaries
and determine allocations of control over production decisions, are chosen to mediate how a
firm’s stakeholders trade off collective goals and private interests. Recent theoretical work has
embedded these models into market settings to study how firms’ boundary choices are affected
by market conditions. In particular, market thickness, demand elasticities, and terms of trade
in supplier markets may have an impact on firms’ vertical integration decisions (e.g., McLaren,
2000; Grossman and Helpman, 2002; Legros and Newman, 2008). So far, evidence on the
importance of these factors is sparse.
In this paper, we exploit variation in the degree of trade protection faced by firms to show
that market conditions — in particular the level of product prices — do matter for vertical
integration. The reason for this predicted result is that managers of the organization not only
have a stake in the organizational goal, but also derive private, non-contractible benefits. When
the organization is not integrated, managers heading its different units act independently, taking
heavy account of their private benefits, which leads non-contractible production decisions that
do not favor output. Integration puts more decisions in the hands of a single decision maker
with strong incentives to coordinate, so as to maximize benefits to the organization. Low levels
of integration are thus associated with high private benefits and low productivity, higher levels
with high production and productivity but also high private costs. Market price enters the
tradeoff because it directly affects the organization’s profit objective, but has a negligible impact
on managers’ private costs. As the market price rises, the tradeoff is resolved in favor of more
integration, since the organizational goal is relatively more valuable than private goals.
The straightforward empirical strategy to verify whether product prices and the degree of
vertical integration are positively correlated, as suggested by this organizational theory, would be
to regress some measure of vertical integration on industry prices. The main difficulty with this
approach is that it would not allow us to clearly distinguish the organizational model we have out-
lined, in which higher prices lead to more integration, from models that predict the same positive
correlation, but with causality going the opposite way. According to these “market-foreclosure”
1

theories, in imperfectly competitive industries, firms may integrate with their suppliers to re-
duce competition with their rivals, thus pushing product prices higher.1 Testing whether product
prices affect organization design thus requires an exogenous source of price variation.
In this respect, trade policy provides an ideal proving ground: the degree of trade protection
obviously affects equilibrium prices, but is unlikely to be influenced by firms’ vertical integration
decisions. The main prediction of our theory is that import tariffs, by increasing product prices
in the domestic market, should lead to more vertical integration. This effect should be stronger
for firms that operate only in the domestic market, since their organizational objectives depend
exclusively on domestic prices; in contrast, exporters and multinational firms should be less
affected, since their decisions are also affected by prices in foreign markets. Moreover, the effect
of tariffs on organization should be stronger in sectors where product prices are more sensitive
to tariffs.
We examine the organizational effects of applied Most-Favored-Nation (MFN) tariffs. Under
the MFN principle set out in the first article of the General Agreement on Tariffs and Trade
(GATT), member countries agree not to discriminate between their trading partners (with the
exception of regional trading partners and developing countries). MFN tariffs are the results
of long-term multilateral trade negotiations, in which GATT/WTO members commit not to
exceed certain tariff rates; if a member raises its MFN tariffs above the agreed bound level,
other members can take it to dispute settlement. As a result, MFN tariffs are less responsive
to domestic political pressure than administrative measures for the regulation of imports, such
as anti-dumping and countervailing duties (e.g., Finger et al, 1982).2 In our main empirical
analysis, we exploit cross-sectoral and cross-country variation in MFN tariffs applied in 2004
to study the impact of product prices on firm-level vertical integration.3 Reverse causality is
unlikely to be a concern for our analysis, since the MFN tariffs faced by firms in 2004 were
determined during the Uruguay Round of multilateral trade negotiations (1986-1994).4
To study firm organization across a wide range of countries, we use the WorldBase dataset
from Dun and Bradstreet (D&B), which contains both listed and unlisted plant-level observations
for a large set of countries and territories. For each plant, the dataset includes information
about its different production activities at the 4-digit SIC level, as well as about ownership
(e.g., its domestic or global parent). To measure vertical integration, we follow the methodology
1See Salinger (1988) for an early contribution and Rey and Tirole (2007) for a survey.2This is one of the reasons why empirical papers on the political economy of trade policy use of coverage ratios
of non-tariff barriers (NTB) rather than MFN tariffs to test lobbying models (e.g., Goldberg and Maggi, 1999;Bombardini, 2008).
3MFN tariffs vary substantially both across sectors within countries and across countries for a given sector. Forexample, U.S. manufacturing tariffs in 2004 averaged 2.4 percent, with a minimum of zero and a maximum of 350percent. As an example of cross-country variation, for a sector like SIC 3631 (Household Cooking Equipment),MFN tariffs varied between zero and 29 percent, with an average of 3.15 percent.
4Since the Uruguay Round, GATT/WTO members have not changed their MFN tariff bounds. Appliedrates have changed little over time, since they coincide with the bound rates for most countries and sectors (seewww.wto.org).
2

developed by Fan and Lang (2000) and Acemoglu, Johnson and Mitton (2009). By combining
information on firms’ production activities with input-output tables, we construct firm-level
vertical integration indices that measure the fraction of inputs used in the production of a firm’s
final good that can be produced in house. In our main empirical analysis, we focus on firms
that are located in only one country. These provide a cleaner analysis of the effects of tariffs
on firms’ ownership structure, since their vertical integration decisions should depend only on
domestic prices. In the case of multinational corporations, on the other hand, it is harder to
identify the relevant prices and tariffs. Moreover, focusing on national firms avoids issues having
to do with the strategic behavior of multinationals across markets (e.g., transfer pricing, tariff
jumping, export platforms).
Our empirical analysis provides strong support for the predictions of the model. We find
that, the higher is the MFN tariff applied by a country on the imports of a given product, the
more vertically integrated are the firms producing that product in that country. The effect is
larger when we would expect organizational decisions to be more responsive to import tariffs,
i.e., for firms that only serve the domestic market and in sectors in which MFN tariffs have
a larger impact on domestic prices. Our results are robust to constructing vertical integration
indices in different ways, including standard determinants of firm boundaries, using alternative
econometric methodologies, and focusing on different samples of firms and countries.
In terms of magnitude, in our baseline estimation, a 100 percent tariff increase leads to a
2.15 percent increase in the vertical integration index, implying that increasing tariffs from 1
percent to their mean level of around 5 percent would increase vertical integration by more
than 8 percent. Notice, however, that our estimates should be interpreted as a lower bound on
the impact of prices on vertical integration, since domestic prices do not fully adjust to tariff
changes.5 The true impact is likely to be substantially larger.6
In our theory, in which firms are price takers, import tariffs affect firms’ organization only
through their effect on domestic prices. However, tariffs may also have an impact on the degree
of competition faced by domestic firms, which may also shape vertical integration decisions
(Aghion, Griffith, and Howitt, 2006). To isolate the effect of product prices, we restrict our
analysis to highly competitive sectors, in which tariffs will have little or no effect on the degree
of competition, obtaining even stronger results.
To establish a causal link between tariffs and vertical integration, we also show that our results
are not driven by omitted variables, which might be correlated with both vertical integration
decisions and MFN tariffs. First, large firms or concentrated industries could be more effective at
5In the case of ad valorem tariffs, domestic prices will vary by less than the tariff. Tariff pass-through mayalso be attenuated if firms have market power and adjust their markups. Finally, to the extend that a country islarge, i.e., can affect world prices, imposing a tariff will have an impact on the world price and the elasticity ofdomestic prices with respect to tariffs will also be less than one.
6To get a sense of the magnitude of the effects of prices on organization, one would ideally instrument priceswith MFN tariffs; however, this would require comparable cross country data on domestic prices, which are verydifficult to obtain (see Bradford, 2003).
3

lobbying for protection and may also be more vertically integrated. Second, tariffs that exporters
face in other markers or tariffs on imported inputs are likely to be correlated with tariffs on final
products and may also affect firms’ organization decisions. Our results are unaffected when
including these controls in our analysis.
An alternative strategy to verify the impact of trade policy on firm boundaries is to focus
on trade liberalization reforms — major unilateral or multilateral liberalization episodes, or
the creation of regional trade agreements — thus exploiting time variation in the degree of
protectionism faced by firms. The challenge with implementing this strategy is data availability,
since we can only construct firm-level vertical integration measures for recent years, during which
there have been few trade liberalization reforms.7 The only major trade liberalization episode
that has occurred in recent years is arguably the entry of China into the WTO in 2001: to be
accepted as a WTO member, China had to undertake a series of important tariff reductions
so as to substantially expand market access for goods from foreign countries. We examine the
organizational effects of these trade policy changes, comparing the ownership structure of Chinese
firms before and after WTO accession (in 1999 and 2007). Consistent with the predictions of
our theoretical model, we find that firm-level vertical integration has fallen more in sectors that
have experienced larger tariff cuts.
We also study the effect of trade policy on the degree of organizational convergence across
countries. Our theory suggests that countries with similar domestic price levels should have
firms with similar ownership structures. In line with this prediction, we show that differences
in vertical integration across countries are significantly larger in sectors in which differences in
MFN tariffs (and therefore differences in domestic prices) are larger. Moreover, we find that
differences in vertical integration indices are smaller for country pairs engaged in regional trade
agreements.8 This effect is stronger for customs unions, which impose common external tariffs
vis-a-vis non-members and should thus be characterized by stronger price convergence.
Our paper contributes to a recent stream of empirical work that examines the determinants
of firms’ vertical integration decisions (i.e., firm boundaries/ownership structure). Some studies
focus on single industries. These include the seminal papers by Stuckey (1983) on integration
between aluminium refineries and bauxite mines and Joskow (1987) on ownership arrangements
in electricity generating plants, as well as the more recent studies by Baker and Hubbard (2003,
2004) on the trucking industry, Woodruff (2002) on Mexican footwear. More closely related to our
analysis is the paper by Hortacsu and Syverson (2007) on vertical integration in the U.S. cement
industry, which examine whether vertical integration leads to higher prices. In contrast with the
7Important trade liberalization episodes, such as the conclusion of the Uruguay Round of GATT/WTO tradenegotiations, the North American Free Trade Agreement (NAFTA), or the free trade agreements between EasternEuropean countries and the European Community, all occurred in the early or mid-nineties.
8As mentioned above, under Article I of the GATT, countries have to apply the same MFN tariff to all tradingpartners. Preferential treatment can only be granted to partners in regional trade agreements (Article XXIV ofthe GATT) or to developing countries (in the context of the Generalized System of Preferences (GSP) allowedby the Enabling Clause).
4

predictions of market foreclosure theories, they find that prices fall when markets become more
integrated. The focus of our analysis is on the opposite direction of causality, i.e., the impact of
product prices on vertical integration decisions. Other studies have focused on a single country.
For example, Acemoglu, Aghion, Griffith and Zilibotti (2010) use data on British manufacturing
plants to study the relationship between vertical integration and rates of innovation. Aghion,
Griffith and Howitt (2006) investigate whether the propensity for firms to vertically integrate
varies systematically with the extent of competition in the product market. In terms of data
and methodology, our analysis is closely related to the paper by Acemoglu, Johnson and Mitton
(2009), who study the determinants of vertical integration using a cross-section of D&B data for
93 countries, focusing on the role of financial development and contracting costs. Ours is the
first paper to examine how product prices affect integration decisions.
Another stream of the literature has not focused on vertical integration decisions, but rather
on other aspects of organization, such as management practices or the degree of delegation within
firms. Bloom and Van Reenen (2007) study managerial practices in medium-sized manufacturing
firms in the US and Europe (France, Germany and the UK), finding that best practices are
strongly associated with superior firm performance. Bloom, Sadun and Van Reenen (2010),
using survey data on medium-sized manufacturing firms across a dozen countries, find that
greater product market competition increases decentralization. Bloom, Sadun and Van Reenen
(2012) collect data on the decentralization of investment, hiring, production, and sales decisions
for almost 4,000 firms in the United States, Europe, and Asia, finding that firms headquartered
in high trust regions are more likely to decentralize. Guadalupe and Wulf (2010) show that
the 1989 Canada-United States Free Trade Agreement (CUSFTA) led large U.S. firms to flatten
their hierarchies.
Finally, various papers examine whether goods are sold within or across firm boundaries in
the global economy, focusing mostly on the importance of contract enforcement and relationship-
specific investments (e.g., Antras, 2003; Nunn, 2007). In this literature, only a few papers have
considered the role of trade policy. These include Ornelas and Turner (2008), which examines the
impact of tariffs on suppliers’ hold-up incentives, Conconi, Legros and Newman (2012), which
examines how the liberalization of product and factor markets affects the ownership structure of
firms, and Antras and Staiger (2012), which studies the trade policy implications of the offshoring
of intermediate inputs. This is the first paper to examine how tariffs affect vertical integration
decisions through their impact on product prices.
The rest of the paper is organized as follows. Section 2 presents a theoretical framework to
guide our empirical analysis. Section 3 describes our data. Section 4 presents our main results on
tariffs and vertical integration, including both cross-sectional and time series evidence. Section
5 analyzes the impact of trade policy on the degree of cross-country organizational convergence.
The last section concludes.
5

2 Theoretical framework
In what follows, we describe a simple theoretical framework to guide our empirical analysis. This
is meant to capture the features of a class of organizational models in which vertical integration
decisions mediate how a firm’s stakeholders trade off their pecuniary stake in the organizational
goal against their private interests.
We adapt the model by Legros and Newman (2009), inspired by Hart and Holmstrom (2010),
in which managers of different production units trade off the benefits of coordinating production
decisions against the cost of accommodating to common ways of doing things. A feature of this
model is that vertical integration generates more output than non-integration, but imposes a
fixed cost on managers, who lose the ability to operate in their preferred ways. For simplicity,
in the simple version of the model described below, there are only two inputs of production, so
vertical integration is a dichotomous choice. The analysis can be generalized to a setting with
N inputs, in which stakeholders choose the optimal degree of integration.
Setup
We consider a perfectly competitive industry populated by “organizational” rather than “neo-
classical” firms. Production requires certain non-contractible decisions that are undertaken by
managers running different supplier units, whose interests are imperfectly aligned with each other
and with the goal of the enterprise; the choice of ownership structure helps to govern the tradeoff
between the managers’ organizational and private goals. The general property of this model is
that vertical integration generates more output than non-integration, but involves higher (fixed)
costs for the managers. As a result, the price of output helps determine firm boundary decisions;
since tariffs affect output prices, they also influence firm boundaries.
Demand for that good is given by D(p) (consumers have quasi-linear utility), where p is the
industry price. Production of the good requires the cooperation of two types of input suppliers,
denoted A and B. B suppliers generate no value without being matched with an A; A suppliers
can either match with a B or engage in stand-alone production of a numeraire good, the price of
which is normalized to 1. Many interpretations of the A and B firms are possible. For example,
A suppliers may represent light assembly plants or basic inputs, such as energy, or various
business services (e.g., IT, retailing, logistics) that can be used to produce basic consumer goods
or combined with other inputs (B suppliers) to produce more complex goods.
All goods are sold under conditions of perfect competition. There is a continuum of each
type of supplier, with a measure n < 1 of B’s, and a unit measure of A’s. Since the aggregate
supply of A’s exceeds that of the B’s, a positive amount of numeraire is produced in equilibrium.
An equilibrium in the supplier market consists of a stable match between each B supplier
and an A supplier: given the surplus allocation among all the suppliers, no (A,B) pair can form
an enterprise that generates higher than equilibrium payoffs for each partner. All A suppliers
6

are equally productive when matched with one of the B’s. A stand-alone A produces α units of
the numeraire good. Since the price of the numeraire is equal to unity, this also pins down the
equilibrium payoff for all A’s.9
Individual enterprises
We adopt a simple model of firm boundaries based on a tradeoff between the pecuniary benefits of
coordinating production decisions and managers’ private benefits of operating in their preferred
ways. As in Grossman and Hart (1986), integration and non-integration both suffer from incentive
costs. However, in the framework described below, these emerge in a particularly tractable way:
integration, though more productive because of better coordination, imposes a fixed cost on
managers, by forcing them to adopt a common “compromise” solution.10
Once an enterprise composed of an A and a B has formed in the supplier market, a non-
contractible decision (e.g., choosing compatible technologies, deciding on marketing campaigns)
about the way in which production is to be carried out must be made by each unit. Denote the
A and B decisions respectively by a ∈ [0, 1] and b ∈ [0, 1]. Successful production requires
coordination between the two suppliers. More precisely, the enterprise will succeed with a
probability 1−(a−b)2, in which case it generates R > 0 units of output; otherwise it fails, yielding
0. Output realizations are independent across enterprises (A-B pairs). We allow R to vary across
enterprises, so it can be interpreted as some measure of enterprise-specific productivity.
Managers are risk-neutral and bear a private cost of implementing the decision made by their
units. The A manager’s utility is yA − (1 − a)2, the B manager’s is yB − b2, where yA, yB ≥ 0
are their respective incomes and (1−a)2 and b2 are their costs. Though both managers of the A
and B units enjoy monetary returns, they view their operations differently: A’s most preferred
action is 1, while B’s is 0. For instance, a standardized production line could be convenient for
A suppliers, but may not fit the specific design needs of the B suppliers. Because managers’
primary function is to implement decisions and convince their workforces to comply, they bear
the cost of decisions even if they don’t make them.
Assignment of decision rights via possible sale of assets is the organizational design problem
in the model. Managers may remain non-integrated and retain control over their respective
decisions. Or they can choose to integrate into a single firm by engaging a headquarters (HQ),
transferring to it, in exchange for an acquisition fee, a share of the realized revenue and the power
to decide a and b. HQ is motivated only by monetary considerations (the desire to maximize
the integrated firm’s income) and incurs no costs for operating in a particular way.
9See Conconi, Legros and Newman (2011) for a more general setup, in which the outside option of A suppliersis endogenously determined
10It is this feature that leads to the main comparative static for our empirical investigation: at low prices, rev-enues are small enough that managers are more concerned with their private benefits and remain non-integrated;at higher prices, output is more valuable, so managers prefer vertical integration.
7

Before production, B managers match with A managers and sign contracts specifying an
ownership structure and payment scheme. For simplicity, we take the payment scheme to be
a fixed payment T from B to A. Because A’s are in excess supply, they must all receive α in
equilibrium. Thus T will just cover A’s anticipated private cost of production together with the
opportunity cost α.11
For each match (A,B), total revenue in event of success is given by the number of units
produced, R, times the product market price, p, which is taken as given and correctly anticipated
when managers and HQ’s sign the contracts and make their decisions. After contracts are signed,
managers and HQ’s make their production decisions, output is realized, product is sold, and
revenue shares are distributed.
Integration
HQ’s are elastically supplied at a cost normalized to zero. After paying its acquisition fee and
receiving its compensating share of revenue, an HQ’s payoff is proportional to (1− (a− b)2)Rp.12
HQs decide both a and b, and since their incentive is to maximize he integrated firms’ expected
revenue, they choose a = b. Among the choices in which a = b, the Pareto-dominant one is that
in which a = b = 1/2, which minimizes the total cost of the A and B managers. We assume
HQs implement this choice. The private cost to each manager is then 14, and the payoffs to the
A and B managers are equal to α and Rp− α− 12, respectively (thus T = α + 1
4).
Non-integration
Under non-integration, managers retain control of their respective activities. The decisions
chosen are the (unique) Nash equilibrium of the game with payoffs T − (1 − a)2 for A, who
chooses a, and (1− (a− b)2)Rp − b2 − T for B, who chooses b. Nash decisions are a = 1 and
b = Rp/(1 +Rp), with resulting expected output 1− 1(1+Rp)2
. Notice that output increases with
price: as p becomes larger, the revenue motive becomes more important for B managers, pushing
them to better coordinate with their A partners. The equilibrium transfer from B to A under
non-integration is T = α; the payoffs are α for A’s and (Rp)2
1+Rp− α for B’s.
Choice of ownership structure
To determine managers’ choice of firm boundaries, we must compare their payoffs under integra-
tion and non-integration. Notice that A suppliers obtain α in both cases, so they are indifferent
11In general, B may prefer to give A a positive contingent share of revenue. This complicates notation but doesnot change any qualitative conclusion regarding the dependence of integration on price (see Legros and Newman,2012).
12The size of HQ’s share is indeterminate and could be pinned down in many ways not modeled here; all thatmatters for our purposes is that it is positive. In fact, an HQ with control over a and b would never accept azero revenue share: she could always renegotiate to something positive. See Legros-Newman (2012).
8

about the organizational choice. B suppliers obtain a higher payoff under integration if and only
if Rp− 12> (Rp)2
1+Rpor p > 1/R. Thus managers’ organizational choices depend on product prices.
At low prices, revenues are small enough that integration’s better output performance is not
valuable enough to the B to be worth the private cost he would have to bear; thus, B opts for
the “quiet life” of non-integration, wherein both profits and costs are low. At higher prices, the
B manager’s revenue motive now makes higher output and therefore coordination more valuable.
Coordinating under non-integration would entail large and costly concessions from B to A, who
chooses a = 1 independently of the price; the compromise choice a = b = 12, is now preferable,
so B chooses to integrate. Clearly, the price at which an enterprise integrates is lower when its
productivity R is higher. This is because the cost of integrating is independent of productivity,
while the benefit in terms of increased output (therefore profit) is larger when the enterprise is
more productive.
Product market equilibrium and the OAS curve
A industry equilibrium entails clearing supplier and product markets. We have already charac-
terized the supplier market: every A receives α, either by producing by herself α units of the
numeraire, or by matching with with a B to produce the industry good for a net payoff of α.
In the product market, the large number of enterprises implies that with probability one
the supply is equal to the expected value of output given p; equilibrium requires that this price
adjusts so that demand equals supply.
To derive industry supply, suppose R is distributed in the population according to some
continuous c.d.f. G(R) with mean 1 and support [R,R]. Since all enterprises with R < 1/p
remain non-integrated, and the remaining ones integrate, total supply at price p ∈ [1/R, 1/R] is
(recall that n is the measure of B suppliers)
S(p) = n
[∫ 1/p
R
R(1− (1
1 +Rp)2)dG(R) +
∫ R
1/p
RdG(R)
]. (1)
If p < 1/R, supply is n∫ R
RR(1− ( 1
1+Rp)2)dG(R); if p > 1/R, it is n.
Figure 1 depicts the Organizationally Augmented Supply (OAS) curve, which incorporates
the ownership structure decisions of the industry’s enterprises as well as the usual price-quantity
relationship. It also illustrates the price regions indicated by the black arrows in which enterprises
are all non-integrated (N), all integrated (I), and the middle range in which only the more
productive ones integrate (Mix). When p < 1/R, the industry is entirely non-integrated, but
supply increases with price, since non-integration expected output increases. As price rises
above 1/R, the most productive enterprises integrate, producing more than they would under
non-integration; those that remain non-integrated also produce more, so that industry output
9

Figure 1: The OAS and market equilibrium
R / 1
R / 1
q n
p
) ( p S
) ( p D N
Mix
I
p ˆ
rises further. Once p reaches 1/R, all firms are integrated and industry supply is fixed at n (the
mean R being 1) for prices higher than that threshold. In the absence of trade, the equilibrium
price p equates domestic supply and demand.
Observe that, for a given market price p, more productive enterprises (those with higher
R) are more likely to be vertically integrated. The degree of integration of the industry (i.e.,
the fraction 1 − G(1/p) of firms that integrate) is therefore a nondecreasing function of the
equilibrium price, strictly increasing on [R,R].
Trade policy and firms’ organization
The key prediction of this theoretical framework is that higher prices on final goods should lead
firms to be more vertically integrated. As discussed in the introduction, testing this prediction
requires an exogenous source of price variation. Trade policy provides an ideal proving ground:
the degree of trade protection obviously affects product prices, but is unlikely to be affected by
firms’ boundary choices.
Suppose now that the industry is import competing: at the world price P for the good,
D(P ) > S(P ), so that some of domestic demand must be satisfied by imports. Suppose further
that the country in which our industry resides is “small”: the world price P is unaffected by its
trade policy.
10

Consider the introduction of an ad valorem tariff t, which drives a wedge between the world
price and the domestic price, p = P (1 + t). By increasing the domestic price, the tariff increases
managers’ incentives to vertically integrate, since the organizational goal becomes relatively more
important than their private goals.
Trade policies affect ownership structures through their impact on product prices. In partic-
ular, an increase in t leads to an increase in the domestic price of the good; an enterprise with
productivity R will choose integration if the new price exceeds 1/R. Figure 2 depicts the OAS
curve of the industry. In this example, absent any tariff, the domestic price would be equal to
the world price P , and all firms in the domestic industry would be non-integrated. Now consider
a tariff t that raises the domestic price to p′ = P (1 + t), which lies between 1/R and 1/R. At
this price, more productive enterprises (with R > 1/p′) will integrate and less productive ones
will remain non-integrated. Clearly, a lower tariff would lead to fewer integrated firms, a higher
one to more. Integration therefore increases with the tariff level.
Figure 2: Firm organization in the presence of a tariff
R / 1
R / 1
P
) 1 ( t P +
q n
p
) ( p S
) ( p D N
Mix
I
The impact of the import tariff on integration decisions should be stronger for domestic
firms that only serve the domestic market, for which the organization’s objective depends only
on domestic prices; the effect should be weaker for exporting firms (and multinationals), since
their profits depend also on product prices in foreign markets.
The impact of trade policy on the degree of vertical integration should also depend on the
11

extent to which import tariffs affect domestic prices. In turn, this should depend on the share of
imports that are subject to the tariff. Thus membership in regional trade agreements (in which
member countries freely trade with each other) and differences across countries and sectors in
the share of imports that are exempt from tariffs provide an additional source of variation to
test our hypothesis.
This theoretical framework can also be used to examine how trade policy affects the degree
of organizational similarity across countries. In effect, the law of one price implies organizational
convergence: countries with low trade barriers ought to have similar prices and therefore similar
organization. For a pair of countries c and c′, the difference in degree of integration within a
sector will depend on the difference in their applied tariffs: the closer are tc and tc′, the smaller
the difference between pc and pc′
and the more similar firms’ ownership structures within the
industry. For countries in the same RTA, all tariffs among them are eliminated. This implies
that prices should tend to converge across member countries. We would also expect customs
unions, in which members adopt common external tariffs, to be characterized by more similar
ownership structures than free trade areas, in which differences in external tariffs, together with
problems in implementing rules of origins, reduce the extent of price convergence.
For the purpose of our empirical analysis, the main predictions of our theoretical framework
can be summarized as follows:
1. Higher import tariffs on final goods should lead domestic firms to be more vertically inte-
grated.
2. The effect of tariffs on integration should be larger for firms selling only in the domestic
market.
3. The effect of tariffs on integration should be larger in sectors in which a smaller fraction
of imports are exempt from the tariff.
4. Country pairs should have more similar ownership structures in sectors where they have
similar levels of protection; RTAs, especially customs unions, should display similar own-
ership structures among members.
3 Dataset and variables
3.1 The WorldBase database
Increasingly, researchers use multi-country firm-level data to study issues of organization eco-
nomics (e.g., Bloom and Van Reenen, 2007; Bloom, Sadun and Van Reenen, 2012). However,
cross-country empirical investigations at the firm level are notoriously challenging due to both
the lack of data and the difficulty of comparing the few high quality time-series datasets that
12

are available (mostly in rich countries). The reason for the data constraint is simple: economic
censuses of firms are infrequently collected due to high costs and institutional restrictions, espe-
cially in poor countries. No institution has the capacity or resources to collect census data for a
wide range of countries and periods. This is why researchers have to use other sources, such as
business “compilations” (registries, tax sources) or surveys.
To measure vertical integration, we use data for 2004 from Dun & Bradstreet’s WorldBase,
a database of public and private plant-level observations in more than 200 countries and ter-
ritories.13 WorldBase contains information on public and private companies in more than 200
countries. The unit of observation in WorldBase is the establishment/plant. With a full sample,
plants belonging to the same firm can be linked via information on domestic and global parents
using the DUNS numbers.14
The WorldBase dataset has been used extensively in the literature. Early uses of D&B
data include Caves’ (1975) analysis of size and diversification patterns between Canadian and
U.S. plants. More recent uses include Harrison, Love, and McMillian (2004), Black and Stra-
han (2002), Alfaro and Charlton (2009), and Acemoglu, Johnson and Mitton (2009). One of
the advantages of WorldBase compared to other international datasets is that it is compiled
from a large number of sources (e.g., partner firms, telephone directory records, websites, self-
registration). Admittedly, sample coverage may vary across countries, but this problem can be
mitigated by focusing on manufacturing firms above a size threshold of twenty employees (see
discussion below).15
3.2 The sample
We use data from the 2004 WorldBase file, excluding records that lack primary industry and year
started, for a total of more than 24 million observations. The unit of observation in WorldBase
is the establishment (a single physical location at which business is conducted or services or
13WorldBase is the core database with which D&B populates its commercial data products, includ-ing Who Owns WhomTM, Risk Management SolutionsTM, Sales & Marketing SolutionsTM, and SupplyManagement SolutionsTM. These products provide information about the “activities, decision makers, fi-nances, operations and markets” of the clients’ potential customers, competitors and suppliers.The datasetis not publicly available but was released to us by Dun and Bradstreet. For more information see:http://www.dnb.com/us/about/db database/dnbinfoquality.html.
14D&B uses the United States Government Department of Commerce, Office of Management and Budget,Standard Industrial Classification Manual 1987 edition to classify business establishments. The Data UniversalNumbering System — The D&B DUNS Number — introduced in 1963 to identify businesses numerically for data-processing purposes, supports the linking of plants and firms across countries and tracking of plants’ historiesincluding name changes.
15Other datasets use different methodologies in different countries. For example, the Amadeus dataset, providedlike Orbis by Bureau Van Dijk, uses data from national public body in charge of collecting the annual accountsin some countries (e.g., the UK) and collects it direct from firms in other countries (most of Eastern Europe).Because of different disclosure requirements, the amount and type of information also varies among countries.See Alfaro and Charlton (2009) for a more detailed discussion of the WorldBase data and comparisons with otherdata sources.
13

industrial operations are performed) rather than the firm (one or more domestic establishments
under common ownership or control). Establishments, which we also refer to as plants, have
their own addresses, business names, and managers, but might be partly or wholly owned by
other firms. As mentioned above, plants can be linked via information on domestic and global
parents using DUNS numbers.
We use different categories of data recorded by WorldBase records for each establishment:
Industry information: the 4-digit SIC code of the primary industry in which each estab-
lishment operates, and for most countries, the SIC codes of as many as five secondary
industries, listed in descending order of importance.
Ownership information: information about the firms’ family members (number of family
members, its domestic parent and its global parent).16
Location information: country, state, city, and street address of each family member (used
to link establishments within a family to the relevant tariff data).
Basic operational information: sales and employment.
Information on the firm’s trade status (exporting/non-exporting).
We exclude countries and territories with fewer than 80 observations and those for which
the World Bank provides no data. We further restricted the sample to Word Trade Organiza-
tion (WTO) members for which we have data on tariffs/regional trading arrangements (see the
discussion below).
We focus on manufacturing firms (i.e., firms with a primary SIC code between 2000 and
3999), which best fit our theory of vertical integration and for which data on MFN tariffs are
widely available. We exclude government/public sector firms, firms in the service sector (for
which we have no tariff data) or agriculture (due to the existence of many non-tariff barriers),
and firms producing primary commodities (i.e., mining and oil and gas extraction).
We exclude firms with fewer than 20 employees, as our theory does not apply to self-
employment or small firms with little prospect of vertical integration (see also Acemoglu, Aghion,
Griffith and Zilibotti, 2010). Restricting the analysis to firms with more than 20 employees also
enables us to correct for possible differences in the the collection of small firms data across
countries (see Klapper, Laeven, and Rajan, 2006).
We focus on firms that are located in only one country, since this provides a cleaner analysis
of the effects of tariffs and RTAs on firms’ ownership structure. This is because the degree of
vertical integration of these firms should depend only on the price at which they sell their product
in their home country. In the case of multinational corporations (MNCs), on the other hand, it
16D&B also provides information about the firm’s status (joint-venture, corporation, partnership) and itsposition in the hierarchy (branch, division, headquarters).
14

is harder to identify the relevant prices and tariffs. Moreover, focusing on national firms avoids
issues having to do with the strategic behavior of multinationals across markets (e.g., transfer
pricing, tariff jumping).17 Multinationals are included in the robustness analysis. There, we split
MNCs into separate entities — one for each country — in order to link organizational structure
to domestic tariffs.
Table A-1 in the Appendix lists the countries included in our main sample.18 In robustness
checks, we restrict our analysis to two alternative subsamples: countries for which we have fewer
than 1,000 plants that are part of firms with at least 20 employees (see Table A-2); and OECD
countries, for which governments have little or no room to adjust MFN tariffs,19 and there are
smaller cross-country differences in technology.
We next describe the construction of firm-level vertical integration indices, and all other
variables used in our empirical analysis. Appendix Table A-3 presents summary statistics for all
variables.
3.3 Vertical integration indices
Constructing measures of vertical integration is highly demanding in terms of data, requiring
firm-level information on sales and purchases of inputs by various subsidiaries of a firm. Such
data are generally not directly available and, to the best of our knowledge, there is no source for
such data for a wide sample of developed and developing countries.
To measure the extent of vertical integration for a given firm, we build on the methodology
developed by Fan and Lang (2000) and Acemoglu, Johnson and Mitton (2009). We combine
WorldBase information on plant activities and ownership structure with input-output data to
determine related industries and construct the vertical integration coefficients V f,k,cj in activity
j, where k is the primary sector in which firm f in country c is active.20
Given the difficulty of finding input-output matrices for all the countries in our dataset, we
follow Acemoglu, Johnson and Mitton (2009) in using the U.S. input-output tables to provide
a standardized measure of input requirements for each sector. As the authors note, the U.S.
17We describe an establishment as foreign-owned if it satisfies two criteria: (1) it reports to a global parentfirm, and (2) the parent firm is located in a different country. Parents are defined in the data as entities thathave legal and financial responsibility for another firm. For purposes of matching the tariff data, we use the SICcode of the domestic ultimate for multinationals.
18Further restrictions were imposed by data availability constraints related to the control variables, as explainedin the next subsections.
19The “binding overhang”, i.e., the difference between the applied MFN tariff and the bound rate agreed inmultilateral negotiations, is known to be very small across developed countries, particularly for non-agriculturalproducts (e.g., Bchir et al, 2006).
20In Acemoglu, Johnson and Mitton (2009), the sample is restricted to a maximum of the 30,000 largest recordsper country in the 2002 WorldBase file (a limit imposed by cost constraints). For countries with more than 30,000observations, they select the 30,000 largest, ranked by annual sales. Having information on the full sample ofestablishments in WorldBase, we are able to link establishments to firms (see discussion below).
15

input-output tables should be informative about input flows across industries to the extent that
these are determined by technology.21
The input-output data are from the Bureau of Economic Analysis (BEA), Benchmark IO
Tables, which include the make table, use table, and direct and total requirements coefficients
tables. We use the Use of Commodities by Industries after Redefinitions 1992 (Producers’ Prices)
tables. While the BEA employs six-digit input-output industry codes, WorldBase uses the SIC
industry classification. The BEA website provides a concordance guide, but it is not a one-to-
one key.22 For codes for which the match was not one-to-one, we randomized between possible
matches in order not to overstate vertical linkages. The multiple matching problem, however, is
not particularly relevant when looking at plants operating only in the manufacturing sector (for
which the key is almost one-to-one).
For every pair of industries, i, j, the input-output accounts support calculation of the dollar
value of i required to produce a dollar’s worth of j. We construct the input-output coefficients
for each firm f , IOfij by combining the SIC information for each plant in each firm, the matching
codes, and the U.S. input-output information. Here, IOfij ≡ IOij ∗ Ifij, where IOij is the input-
output coefficient for the sector pair ij, stating the cents of output of sector i required to produce
a dollar of j, and Ifij ∈ {0, 1} is an indicator variable that equals one if and only if firm f owns
plants in both sectors i and j. A firm that produces i as well as j will be assumed to supply itself
with all the i it needs to produce j; thus, the higher IOij for an i-producing plant owned by the
firm, the more integrated in the production of j the firm will be measured to be. Adding up the
input-output coefficients IOfij for all inputs i, gives the firm’s degree of vertical integration in j.
To illustrate the procedure, consider the following example from Acemoglu, Johnson and
Mitton (2009) of a Japanese establishment with, according to WorldBase, one primary activ-
ity, automobiles (59.0301), and two secondary activities, automotive stampings (41.0201) and
miscellaneous plastic products (32.0400). The IOij coefficients for this plant are:
Output (j)
Input (i)
Autos Stampings Plastics
Autos 0.0043 0.0000 0.0000
Stampings 0.0780 0.0017 0.0000
Plastics 0.0405 0.0024 0.0560
SUM 0.1228 0.0041 0.0560
The table is a restriction of the economy-wide IO table to the set of industries in which
21Note that the assumption that the U.S. IO structure carries over to other countries can potentially bias ourempirical analysis against finding a significant relationship between vertical integration and prices by introducingmeasurement error in the dependent variable of our regressions. In addition, using the US input-output tablesto construct vertical integration indices for other countries mitigates the possibility that the IO structure andcontrol variables are endogenous.
22This concordance is available upon request. The BEA matches its six-digit industry codes to 1987 U.S. SICcodes http://www.bea.gov/industry/exe/ndn0017.exe.
16

this establishment is active (i.e., it contains all of the positive IOfij values). For example, the
IOij coefficient for stampings to autos is 0.078, indicating that 7.8 cents worth of automotive
stampings are required to produce a dollar’s worth of autos. Because this plant has the internal
capability to produce stampings, we assume it produces itself all the stampings it needs.23 The
bottom row shows the sum of the IOfij for each industry. For example, given that 12.3 cents
worth of the inputs required to make autos can be produced within this plant, we would say
that the degree of vertical integration for this plant is 0.123.
For firm f in primary sector k located in country c, we define the integration index in activity
j as
V jf,k,c =
∑i
IOf,kij , (2)
the sum of the IO coefficients for each industry in which the firm is active. Our measure of
vertical integration is based on the firm’s primary activity:
Vf,k,c = V jf,k,c, j = k. (3)
In the case of multi-plant firms, we link the activities of all plants that report to the same
headquarters and consider the main activity of the headquarters as the primary sector.24
The approach we follow to identify vertical integration infers a firm’s level of vertical in-
tegration from information about the goods it produces in each of its establishments and the
aggregate input-output relationship among those goods. The advantage of this method is that
one need not worry about the value of intra-firm activities being affected by transfer pricing.
Another advantage is that using I-O tables avoids the arbitrariness of classification schemes that
divide goods into “intermediate” and other categories (Hummels, Ishii, and Yi, 2001).
Summary statistics for firm-level vertical integration are presented in Appendix Table A-3,
while Table A-4 reports average vertical integration indices by sector (at the 2-digit SIC level).25
Table A-5 compares the firm-level vertical integration index across the different samples. Our
23Many industries have positive IOij coefficients with themselves; for example, miscellaneous plastic productsare required to produce miscellaneous plastic products. Any firm that produces such a product will therefore bemeasured as at least somewhat vertically integrated.
24One might be concerned about measuring vertical integration at the firm level, in light of the results byHortacsu and Syverson (2009), who find little evidence of commodity shipments across commonly-owned plantsin US non-multinational firms. However, unless one feels comfortable extrapolating these results from betweento within plants (let alone extrapolating from the US to the rest of the world), this concern does not apply toour analysis. This is because 96% of the firms in our sample are actually single plant and 87% of plants arenot connected (see Table A-5). The qualitative results of our analysis are thus unaffected if we measure verticalintegration at the plant-level or restrict the analysis to single-plant firms.
25The descriptive statics for our vertical integration measure are similar to Acemoglu, Johnson and Mitton(2009). They report a mean of 0.0487 and median of 0.0334 for their vertical integration index. For our mainsample, the primary sector vertical integration index has a mean of 0.0627 and a median of 0.0437 (see TableA-3). The ordering of industries by degree of vertical integration in Table A-4 is also similar to that reported byAcemoglu, Johnson and Mitton (2009).
17

main sample consists of 196,586 domestic manufacturing firms with at least 20 employees located
in 80 countries. The histogram in Figure 3 reports the distribution of vertical integration indices
for all firms in our main sample. According to our measure, most firms produce relatively few
inputs in house: the median vertical integration index is around 0.044 and the mean is 0.063.26
Figure 3: Firm-level vertical integration index
05
1015
20D
ensi
ty
.1med. .2 .3 .4 .5Firm−level vertical integration index
3.4 Tariffs and other trade variables
Our main strategy to empirically assess the impact of market prices on ownership structure is to
use data on applied most-favored-nation (MFN) tariffs, which offer a plausibly exogenous source
of price variation to the boundaries of the firm. As argued in the introduction, the degree of
vertical integration of a firm is unlikely to have a systematic impact on the determination of
trade policies in general, and MFN tariffs in particular. These are negotiated at the multilateral
level over long periods of time and are less “political” than unilateral forms of protection such
as anti-dumping duties.
We collect applied MFN tariffs at the 4-digit SIC level for all WTO members for which this
information is available. We restrict the set of countries to WTO members, which are constrained
under Article I of the GATT by the MFN principle of non-discrimination: each country c
applies the tariff Tariffk,c to all imports of final good k that originate in other WTO member
countries; preferential treatment is allowed only for imports originating from RTA members
or from developing countries (see discussion below). The source for MFN tariffs is the World
Integrated Trade Solution (WITS) database, which combines information from the UNCTAD
TRAINS database (default data source) with the WTO integrated database (alternative data
26It should be noted that this measure does not consider payments to capital and labor services and is thusalways less than unity. Indeed, in the U.S. an industry pays on average around 56% of gross output to interme-diates, the rest being value added. Thus, even a fully vertically integrated firm in a typical sector would have anindex of only 0.56.
18

source). Tariffs are for 2004 unless unavailable for that year in which case the closest available
data point in a five year window around 2004 (2002-2006) is chosen with priority given to
earlier years.27 The original classification for tariff data is the harmonized system (HS) 6-
digit classification. Tariffs are converted to the more aggregate SIC 4-digit level using internal
conversion tables of WITS. Here, SIC 4-digit level MFN tariffs are computed as simple averages
over the HS 6 digit tariffs.
Our analysis focuses on tariffs on final goods in the domestic market. In some regressions,
we also control for the tariffs applied to imported inputs, using the variable Input Tariffk,c. This
is a weighted average of 4-digit SIC applied MFN tariffs, using normalized IO-coefficients from
the US input-output table as weights. To proxy for the level of protection faced by exporters in
foreign markets, we use the variable Export Tariffk,c. We construct this variable by weighting
tariffs in destination markets with bilateral export shares using information from COMTRADE.
The variable MFN sharek,c measures the fraction of imports to which MFN tariffs apply, for
each country and sector. This excludes imports from countries with which the importer has a
preferential trade agreement, which do not face tariff restrictions. The higher is this share, the
more sensitive domestic prices should be to MFN tariffs. For example, the U.S. will have low
MFN shares in sectors in which it imports a lot from its NAFTA trading partners (Canada and
Mexico). In these sectors, the MFN tariff that the U.S. imposes on other WTO members will
have little impact on domestic prices. In contrast, the effect may be substantial in sectors where
most imports originate in countries with which the U.S. has no preferential trade agreement.
To distinguish between firms selling only in the domestic market and exporting firms, we con-
struct two measures. The dummy variable Domesticf is constructed from from WorldBase and
takes the value of 1 if firm f does not report to be an exporter. The variable Import-competingk,c
is a country-sector specific measure of import-competition constructed using information from
COMTRADE. This is a dummy indicating whether a firm operates in one of the 25 percent most
import-competing sectors, based on the ratio of a country’s total imports/exports by sector.
We also collect information on all regional trade agreements in force in 2004 from the WTO
Regional Trade Agreements Information System (RTA-IS).28 The legal basis for the creation of
RTAs can be found in GATT/WTO Article XXIV (for agreements involving developed member
countries) and the Enabling Clause (for agreements among only developing countries). Under
Article XXIV, member countries can form free trade areas (FTAs) or customs unions (CUs)
covering “substantially all trade”, that require complete duty elimination and fixed timetables
for implementation. The conditions contained in the Enabling Clause being much less stringent,
RTAs between developing member countries may effectively involve less trade liberalization.
Thus we construct the dummy RTAc,c′ that equals one when countries c and c′ belong to a
27For example, if data are available for 2003 and 2005, but not 2004, the 2003 data are chosen.28Available online (http://rtais.wto.org/UI/PublicMaintainRTAHome.aspx).
19

common trade agreement formed under Article XXIV.29 To distinguish between different types
of RTAs, we construct the dummy variables Customs Unionc,c′ and Free Trade Areac,c′ . We
expect the former, which imply a common external tariff and no internal trade barriers, to have
a stronger effect on organizational convergence than the latter, which permit member countries
to maintain different external tariffs.
3.5 Other controls
We collect a number of country- and sector-specific variables to control for alternative factors
emphasized in the literature on vertical integration.
In terms of country-specific variables, the empirical and theoretical literatures have studied
the role of institutional characteristics and financial development.30 We use the variable Legal
Qualityc to proxy for the quality of a country’s institutions. This is the variable “rule of law”
from Kaufmann, Kraay, and Mastruzzi (2003), which is a weighted average of a number of
variables (perception of incidences of crime, effectiveness and predictability of the judiciary, and
enforceability of contracts) between 1997 and 1998. The variable ranges from 0 to 1 and is
increasing in the quality of institutions. The variable Financial Development c measures private
credit by deposit money banks and other financial institutions as a fraction of GDP for 2004
and is taken from Beck, Demigurc-Kunt, and Levine (2006).
We also construct the variable Capital Intensityk, using data from the NBER-CES manu-
facturing industry database (Bartelsmann and Gray, 2000) at the 4-digit-SIC level. In line with
the literature, capital intensity is defined as the log of total capital expenditure relative to value
added averaged over the period 1993-1997.
To control for domestic industry concentration, we construct Herfindahlk,c indices using in-
formation on sales of all plants in a given country and sector.31
To proxy for the degree of product differentiation, we use two dummy variables. The vari-
able Homogeneous1 k is equal to 1 when a sector is homogeneous according to the well-known
classification by Rauch (1999).32The dummy variable Homogeneous2 k,c is constructed using in-
formation on sector-country-specific import demand elasticities estimated by Broda, Greenfield
and Weinstein (2006).33 It takes value 1 whenever the elasticity is above the median for the
29This variable does not include a number of preferential trade agreements under the Enabling Clause that donot imply the full elimination of trade barriers.
30Poor legal institutions may affect vertical integration decisions through their impact on the severity of hold-up problems. A sufficient level of financial development may be necessary for upstream and downstream firms tobe able to integrate. As Acemoglu, Johnson and Mitton (2009) note, the effect of each of these variables may beambiguous when considered separately and there are more robust predictions of their combined effect.
31These include sales by foreign-owned plants that operate in the given country-sector.32Rauch (1999) classifies products according to three different types: homogeneous goods, which are traded in
organized exchanges; goods that are are not traded in organized exchanges, but for which a published referenceprice can be found; and differentiated goods, which fall under neither of the two previous categories.
33We thank David Weinstein for making these data available to us.
20

country. Broda, Greenfield and Weinstein (2006) show that sectors with more homogeneous
products are characterized by higher import demand elasticities.
In some specifications, we include the variable Sizef , using information on firm-level employ-
ment from WorldBase. Since firm size is clearly endogenous to vertical integration, we always use
predicted size as an instrument, constructed by regressing firm size on sector-country dummies.
Similarly, we construct labor productivity measured as firm sales divided by employment. Again,
we instrument this variable using predicted (with sector-country dummies) labor productivity.
In the regressions on organizational convergence, we also use a number of bilateral variables
from CEPII: bilateral Distance measured as the simple distance between the most populated
cities (in km), dummies for Contiguityc,c′ , for Common Languagec,c′ (official or primary), and
Colonial Relationshipc,c′ (current or past). In some specifications, we also include the variable
Difference GDPc,c′ for the year 2004 constructed from the World Development indicators.
4 Tariffs and vertical integration
In this section, we assess the empirical validity of the main prediction of our theoretical model
that higher prices for the final good lead to more vertical integration at the firm level. The
section is divided in two parts. First, we exploit cross-sectional variation in applied MFN tariffs
to verify whether trade policy affects firms’ ownership structures in the way predicted by our
model. Second, we exploit time-series variation in the degree of protection faced by firms,
examining the organizational effects of China’s accession to the WTO.
4.1 Cross-sectional evidence
To examine the organizational effects of trade policy, we first exploit variation in applied MFN
output tariffs across countries and sectors. We estimate the following reduced form regression
model:
Vf,k,c = α + β1 Tariffk,c + β2Xf,k,c + δk + δc + εf,k,c, (4)
where Xf,k,c is the vector of explanatory variables, δk and δc are sector and country dummies
and εf,k,c is an error term with E(εf,k,c|Xk,c, δk, δc) = 0. Thus, the effect of Tariffk,c on Vf,k,c is
causal conditional on covariates.
The dependent variable is the log of one plus Vf,k,c, the vertical integration index of firm f ,
with primary sector k, located in country c, as defined in (3). We take logs of (one plus) the
vertical integration index to mitigate problems with outliers.34
34We also used the log of the vertical integration index (removing zero observations) obtaining similar results.There are very few zeros in the dependent variable, so there is no need to perform a Tobit analysis. All resultsnot shown due to space considerations are available upon request.
21

Our main regressor of interest is the variable Tariffk,c, which is the log of (one plus) the MFN
tariff applied to output in sector k by country c.35 Our model predicts that higher final good
tariffs within an industry should lead firms in that industry to be more vertically integrated. We
thus expect the coefficient β1 to be positive.36
The vector Xf,k,c includes a series of firm- and sector-country-specific controls, that we will
discuss below. We also include sector fixed effects at the 4-digit SIC level (δk), which allows us to
capture cross-industry differences in technological or other determinants of vertical integration
(e.g., a sector’s capital intensity). Finally, we add country fixed effects (δc), which capture
cross-country differences in institutional determinants of vertical integration (e.g., a country’s
level of financial development and the quality of its contracting institutions) and also control for
country-specific differences in the way firms are sampled.37 Given that tariffs vary only at the
sector-country level, while the dependent variable varies at the firm level, we cluster standard
errors at the sector-country level.
4.1.1 Main results
Table 1 reports the results of estimations in which we test the main predictions of our theoretical
framework.
Column (1) presents the results of the basic specification, which includes only the variable
Tariff and country and sector fixed effects. The estimated coefficient for the tariff is positive
and strongly significant. Thus, consistently with the first prediction of our theoretical model,
higher tariffs lead firms to be more vertically integrated. The point estimate for β1 implies that
a 100 percent tariff increase leads to a 2.03 percent increase in the vertical integration index.
In terms of economic magnitudes, this implies that an increase in manufacturing tariffs from 1
percent to their mean level of 4.85 percent (a 385 percent increase) increases vertical integration
by 0.0203*385 = 7.82 percent.38
The estimate for β1 can be interpreted as the impact of prices on vertical integration if and
only if prices and tariffs vary one to one. This would be true for a specific (per-unit) tariff
imposed by a small country in a competitive environment. In the case of ad-valorem tariffs,
35Tariffs are expressed in ad-valorem terms. In the main specifications, we use log of (one plus MFN tariff)in order to be able to include zero tariffs. Although the distribution of tariffs is extremely skewed, log tariffsare approximately normally distributed. Using, in alternative specifications, the log of the tariff variable yieldssimilar results.
36We have also performed a series of estimations including a quadratic term for Tariffk,c, finding no evidenceof a non-monotonic relationship between tariffs and vertical integration.
37D&B samples establishments in the formal sector (and there are, of course, differences in the size of theformal sector across rich and poor countries). As a robustness check, we also tried restricting the sample tocountries for which we have at least 1,000 plants that are part of firms with at least 20 employees (see section4.1.4).
38The coefficient for Tariff in the log-log specification, where we have only 149,574 observations since we loseobservations with zero tariffs, is 0.03 and significant at the one-percent level. This implies that an increase inmanufacturing tariffs by 385 percent increases vertical integration by 0.03*385=11.55 percent.
22

the relation would be weaker. This would also be true if the country is large, i.e., can affect
world prices. In this case, imposing a tariff will have an impact on the world price and the
elasticity of domestic prices with respect to tariffs will be less than one.39 Ideally, one would
use industry-level price indices and instrument them with tariffs. Unfortunately, reliable price
data is unavailable.40 These arguments imply that the estimate for β1 should be interpreted as
a lower bound on the impact of prices on vertical integration.
In columns (2) and (3) we verify whether the effect of domestic tariffs on organization is
larger for firms that operate only in the domestic market (for which only this price should
affect the degree of vertical integration). To do so, we interact the variable Tariffk,c with two
dummy variables: Domesticf , which is constructed using information on from WorldBase and
takes the value of 1 if firm f does not report to be an exporter; and Import-competingk,c, which
is constructed using information from COMTRADE and indicates whether a firm operates in
one of the 25 percent most import-competing sectors, based on the ratio of a country’s total
imports/exports by sector. We expect the coefficients on the interaction terms to be positive.
In column (2), the coefficient for tariffs (which measures the impact of tariffs on vertical
integration for exporters) is positive but insignificantly different from zero. On the other hand,
the coefficient on the interaction term is positive, strongly significant and similar in magnitude
to the baseline specification. Thus, import tariffs have a significant affect on vertical integration
only for firms that sell only in the domestic market. In column (3), we use the alternative
measure to identify firms that do not export to foreign markets. Again, the coefficient on the
interaction term is positive and significant at the five-percent level, indicating that import tariffs
have a bigger impact on vertical integration decisions for firms that operate in import-competing
sectors.41
In column (4) we test if tariffs have a larger impact on vertical integration when the share
of imports to which they apply is larger (and thus domestic prices should be more affected).
To do this, we include the variable MFN sharek,c, capturing the fraction of imports to which
MFN tariffs apply in a given country and sector, as well as the interaction between this variable
and the tariff. The coefficient in the first row now measures the impact of MFN tariffs when
no imports are subject to them (i.e., in a sector in which a country imports only from regional
trading partners). Not surprisingly, this coefficient is not significant, since in this case MFN
39Denote the domestic price of good k in country c as pk,c = (1 + tk,c)Pk, where Pk is the world price of good
k. Then∂pk,c
∂tk,c
tk,c
pk,c=
tk,c
1+tk,c+ ∂Pk
∂tk,c
tk,c
Pk, where the first part on the right is the direct impact of an ad-valorem tariff
on domestic prices (< 1) and the second term is the terms of trade effect (< 0). Notice also that, to the extentthat countries are able to manipulate tariffs to improve their terms of trade, high tariffs are likely to be observedprecisely in sectors in which they increase domestic prices only by a small amount. Broda, Limao and Weinstein(2008) provide evidence that non-WTO countries exploit their market power in trade by setting higher tariffs ongoods that are supplied inelastically.
40Unit values, which are widely available, cannot be used for our purposes: we require data on domestic prices,while unit values (CIF or FOB) are measures of import prices at the border, before tariffs are applied.
41As discussed in section 4.1.3, our results are robust to including additional controls for firms (e.g., instru-mented size and ratio of sales to employment) and sectors (e.g., industry concentration).
23

tariffs should have no impact on the price faced by domestic firms. The interaction term is
instead positive and significant at the one-percent level, indicating that the effect of MFN tariffs
on vertical integration is positive and increasing in their importance for import volumes.
In columns (5)-(8) we repeat the same specifications, adding institutional interaction terms
that have been emphasized in previous studies on vertical integration. In particular, Acemoglu,
Johnson and Mitton (2009) find evidence that contracting costs and financial development have a
stronger impact on vertical integration in more capital-intensive sectors. We thus introduce two
interaction terms: one between Capital Intensityk and Financial Development c and the other
one between Capital Intensityk and Legal Qualityc. The coefficient on the first interaction term
is positive and significant, indicating that more capital intensive sectors are more integrated in
countries with more developed financial markets. The second interaction term has the expected
negative sign but it is not significant. In all specifications, our results on the effect of tariffs on
vertical integration are unaffected.
4.1.2 Prices versus competition
According to our theoretical model, tariff reductions should decrease vertical integration for do-
mestic import-competing firms, by reducing the price at which they can sell their final goods.
Our model focuses on a perfectly competitive setting, in which firms are price takers. In re-
ality, trade liberalization might also affect organizational choices by increasing the degree of
competition faced by domestic firms. In particular, Aghion, Griffith and Howitt (2006) sug-
gest a U-shaped relationship between competition and vertical integration: a small increase in
competition reduces a producer’s incentive to integrate by improving the outside options of non-
integrated suppliers and hence raising their incentive to make relationship-specific investments;
too much competition raises the producer’s incentive to integrate, by allowing non-integrated
suppliers to capture most of the surplus.
In Tables 2 and 3, we attempt to isolate the organizational effects of product prices by
restricting our analysis to highly competitive sectors, in which tariffs changes should have little
or no effect on the degree of competition. By focusing on sectors in which domestic firms should
have little or no market power, we expect tariff-pass through, and hence the effect of tariffs on
vertical integration, to be larger.
In Table 2, we only include sectors in which at least 20 domestic firms operate in a given
country and for which the dummy variable Homogeneous1k is equal to 1. This identifies industries
in which goods are traded in organized exchanges, classified as homogeneous according to Rauch
(1999). Thus, these are sectors for which a market price exists and where many firms operate,
implying a high level of competition. In columns (1)-(2), these are the only restrictions that
we impose on the sample. In the rest of the table, we introduce additional restrictions to
define competitive sectors. Columns (3)-(4) include only sectors with low levels of protection
24

(Tariffk,c < 10%), in which domestic firms face also a high level of foreign competition. In
columns (5)-(6) the sample is restricted to sectors in which some foreign owned firms operate in
the domestic market. Since firms that foreign firms investing in FDI are typically more productive
than foreign exporting firms, this should imply a high competitive pressure on domestic firms.
In columns (7)-(8), we exclude from our analysis concentrated sectors, i.e., industries for which
the Herfindahlk,c index above 0.1. In all specifications, the coefficient on the tariff is positive
and significant at least at the five-percent level. Notice that when we use a stricter definition of
competitive sectors we obtain estimates that are up to three times larger in magnitude and more
significant. We can thus conclude that import tariffs, by raising product prices, lead domestic
firms to be more vertically integrated.
In Table 3, we repeat the analysis using the dummy Homogeneous2k,c to define homoge-
neous sectors. This identifies sectors with high import demand elasticities according to Broda,
Greenfield and Weinstein (2006), which, as explained above, should also be more competitive.
Notice that the sample is much larger than in Table 2, since the variable Homogeneous2k,c varies
at the country-sector level. The estimates for Tariffk,c are always positive, larger than for the
full sample, and significant at the one-percent level, confirming that higher prices lead to more
vertical integration.
4.1.3 Omitted variables
Our analysis shows that firms are more vertically integrated when import tariffs on their final
product are higher. In this section, we show that this result is robust to controlling for other
channels through which import tariffs can affect firm organization decisions.
As argued above, reverse causality is unlikely to be a concern, since there is no reason to
believe that vertically integrated firms should be particularly interested or able to obtain high
levels of protection. However, MFN tariffs on final products could be correlated with omitted
variables that also affect firms’ ownership structures.
In what follows, we show that our results are robust to controlling for two sets of potential
omitted variables. First, we include measures of input tariffs and export tariffs, which are
correlated with output tariffs42 and may also affect vertical integration decisions. Second, we
control for firm size, labor productivity and industry concentration, which can affect the degree
of protection through their impact on lobbying pressure (e.g., Mitra, 1999; Bombardini, 2008)
and may also be correlated with firms’ ownership structures.
The results of these regressions are presented in Table 4. For comparison, in the first two
columns, we report the results of the baseline specifications. In column (3)-(8), we add additional
controls, first one by one and then simultaneously: Input Tariffk,c, Export Tariffk,c, Herfindahlk,c,
Sizef (instrumented with predicted size) and Labor Productivityf (instrumented with predicted
42The simple correlation of output tariffs with input tariffs is 0.78 and the one with export tariffs is 0.31.
25

labor productivity). Notice that, in all specifications, the coefficient on Tariff is positive, highly
significant, and very stable. These results confirm that omitted variables are not a concern and
that higher output tariffs lead to more vertical integration. Of the additional controls, input
tariffs, firm size, and labor productivity have a (positive) significant effect on organization.43
4.1.4 Additional robustness checks
Here, we perform a number of additional robustness checks. We show that our results on MFN
tariffs and firms’ vertical integration are robust to employing different samples; to using different
econometric methodologies; and to measuring vertical integration in a different way. The tables
reporting these results are in the Appendix.
In a first set of regressions, we add multinational firms to the main sample. As noted
above, since multinational firms have plants in different countries, it is harder to identify with
precision the tariffs that affect their organization decisions. We thus split multinationals into
separate firms by country and use the primary activity of the respective domestic ultimate to
identify the relevant tariff. In Table A-6 we reproduce all the specifications of Table 4, including
multinationals firms in the sample and adding a dummy variable for multinational status. As
expected, the coefficient for Tariffk,c is slightly reduced in magnitude, but remains positive and
strongly significant in all specifications.
In Table A-7 we repeat the analysis for the sample of countries for which we observe at least
1,000 plants that are part of firms with at least 20 employees. The point estimates for the tariff
coefficient remain similar in magnitude, and the significance of the estimates is not affected by
restricting the sample of countries.
In Table A-8 we use a different econometric methodology and employ a Poisson quasi-
maximum likelihood (PQML) estimator to assess the effect of tariffs on vertical integration. The
rationale for this exercise is that Santos Silva and Tenreyro (2006) have shown that for log-linear
models the OLS estimator gives inconsistent estimates in the presence of heteroscedasticity and
have suggested the PQML estimator as an alternative with good statistical properties. Vertical
integration is now estimated in levels, which allows to includes observations for which the depen-
dent variable is zero, while the explanatory variables are in logs and can thus be interpreted as
elasticities. Standard errors are again clustered at the sector-country level. The results remain
consistent: depending on the specification, the coefficient for Tariffk,c is always between 0.011
and 0.028 and significant at least at the ten-percent level.
In our analysis, we cluster standard errors at the sector-country level. In unreported regres-
43The results on labor productivity are in line with our theoretical model, in which the price at which anenterprise integrates is lower when its productivity is higher. The results on input tariffs can also be rationalizedusing a simple extension of our framework, in which the different units of the enterprise each produce a goodthat may be sold to the outside market and the total enterprise revenues are shared among the members. In thissetting, increasing an “input” price has the same effect as increasing the final good price, namely to increase themarginal value of integration.
26

sions, we have alternatively clustered standard errors at the sector and at the country level. In
both cases, the coefficient for Tariffk,c remained strongly statistically significant.
Finally, in a series of additional regressions we used an alternative measure of vertical
integration, constructed based on all the firm’s activities rather than its primary activity:
V f,k,c = 1Nf
∑j V jf,k,c, where Nf is the number of industries in which firm f is active. The
coefficients for MFN tariffs remained strongly significant but, not surprisingly, they dropped
slightly in magnitude. The results of these regressions are available upon request.
4.2 Time-series evidence: China’s accession to the WTO
As noted in the introduction, China’s accession to the WTO in 2001 is arguably the only major
trade liberalization episode that has occurred in the last decade, for which we can use D&B data
to construct vertical integration measures. To be accepted as a member of the WTO, China
agreed to undertake a series of important commitments to better integrate in the world economy
and offer a more predictable environment for trade and foreign investment in accordance with
WTO rules.44 In particular, China had to substantially expand market access to goods from
foreign countries, reducing its import tariffs from an average of 13.3 percent in 2001 to 6.8
percent by the end of the implementation period.45
Our identification strategy is based on the comparison of two periods, a pre-accession one
and a post-accession one, to verify whether firm-level vertical integration was reduced by more in
those sectors that experienced larger tariff cuts. We thus construct vertical integration measures
for all Chinese manufacturing firms that are in the WorldBase dataset for the years 1999 (pre
accession) and 2007 (post accession), following the same procedure described in Section 3.3.
We use 2007 instead of 2004 as the post-accession period because we expect firms’ ownership
structure to react slowly to price changes induced by tariff reductions.
Figure 4 provides the histograms of the MFN tariffs applied by China in 1999 and 2007. This
is based on those manufacturing sectors for which we observe firms (with at least 20 employees,
excluding multinationals) in both years, consisting of almost 29,000 firms that we observe in at
least one year. For the sectors in this sample, applied tariffs fell from an average 20 to an average
of 9.9 percent between 1999 and 2007, with a lot variation across sectors.46 At the same time,
the average level of vertical integration for the sample of firms declined from 0.111 to 0.08447
44A detailed list of China’s commitments can be found in its Protocol of Accession. China’s accession impliedfew trade policy changes for other WTO members, since most of them had already been granting it MFN status.
45The implementation period lasted until 2010, though most tariff reductions had to be completed by 2005.46The maximum reduction in tariffs was 415 percent (SIC 3578, Calculating and Accounting Machines), the
median reduction was 51 percent. Only in a few sectors, tariffs did not change or actually increased (e.g., SIC2084 Wines, Brandy and Brandy Spirits).
47One may be concerned that tariff levels and reductions may be endogenous to industry characteristics, forexample because industries with larger firms, more concentrated industries, or industries with more prevalenceof public ownership would lobby for higher initial tariff levels and smaller subsequent tariff reductions. If on theother hand, these sectors are systematically different in terms of vertical integration, one may spuriously obtain
27

Figure 4: Chinese import tariffs, 1999 and 2007
Figure 5: Chinese vertical integration indices, 1999 and 2007
In what follows, we examine whether Chinese firms have adjusted their vertical integration
structure following WTO accession. To this purpose, we run two sets of regressions. First, we
use a very similar specification as in our main test (4), using only those sectors for which we
observe some firms in both 1999 and in 2007:
Vf,k,t = α + β1 Tariffk,t + β2Xf,k,t + δk + δt + εf,k,t. (5)
Here, Xf,k,t is again a vector of controls, which includes Publicf,t, a dummy for public ownership
from Worldbase, and Herfindahlk,t. We control for Publicf,t since public ownership is very com-
negative correlations between vertical integration and tariffs. In our sample, however, this is not the case: thelevel of tariffs in 1999 is neither significantly correlated with sector-level average firm size, nor with industryconcentration or public ownership in the same year. Moreover, changes in tariffs between 1999 and 2007 are alsonot significantly correlated with the level of the previous variables in 1999.
28
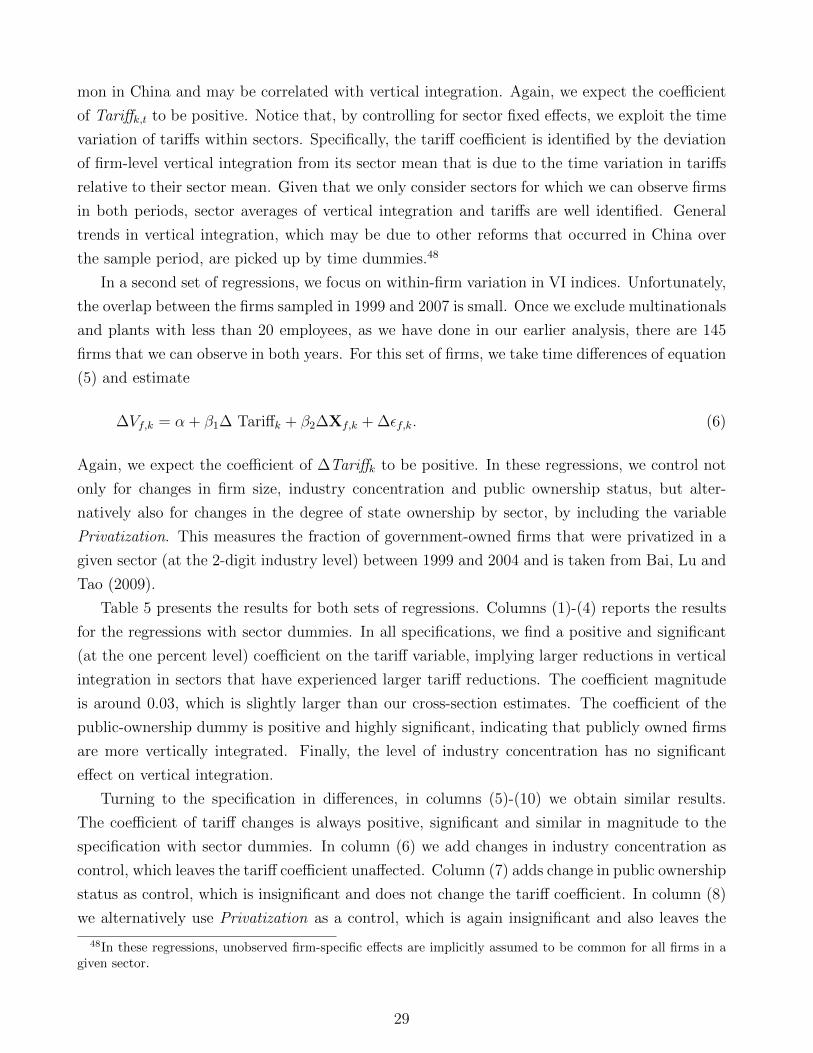
mon in China and may be correlated with vertical integration. Again, we expect the coefficient
of Tariffk,t to be positive. Notice that, by controlling for sector fixed effects, we exploit the time
variation of tariffs within sectors. Specifically, the tariff coefficient is identified by the deviation
of firm-level vertical integration from its sector mean that is due to the time variation in tariffs
relative to their sector mean. Given that we only consider sectors for which we can observe firms
in both periods, sector averages of vertical integration and tariffs are well identified. General
trends in vertical integration, which may be due to other reforms that occurred in China over
the sample period, are picked up by time dummies.48
In a second set of regressions, we focus on within-firm variation in VI indices. Unfortunately,
the overlap between the firms sampled in 1999 and 2007 is small. Once we exclude multinationals
and plants with less than 20 employees, as we have done in our earlier analysis, there are 145
firms that we can observe in both years. For this set of firms, we take time differences of equation
(5) and estimate
∆Vf,k = α + β1∆ Tariffk + β2∆Xf,k + ∆εf,k. (6)
Again, we expect the coefficient of ∆Tariffk to be positive. In these regressions, we control not
only for changes in firm size, industry concentration and public ownership status, but alter-
natively also for changes in the degree of state ownership by sector, by including the variable
Privatization. This measures the fraction of government-owned firms that were privatized in a
given sector (at the 2-digit industry level) between 1999 and 2004 and is taken from Bai, Lu and
Tao (2009).
Table 5 presents the results for both sets of regressions. Columns (1)-(4) reports the results
for the regressions with sector dummies. In all specifications, we find a positive and significant
(at the one percent level) coefficient on the tariff variable, implying larger reductions in vertical
integration in sectors that have experienced larger tariff reductions. The coefficient magnitude
is around 0.03, which is slightly larger than our cross-section estimates. The coefficient of the
public-ownership dummy is positive and highly significant, indicating that publicly owned firms
are more vertically integrated. Finally, the level of industry concentration has no significant
effect on vertical integration.
Turning to the specification in differences, in columns (5)-(10) we obtain similar results.
The coefficient of tariff changes is always positive, significant and similar in magnitude to the
specification with sector dummies. In column (6) we add changes in industry concentration as
control, which leaves the tariff coefficient unaffected. Column (7) adds change in public ownership
status as control, which is insignificant and does not change the tariff coefficient. In column (8)
we alternatively use Privatization as a control, which is again insignificant and also leaves the
48In these regressions, unobserved firm-specific effects are implicitly assumed to be common for all firms in agiven sector.
29

coefficient of tariffs unchanged. Finally, in columns (9) and (10), we simultaneously control
for changes in public ownership structure and changes in industry concentration by adding the
Herfindahl index. While changes in tariffs remain positive and significant, changes in industry
concentration and changes in public ownership have no significant effects.
5 Trade policy and organizational convergence
The purpose of this section is to assess the validity of the prediction of our model on the
relationship between cross-country differences in vertical integration and differences in their
trade policies. We construct sector-country-specific measures of vertical integration by regressing
firm-level vertical integration on industry-sector dummies and firm size. The estimate for the
sector-country dummy gives us a measure of the average level of vertical integration of industry
k in country c, denoted by Vk,c.
5.1 Tariff differences
We first examine whether cross-country differences in sectoral organizational structure are af-
fected by differences in tariffs. Our model predicts that, for a given country-pair cc′, organiza-
tional differences should be smaller for sectors characterized by similar levels of protection. To
verify this, we estimate the following model:
|Vk,c − Vk,c′ | = α + β1| Tariffk,c − Tariffk,c′ |+ β2|Xk,c −Xk,c′ |+ δk + δc,c′ + εk,c,c′ . (7)
The dependent variable is the absolute difference between countries c and c′ in the estimated
vertical integration indices for sector k. All differences are expressed in logs. The main regressor
of interest is the (log of the) absolute difference between these countries’ MFN tariffs in sector
k. The term |Xk,c −Xk,c′| captures differences in other sector-country characteristics that may
affect the degree of organizational convergence. Note that, because we are including dyad fixed
effects (δc,c′), β1 is identified by the cross-sectoral variation in the tariff difference for a given
country pair. To allow for correlation of the errors between sectors for a given country pair, we
cluster standard errors by dyad.
In the first column of Table 6, the only explanatory variable is the log-difference in MFN
tariffs. In line with our predictions, we find that, for a given country-pair differences in sectoral
vertical integration indices are significantly (at the one percent level) larger in sectors in which
differences in MFN tariffs are larger. A 100 percent increase in the difference in MFN tariffs
leads to a roughly 0.9 percent increase in the difference in vertical integration indices.
The second column adds interactions between Capital Intensity and differences in Finan-
cial Development and Legal Quality. The coefficient on the difference in MFN tariffs remains
30

relatively unchanged in magnitude and is significant at the 5 percent level.
In the middle and right panel of Table 6, we report the results of robustness checks using
different samples. As done for the results presented in Section 4, we first try adding multina-
tionals to our main sample, and then restrict the sample to countries for which we observe at
least 1,000 plants that are part of firms with at least 20 employees. Adding multinationals to the
analysis, we find that the impact of tariff differences on differences in vertical integration remains
positive and highly significant in all specifications. With respect to the results on organizational
convergence when the sample size is restricted, tariff differences continue to have a significant
positive effect on differences in vertical integration in all specifications.
5.2 Regional Trade Agreements
In the remainder of this section, we examine the relation between the degree of sectoral organi-
zational convergence and common membership in a regional trade agreement. In contrast to the
previous regressions, a causal interpretation of these regression results is more difficult, since it
is possible that countries that are generally more similar are more likely to form RTAs.
To assess the validity of our final empirical prediction, we explore how RTAs affect the extent
to which two countries have similar vertical integration structures at the industry level.
|Vk,c − Vk,c′ | = α + β1RTAc,c′ + β2Xc,c′ + δk + δc + δc′ + εk,c,c′ . (8)
The dependent variable is as in model (7), expressed as before in logs. The main regressor
of interest is now RTAc,c′ , a dummy that equals one if countries c and c′ are members of the
same RTA. The vector Xc,c′ captures a series of bilateral controls, such as dummies for contigu-
ity, common language, and colonial relationship, as well as variables that capture the distance
between countries, and differences in GDP (differences expressed in logs of absolute values).
Finally, we include sector fixed effects (δk) and country fixed effects (δc and δc′). Standard errors
are clustered by country-pair.
Table 7 presents the results for this regression. The left panel presents the estimates obtained
when using our main sample. In the first column of the left panel, in which we include only a
dummy for regional trade agreements, the coefficient of RTA is negative and significant at the
one-percent level. This implies that the difference in vertical integration indices for a country
pair in an RTA is about 9.2 percent smaller than for a country pair without an RTA. The results
for an alternative specification, which separates customs unions (CUs) from free trade areas
(FTAs), are presented in column two. As expected, the quantitative impact on organizational
convergence is greater for CUs than for FTAs. Country pairs that belong to the same CU have
a approximately 18.5% smaller difference in organizational structure than country pairs without
a RTA, while membership to FTAs has no significant impact on differences in organizational
structure. In the third column, we keep the coefficients for CUs and FTAs separate and add
31

a series of bilateral control variables that may have an impact on similarity of organizational
structure. The coefficient for CUs is reduced somewhat in size, but remains significant at the
10 percent level. Contiguity and common language have a significant negative effect on the
difference in vertical integration indices, while differences in GDP have a significant positive
effect. Colonial relationship and distance do not significantly affect the degree of organizational
convergence.
The middle and right panels of Table 7 show that the results for regional trade agreements are
also robust to using different samples. Membership in RTAs, and CUs in particular, continues to
reduce differences in vertical integration among member countries when we include multination-
als in our analysis, as shown in columns (4)-(6). The results continue to hold when we restrict
the sample to the subset of countries for which we have more than 1000 observations, though
the coefficient for CUs is insignificant in column (9), where we control for other country-pair
variables. However, in this case we have only 33 country pairs instead of 101.49
6 Conclusions
Traditional organizational economics has studied ownership decisions without much regard for
markets. Given technology and contractibility, there is a uniquely optimal organizational design,
the one that delivers the goods at least cost. Demand plays no role.
This paper provides evidence for the more recent view that markets do matter and that de-
mand is an essential determinant of firm boundaries. Demand affects product prices, prices affect
profitability, and profitability affects the tradeoffs organization designers face when determining
ownership structures. This causal link is captured by a model in which vertical integration gen-
erates more output than non-integration because of its comparative advantage in coordinating
operating decisions. But it imposes higher private costs on enterprise managers, forcing them
to accommodate to common ways of doing things. At low prices, the productivity gains from
integrating have little value, and managers choose non-integration. At high prices, the relative
value of coordination increases, favoring integration.
To assess the validity of the model’s predictions, we examine the organizational effects of
trade policy, which provides a source of price variation that is exogenous to firms’ ownership
decisions. We use a new dataset that enables us to construct firm-level vertical integration
indices for a large set of countries and industries. To study the link between product prices and
firm boundaries, we exploit cross-country and cross-sectoral differences in applied MFN tariffs,
as well as time variation in the degree of protection faced by firms. In line with the model’s
predictions, we find that market conditions — in particular the level of product prices — do
affect vertical integration: higher tariffs on final goods lead firms to be more vertically integrated,
49Note that we have more countries (101 instead of 80) than in the tariff regressions. This is because informationon applied MFN tariffs is less widely available than data on RTAs.
32

and this effect is stronger for non-exporting firms, which are more sensitive to domestic prices,
and for sectors in which domestic prices are expected to be more sensitive to import tariffs.
Our empirical results thus lend support to a simple model of the determination of firm bound-
aries. As such, they have implications beyond the positive theory of the firm. If integration
generates more output than non-integration, as it does in our model, then organizational choices
affect consumer welfare and aggregate economic performance (Legros and Newman (2009); Con-
coni, Legros and Newman (2012)). This calls for a reassessment of the effects not only of tariffs,
but of any price-distorting policy, in light of its potential impact on the organization and pro-
ductivity of firms.
References
Acemoglu, D., P. Aghion, R. Griffith, and F. Zilibotti (2010). “Vertical Integration and Tech-
nology: Theory and Evidence,” Journal of European Economic Association, 8, 1-45.
Acemoglu, D., S. Johnson, and T. Mitton (2009). “Determinants of Vertical Integration: Fi-
nancial Development and Contracting Costs,” Journal of Finance 63, 1251-1290.
Aghion, P., R. Griffith, and P. Howitt (2006). “Vertical Integration and Competition,” American
Economic Review Papers and Proceedings 96, 97-102.
Alfaro, L., and A. Charlton (2009). “Intra-Industry Foreign Direct Investment,” American
Economic Review 99, 2096-2119.
Antras, P. (2003). “Firms, Contracts, and Trade Structure,” Quarterly Journal of Economics
118, 1375-1418.
Antras, P., and R. W. Staiger (2011). “Offshoring and the Role of Trade Agreements,” forth-
coming, American Economic Review.
Bai, C., J. Lu, and Z. Tao (2009). “How Does Privatization Work in China,” Journal of
Comparative Economics 37, 453-470.
Baker, G., and T. Hubbard (2003). “Make Versus Buy in Trucking: Asset Ownership, Job
Design and Information,” American Economic Review 93, 551-572.
Baker, G., and T. Hubbard (2004). “Contractibility and Asset Ownership: On-Board Computers
and Governance in US Trucking,” Quarterly Journal of Economics 119, 1443-1479.
Bartelsman, E. J., and W. Gray (1996). “The NBER Manufacturing Productivity Database,”
NBER Technical Working Paper 205.
Beck T., A. Demigurc-Kunt, and R. Levine (2006). A New Database on Financial Development
and Structure (1960-2006).
Bchir, H., S. Jean, and D. Laborde (2006). “Binding Overhang and Tariff-Cutting Formulas,”
Review of World Economics 142, 207-232.
Black, S. E., and P. E. Strahan (2002). “Entrepreneurship and Bank Credit Availability,”
Journal of Finance 57, 2807-2833.
33

Bloom, N., and J. Van Reenen (2007). “Measuring and Explaining Management Practices
Across Firms and Countries,” Quarterly Journal of Economics 122, 1351-1408.
Bloom, N., R. Sadun, and J. Van Reenen (2010). “Does Product Market Competition Lead
Firms to Decentralize?,” American Economic Review 100, 434-438.
Bloom, N., R. Sadun, and J. Van Reenen (2012). “The Organization of Firms Across Countries,”
forthcoming, Quarterly Journal of Economics.
Bombardini, M. (2008). “Firm Heterogeneity and Lobby Participation,” Journal of International
Economics 75, 329-348.
Bradford, S. (2003). “Paying the Price: Final Goods Protection in OECD Countries,” Review
of Economics and Statistics 85,24-37.
Broda, C., J. Greenfield, and D. Weinstein (2006). “From Groundnuts to Globalization: A
Structural Estimate of Trade and Growth,” NBER Working Paper No. 12512.
Broda, C., N. Limao, and D. Weinstein (2008). “Optimal Tariffs and Market Power: The
Evidence,” American Economic Review 98, 2032-2065.
Caves, R. E. (1975). “Diversification, Foreign Investment and Scale in North American Manu-
facturing Industries,” Canadian Public Policy 2, 274-276.
Coase, R. H. (1937). “The Nature of the Firm,”Economica 4, 386-405.
Conconi, P., Legros, P., and A. F. Newman (2012). “Trade Liberalization and Organizational
Change,” Journal of International Economics 86, 197-208.
Fan, J. P. H., and L. H. Lang (2000). “The Measurement of Relatedness: An Application to
Corporate Diversification,” Journal of Business 73, 629-660.
Finger, J. M., H. K. Hall, and D. R. Nelson (1982). “The Political Economy of Administered
Protection,” American Economic Review 72, 452-466.
Goldberg, P. K., and G. Maggi (1999). “Protection for Sale: An Empirical Investigation,”
American Economic Review 85, 1135-1155.
Grossman S. J., and O. D. Hart (1986). “The Costs and Benefits of Ownership: A Theory of
Vertical and Lateral Integration,” Journal of Political Economy 94, 691-719.
Grossman, G. M., and E. Helpman (1994). “Protection for Sale,”American Economic Review
84, 833-850.
Grossman, G. M., and E. Helpman (2002). “Integration Versus Outsourcing In Industry Equi-
librium,”Quarterly Journal of Economics 117, 85-120.
Guadalupe, M., and J. Wulf (2010). “The Flattening Firm and Product Market Competition:
The Effect of Trade Liberalization,” American Economic Journal: Applied Economics,
forthcoming.
Harrison, A. E., I. Love, and M. S. McMillian (2004). “Global Capital Flows and Financing
Constraints,” Journal of Development Economics 75, 269-301.
Hart, O. D., and B. R. Holmstrom, (2010). “A Theory of Firm Scope,” Quarterly Journal of
Economics, 125, 483-513.
34

Hart, O. D., and J. H. Moore (1990). “Property Rights and the Nature of the Firm,” Journal
of Political Economy 98, 1119-1158.
Holmstrom, B. and P. Milgrom (1991). “Multitask Principal-Agent Analyses: Incentive Con-
tracts, Asset Ownership, and Job Design,” Journal of Law, Economics and Organization
7, 24-52.
Hortacsu, A., and C. Syverson (2007). “Cementing Relationships: Vertical Integration, Fore-
closure, Productivity and Prices,” Journal of Political Economy 115, 250-301.
Hortacsu, A., and C. Syverson (2009). “Why do Firms Own Production Chains? ”mimeo.
Hummels, D., J. Ishii, and K. Yi (2001). “The Nature and Growth of Vertical Specialization in
World Trade,” Journal of International Economics 54, 75-96.
Joskow, P. (1987). “Contract Duration and Relationship-Specific Investments: Empirical Evi-
dence from Coal Markets,” American Economic Review 77, 168-185.
Kaufmann, D., A. Kraay, and M. Mastruzzi (2004). “Governance Matters III: Governance
Indicators for 1996, 1998, 2000, and 2002,” World Bank Economic Review 18, 253-287.
Klapper, L., L. Laeven, and R. Rajan (2006). “Entry Regulation as a Barrier to Entrepreneur-
ship,” Journal of Financial Economics 82, 591-629.
Legros, P., and A. F. Newman (2008). “Competing for Ownership,” Journal of the European
Economic Association 6, 1279-1308.
Legros, P., and A. F. Newman (2012). “A Price Theory of Vertical and Lateral Integration,”
mimeo, ECARES and Boston University.McLaren, J. (2000). “Globalization and Vertical Structure,” American Economic Review 90,
1239-1254.
Mitra, D. (1999). “Endogenous Lobby Formation and Endogenous Protection: A Long-Run
Model of Trade Policy Determination,” American Economic Review 89, 1116-1134.
Nunn, N. (2007). “Relationship-Specificity, Incomplete Contracts, and the Pattern of Trade,”
Quarterly Journal of Economics 122, 569-600.
Ornelas, E., and J. Turner (2008). “Trade Liberalization, Outsourcing, and the Hold Up Prob-
lem,” Journal of International Economics 74, 225-241.
Rauch, J. (1999). “Networks Versus Markets in International Trade,” Journal of International
Economics 48, 7-35.
Rey, P., and J. Tirole (2007). “A Primer on Foreclosure,” in M. Armstrong, and R. Porter (eds.)
Handbook of Industrial Organization III, North-Holland.
Salinger, M. A. (1988). “Vertical Mergers and Vertical Foreclosure,” Quarterly Journal of
Economics 103, 345-356.
Santos-Silva J. M. C and Silvana Tenreyro (2006). “The Log of Gravity,” Review of Economics
and Statistics 88, 641-658.
Stuckey, J. A. (1983). Vertical Integration and Joint Ventures in the Aluminium Industry.
Harvard University Press, Cambridge, MA.
Woodruff, C. (2002). “Non-contractible Investments and Vertical Integration in the Mexican
Footwear Industry, International,” Journal of Industrial Organization 20, 1197-1224.
35

Table 1: Tariffs and vertical integration(1) (2) (3) (4) (5) (6) (7) (8)
Tariffk,c 0.0203*** 0.0034 0.0160** 0.0042 0.0202*** 0.0035 0.1600*** 0.005(0.0061) (0.0088) (0.0063) (0.0080) (0.0600) (0.0086) (0.0061) (0.0081)
Domesticf -0.0926*** -0.0923***(0.0108) (0.0109)
Tariffk,c 0.0214*** 0.0212***x Domesticf (0.0054) (0.0054)
Import-competingk,c -0.0362*** -0.0351***(0.0135) (0.0134)
Tariffk,c 0.0155** 0.0148**x Import-competingk,c (0.0070) (0.0070)
MFN sharek,c -0.0237 -0.0215(0.0190) (0.0190)
Tariffk,c 0.0245*** 0.0230***x MFN sharek,c (0.0074) (0.0075)
Capital Intensityk 0.0322** 0.0321** 0.0297** 0.0293**x Financial Developmentc (0.0142) (0.0144) (0.0148) (0.0145)
Capital Intensityk -0.0833 -0.0823 -0.0774 -0.0735x Legal Qualityc (0.0564) (0.0573) (0.0589) (0.0572)
# Observations 196,586 196,586 196,586 196,586 196,586 196,586 196,586 196,586# Sectors 386 386 386 386 386 386 386 386R2 0.117 0.119 0.117 0.117 0.117 0.119 0.117 0.117
Sector Fixed Effects YES YES YES YES YES YES YES YESCountry Fixed Effects YES YES YES YES YES YES YES YESCluster Country- Country- Country- Country- Country- Country- Country- Country-
sector sector sector sector sector sector sector sector
Notes: Robust standard errors clustered at the sector-country level in parentheses denoting *** 1%, **5%, and *10% significance. The sample includes firms≥ 20 employees in the manufacturing sector, excluding MNCs. Dependent variable: log of one plus Vf,k,c, the vertical integration index of firm f , withprimary sector k, located in country c. Explanatory variables are in logs, except MFN tariffs, where we use log of one plus the tariff. The variable Tariffk,c
is the MFN tariff imposed by country c in sector k. The dummy variables Domesticf and Import-competingk,c are alternative ways to capture firms thatonly sell in the domestic market. Domesticf identifies firms that do not export. Import-competingk,c identifies the top 25 percent most import-competing, asmeasured by a country’s total imports/exports. MFN sharek,c measures the fraction of imports of good k by country c that are subject to the MFN tariff,i.e., do not originate from countries with which country c has a regional trade agreement. Capital Intensityk is the total capital expenditures divided byvalue added. The variable Financial Developmentc measures private credit by deposit money banks and other financial institutions as a fraction of GDP.The variable Legal Qualityc proxies for the quality of a country’s institutions.
36

Table 2: Tariffs and vertical integration, competitive industries(1) (2) (3) (4) (5) (6) (7) (8)
Homogeneous large Homogeneous large Homogeneous large Homogeneous largesectors sectors with low tariff sectors with foreign presence sectors with low concentration
Tariffk,c 0.0290** 0.0292** 0.0380** 0.0381** 0.0316** 0.0315** 0.0747*** 0.0982***(0.0117) (0.0117) (0.0149) (0.0154) (0.0145) (0.0144) (0.0228) (0.0216)
Capital Intensityk 0.0063 0.0203 - 0.0035 0.68x Financial Developmentc (0.0524) (0.0436) (0.4420) (0.1610)
Capital Intensityk -0.0615 -0.2330 0.0499 1.027x Legal Qualityc (0.1950) (0.1440) (0.1870) (0.7290)
Observations 13,095 13,095 11,279 11,279 10,918 10,918 8,539 8,539# Sectors 56 56 54 54 53 53 37 37R2 0.073 0.073 0.052 0.052 0.068 0.068 0.047 0.047
Sector Fixed Effects YES YES YES YES YES YES YES YESCountry Fixed Effects YES YES YES YES YES YES YES YESCluster Country- Country- Country- Country- Country- Country- Country- Country-
sector sector sector sector sector sector sector sector
Notes: Robust standard errors clustered at the sector-country level are in parentheses; denoting *** 1%, **5%, and *10% significance. The sample includesfirms ≥ 20 employment in the manufacturing sector, excluding MNCs. Dependent variable: log of one plus Vf,k,c, the vertical integration index of firm f ,with primary sector k, located in country c. Explanatory variables are in logs, with the exception of MFN tariffs, where we use log of one plus the tariff.Tariffk,c is the MFN tariff imposed by country c in sector k. Capital Intensityk is the total capital expenditures divided by value added. The variableFinancial Developmentc measures private credit by deposit money banks and other financial institutions as a fraction of GDP. The variable Legal Qualityc
proxies for the quality of a country’s institutions. In all columns, the sample is restricted to sectors that satisfy the following two restrictions: they areclassified by Rauch (1999) as homogeneous (i.e., Homogeneousk = 1); and at least 20 domestic firms operate in the sector. Columns (3)-(4) include onlysectors in which Tariffk,c < 10%. Columns (5)-(6) include only sectors in which some foreign firms operate in the domestic market. In columns (7)-(8), thesample is restricted to sectors in which Herfindahlk,c ≤ 0.1.
37

Table 3: Tariffs and vertical integration, competitive industries(1) (2) (3) (4) (5) (6) (7) (8)
Homogeneous large Homogeneous large Homogeneous large Homogeneous largesectors sectors with low tariff sectors with foreign presence sectors with low concentration
Tariffk,c 0.0257*** 0.0248*** 0.0345*** 0.0341*** 0.0363*** 0.0363*** 0.0648*** 0.0639***(0.0083) (0.0084) (0.0085) (0.0084) (0.0101) (0.0102) (0.0112) (0.0116)
Capital Intensityk 0.0216 0.0041 0.0560 -0.0267x Financial Developmentc (0.0248) (0.0245) (0.0367) (0.0299)
Capital Intensityk -0.1240 -0.0952 - 0.3018** -0.0840x Legal Qualityc (0.0875) (0.1170) (0.1306) (0.1400)
Observations 78,437 78,437 69,823 69,823 69,980 69,980 50,315 50,315# Sectors 337 337 328 328 309 309 234 234R2 0.106 0.107 0.099 0.099 0.111 0.111 0.087 0.087
Sector Fixed Effects YES YES YES YES YES YES YES YESCountry Fixed Effects YES YES YES YES YES YES YES YESCluster Country- Country- Country- Country- Country- Country- Country- Country-
sector sector sector sector sector sector sector sector
Notes: Robust standard errors clustered at the sector-country level are in parentheses; denoting *** 1%, **5%, and *10% significance. The sample includesfirms ≥ 20 employment in the manufacturing sector, excluding MNCs. Dependent variable: log of one plus Vf,k,c, the vertical integration index of firm f , withprimary sector k, located in country c. Explanatory variables are in logs, with the exception of MFN tariffs, where we use log of one plus the tariff. Tariffk,c
is the MFN tariff imposed by country c in sector k. Capital Intensityk is the total capital expenditures divided by value added. The variable FinancialDevelopmentc measures private credit by deposit money banks and other financial institutions as a fraction of GDP. The variable Legal Qualityc proxies forthe quality of a country’s institutions. In all columns, the sample is restricted to sectors that satisfy the following two restrictions: they are classified ashomogeneous if import-demand elasticity is higher than the median for the country (i.e., Homogeneousk,c = 1); and at least 20 domestic firms operate inthe sector. Columns (3)-(4) include only sectors in which Tariffk,c < 10%. Columns (5)-(6) include only sectors in which some foreign firms operate in thedomestic market. In columns (7)-(8), the sample is restricted to sectors in which Herfindahlk,c ≤ 0.1.
38

Table 4: Tariffs and vertical integration, controlling for possible omitted variables(1) (2) (3) (4) (5) (6) (7) (8) (9)
Tariffk,c 0.0203*** 0.0202*** 0.0203*** 0.0190*** 0.0214*** 0.0210*** 0.0212*** 0.0198*** 0.0183***(0.0061) (0.0060) (0.0074) (0.0058) (0.0065) (0.0059) (0.0059) (0.0057) (0.0061)
Capital Intensityk 0.0322** 0.0333** 0.0387** 0.0425** 0.0401** 0.0319** 0.0390** 0.0507**x Financial Developmentc (0.0142) (0.0161) (0.0154) (0.0176) (0.0187) (0.0146) (0.0189) (0.0234)
Capital Intensityk -0.0833 -0.0785 -0.100* -0.106 -0.103 -0.0836 -0.0944 -0.127x Legal Qualityc (0.0564) (0.0617) (0.0604) (0.0682) (0.0711) (0.0577) ( 0.0705) (0.0885)
Input Tariffk,c 0.0391*** 0.0330** 0.0464***(0.0142) (0.0141) ( 0.0170)
Export Tariffk,c 0.00252 -0.0038 -0.0049(0.0052) (0.0060) (0.0063)
Herfindahlk,c 0.0128 0.0141(0.0228) ( 0.0316)
Sizef 0.0352*** 0.0440***(0.0075) (0.0111)
Labor Productivityf 0.0267*** 0.0287***(0.0054) (0.0069)
# Observations 196,586 196,586 154,915 185,630 146,228 178,199 196,586 178,448 133,545# Sectors 386 386 311 386 311 386 386 386 311R2 0.117 0.117 0.119 0.123 0.125 0.117 0.122 0.125 0.132
Sector Fixed Effects YES YES YES YES YES YES YES YES YESCountry Fixed Effects YES YES YES YES YES YES YES YES YESCluster Country- Country- Country- Country- Country- Country- Country- Country- Country-
sector sector sector sector sector sector sector sector sector
Notes: Robust standard errors clustered at the sector-country level are in parentheses denoting *** 1%, **5%, and *10% significance. The sample includesfirms ≥ 20 employment in the manufacturing sector, excluding MNCs. Dependent variable: log of one plus Vf,k,c, the vertical integration index of firm f ,with primary sector k, located in country c. Explanatory variables are in logs, with the exception of output tariffs, input tariff and export tariff, where weuse log of one plus the tariff. Tariffk,c is the MFN tariff imposed by country c in sector k. Capital Intensityk is the total capital expenditures divided byvalue added. The variable Financial Developmentc measures private credit by deposit money banks and other financial institutions as a fraction of GDP.The variable Legal Qualityc proxies for the quality of a country’s institutions. Import Tariffk,c is the tariff imposed by country c on inputs of good k. ExportTariffk,c is the tariff faced by firms exporting good k from country c. Herfindahlk,c is the Herfindahl index of sector k in country c. In columns (7)-(9) wereport 2SLS estimates. Sizef measures firm size (instrumented with employment predicted with sector-country dummies).Labor productivityf is measured assales per worker (instrumented with sales per worker predicted with sector-country dummies).
39

Table 5: Tariffs and vertical integration, China’s accession to the WTO
(1) (2) (3) (4) (5) (6) (7) (8) (9) (10)
Tariffk,t 0.0313*** 0.0356** 0.0313*** 0.0357**(0.0096) (0.0160) (0.0096) (0.0160)
Herfindahlk,t -0.0040 -0.0040(0.0113) (0.0113)
Publicf,t 0.0055*** 0.0059***(0.0010) (0.0015)
Change Tariffk 0.0364* 0.0459* 0.0364* 0.0364* 0.0456* 0.0451*(0.0202) (0.0234) (0.0203) (0.0205) (0.0234) (0.0230)
Change Herfindahlk -0.0371 -0.0307 -0.0406(0.0292) (0.0297) (0.0301)
Change Publicf 0.0007 -0.0351(0.0135) (0.0320)
Privatizationk -0.0351 0.0574(0.0798) (0.1180)
# Observations 28,928 13,682 28,928 13,682 145 75 145 145 75 75# Sectors 88 88 88 88 88 75 88 88 75 75
R2 0.921 0.902 0.921 0.902 0.042 0.087 0.042 0.042 0.104 0.089Sector Fixed Effect YES YES YES YES NO NO NO NO NO NOTime Fixed Effect YES YES YES YES YES YES YES YES YES YESCluster Sector Sector Sector Sector Sector Sector Sector Sector Sector Sector
Notes: Robust standard errors clustered at the sector level in parentheses denoting *** 1%, **5%, and *10% significance. In columns (1)- (4), the dependentvariable is the log of one plus Vf,k,c, the vertical integration index of firm f , with primary sector k, located in country c; in columns (5)-(10), it is the changein the log of one plus the vertical integration index between 1999 (pre accession) and 2007 (post accession). The sample includes Chinese firms observedin 1999 and 2007 ≥ 20 employees in the manufacturing sector, excluding MNCs. Tariffk is the log of (one plus) MFN tariff applied by China in sector k.Publicf is a firm-level dummy for public ownership, Privatizationk is a sector-level measure for the amount of privatization and Herfindahlk is the Herfindahlindex for sector k.
40

Table 6: Tariff differences and organizational convergence
(1) (2) (3) (4) (5) (6)Main Sample Including Multinationals Countries > 1,000 plants
Diff. Tariffsk,c,c′ 0.0089*** 0.0086** 0.0199*** 0.0208*** 0.0091** 0.0070*(0.0034) (0.0037) (0.0030) (0.0034) (0.0040) (0.0043)
Cap. Intensityk 0.0020 0.0029 -0.0118x diff. Fin. Developmentc,c′ (0.0066) (0.0066) (0.0075)
Cap. Intensityk 0.0419*** 0.0477*** 0.0568***x diff. Legal Qualityk,c,c′ (0.0062) (0.0063) (0.0074)
# Observations 212,770 171,908 233,105 187,182 142,573 121,709# Country pairs 80 80 80 80 33 33R2 0.164 0.164 0.146 0.147 0.171 0.172
Sector Fixed Effect YES YES YES YES YES YESDiadic Fixed Effect YES YES YES YES YES YESCluster Country-pair Country-pair Country-pair Country-pair Country-pair Country-pair
Notes: Robust standard errors clustered at the country-pair level in parentheses denoting *** 1%, **5%, and *10% significance. Dependent variable: log of(one plus) the absolute difference between countries c and c′ in the estimated vertical integration index of firms with primary sector k. In columns (1)-(3)the sample include firms ≥ 20 employees in the manufacturing sector, excluding MNCs; in columns (4)-(6), the sample includes MNCs; in columns (7)-(9),the sample includes firms ≥ 20 employment in the manufacturing sector, excluding MNCs, located in countries with at least 1,000 plants.

Table 7: Regional Trade Agreements and organizational convergence
(1) (2) (3) (4) (5) (6) (7) (8) (9)Main Sample Including Multinationals Countries ≥ 1000 plants
RTAc,c′ -0.0921*** -0.0874*** -0.0474(0.0235) (0.0205) (0.0299)
Customs Unionc,c′ -0.185*** -0.0760* -0.177*** -0.0748* -0.127*** -0.0132(0.0376) (0.046) (0.0323) (0.0396) (0.0489) (0.061)
Free Trade Areac,c′ -0.0404 0.0203 -0.0356 0.0222 -0.00944 0.0531(0.0266) (0.0264) (0.0234) (0.0236) (0.032) (0.0336)
Distancec,c′ 0.0188 0.0220* 0.0145(0.0146) (0.0129) (0.0211)
Contiguityc,c′ -0.196*** -0.155*** -0.237***(0.0754) (0.0641) (0.0852)
Common Languagec,c′ -0.119*** -0.109*** -0.159***(0.0313) (0.0275) (0.0433)
Colonial Relationshipc,c′ 0.0663 0.0631* 0.000(0.0421) (0.0348) (0.0746)
Difference GDPc,c′ 0.0389*** 0.0357*** 0.0280**(0.0087) (0.0074) (0.0121)
# Observations 299,649 299,649 299,649 328,756 328,756 328,756 210,475 210,475 210,475# Country pairs 101 101 101 101 101 33 33 33 33R2 0.109 0.109 0.111 0.09 0.091 0.093 0.118 0.119 0.122
Sector Fixed Effect YES YES YES YES YES YES YES YES YESCountry Fixed Effect YES YES YES YES YES YES YES YES YESCluster Country-pair Country-pair Country-pair Country-pair Country-pair Country-pair Country-pair Country-pair Country-pair
Notes: Robust standard errors clustered at the country-pair level in parentheses denoting *** 1%, **5%, and *10% significance. Dependent variable: logof (one plus) the absolute difference between countries c and c′ in the estimated vertical integration index in the primary sector k. In columns (1)-(3), thesample includes firms ≥ 20 employees in the manufacturing sector, excluding MNCs; in columns (4)-(6), the sample includes MNCs; in columns (7)-(9), thesample includes firms ≥ 20 employment in the manufacturing sector, excluding MNCs, located in countries with at least 1,000 plants.
42

Appendix
Table A-1: Sample frame
WB code Freq. Percent Cum. WB code Freq. Percent Cum.
ALB 4 0.00 0.00 MAR 603 0.31 61.52ARG 998 0.51 0.51 MDG 18 0.01 61.53AUS 5,079 2.58 3.09 MEX 2,641 1.34 62.87AUT 1,464 0.74 3.84 MLI 13 0.01 62.88BEL 928 0.47 4.31 MOZ 16 0.01 62.89BEN 4 0.00 4.31 MUS 46 0.02 62.91BFA 8 0.00 4.32 MWI 2 0.00 62.91BGD 6 0.00 4.32 MYS 3,101 1.58 64.49BGR 360 0.18 4.50 NER 1 0.00 64.49BOL 55 0.03 4.53 NIC 21 0.01 64.50BRA 5,594 2.85 7.38 NLD 676 0.34 64.84CAN 7,469 3.80 11.18 NOR 847 0.43 65.27CHE 1,150 0.58 11.76 NZL 959 0.49 65.76CHL 454 0.23 11.99 OMN 67 0.03 65.80COL 550 0.28 12.27 PAK 4 0.00 65.80CRI 176 0.09 12.36 PER 888 0.45 66.25CZE 1,736 0.88 13.24 PHL 351 0.18 66.43DEU 19,302 9.82 23.06 PNG 4 0.00 66.43DNK 425 0.22 23.28 POL 446 0.23 66.66ECU 183 0.09 23.37 PRT 5,433 2.76 69.42ESP 2,322 1.18 24.55 PRY 50 0.03 69.45FIN 448 0.23 24.78 ROM 614 0.31 69.76FRA 8,965 4.56 29.34 RWA 2 0.00 69.76GAB 3 0.00 29.34 SAU 314 0.16 69.92GBR 6,622 3.37 32.71 SEN 47 0.02 69.94GHA 81 0.04 32.75 SGP 790 0.40 70.35GRC 2,231 1.13 33.89 SLV 129 0.07 70.41GTM 93 0.05 33.93 SWE 689 0.35 70.76HND 77 0.04 33.97 TGO 4 0.00 70.76HUN 2,346 1.19 35.17 THA 507 0.26 71.02IDN 233 0.12 35.29 TTO 79 0.04 71.06IND 2,592 1.32 36.60 TUN 991 0.50 71.57IRL 587 0.30 36.90 TUR 2,557 1.30 72.87ISR 1,538 0.78 37.68 TZA 24 0.01 72.88ITA 8,426 4.29 41.97 UGA 37 0.02 72.90JAM 43 0.02 41.99 URY 114 0.06 72.96JOR 148 0.08 42.07 USA 52,917 26.92 99.87JPN 34,441 17.52 59.59 VEN 231 0.12 99.99KEN 134 0.07 59.66 ZAF 1 0.00 99.99KOR 3,060 1.56 61.21 ZMB 17 0.01 100.00
Total 196,586 100.00
Notes: Data from 2004 WorldBase data, Dun & Bradstreet. Sample includes firms ≥ 20 employees in the
manufacturing sector, excluding MNCs.
43

Table A-2: Sample frame: restricted sample
WB code Freq. Percent Cum.
ARG 998 0.53 0.53AUS 5,079 2.68 3.21AUT 1,464 0.77 3.98BEL 928 0.49 4.47BRA 5,594 2.95 7.43CAN 7,469 3.95 11.37CHE 1,150 0.61 11.98CZE 1,736 0.92 12.9DEU 19,302 10.2 23.09DNK 425 0.22 23.32ESP 2,322 1.23 24.54FIN 448 0.24 24.78FRA 8,965 4.74 29.52GBR 6,622 3.5 33.01GRC 2,231 1.18 34.19HUN 2,346 1.24 35.43IND 2,592 1.37 36.8IRL 587 0.31 37.11ISR 1,538 0.81 37.92ITA 8,426 4.45 42.37JPN 34,441 18.19 60.56KOR 3,060 1.62 62.18MEX 2,641 1.39 63.58MYS 3,101 1.64 65.21NLD 676 0.36 65.57NOR 847 0.45 66.02NZL 959 0.51 66.52PRT 5,433 2.87 69.39SGP 790 0.42 69.81SWE 689 0.36 70.18TUN 991 0.52 70.7TUR 2,557 1.35 72.05USA 52,917 27.95 100Total 189,324 100
Notes: Data from 2004 WorldBase data, Dun & Bradstreet. Sample includes firms ≥ 20 employment in the
manufacturing sector located in countries with at least 1000 plants, excluding MNCs.
44

Table A-3: Summary statistics
Median Mean Std. Dev. N
Vertical Integration Indexf 0.044 0.063 0.063 196,586Sizef 38.000 98.936 472.395 196,586Labor productivityf 11.506 11.446 1.082 178,448Domesticf 0 0.233 0.423 196,586Import-competingk,c 0.702 0.705 0.571 196,586Tariffk,c 2.480 4.849 7.253 196,586Input Tariffk,c 2.546 3.994 4.954 154,915Export Tariffk,c 5.654 6.611 5.039 185,630MFN Sharek,c 0.564 0.545 0.351 196,586Herfindahlk,c 0.053 0.132 0.188 178,199Homogeneous1k 0 0.081 0.273 196,586Homogeneous2k,c 0 0.491 0.499 173,587Capital Intensityk -2.857 -2.902 0.458 387Financial Developmentc 0.332 0.554 0.479 80Legal Qualityc 0.545 0.583 0.209 80
Difference Ver. Int. Indexk,c,c′ -1.593 -1.707 1.614 299,649Regional Trade Agreementc,c′ 0.000 0.263 0.440 299,649Free Trade Agreementc,c′ 0.000 0.148 0.355 299,649Customs Unionc,c′ 0.000 0.115 0.319 299,649Distancec,c′ 9.017 8.629 0.965 299,649Contiguityc,c′ 0.000 0.041 0.139 299,649Colonial Relationshipc,c′ 0.000 0.020 0.178 299,649Common Languagec,c′ 0.000 0.122 0.328 299,649Difference GDPc,c′ 0.450 0.201 1.812 299,649
Sources: Vertical Integration Indexf , Sizef , Labor Productivityf , Domesticf and Herfindahlk,c constructed using
plant-level data from 2004 WorldBase, Dun & Bradstreet. Tariffk,c from TRAINS/WTO; Input Tariffk,c, Export
Tariffk,c, and MFN Sharek,c constructed using data from TRAINS/WTO and COMTRADE. Import-Competingk,c
constructed using data from COMTRADE. Information on regional trade agreements from the WTO. Homo-
geneous1 k from Rauch (1999), Homogeneous2 k,c constructed using data from Broda, Greenfield and Weinstein
(2006). Capital Intensityk from NBER-CES manufacturing industry database. Financial Developmentc from
Beck, Demigurc-Kunt and Levine (2006). Legal Qualityc from Kaufmann, Kraay, and Mastruzzi (2004). GDPc
from World Bank. Contiguityc,c′ , Colonial Relationshipc,c′ , and Common Languagec,c′ from CEPII. Vertical In-
tegration Indexf ,Tariffk,c, Input Tariffk,c, Export Tariffk,c, Sizef , Herfindahlk,c, and MFN Sharek,c are in levels;
all other variables (with the exception of indicator variables) are in logs.
45

Table A-4: Vertical integration by 2-digit SIC industry
Industry SIC VI index
TEXTILES 22 0.115APPAREL 23 0.111CHEMICALS 28 0.098PRIMARY METAL PRODUCTS 33 0.091ELECTRICAL MACHINERY 36 0.089TRANSPORTATION EQUIPMENT 37 0.067PETROLEUM REFINING 29 0.062LEATHER 31 0.062RUBBER AND PLASTICS 30 0.060MACHINERY, EXCEPT ELECTRICAL 35 0.060MANUFACTURING NEC 39 0.059LUMBER AND WOOD PRODUCTS 24 0.059FOOD AND KINDRED PRODUCTS 20 0.056TOBACCO MANUFACTURES 21 0.053STONE, CLAY, GLASS, & CONCRETE 32 0.049FABRICATED METAL PRODUCTS 34 0.039PRINTING AND PUBLISHING 27 0.039SCIENTIFIC INSTRUMENTS 38 0.036PAPER AND ALLIED PRODUCTS 26 0.034FURNITURE AND FIXTURES 25 0.022
Notes: Data from 2004 WorldBase data, Dun & Bradstreet. Sample includes firms ≥ 20 employment in the
manufacturing sector, excluding MNCs.
46

Table A-5: Sample comparisons: vertical integration indices
Main sample Countries Including MNCs≥ 1,000 plants
# of plants 225,212 217,723 279,869# of connected plants 29,214 29,008 64,789# of multi-plant firms 6,830 6,768 10,224# of single-plant firms 189,756 182,556 205,062# of firms 196,586 189,324 215,286# of MNCs 0 0 18,700Mean, Vertical integration index 0.0627 0.0640 0.0640Median, Vertical integration index 0.0437 0.0439 0.0439Min, Vertical integration index 0.0000 0.0000 0.0000Max, Vertical integration index 0.8333 0.8333 0.8333St. dev., Vertical integration index 0.0633 0.0623 0.0645
Notes: Plant- and firm-level data from 2004 WorldBase data, Dun & Bradstreet. All samples include firms ≥ 20
employees in manufacturing sectors. Column (1) is the main sample; columns (2) and (3) are samples used in
robustness checks.
47

Table A-6: Tariffs and vertical Integration, including multinationals(1) (2) (3) (4) (5) (6) (7) (8) (9)
Tariffk,c 0.0164*** 0.0162*** 0.0164** 0.0146** 0.0166*** 0.0169*** 0.0176*** 0.0159*** 0.0149**(0.0062) (0.0061) (0.007) (0.0057) (0.0063) (0.0061) (0.0060) (0.0060) (0.0060)
Multinationalf 0.0661*** 0.0662*** 0.112*** 0.0656*** 0.113*** 0.0817*** -0.00735 0.069*** -0.0104(0.0144) (0.0144) (0.0179) (0.0135) (0.0170) (0.0159) (0.0125) (0.0179) (0.0203)
Capital Intensityk 0.0304** 0.0275* 0.0388** 0.0387** 0.0378** 0.0293** 0.0368** 0.0446*x Financial Developmentc (0.0143) (0.0167) (0.0156) (0.0183) (0.0184) (0.0148) (0.0184) (0.0247)
Capital Intensityk -0.0973* -0.078 -0.121** -0.114 -0.118* -0.0976* -0.109 -0.126x Legal Qualityc (0.0549) (0.0644) (0.0595) (0.0712) (0.0676) (0.0566) (0.0667) (0.0920)
Input Tariffk,c 0.0394*** 0.0357*** 0.0482***(0.0128) (0.0135) (0.0170)
Export Tariffk,c 0.001 -0.00652 -0.0073(0.0049) (0.0057) (0.0063)
Herfindahlk,c 0.0252 0.0190(0.0227) (0.0309)
Sizef 0.0499*** 0.0741***(0.0096) (0.0123)
Labor Productivityf 0.0237*** 0.0321***(0.0060) (0.0070)
# Observations 215,286 215,286 168,580 203,862 159,537 193,938 215,286 194,286 144,919# Sectors 386 386 311 386 311 386 386 386 311R2 0.105 0.105 0.113 0.11 0.118 0.107 0.109 0.122 0.132
Sector Fixed Effects YES YES YES YES YES YES YES YES YESCountry Fixed Effects YES YES YES YES YES YES YES YES YESCluster Country- Country- Country- Country- Country- Country- Country- Country- Country-
sector sector sector sector sector sector sector sector sector
Notes: Robust standard errors clustered at the country-pair level are in parentheses denoting *** 1%, **5%, and *10% significance. The sample includesfirms ≥ 20 employment in the manufacturing sector, including MNCs. Dependent variable: log of one plus Vf,k,c, the vertical integration index of firm f ,with primary sector k, located in country c. Explanatory variables are in logs, with the exception of output tariffs, input tariffs and export tariffs, wherewe use log of one plus the tariff. Explanatory variables are in logs, with the exception of output tariffs, input tariff and export tariff, where we use log ofone plus the tariff. Tariffk,c is the log of the MFN tariff imposed by country c in sector k. Capital Intensityk is the total capital expenditures divided byvalue added. The variable Financial Developmentc measures private credit by deposit money banks and other financial institutions as a fraction of GDP.The variable Legal Qualityc proxies for the quality of a country’s institutions. Import Tariffk,c is the tariff imposed by country c on inputs of good k. ExportTariffk,c is the tariff faced by firms exporting good k from country c. Herfindahlk,c is the Herfindahl index of sector k in country c. In columns (7)-(9) wereport 2SLS estimates. Sizef measures firm size (instrumented with employment predicted with sector-country dummies). Labor productivityf is measuredas sales per worker (instrumented with sales per worker predicted with sector-country dummies).
48

Table A-7: Tariffs and vertical integration, countries ≥ 1,000 plants(1) (2) (3) (4) (5) (6) (7) (8) (9)
Tariffk,c 0.0202*** 0.0200*** 0.0184*** 0.0183*** 0.0187*** 0.0213*** 0.0212*** 0.0201*** 0.0176***(0.0059) (0.0057) (0.0067) (0.0056) (0.0060) (0.0059) (0.0057) (0.0058) (0.0063)
Capital Intensityk 0.0377** 0.0401** 0.0411** 0.0456** 0.0425** 0.0367** 0.0413** 0.0525**x Financial Developmentc (0.0169) (0.0192) (0.0171) (0.0197) (0.0207) (0.0174) (0.0208) (0.0254)
Capital Intensityk -0.103 -0.104 -0.115 -0.124 -0.114 -0.0996 -0.105 -0.135x Legal Qualityc (0.0722) (0.0807) (0.0729) (0.0834) (0.0854) (0.0742) (0.0844) (0.1040)
Input Tariffk,c 0.0430*** 0.0378** 0.0469***(0.0140) (0.0148) (0.0180)
Export Tariffk,c 0.00243 -0.00448 -0.0048(0.0055) (0.0064) (0.0065)
Herfindahlk,c 0.0113 0.0101(0.0249) (0.0337)
Sizef 0.0457*** 0.0462***(0.0091) (0.0123)
Labor Productivityf 0.0301*** 0.0307***(0.0068) (0.0083)
# Observations 189,324 189,324 149,791 179,960 142,362 174,479 189,324 174,723 131,421# Sectors 386 386 311 386 311 386 386 386 311R2 0.118 0.118 0.12 0.125 0.126 0.117 0.124 0.122 0.131
Sector Fixed Effects YES YES YES YES YES YES YES YES YESCountry Fixed Effects YES YES YES YES YES YES YES YES YESCluster Country- Country- Country- Country- Country- Country- Country- Country- Country-
sector sector sector sector sector sector sector sector sector
Notes: Robust standard errors clustered at the country-pair level are in parentheses denoting *** 1%, **5%, and *10% significance. The sample includesfirms ≥ 20 employment in manufacturing sectors, excluding MNCs, located in countries with at least 1,000 plants. Dependent variable: log of one plusVf,k,c, the vertical integration index of firm f , with primary sector k, located in country c. Explanatory variables are in logs, with the exception of outputtariffs, input tariffs and export tariffs, where we use log of one plus the tariff. Tariffk,c is the log of the MFN tariff imposed by country c in sector k. CapitalIntensityk is the total capital expenditures divided by value added. The variable Financial Developmentc measures private credit by deposit money banksand other financial institutions as a fraction of GDP. The variable Legal Qualityc proxies for the quality of a country’s institutions. Import Tariffk,c is thetariff imposed by country c on inputs of good k. Export Tariffk,c is the tariff faced by firms exporting good k from country c. Herfindahlk,c is the Herfindahlindex of sector k in country c. In columns (7)-(9) we report 2SLS estimates. Sizef measures firm size (instrumented with employment predicted withsector-country dummies). Labor productivityf is measured as sales per worker (instrumented with sales per worker predicted with sector-country dummies).
49

Table A-8: Tariffs and vertical integration, Poisson quasi-maximum likelihood estimator(1) (2) (3) (4) (5) (6) (7) (8) (9)
Tariffk,c 0.0126** 0.0121** 0.0281*** 0.0114* 0.0258*** 0.0117* 0.0126** 0.0108* 0.0191*(0.0058) (0.0058) (0.0086) (0.0061) (0.0092) (0.0064) (0.0058) (0.0064) (0.0105)
Capital Intensityk 0.0385** 0.0545** 0.0443** 0.0651** 0.0484** 0.0399** 0.0469** 0.0822**x Financial Developmentc (0.0165) (0.0267) (0.0178) (0.0293) (0.0208) (0.0165) (0.0205) (0.0361)Capital Intensityk -0.153** -0.232** -0.164** -0.265** -0.189** -0.163*** -0.176*** -0.337**x Legal Qualityc (0.0629) (0.1030) (0.0679) (0.1140) (0.0744) (0.0629) (0.0738) (0.1370)Input Tariffk,c -0.0122 -0.0042 0.0210
(0.0201) (0.0208) (0.0210)Export Tariffk,c 0.0043 0.0002 -0.0011
(0.0050) (0.0070) (0.0072)Herfindahlk,c 0.0027 0.0284
(0.0290) (0.0520)Sizef 0.0438*** 0.0565***
(0.0079) (0.0142)Labor Productivityf 0.0322*** 0.0365***
(0.0079) ( 0.0105)
# Observations 149,992 149,992 116,086 142,364 110,448 133,413 149,992 133,607 99,017# Sectors 386 386 311 386 311 386 386 386 311
Sector Fixed Effects YES YES YES YES YES YES YES YES YESCountry Fixed Effects YES YES YES YES YES YES YES YES YESCluster Country- Country- Country- Country- Country- Country- Country- Country- Country-
sector sector sector sector sector sector sector sector sector
Notes: Robust standard errors clustered at the country-pair level are in parentheses denoting *** 1%, **5%, and *10% significance. The sample includesfirms ≥ 20 employment in manufacturing sectors, excluding MNCs. Dependent variable: Vf,k,c, the vertical integration index of firm f , with primary sectork, located in country c. Explanatory variables are in logs and can be interpreted as elasticities. Tariffk,c is the log of the MFN tariff imposed by country c insector k. Capital Intensityk is the total capital expenditures divided by value added. The variable Financial Developmentc measures private credit by depositmoney banks and other financial institutions as a fraction of GDP. The variable Legal Qualityc proxies for the quality of a country’s institutions. ImportTariffk,c is the tariff imposed by country c on inputs of good k. Export Tariffk,c is the tariff faced by firms exporting good k from country c. Herfindahlk,c isthe Herfindahl index of sector k in country c. Sizef is predicted (with sector-country dummies) firm size, Labor Productivityf is predicted (with sector-countrydummies) sales per worker.
50