lecture 31: more chapter 11, section 3 categorical
TRANSCRIPT
©2011 Brooks/Cole, CengageLearning
Elementary Statistics: Looking at the Big Picture 1
Lecture 31: more Chapter 11, Section 3Categorical & Quantitative VariableMore About ANOVA
ANOVA: Hypotheses, Table, Test Stat, P-value1st Step in Practice: Displays, SummariesANOVA OutputGuidelines for Use of ANOVA
©2011 Brooks/Cole,Cengage Learning
Elementary Statistics: Looking at the Big Picture L31.2
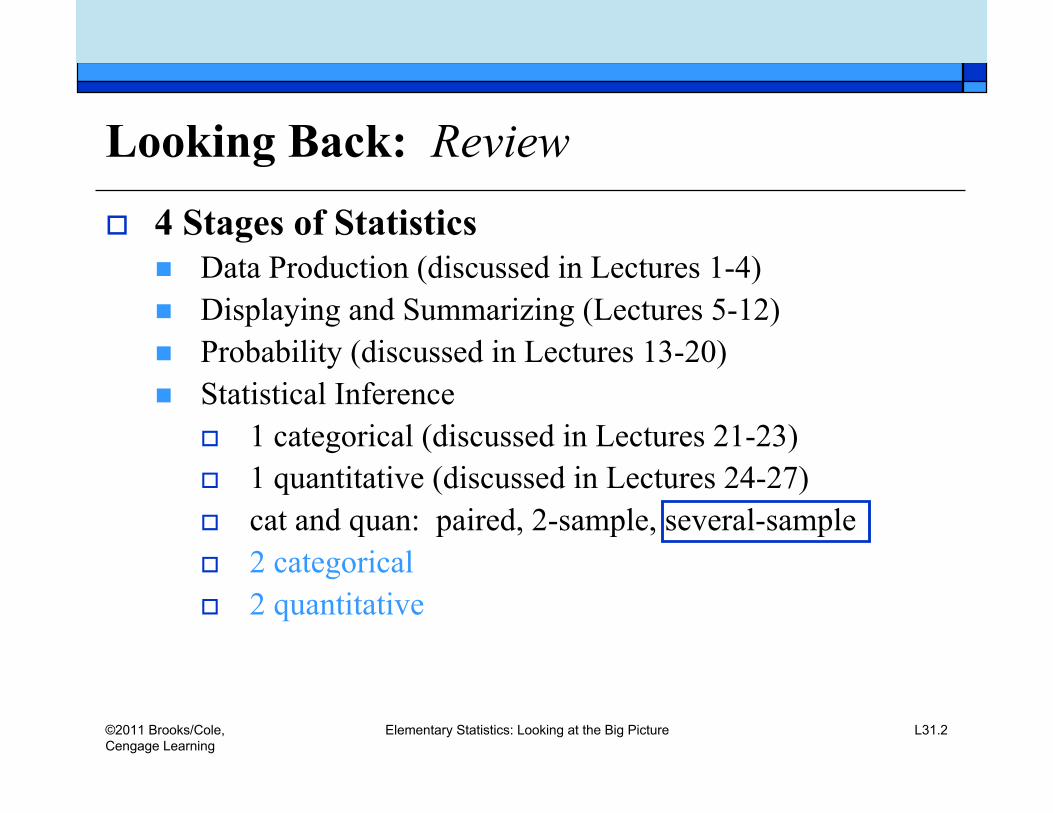
Looking Back: Review 4 Stages of Statistics
Data Production (discussed in Lectures 1-4) Displaying and Summarizing (Lectures 5-12) Probability (discussed in Lectures 13-20) Statistical Inference
1 categorical (discussed in Lectures 21-23) 1 quantitative (discussed in Lectures 24-27) cat and quan: paired, 2-sample, several-sample 2 categorical 2 quantitative
©2011 Brooks/Cole,Cengage Learning
Elementary Statistics: Looking at the Big Picture L31.5
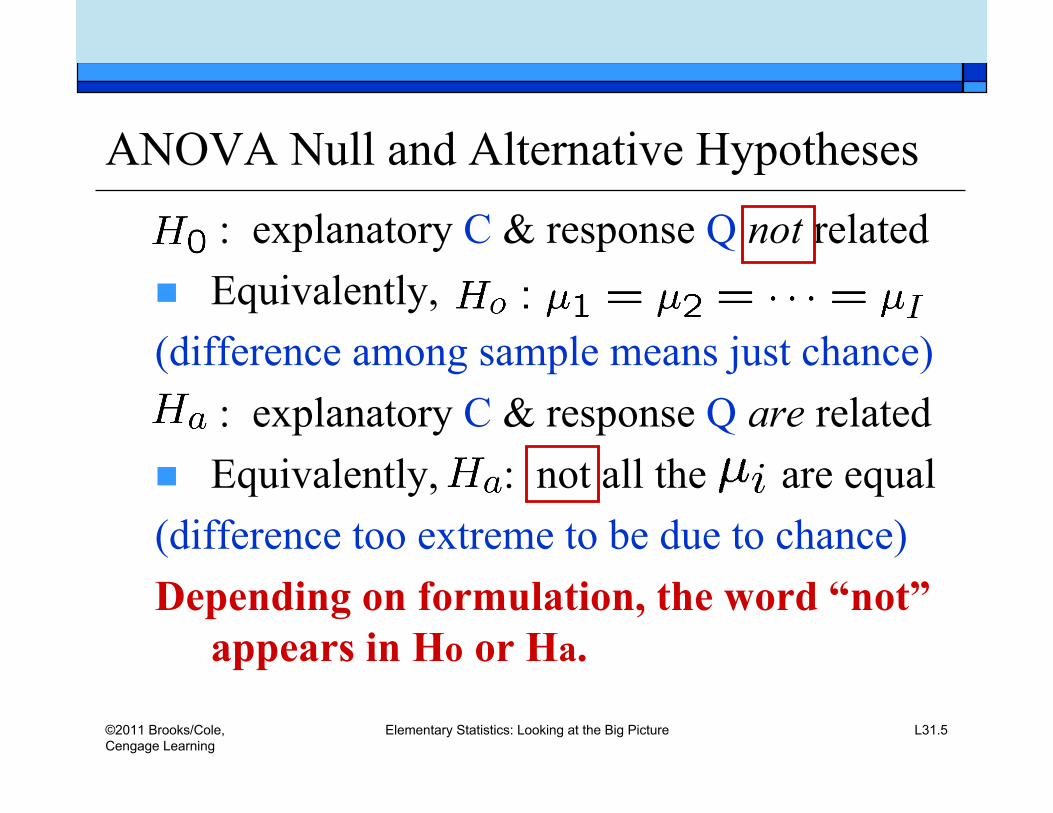
ANOVA Null and Alternative Hypotheses : explanatory C & response Q not related Equivalently,(difference among sample means just chance) : explanatory C & response Q are related Equivalently, : not all the are equal(difference too extreme to be due to chance)Depending on formulation, the word “not”
appears in Ho or Ha.
©2011 Brooks/Cole,Cengage Learning
Elementary Statistics: Looking at the Big Picture L31.7
Example: How to Refute a Claim about “All”
Background: Reader asked medical advicecolumnist: “Dear Doctor, does everyone withParkinson’s disease shake?” and doctor replied:All patients with Parkinson’s disease do not shake.
Question: Is this what the doctor meant to say? Response:

©2011 Brooks/Cole,Cengage Learning
Elementary Statistics: Looking at the Big Picture L31.9
Example: ANOVA Alternative Hypothesis Background: Null hypothesis to test for
relationship between race (3 groups) and earnings:
Question: Is this the correct alternative?
Response:
Words are better: say “_________________________”.
©2011 Brooks/Cole,Cengage Learning
Elementary Statistics: Looking at the Big Picture L31.10
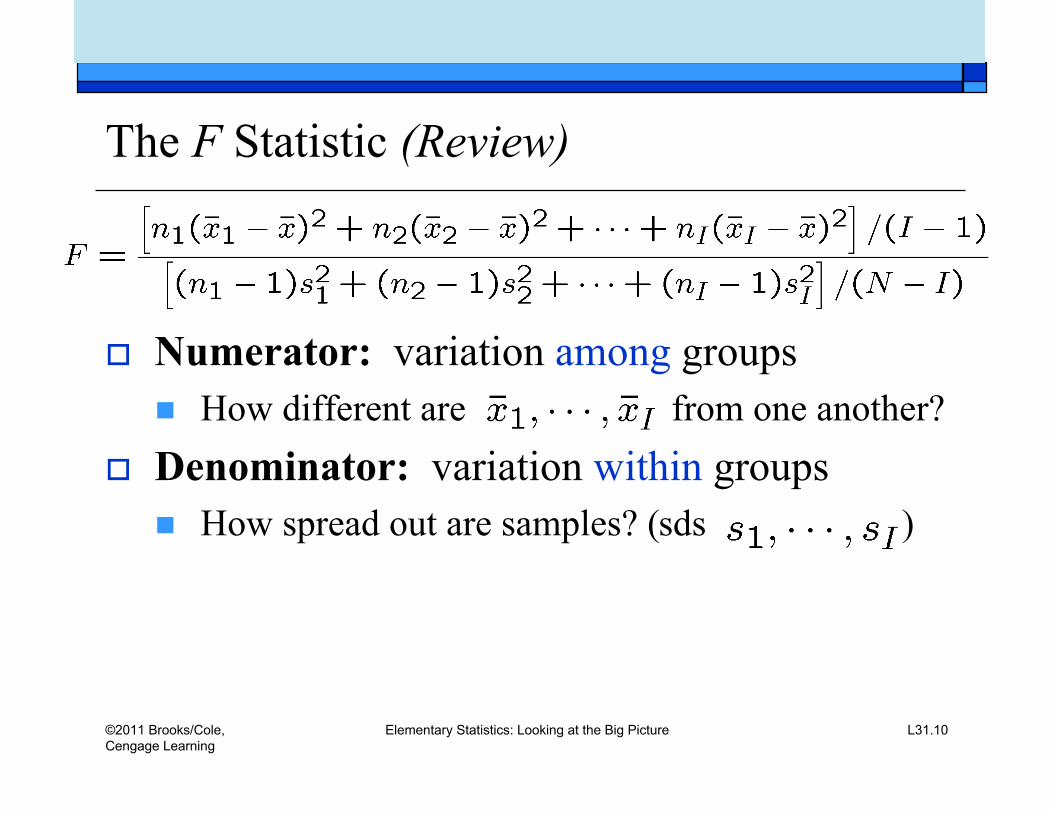
The F Statistic (Review)
Numerator: variation among groups How different are from one another?
Denominator: variation within groups How spread out are samples? (sds )
©2011 Brooks/Cole,Cengage Learning
Elementary Statistics: Looking at the Big Picture L31.11
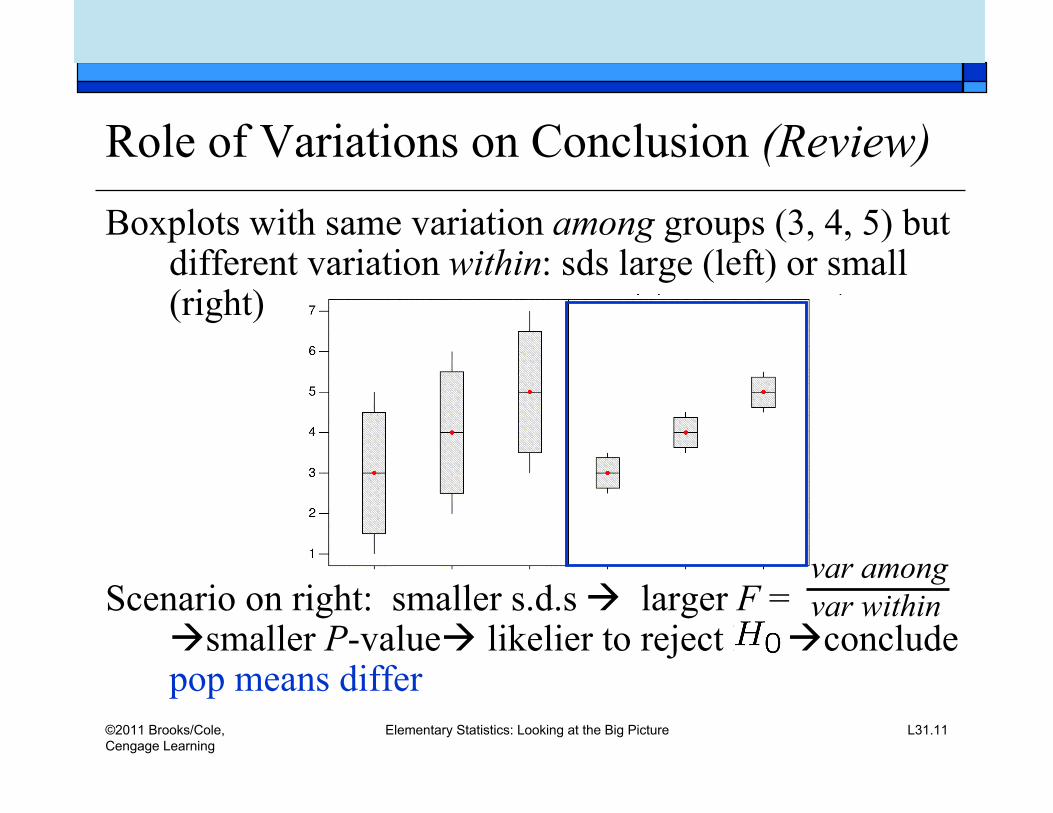
Role of Variations on Conclusion (Review)Boxplots with same variation among groups (3, 4, 5) but
different variation within: sds large (left) or small(right)
Scenario on right: smaller s.d.s larger F =smaller P-value likelier to reject Ho concludepop means differ
var amongvar within
©2011 Brooks/Cole,Cengage Learning
Elementary Statistics: Looking at the Big Picture L31.15
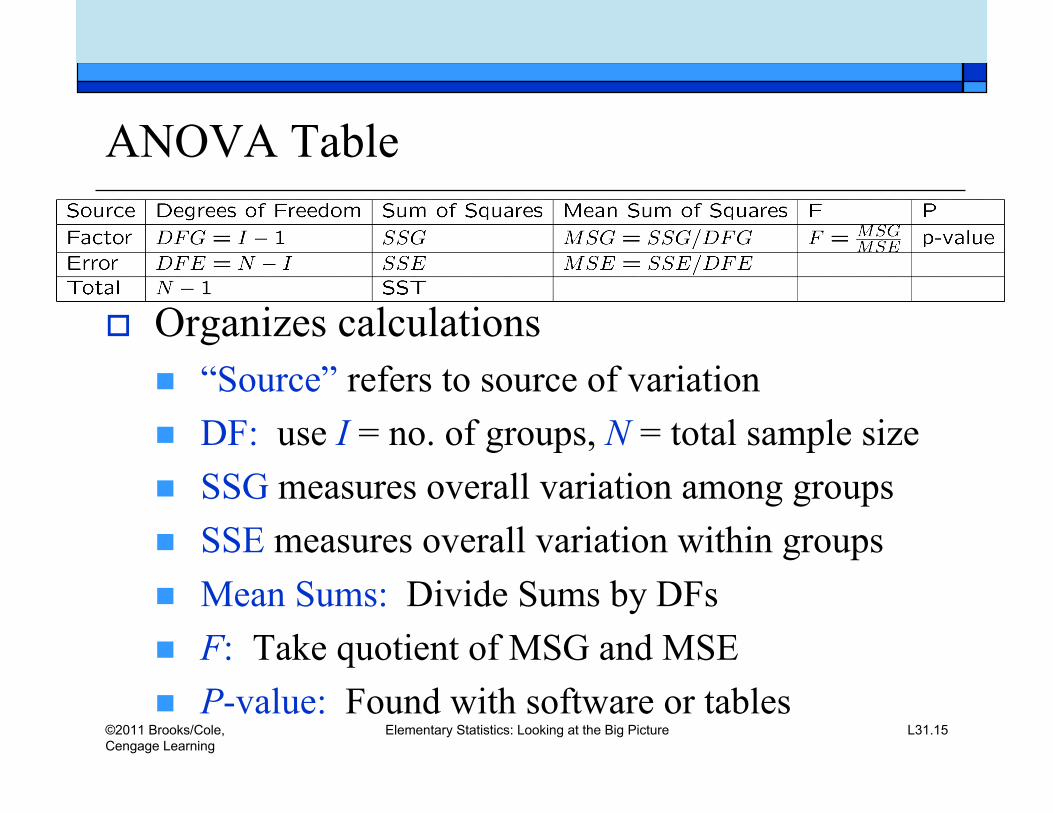
ANOVA Table
Organizes calculations “Source” refers to source of variation DF: use I = no. of groups, N = total sample size SSG measures overall variation among groups SSE measures overall variation within groups Mean Sums: Divide Sums by DFs F: Take quotient of MSG and MSE P-value: Found with software or tables
©2011 Brooks/Cole,Cengage Learning
Elementary Statistics: Looking at the Big Picture L31.16
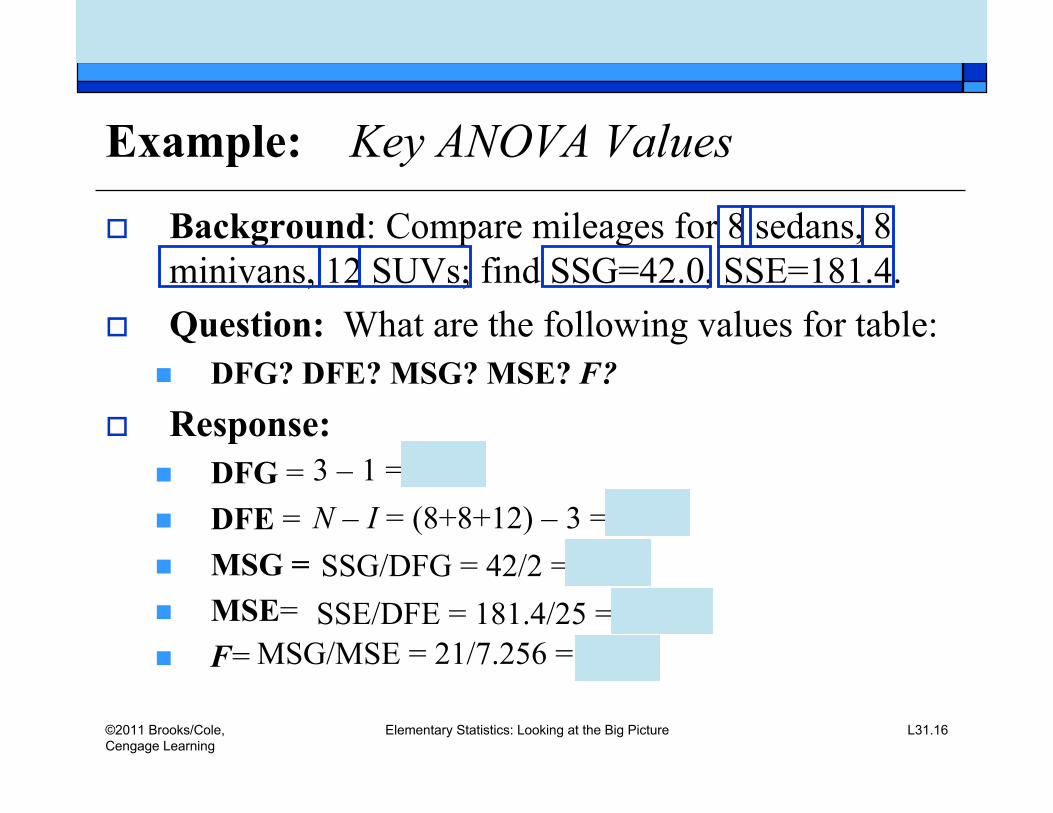
Example: Key ANOVA Values
Background: Compare mileages for 8 sedans, 8minivans, 12 SUVs; find SSG=42.0, SSE=181.4.
Question: What are the following values for table: DFG? DFE? MSG? MSE? F?
Response: DFG = DFE = MSG = MSE= F=
3 – 1 = 2N – I = (8+8+12) – 3 = 25SSG/DFG = 42/2 = 21SSE/DFE = 181.4/25 = 7.256
MSG/MSE = 21/7.256 = 2.89

©2011 Brooks/Cole,Cengage Learning
Elementary Statistics: Looking at the Big Picture L31.18
Example: Completing ANOVA Table
Background: Found these values for ANOVA: DFG=3-1= 2 DFE=N-I=(8+8+12)-3= 25 MSG=SSG/DFG=42/2= 21 MSE=SSE/DFE=181.4/25= 7.256 F=MSG/MSE=21/7.256= 2.89
Question: Complete ANOVA table? Response: SoftwareP-val=0.0743marginally significant
©2011 Brooks/Cole,Cengage Learning
Elementary Statistics: Looking at the Big Picture L31.20
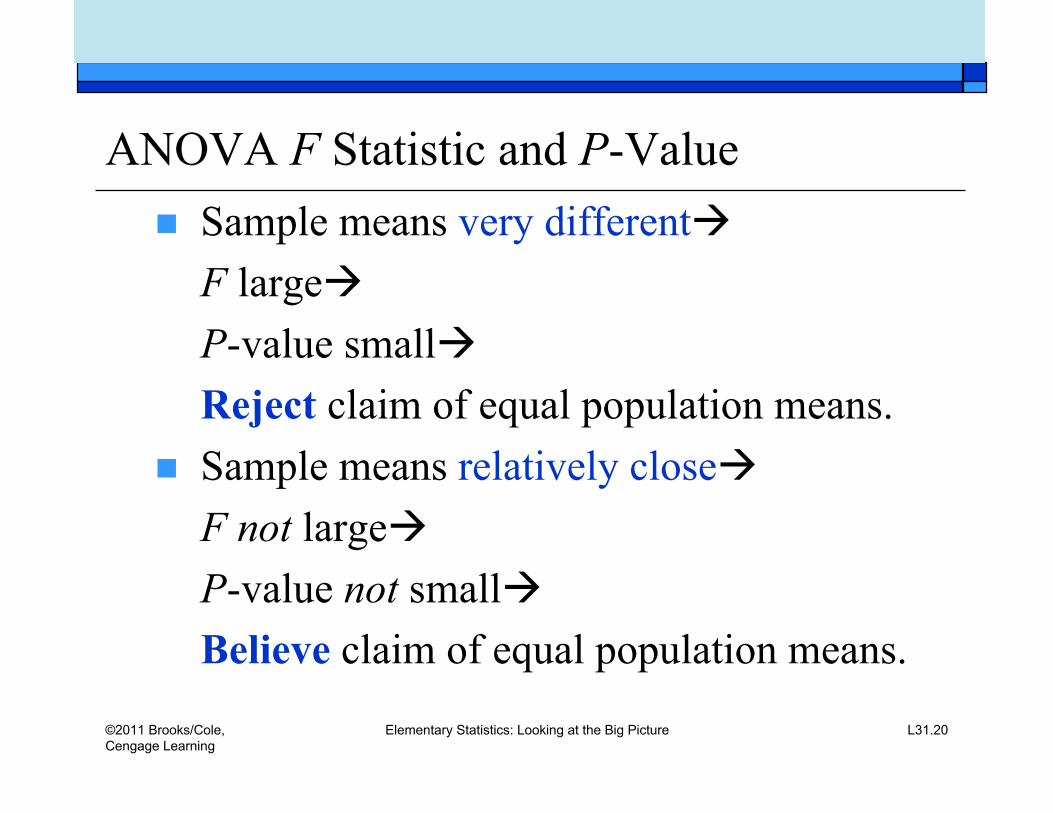
ANOVA F Statistic and P-Value Sample means very different
F largeP-value smallReject claim of equal population means.
Sample means relatively closeF not largeP-value not smallBelieve claim of equal population means.
©2011 Brooks/Cole,Cengage Learning
Elementary Statistics: Looking at the Big Picture L31.21
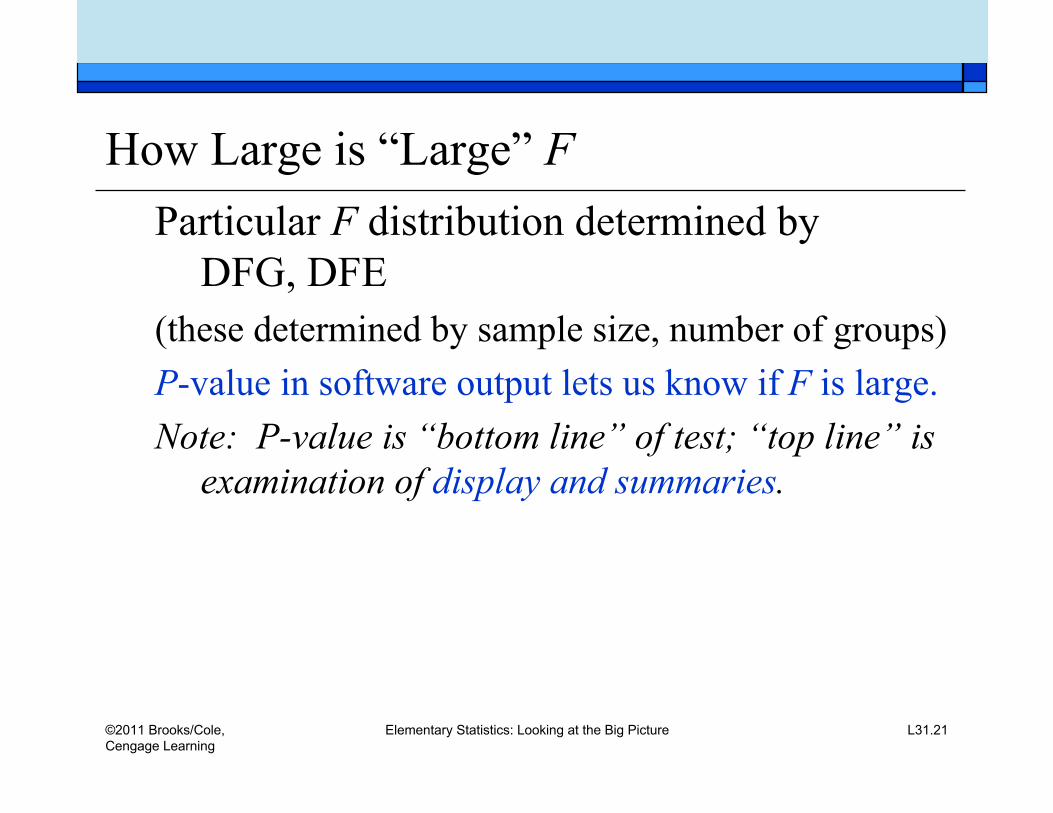
How Large is “Large” FParticular F distribution determined by
DFG, DFE(these determined by sample size, number of groups)P-value in software output lets us know if F is large.Note: P-value is “bottom line” of test; “top line” is
examination of display and summaries.

©2011 Brooks/Cole,Cengage Learning
Elementary Statistics: Looking at the Big Picture L31.23
Example: Examining Boxplots Background: For all students at a university, are Math
SATs related to what year they’re in?
Question: What do the boxplots suggest? Response: As year goes up, mean ______________
(Suggests ___________ students scored better in Math.)
©2011 Brooks/Cole,Cengage Learning
Elementary Statistics: Looking at the Big Picture L31.25
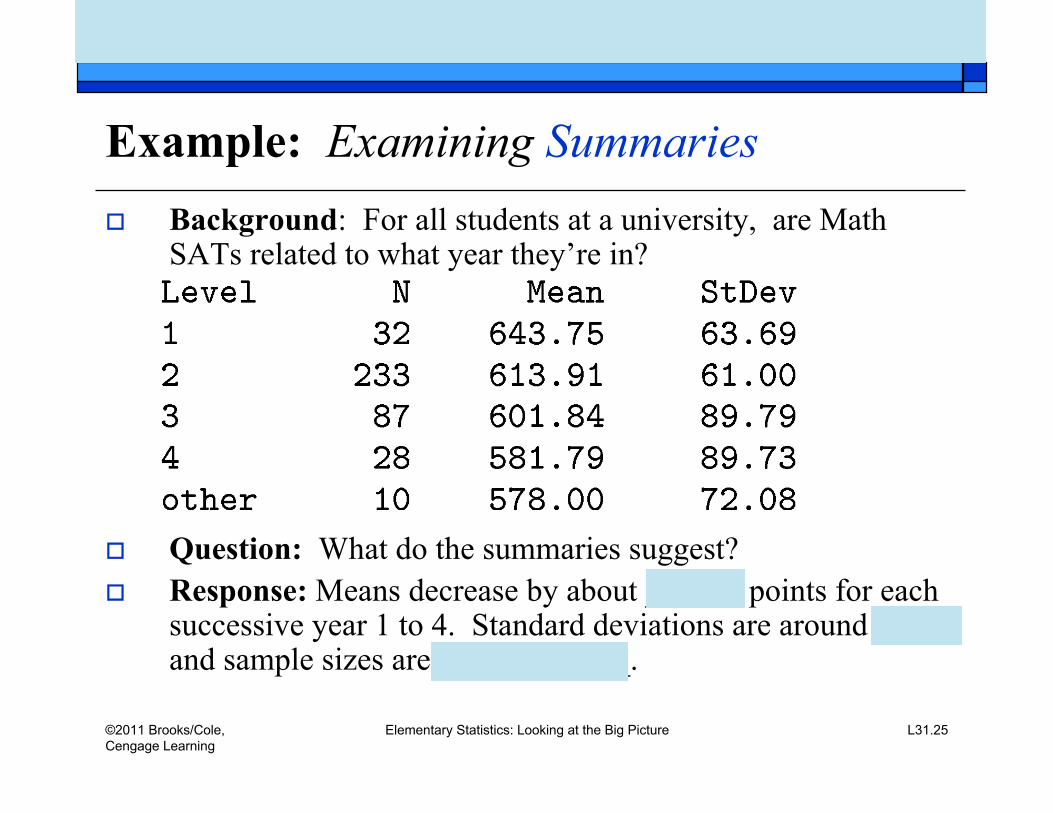
Example: Examining Summaries Background: For all students at a university, are Math
SATs related to what year they’re in?
Question: What do the summaries suggest? Response: Means decrease by about ______ points for each
successive year 1 to 4. Standard deviations are around ____,and sample sizes are ____________.

©2011 Brooks/Cole,Cengage Learning
Elementary Statistics: Looking at the Big Picture L31.27
Example: ANOVA Output
Background: For all students at a university, areMath SATs related to what year they’re in?
Question: What does the output suggest? Response: Test
P-value=0.004. Small? ____ Reject ? ________ Conclude all 5 population means may be equal?____Year and Math SAT related in population?____
©2011 Brooks/Cole,Cengage Learning
Elementary Statistics: Looking at the Big Picture L31.28
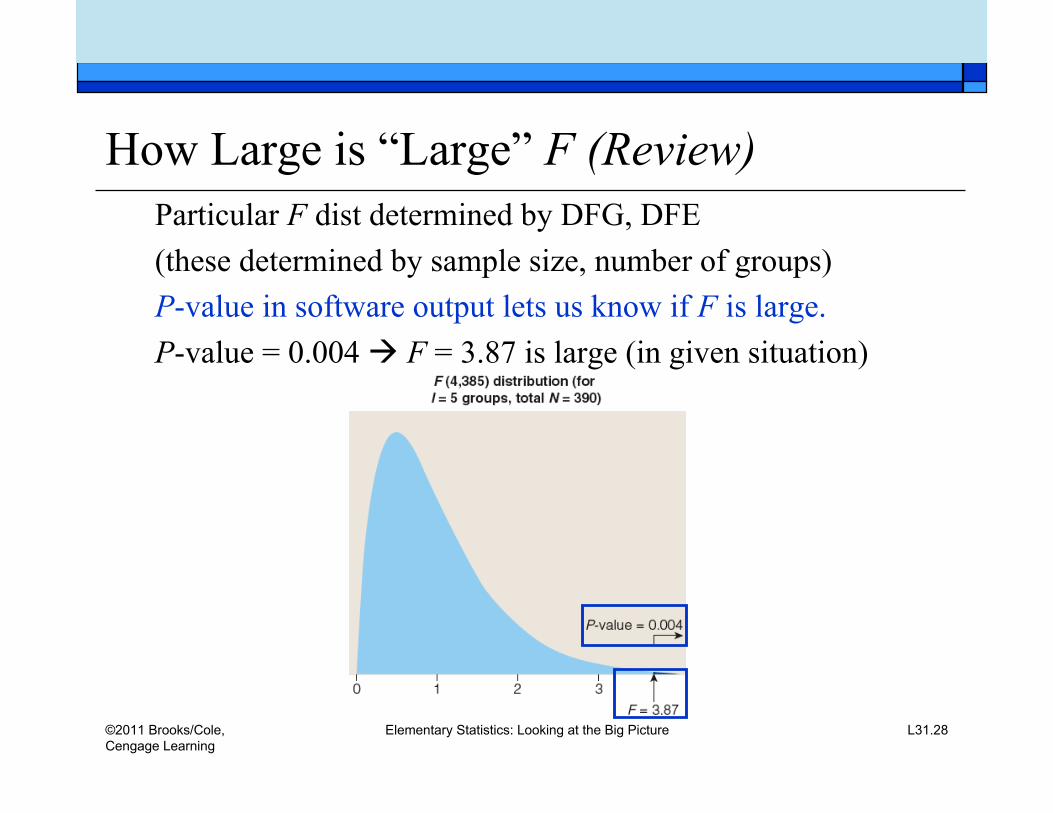
How Large is “Large” F (Review)Particular F dist determined by DFG, DFE(these determined by sample size, number of groups)P-value in software output lets us know if F is large.P-value = 0.004 F = 3.87 is large (in given situation)

©2011 Brooks/Cole,Cengage Learning
Elementary Statistics: Looking at the Big Picture L31.30
Example: ANOVA Output
Background: A test for a relationship betweenMath SAT and year of study, based on data from alarge sample of intro stats students at a university,produced a large F and a small P-value.
Question: What issues should be consideredbefore we use these results to draw conclusionsabout the relationship between year of study andMath SAT for all students at that university?
Response:
©2011 Brooks/Cole,Cengage Learning
Elementary Statistics: Looking at the Big Picture L31.31
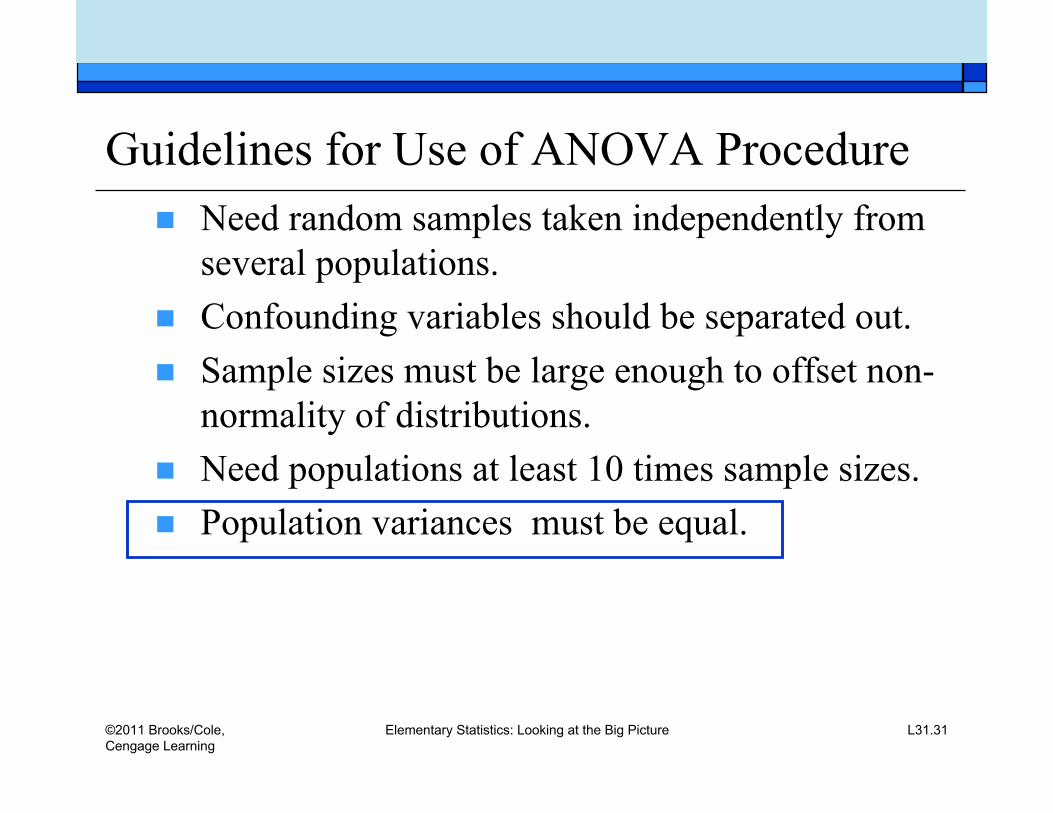
Guidelines for Use of ANOVA Procedure Need random samples taken independently from
several populations. Confounding variables should be separated out. Sample sizes must be large enough to offset non-
normality of distributions. Need populations at least 10 times sample sizes. Population variances must be equal.
©2011 Brooks/Cole,Cengage Learning
Elementary Statistics: Looking at the Big Picture L31.32
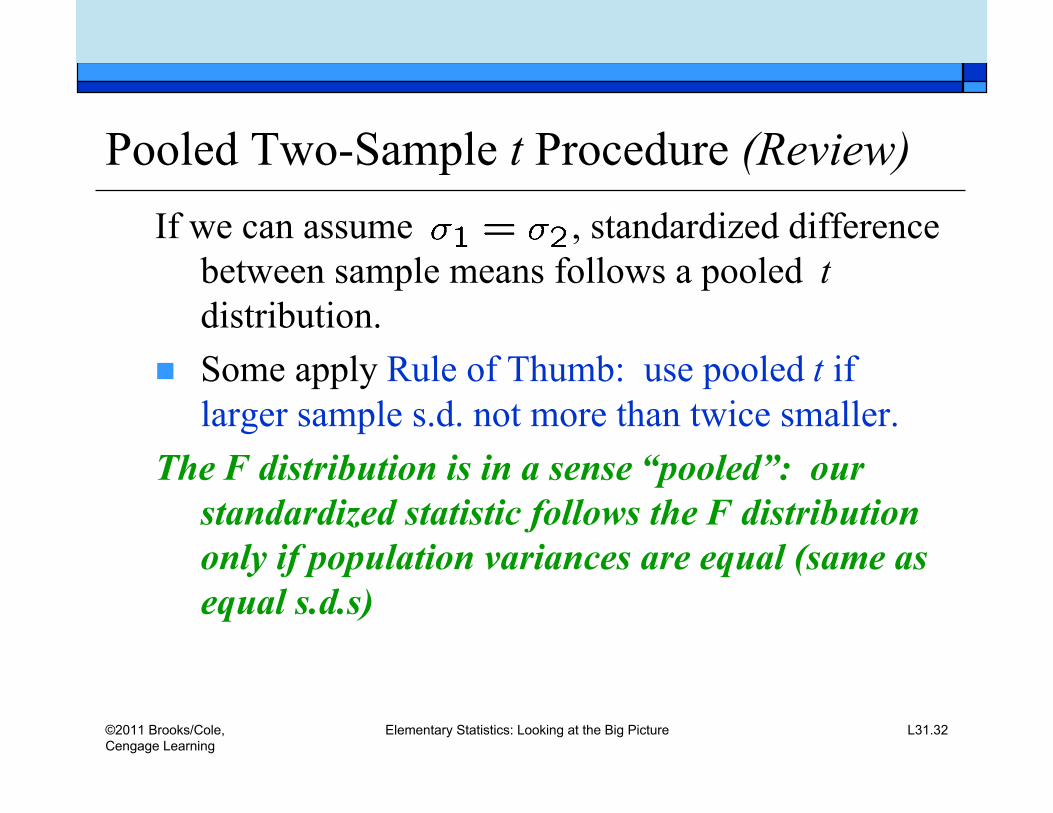
Pooled Two-Sample t Procedure (Review)If we can assume , standardized difference
between sample means follows a pooled tdistribution.
Some apply Rule of Thumb: use pooled t iflarger sample s.d. not more than twice smaller.
The F distribution is in a sense “pooled”: ourstandardized statistic follows the F distributiononly if population variances are equal (same asequal s.d.s)
©2011 Brooks/Cole,Cengage Learning
Elementary Statistics: Looking at the Big Picture L31.34
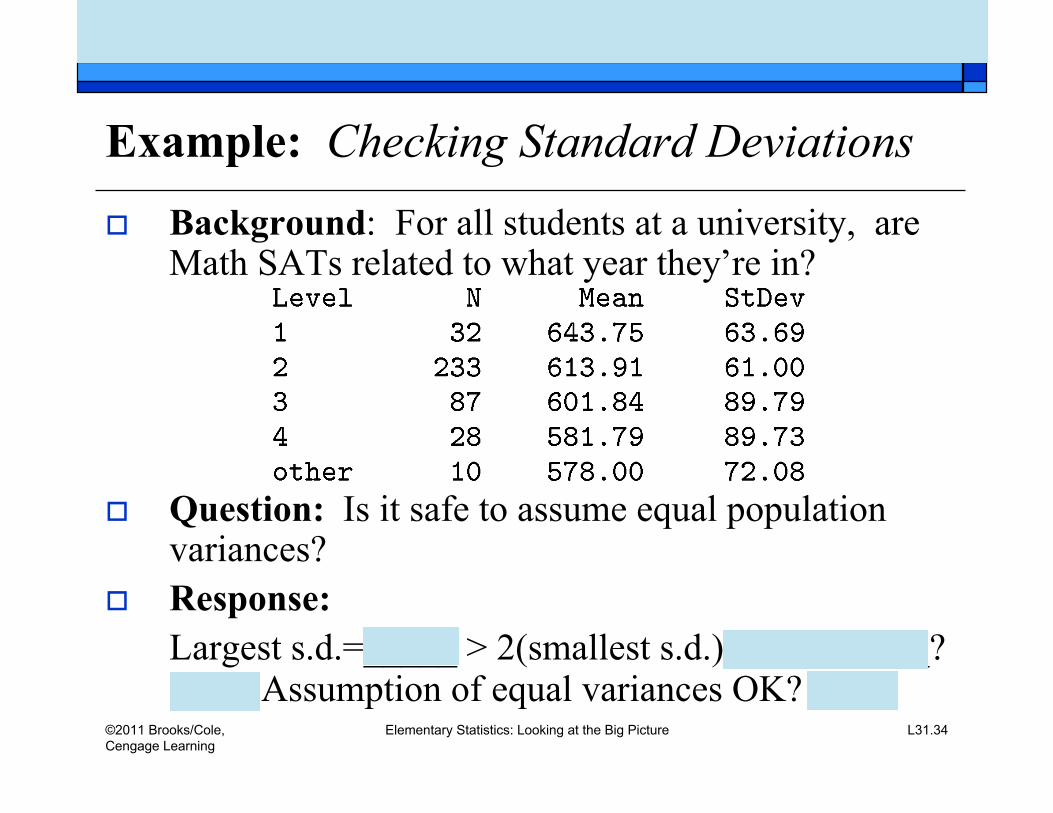
Example: Checking Standard Deviations Background: For all students at a university, are
Math SATs related to what year they’re in?
Question: Is it safe to assume equal populationvariances?
Response:Largest s.d.=_____ > 2(smallest s.d.)___________?____ Assumption of equal variances OK? ____
©2011 Brooks/Cole,Cengage Learning
Elementary Statistics: Looking at the Big Picture L31.36
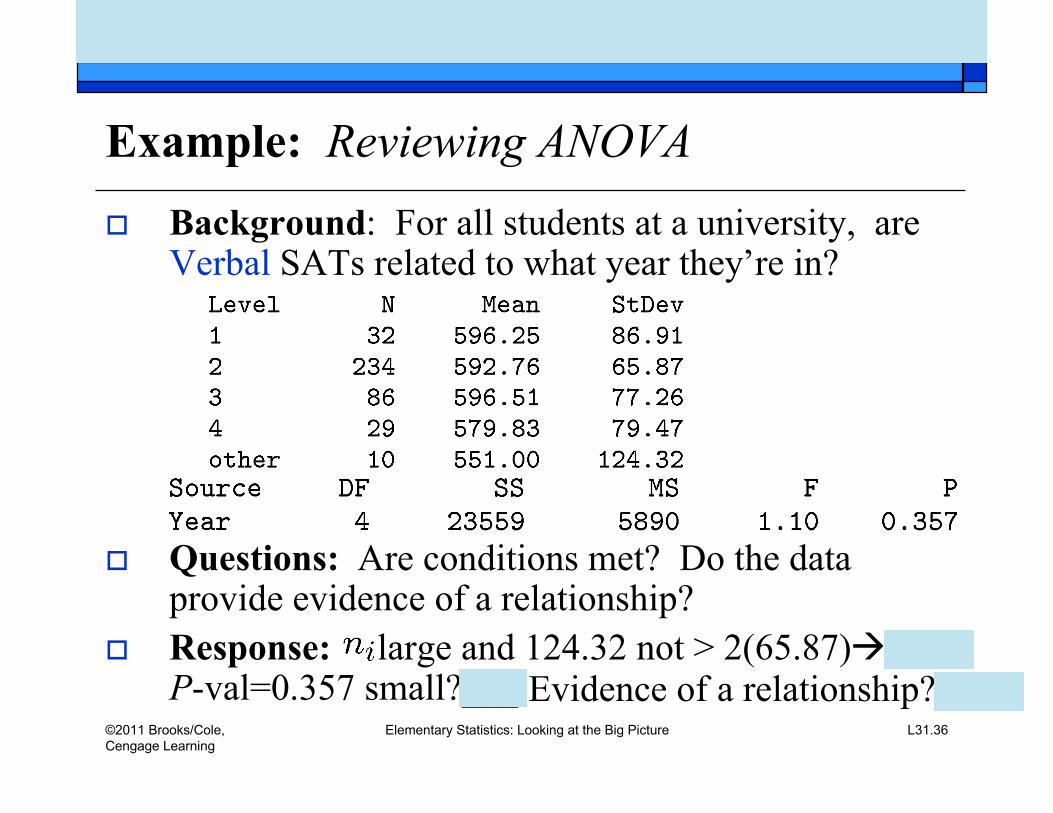
Example: Reviewing ANOVA Background: For all students at a university, are
Verbal SATs related to what year they’re in?
Questions: Are conditions met? Do the dataprovide evidence of a relationship?
Response: large and 124.32 not > 2(65.87)___P-val=0.357 small?___ Evidence of a relationship?___
©2011 Brooks/Cole,Cengage Learning
Elementary Statistics: Looking at the Big Picture L31.37
Guidelines for Use of ANOVA (Review) Need random samples taken independently from
several populations Confounding variables should be separated out Sample sizes must be large enough to offset non-
normality of distributions Need populations at least 10 times sample sizes Population variances must be equal.

©2011 Brooks/Cole,Cengage Learning
Elementary Statistics: Looking at the Big Picture L31.39
Example: Considering Data Production Background: F test found evidence of relationship between
Math SAT and year (P-value 0.004), but not Verbal SATand year (P-value 0.357).
Question: Keeping in mind that the sample consisted ofstudents in various years taking an introductory statisticsclass, are there concerns about bias/confounding variables?
Response: For Math, ____. For Verbal, ____

©2011 Brooks/Cole,Cengage Learning
Elementary Statistics: Looking at the Big Picture L31.40
Lecture Summary(Inference for CatQuan; More About ANOVA)
ANOVA for several-sample inference Formulating hypotheses correctly ANOVA table F statistic and P-value
1st step in practice: displays and summaries Side-by-side boxplots Compare means, look at sds and sample sizes
ANOVA output Guidelines for use of ANOVA