lecture 7 emg eeg 2013 handouts - the psychophysiology...
TRANSCRIPT

3/4/2013
1
Just a bit more EMG…and then…
The Electroencephalogram
Announcements 3/4/13
Electricity test – Everyone has now passed!
Papers: 1 or 2 paragraph prospectus due no later than Monday March 25
Lab Updates
3x5 time
Lab Updates
EKG-EMG lab (will cover during lecture)
Lab Updates
SCR GKT labShould ignore first response in series and score
remainder
How to make dichotomous verdict of guilty?Lykken’s scoring
Binomial Probability
Lykken MethodBinomial Probability
# with Max Response (N)
Probability of exactly N
Probability of N or fewer
Probability of N or More
0 0.17 0.17 1.00
1 0.34 0.50 0.83
2 0.29 0.80 0.50
3 0.15 0.94 0.20
4 0.05 0.99 0.06
5 0.01 1.00 0.01
6 0.00 1.00 0.00
7 0.00 1.00 0.00
8 0.00 1.00 0.00
Many Options… Excel: BINOM.DIST function R: binom.test function Matlab: binocdf function SPSS: Nonparametric tests, Legacy Dialogs, Binomial

3/4/2013
2
Returning to EMG….
EMG Power
Signal Recording (cont’) Amplification Differential amplifiers with common mode rejection Actually double differential (ground)
Amplify voltages 1000-20000 times May use on-line filter Should pass 10-500 Hz
Digitization (more in next lecture) Fast, very fast Or, slower, following on-line signal processing
Signal Transformations
Lab Updates
EKG-EMG labEKG – done in QRSTool and CMetX
EMGStep 1 in Neuroscan Edit
Filter and Rectify signals
Step 2 in MatlabGet mean for each condition
Convert to within-subject z-scores
A few Applications
Startle Probe
Subtle affectMere Exposure
Subliminal effects
Mortality Salience
Biofeedback of EEG -- outcome measure
Emotion Regulation – outcome measure
Empathy – individual difference measure
3/4/2013
3
A few Applications
Startle Probe
Subtle affectMere Exposure
Subliminal effects
Mortality Salience
Biofeedback of EEG -- outcome measure
Emotion Regulation – outcome measure
Empathy – individual difference measure
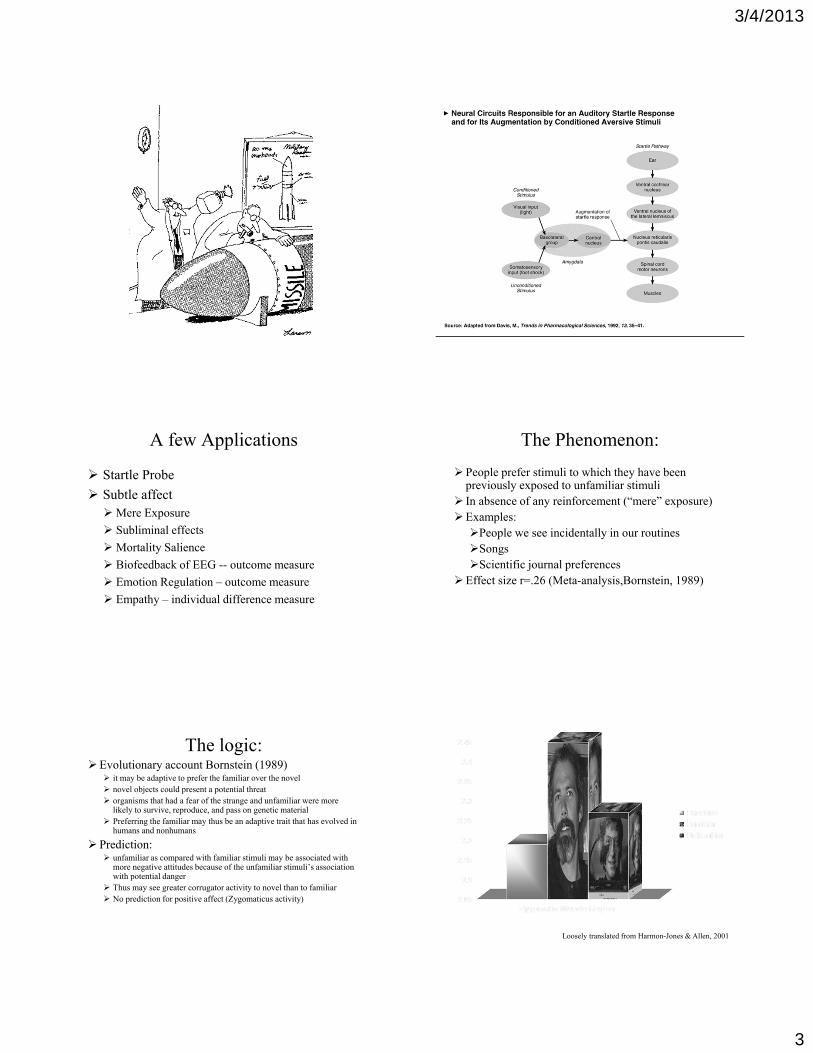
The Phenomenon:
People prefer stimuli to which they have been previously exposed to unfamiliar stimuli
In absence of any reinforcement (“mere” exposure)Examples:People we see incidentally in our routinesSongsScientific journal preferences
Effect size r=.26 (Meta-analysis,Bornstein, 1989)
The logic:Evolutionary account Bornstein (1989)
it may be adaptive to prefer the familiar over the novel novel objects could present a potential threat organisms that had a fear of the strange and unfamiliar were more
likely to survive, reproduce, and pass on genetic material Preferring the familiar may thus be an adaptive trait that has evolved in
humans and nonhumans
Prediction: unfamiliar as compared with familiar stimuli may be associated with
more negative attitudes because of the unfamiliar stimuli’s association with potential danger
Thus may see greater corrugator activity to novel than to familiar No prediction for positive affect (Zygomaticus activity)
Loosely translated from Harmon-Jones & Allen, 2001

3/4/2013
4
A few Applications
Startle Probe
Subtle affectMere Exposure
Subliminal effects
Mortality Salience
Biofeedback of EEG -- outcome measure
Emotion Regulation – outcome measure
Empathy – individual difference measure
Dimberg, U., Thunberg, M., & Elmehed, K. (2000). Unconscious facial reactions to emotional facial expressions. Psychological Science, 11, 86-89.
Dimberg et al Psychological Science 2000
30 ms 5 ms
Dimberg, U., Thunberg, M., & Elmehed, K. (2000). Unconscious facial reactions to emotional facial expressions. Psychological Science, 11, 86-89.
Dimberg et al Psychological Science 2000
A few Applications
Startle Probe
Subtle affectMere Exposure
Subliminal effects
Mortality Salience
Biofeedback of EEG -- outcome measure
Emotion Regulation – outcome measure
Empathy – individual difference measure -0.5
0
0.5
1
1.5
2
2.5
Corrugator (Z scores)
Dead
Pain
Another loose translation: Arndt, J., Allen, J.J.B., & Greenberg, J. (2001). Traces of terror: Subliminal death primes and facial electromyographic indices of affect. Motivation and Emotion, 25, 253-277.

3/4/2013
5
A few Applications
Startle Probe
Subtle affectMere Exposure
Subliminal effects
Mortality Salience
Biofeedback of EEG -- outcome measure
Emotion Regulation – outcome measure
Empathy – individual difference measure
From Allen, Harmon-Jones, and Cavender (2001)Allen, Cavender, Harmon-Jones, Psychophysiology 2001
A few Applications
Startle Probe
Subtle affectMere Exposure
Subliminal effects
Mortality Salience
Biofeedback of EEG -- outcome measure
Emotion Regulation – outcome measure
Empathy – individual difference measure
Ray, McRae, Ochsner, & Gross, Emotion, 2010
Ray, McRae, Ochsner, & Gross, Emotion, 2010
A few Applications
Startle Probe
Subtle affectMere Exposure
Subliminal effects
Mortality Salience
Biofeedback of EEG -- outcome measure
Emotion Regulation – outcome measure
Empathy – individual difference measure

3/4/2013
6
Dimberg & Thunberg (2012) PsyCh Journal
The Electroencephalogram
Basics in Recording EEG, Frequency Domain Analysis and its Applications
Electroencephalogram (EEG)
The EEG--an oscillating voltage recorded on scalp surface Reflects Large # Neurons
Is small voltage
Bands of activity and behavioral correlates Gamma 30-50 Hz
Beta 13-30 Hz
Alpha 8-13 Hz
Theta 4-8 Hz
Delta 0.5-4 Hz
Delta 1-4 Hz
Theta 4-7 Hz
Alpha 8-13 Hz
Beta 13-30 Hz
Gamma 30-50 Hz
EMG 70-150 Hz
Utility of EEG
Relatively noninvasive
Excellent time resolution
Sources of scalp potentials
Glial Cells – minimal, some DC steady potentials
Neurons Action Potentials – NO, brain tissue has strong
capacitance effects, acting as Low Pass filter
Slow waves Synaptic potentials – YES, both IPSPs and EPSPs from
functional synaptic units are major contributors
Afterpotentials – May contribute to a lesser extent

3/4/2013
7
Alpha and Synchronization
Why Alpha? It is obvious and hard to miss! Accounts for ~70% of EEG activity in adult human brain
From where, Alpha? Historically, thought to be thalamocortial looping Adrian (1935) demolished that theory
Recorded EEG simultaneously in cortex and thalamus Damage to cortex did not disrupt thalamic alpha rhythmicity Damage to thalamus DID disrupt cortical alpha rhythmicity
Thalamic rhythmicity remains even in decorticate preparations (Adrian, 1941)
Removal of ½ thalamus results in ipsilateral loss of cortical alpha
Next
Alpha and Synchronization
Andersen and Andersen (1968) Cooling of Cortex resulted in change in amplitude but not
frequency of Alpha
Alpha and Synchronization
Andersen and Andersen (1968) Cooling of Thalamus resulted in change in amplitude and
frequency of Alpha at both thalamus and cortex

3/4/2013
8
Alpha and Synchronization
In sum, Thalamus drives the alpha rhythmicity of the EEG Cortex certainly does feedback to thalamus, but thalamus is
responsible for driving the EEG
Particularly the Reticularis nucleus (Steriade et al. 1985)
What causes change from rhythmicity to desynchronization? Afferent input to thalamic relay nuclei
Mode-specific enhancement observed
Recording EEG
Recording EEG
Systems are surface-based, not anatomically-based
3/4/2013
9
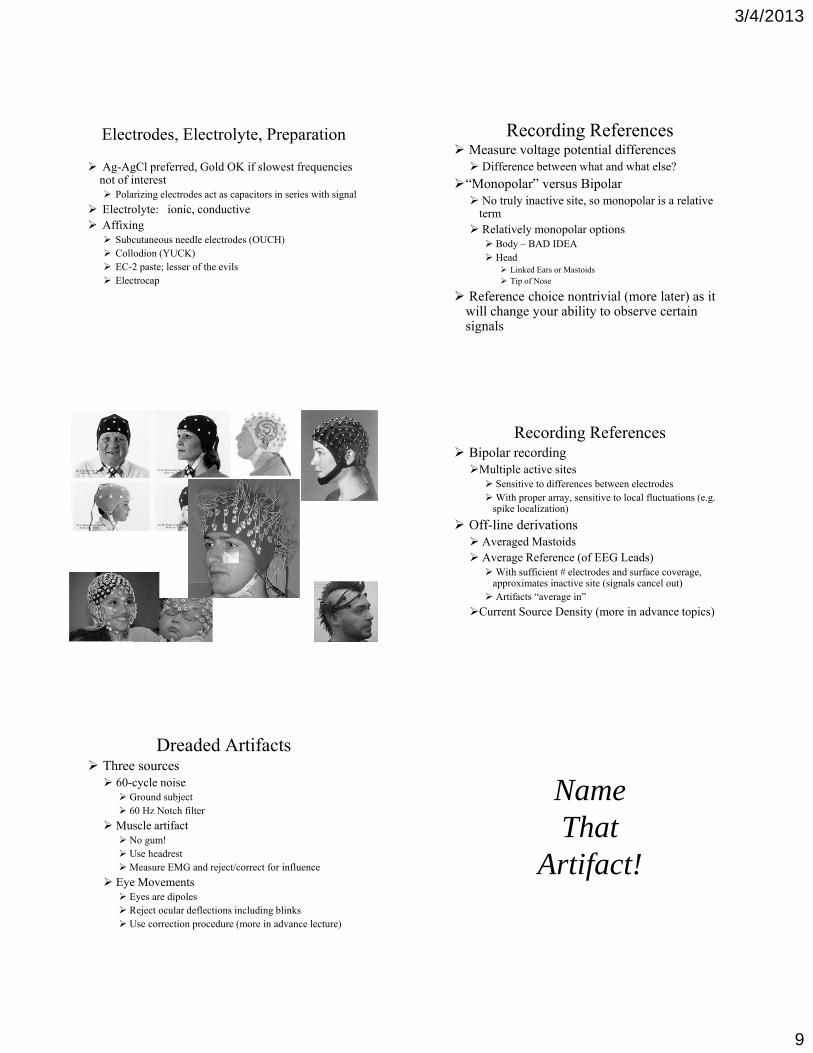
Electrodes, Electrolyte, Preparation
Ag-AgCl preferred, Gold OK if slowest frequencies not of interest Polarizing electrodes act as capacitors in series with signal
Electrolyte: ionic, conductive Affixing Subcutaneous needle electrodes (OUCH) Collodion (YUCK) EC-2 paste; lesser of the evils Electrocap
Recording References Measure voltage potential differences Difference between what and what else?
“Monopolar” versus Bipolar No truly inactive site, so monopolar is a relative
term Relatively monopolar options Body – BAD IDEA Head
Linked Ears or Mastoids Tip of Nose
Reference choice nontrivial (more later) as it will change your ability to observe certain signals
Recording References Bipolar recording Multiple active sites Sensitive to differences between electrodesWith proper array, sensitive to local fluctuations (e.g.
spike localization)
Off-line derivations Averaged Mastoids Average Reference (of EEG Leads)With sufficient # electrodes and surface coverage,
approximates inactive site (signals cancel out) Artifacts “average in”
Current Source Density (more in advance topics)
Dreaded Artifacts Three sources 60-cycle noise Ground subject 60 Hz Notch filter
Muscle artifact No gum! Use headrestMeasure EMG and reject/correct for influence
Eye Movements Eyes are dipoles Reject ocular deflections including blinks Use correction procedure (more in advance lecture)
NameThat
Artifact!

3/4/2013
10
movement in the reference lead
Chewing!
Vertical Eye Roll Muscle Burst
Smiling!Talking and
Moving Head

3/4/2013
11
YaaaawwwwnnnnEye Closure
and reopening
Blink and Triple Blink
AC Signal Recording Options
Time Constant/HP filter Low frequency cutoff is related to TC by:
Where F = frequency in Hz, TC = Time Constant in Seconds
Applying formula:Time Constant (sec) Frequency (Hz)
10.00 .0165.00 .0321.00 .159.30 .531.10 1.592.01 15.915

3/4/2013
12
Hi Frequency/LP Settings Do not eliminate
frequencies of interest
Polygraphs have broad roll-off characteristics
Be mindful of digitization rate (more info soon!)
Digital Signal Acquisition
Analog Vs Digital Signals Analog Continuously varying voltage as fxn of time
Discrete Time Discrete points on time axis, but full range in amplitude
Digital Discrete time points on x axis represented as a limited
range of values (usally 2x, e.g 212 = 4096)
A/D converters Schmidt Trigger as simple example The A/D converter (Schematic diagram)
Multiplexing (several channels); A/D converter is serial processor Result is a vector [1 x n samples] of digital values for each channel (
[x(t0), x(t1), x(t2),...,x(tn-1)]
12 bit converters allow 212 = 4096 values 16 bit converters allow 216 = 65536 values
12 bit is adequate for EEG 4096 values allow 1 value for each ~0.02 μvolts of scalp voltage
(depending upon sensitivity of amplifier, which will amplify signal ~20,000 times before polygraph output)
e.g., 2.1130 μvolts => 2481 D.U.'s (2480.74) 2.1131 μ volts => 2481 D.U.'s (2480.76) 2.1250 μ volts => 2483 D.U.'s (2483.20)
The Problem of Aliasing Definition To properly represent a signal, you must sample at a
fast enough rate.Nyquist’s (1928) theorem a sample rate twice as fast as the highest signal frequency will capture that signal perfectlyStated differently, the highest frequency which can be accurately represented is one-half of the sampling rateThis frequency has come to be known as the Nyquist frequency and equals ½ the sampling rate
CommentsWave itself looks distorted, but frequency is captured
adequately. Frequencies faster than the Nyquist frequency will
not be adequately representedMinimum sampling rate required for a given
frequency signal is known as Nyquist sampling rate Harry Nyquist
Aliasing and the Nyquist Frequency
In fact, frequencies above Nyquist frequency represented as frequencies lower than Nyquist frequency FNy + x Hz will be seen as FNy - x Hz
“folding back”frequency 2FNy seen as 0,
frequency 3FNy will be seen as FNy
accordion-like folding of frequency axis