lecture by prof s s murthy 19th feb - silicon institute of...
TRANSCRIPT

WIND ENERGY SYSTEMS (WES)
FOR POWER GENERATION
Lecture By
Prof S S Murthy
19th Feb.2015
Silicon Institute of Technology,
Bhubaneswar
National Workshop on
Emerging Technologies in Electrical Engineering,
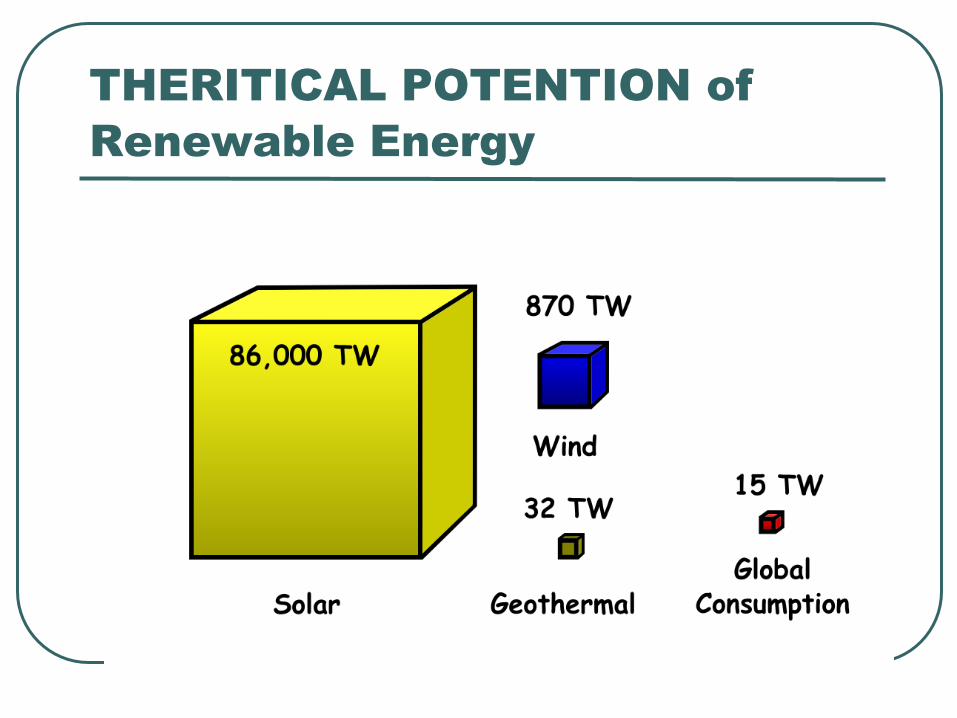
THERITICAL POTENTION of
Renewable Energy

RENEWABLES
ARE SOMETIMES DESCRIBED AS
• THE “DREAMS OF THE 1970S,
• REALITIES BUT LUXURIES OF 2000,
• AND THE NECESSITIES OF 2020 AND THEREAFTER”
INCLUDE HYDROPOWER, BIOMASS, SOLAR, WIND, GEOTHERMAL AND OCEAN RESOURCES

RENEWABLE POWER CAPACITIES(GW) IN WORLD ,
EU -27, BRICS, AND TOP SIX COUNTRIES , 2012

ALL INDIA GENERATING INSTALLED CAPACITY (MW)
(As on 31-12-14 )
(source: CEA)


GE – Wind Energy
1.5 MW Turbine
WIND ENERGY
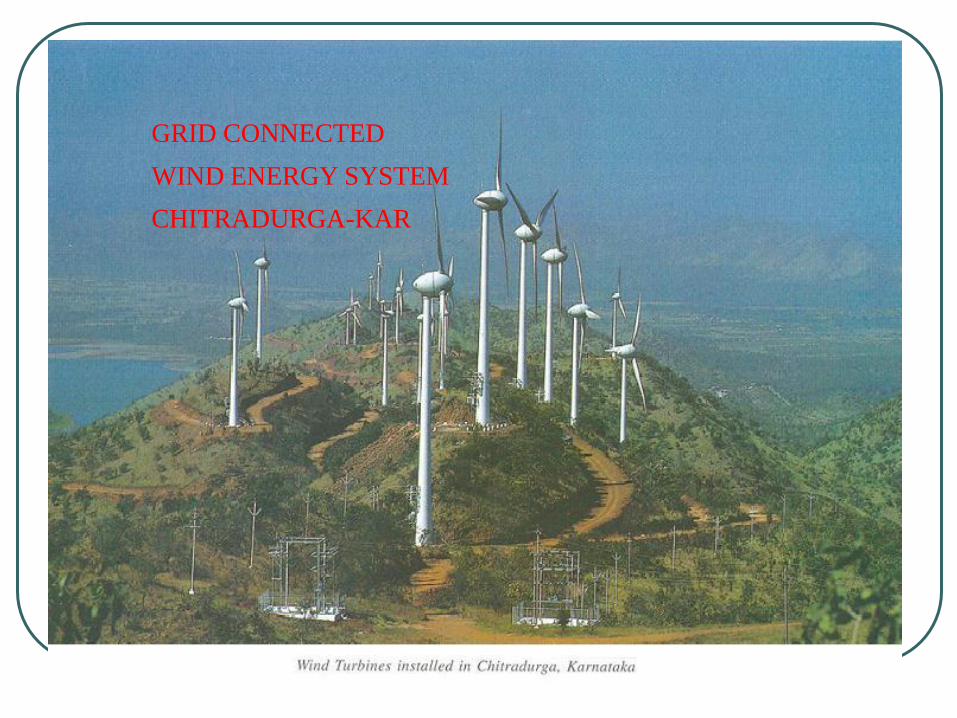
GRID CONNECTED
WIND ENERGY SYSTEM
CHITRADURGA-KAR

Global cumulative growth of wind power capacity

Global investment to 2050 (USD billion)

Progress in wind power since
2008
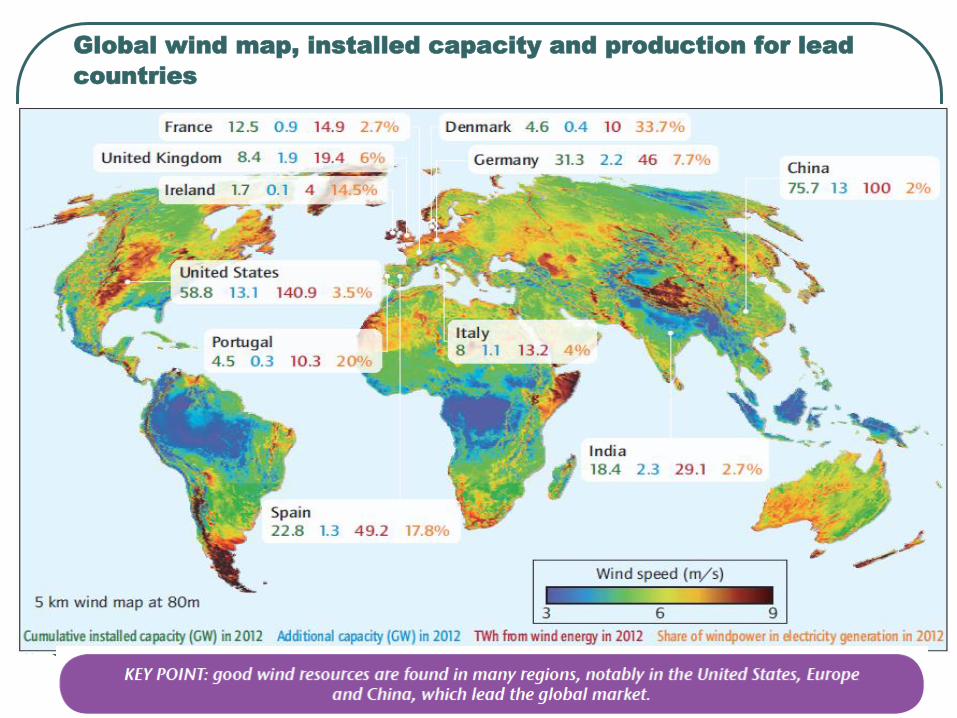
Global wind map, installed capacity and production for lead
countries

Wind generation is significant
In 2010 alone, new global wind power
installations equaled the capacity of 66
large conventional power plants.

World Wind Energy Scenario
TECHNICAL POTENTIAL OF ONSHORE WIND ENERGY IS
ABOUT 20000 TO 50000 TWH PER YEAR AGAINST THE
TOTAL WORLD ELECTRICITY CONSUMPTION OF 15000
TWH
ECONOMIC POTENTIAL DEPENDS ON FACTORS LIKE
AVERAGE WIND SPEED, STATISTICAL WIND SPEED
DISTRIBUTION, TURBULENCE INTENSITIES AND COSTS
OF WIND TURBINE SYSTEMS

WORLD WIND ENERGY
SCENARIO
AS ENERGY OF WIND IS PROPORTIONAL TO THIRD POWER OF WIND SPEED, ECONOMIC CALCULATIONS ARE SENSITIVE TO LOCAL AVERAGE WIND SPEED
BECAUSE THE WIND ENERGY IS INTERMITTENT, WIND TURBINES MAINLY DELIVER ENERGY BUT VERY LITTLE CAPACITY.
TYPICAL CAPACITY VALUES BEING OFTEN LESS THAN 20% OF INSTALLED WIND POWER

WINDIEST REGIONS, POTENTIAL
COASTAL REGIONS OF AMERICAS, EUROPE, ASIA, AUSTRALIASIA
TOTAL RESOURCE IS VAST- ONE ESTIMATE PUTS IT AS A MILLION GW
Even if only1% of area used with a low load factor of 15-40%, wind potential correspond to total capacity of all elec. Generating plants
Offshore resource HUGE- capable of supplying all EU electricity without going further than 30km offshore.

World Wind Energy Scenario
AS THE PENETRATION OF WIND TURBINES INCREASES THE PERCENTAGE FALLS FURTHER, REQUIRING EVEN MORE BACK UP POWER FOR A RELIABLE ENERGY SUPPLY
IT IS POSSIBLE TO TRANSFORM WIND-GENERATED ELECTRICITY FROM INTERMITTENT TO BASE LOAD POWER IF IT IS COMBINED WITH COMPRESSED AIR ENERGY STORAGE. THUS A HIGHER CAPACITY FACTOR CAN BE ACHIEVED WITH SMALL ECONOMIC PENALTY

World Wind Energy Scenario
BY OPTIMIZING THE TURBINE CHARACTERISTICS TO THE LOCAL WIND REGIME, CAPACITY FACTOR CURRENTLY OFTEN AT 20-25% CAN BE OPTIMIZED WITHOUT LOOSING TOO MUCH ENERGY OUTPUT.
HOWEVER EXTREME CAPACITY FACTORS OF ABOUT 40% AUTOMATICALLY MEAN A LARGE LOSS OF POTENTIAL ENERGY OUTPUT
World Wind Energy Scenario
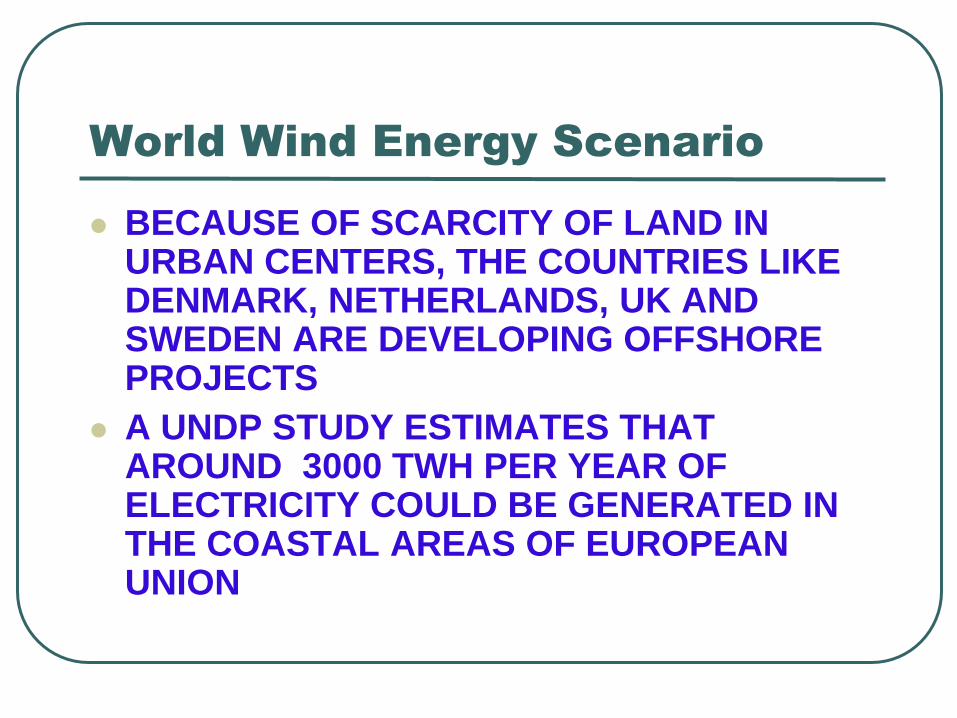
BECAUSE OF SCARCITY OF LAND IN URBAN CENTERS, THE COUNTRIES LIKE DENMARK, NETHERLANDS, UK AND SWEDEN ARE DEVELOPING OFFSHORE PROJECTS
A UNDP STUDY ESTIMATES THAT AROUND 3000 TWH PER YEAR OF ELECTRICITY COULD BE GENERATED IN THE COASTAL AREAS OF EUROPEAN UNION

World Wind Energy Scenario:
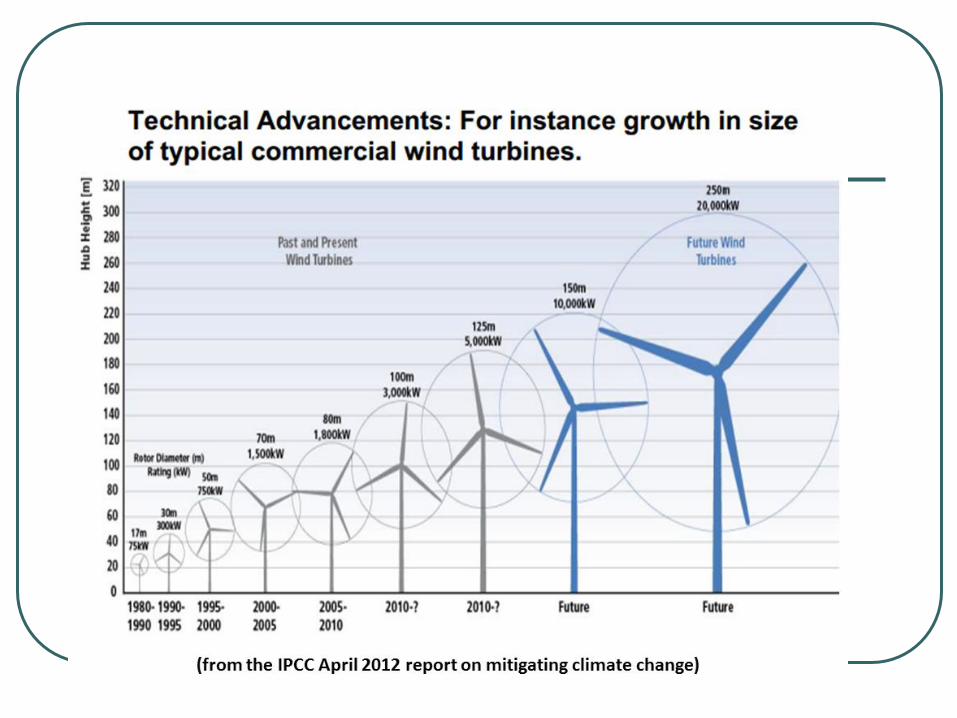
Wind Turbine Sizes
THE CURRENT WIND ENERGY ERA BEGAN
IN MID 1970S WITH A TYPICAL SIZE OF A
WIND TURBINE OF 30 KW WITH A ROTOR
DIAMETER OF 10 METERS
THE LARGEST UNIT INSTALLED TODAY
HAS A CAPACITY OF 1650 KW WITH A
ROTOR DIAMETER OF 66 METERS

ATTRACTIVE WIND REGIONS
Europe- North/West coasts, Mediterranean
Asia- East coast, some inland areas
Africa- North, Southwest coast
North America- Most coastal regions, some
mountainous central zones
S. America- Best Towards south

Wind Energy Scenario
TECHNICAL POTENTIAL OF ONSHORE WIND
ENERGY IS ABOUT 20000 TO 50000 TWH PER YEAR
AGAINST THE TOTAL WORLD ELECTRICITY
CONSUMPTION OF 15000 TWH
ECONOMIC POTENTIAL DEPENDS ON FACTORS
LIKE AVERAGE WIND SPEED, STATISTICAL WIND
SPEED DISTRIBUTION, TURBULENCE INTENSITIES
AND COSTS OF WIND TURBINE SYSTEMS

World WIND ENERGY Scenario
WIND ENERGY WAS USED AS A SOURCE OF
POWER BEFORE THE INDUSTRIAL REVOLUTION
DISPLACED BY FOSSIL FUELS BECAUSE OF COST
AND RELIABILITY
OIL SHOCKS OF 1970S SAW RENEWED INTERESTS
IN WIND ENERGY FOR APPLICATIONS LIKE GRID-
CONNECTED ELECTRICITY, WATER PUMPING AND
POWER SUPPLY IN REMOTE AREAS

Wind Power Global Capacity, 1996-
2012
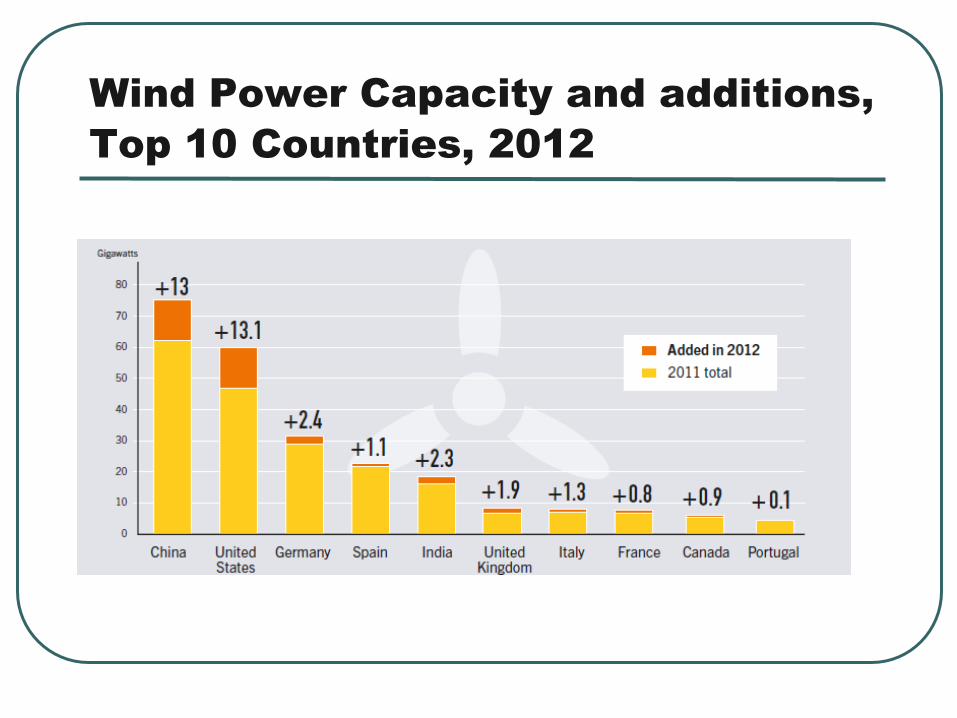
Wind Power Capacity and additions,
Top 10 Countries, 2012

26
Introduction
• Account for around 95% of the total supply in 2007
• Asian manufacturers improve their shares
(Goldwind & Sinovel in China, Suzlon in India)
Suzlon
10.5%
Vestas
22.8%
GE Wind
16.6%
Gamesa
15.4%
Enercon
14.0%
Siemens
7.1%
Goldwind
4.2%
Acciona
4.4%
OthersSinovel
3.4%Nordex
3.4%
Top 10 wind turbine suppliers in 2007
Wind Turbine Suppliers

Wind Power in India Estimated Potential as per CWET: 65-100 GW
Renewable share (31 GW) in overall Power Capacity (234 GW) amounts to more than 13%
Share of Wind power generation in Indian Renewables is 65 %.
India is fifth after USA, Germany, Spain, China
NOTE: Only about 20% is the maximum utility factor of installed wind capacity based on local wind conditions.
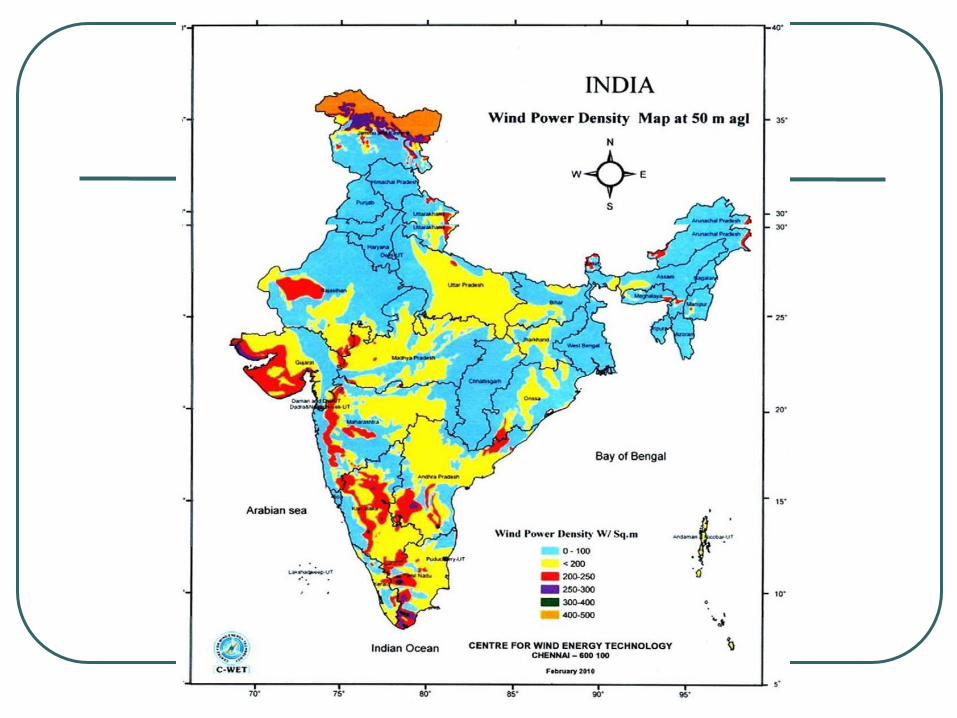

WIND POWER – State Wise
Analysis in INDIA


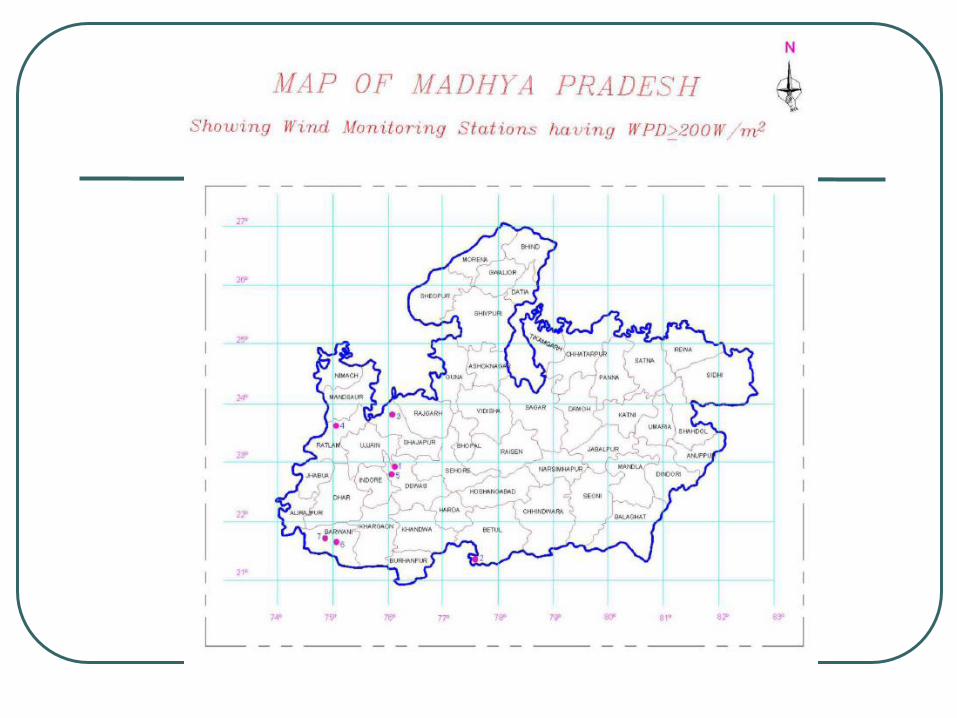
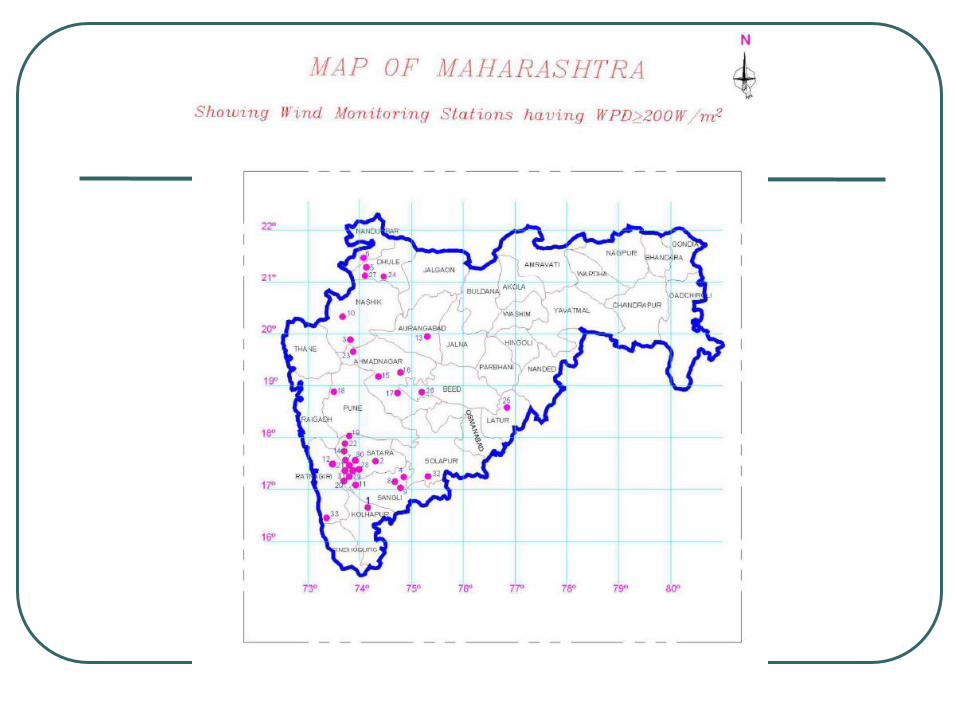
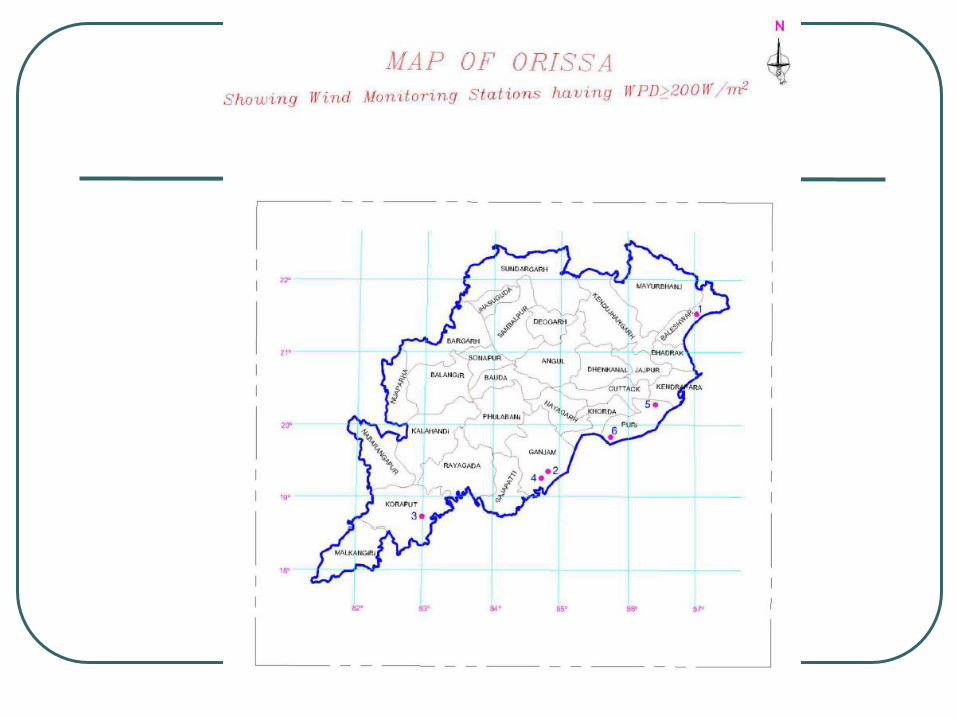
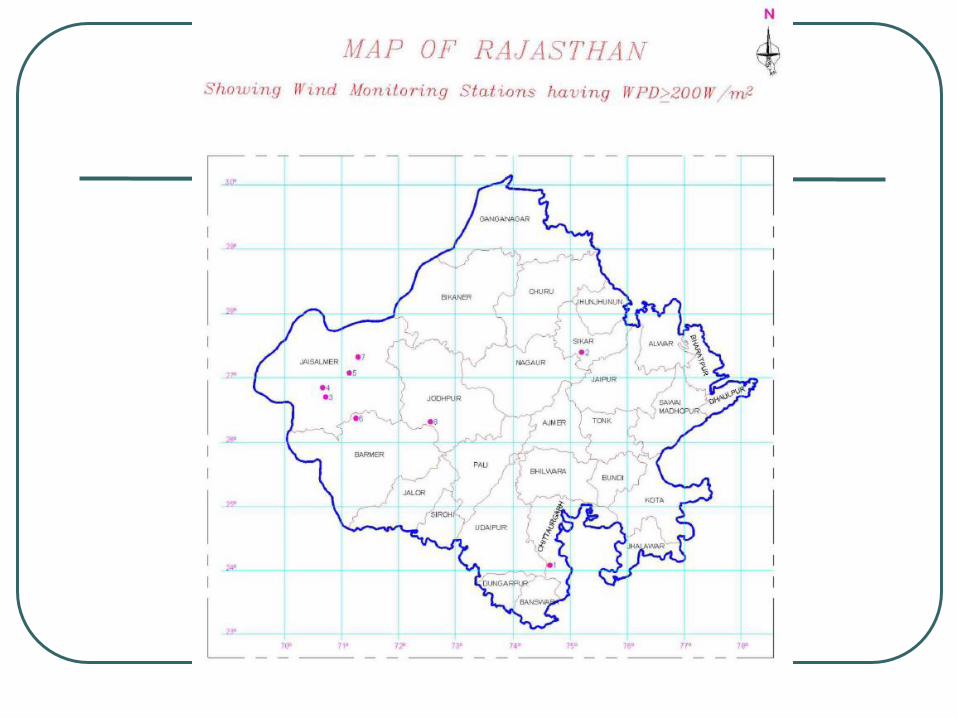


Wind Power Potential in India

Estimated Gross Potential

NAPCC - National Action Plan on Climate Change
REC - Renewable Energy Certificate
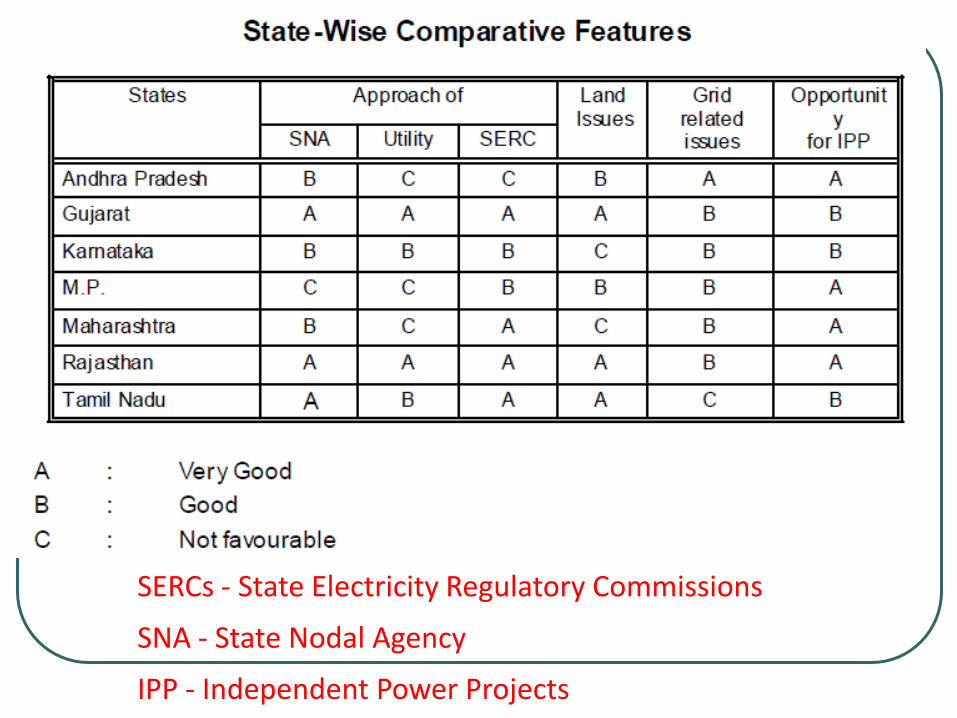
SERCs - State Electricity Regulatory Commissions
SNA - State Nodal Agency
IPP - Independent Power Projects


49
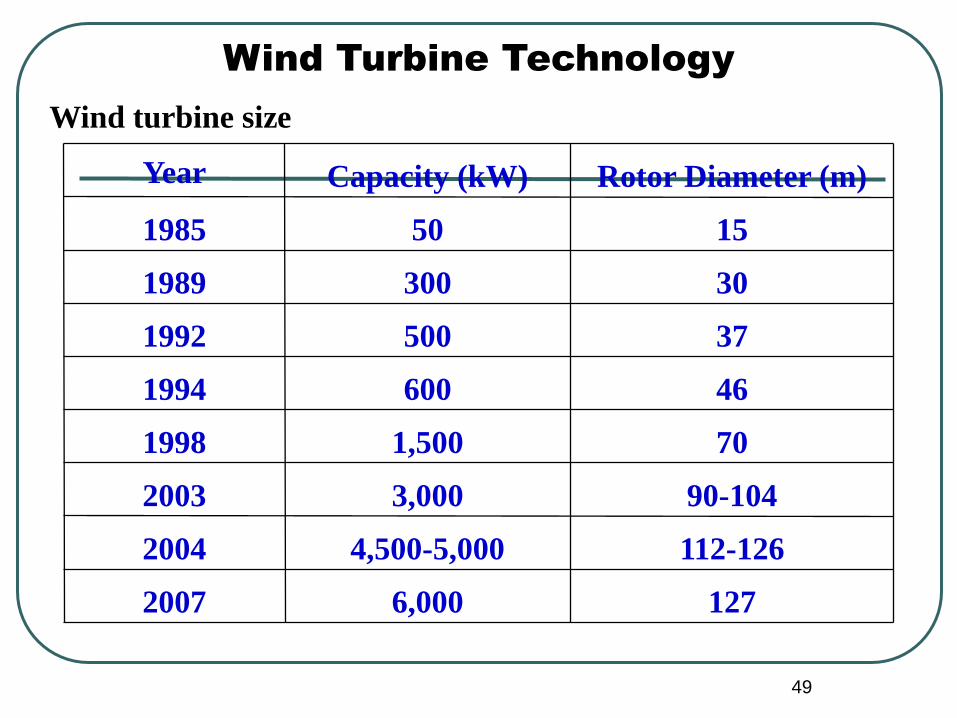
Wind Turbine Technology
Wind turbine size
127 6,000 2007
112-126 4,500-5,000 2004
90-104 3,000 2003
70 1,500 1998
46 600 1994
37 500 1992
30 300 1989
15 50 1985
Rotor Diameter (m) Capacity (kW) Year

MODERN WIND TURBINES
Early machines (20 Yrs. Ago)- 50-
100kW, 15-20m dia
Present trend-upto 2MW and above, 60-
70m dia
Offshore upto 5MW and 110m.dia

52
Wind Turbine Technology
Horizontal- and vertical-axis wind turbines
Rotor
Diameter
Gearbox
Generator
Rotor
blade
Tower
Nacelle
Rotor Diameter
Gearbox
Tower
Rotor
blade
Generator
Horizontal-axis wind turbine (HAWT) Vertical-axis wind turbine (VAWT)


Wind Turbine

Offshore Wind Farm

Fixed-bottom foundation and floating offshore
concepts

Wind farms

REQUIREMENTS
Area required per Wind Turbine = 5Acres (approx) Grid availability.
Accessibility for commissioning.
Strong terrain / soil for proper foundation / civil work
Favorable environmental condition to prevent
corrosion & not prone to cyclone.
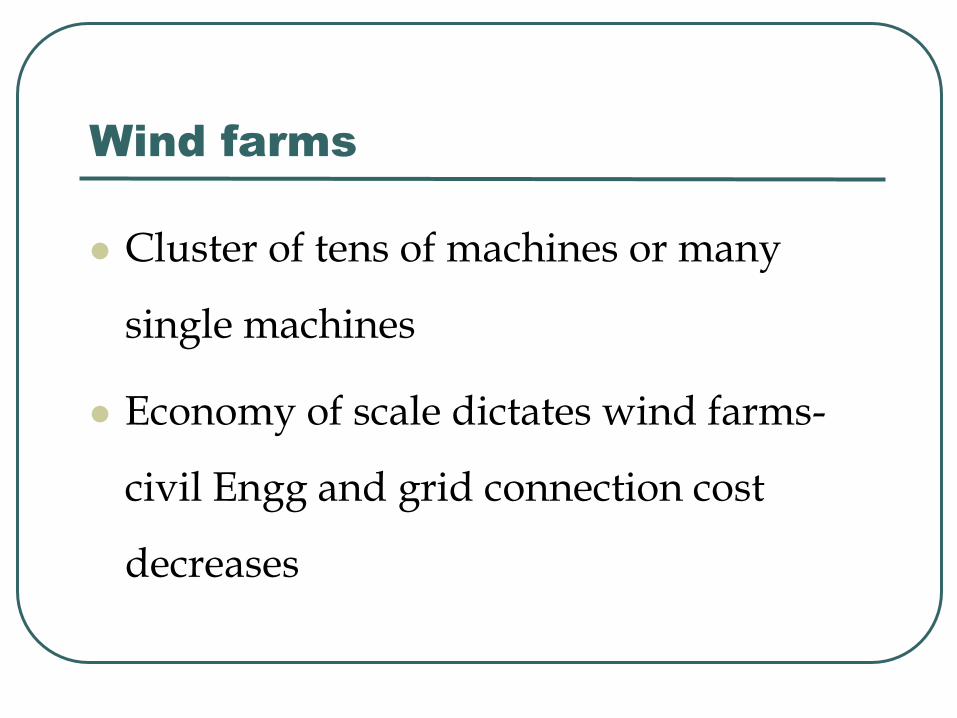
Wind farms
Cluster of tens of machines or many
single machines
Economy of scale dictates wind farms-
civil Engg and grid connection cost
decreases

SITING AND CLEARANCES

GCIG IN WIND SYSTEM

INSIDE NECELLE(RRB
VESTAS)

Enercon System(SYN.GEN)
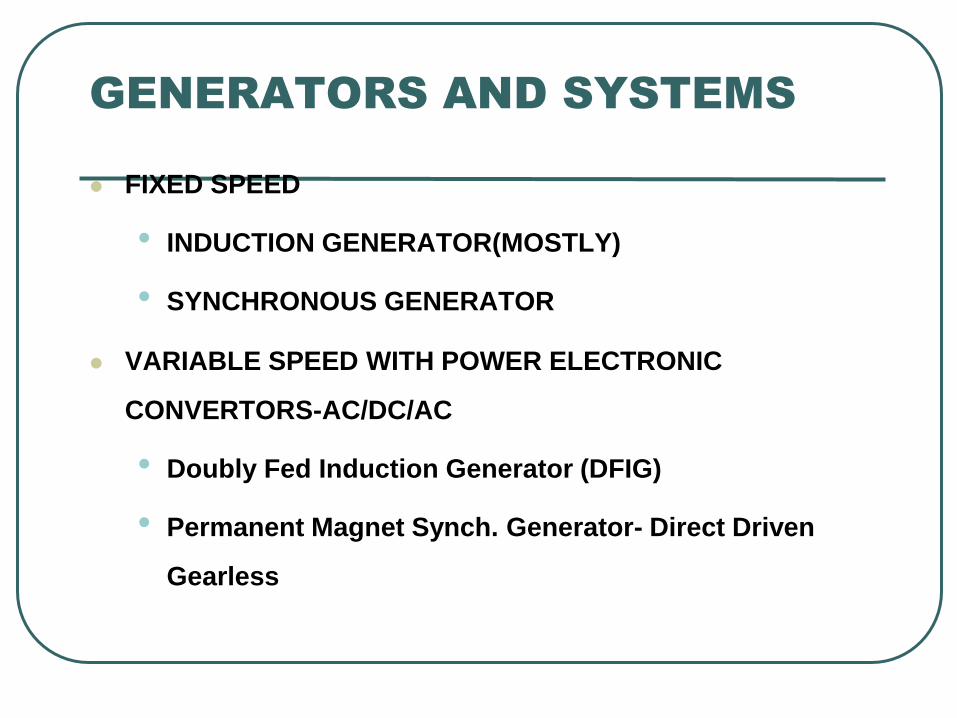
GENERATORS AND SYSTEMS
FIXED SPEED
• INDUCTION GENERATOR(MOSTLY)
• SYNCHRONOUS GENERATOR
VARIABLE SPEED WITH POWER ELECTRONIC
CONVERTORS-AC/DC/AC
• Doubly Fed Induction Generator (DFIG)
• Permanent Magnet Synch. Generator- Direct Driven
Gearless

65
Wind Energy Conversion
WES without using power converters
Soft
starter
Gearbox
SCIG
Transformer GridCapacitor
Up to 2.3 MW
Advantages • Low manufacturing cost
• Robust, low maintenance cost
Drawbacks • Low conversion efficiency
• Large fluctuation in output power
Squirrel Cage
Induction Generator

66
Doubly fed induction generator with rotor converter
Reduced-capacity
converter Transformer GridGearbox
DFIG
Wind Energy Conversion
Up to 5 MW
Advantages
• Extended speed range
• High system efficiency and low cost because
• Decoupled active & reactive power control
• Enhanced dynamic performance
Drawbacks
• Limited grid-fault operation capability

67
Wind Energy Conversion
Wind energy systems with full-power converters
Gearbox
SCIG
WRSG
PMSGTransformer Grid
Full power
converter
Up to 5 MW
(PMSG)
Advantages
• The generator fully decoupled from the grid
• Wide speed range
• Smooth grid connection
• Reactive power compensation
• Capability to meet the strict grid code
Drawbacks
• High system cost, reduces system efficiency

FIXED SPEED WIND SYSTEMS

SCHEMATIC OF A CONSTANT
SPEED WIND SYSTEM
INDUCTION
GENERATOR
WIN
D
TU
RB
INE
GE
AR
BO
X
11kV
GRID
CAPACITOR
TRANSFORMER
415V 11kV
P
P
Q

Enercon wind system
E-48 TECHNICAL DATA Rated capacity : 800 kW Rotor diameter : 48 m Hub height : 56.85m and 74.85 m Rotor with Pitch Control Type : Upwind rotor with active pitch control Direction of rotation : Clockwise Number of blades : 3 Length of blades : 20.7 m
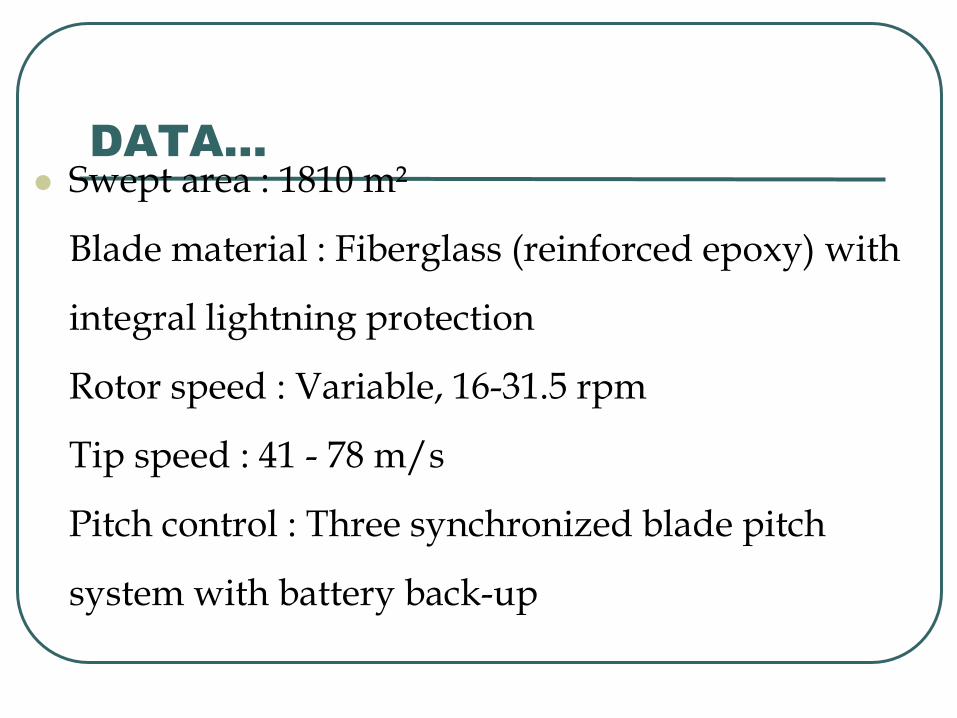
DATA…
Swept area : 1810 m²
Blade material : Fiberglass (reinforced epoxy) with
integral lightning protection
Rotor speed : Variable, 16-31.5 rpm
Tip speed : 41 - 78 m/s
Pitch control : Three synchronized blade pitch
system with battery back-up

Enercon System….
Generator : Synchronous - Type Hub : Rigid Bearings : Tapered roller bearings Grid Feeding : AC-DC-AC through Convertor - Invertor Braking System : 3 independent Aero Brakes with emergency back up supply. Yaw Control : Active through adjustment gears, friction damping Cut-in Wind Speed : 2 m/s Rated Wind Speed : 14 m/s Tower : Steel Tubular / Concrete
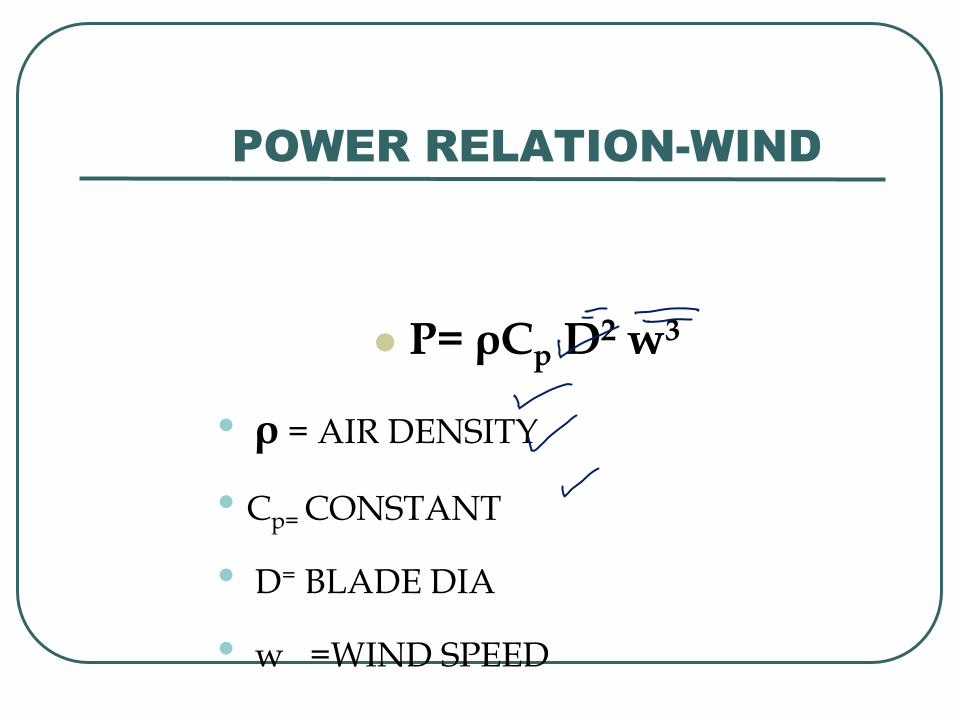
POWER RELATION-WIND
P= ρCp D2 w3
• ρ = AIR DENSITY
• Cp= CONSTANT
• D= BLADE DIA
• w =WIND SPEED

POWER Vs WIND SPEED
1.0
25 20 10 5 15
Wind speed, m/s
.p.u
power
Cut in speed
Cut out
speed
Pitch Control

DOUBLY WOUND SCIG AS
WIND GENERATOR (NO
CONVERTOR)
GRID

DATA ON A WIND MACHINE
Rated Power:1.65 MW
Blade dia: 63m
Cut in speed:3-5 m/s
Cut out speed: 20-25 m/s

Energy production (MWh)
Wind speed (m/s) Energy
at 60 m height-
5m/s- 1500
7m/s 3700
8m/s 4800

GRID INTERFACE
SEVERAL PROBLEMS OF EVACUATION
OF ENERGY INTO THE GRID
HIGH WIND AND LOW LOAD
CONDITIONS
WEAK , UBNORMAL GRIDS
SEVERAL STUDIES MADE

GRID CONNECTED
INDUCTION GENERATOR

COMPARISON- MOTOR Vs
GEN
MOTOR GENERATOR
STATOR VOLTAGE VS VS
STATOR CURRENT IS -IS
MAGNETIZING
CURRENT
IM IM
AIRGAP VOLTAGE VG VG

MOTOR Vs GEN.
MOTOR GENERATOR
ROTOR
CURRENT
IR -IR
SLIP s -s(=s')
AIR GAP
POWER (Pg) s
RI3 r2
r s'
RI3 r2
r

Motoring and Generating
MOTOR GENERATOR
Pshaft
DEVELOPED
TORQUE (Td)
SPEED (pu)
s1s
R
ω
3IP r
s
2
rout
out
r
s
2
rin
Ptoopp
s'1s'
R
ω
3IP
s
R
ω
3I r
s
2
r
s'
R
ω
3I
s
R
ω
3I r
s
2
rr
s
2
r
s1υ s'1υ

Motoring/Generating
MOTOR GENERTOR
Pmech
Pelec
s1sω
R3I
s
2
r
s'1sω
R3I
s
2
r
sss cosI3V sss cosI3V
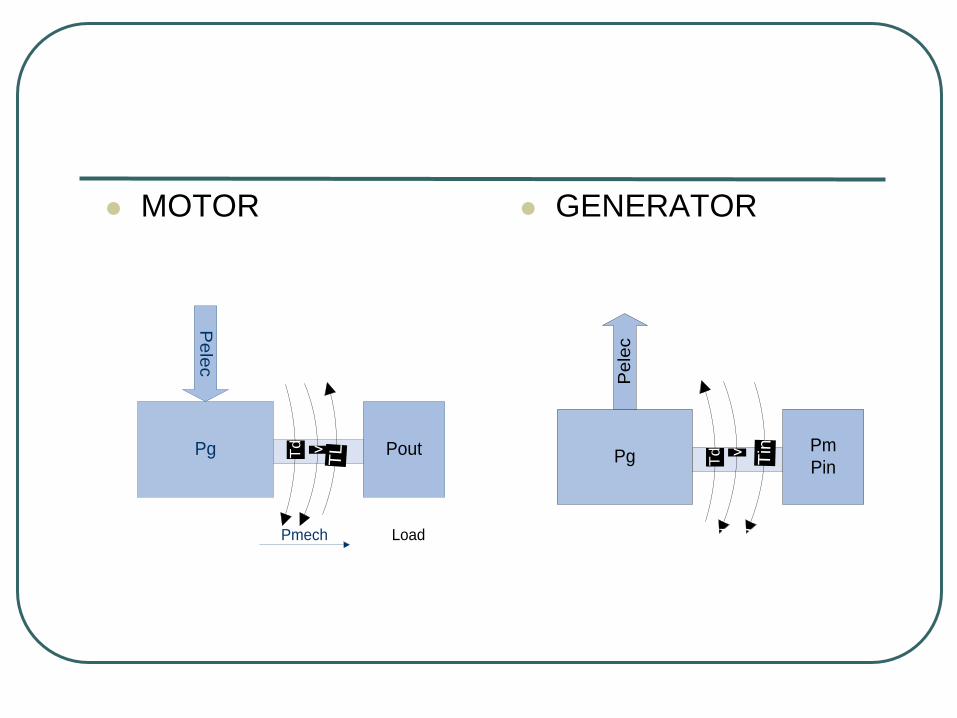
MOTOR GENERATOR
Pg
Pe
lec
PoutTd ν
TL
LoadPmech
Pg
Pe
lec
Pm
PinTd ν
Tin
PRIME
MOVER

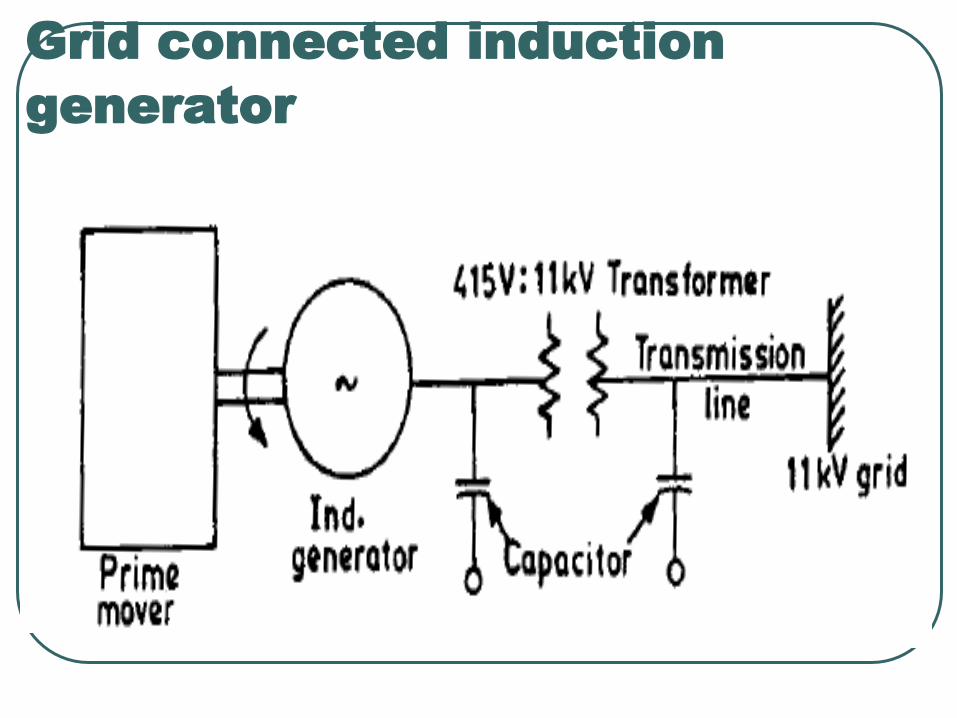
GRID CONNECTED INDUCTION
GENERATORS DRIVEN BY WIND/HYDRO
TURBINES
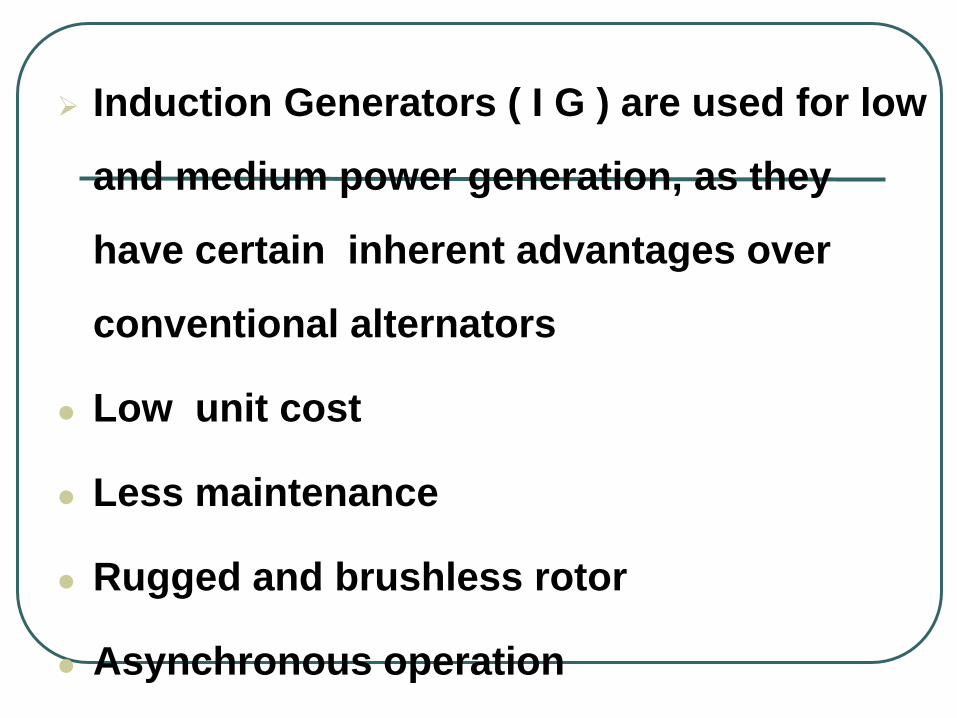
Induction Generators ( I G ) are used for low
and medium power generation, as they
have certain inherent advantages over
conventional alternators
Low unit cost
Less maintenance
Rugged and brushless rotor
Asynchronous operation

THE INPUT POWER TO THE GENERATOR CAN BE
NORMALLY KEPT CONSTANT WITH HYDRO
TURBINES.
THE WIND TURBINE ON THE OTHER HAND
PROVIDES VARYING POWER INPUT DEPENDENT
ON THE WIND SPEED.
CAPACITORS ARE CONNECTED TO THE
GENERATOR TERMINALS , TO IMPROVE THE
SYSTEM POWER FACTOR AND TO REDUCE THE
VAR DRAIN FROM THE GRID

PROBLEM WITH THE GRID
GRID FAILURE
SINGLE PHASING
TURBINE OVERSPEED WITH LOAD THROW OFF(ABOVE 2pu)
GENERATOR THERMAL OVERLOAD
POOR POWER QUALITY OF GRID-VOLTAGE, FREQUENCY
SELF EXCITATION DUE TO CAPACITOR DUE TO GRID FAILURE AND TURBINE OVERSPEED
Grid connected induction
generator

EQUIVALENT CIRCUIT OF IG
FIND RESPONSE AT CONSTANT POWER
INPUT AND GRID VOLTAGE
USE THEVENIN EQ. CIRCUIT

THEVENIN EQUIVALENT
CIRCUIT

Pin=- 3Ir2 Rr (1-s)/s…………(1)
Vth+ (Rth+ Rr /s +j Xth ) Ir =0……….(2)
ABOVE ARE TWO EQS WITH TWO
UNKNOWNS s AND Ir
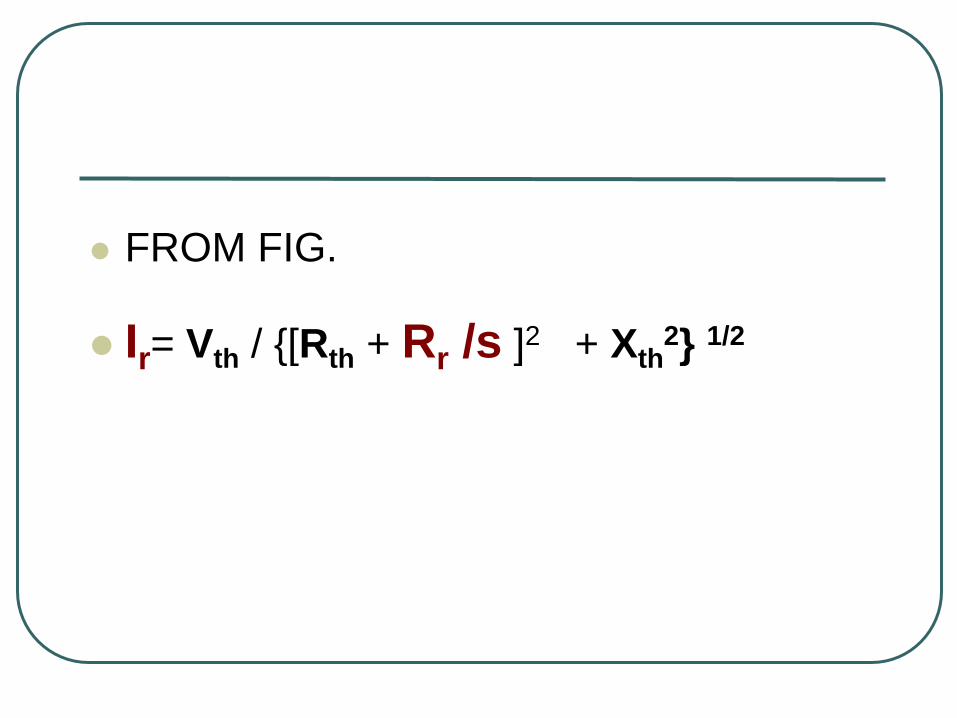
FROM FIG.
Ir= Vth / {[Rth + Rr /s ]2 + Xth2} 1/2

SIMPLIFYING
As2 +Bs + C =0
A= Rth2 + Xth
2 - 3Vth 2/ Pin
B=2Rth Rr +3 Vth / Pin
C= Rr 2

Pin=- 3Ir2 Rr (1-s)/s
SINCE s IS NEGATIVE Pin IS
POSITIVE

SOLVE FOR s, FOR GIVEN POWER INPUT AND GRID VOLTAGE
SOLVE EQ. CIRCUIT
GET ACTIVE POWER
REACTIVE POWER
POWER FACTOR
EFFICIENCY

DATA ON PRACTICAL FIELD
SYSTEMS
GENERATOR- 415V, 50 Hz
GRID-11kV, 50 Hz
TRANSFORMER IMPEDANCE- (0.021+j0.382)p.u
HV- TRANS. LINE IMPEDANCE- (0.021+j0.382)Ohm/km
SC MVA OF GRID = 250
LENGTH OF HV LINE=10km (HYDRO), 2km(WIND)

EQ. CKT. PARAMETERS(pu)
M/C Rs Rr xls xlr xm Rc
1 0.0135 0.024 0.105 0.169 3.34 72.2
2 0.19 0.0164 0.069 0.087 3.0 47.85
3 0.0504 0.0493 0.076 0.132 2.35 32.8
4 0.031 0.0256 0.0657 0.094 2.08 42.5
5 0.0492 0.031 0.933 0.179 3.19 52.42

CHARACTERISTICS OF WIND
TURBINE DRIVEN 55/11KW
INDUCTION GENERATOR

EFFECT OF VARIATION OF GRID
VOLTAGE

EFFECT OF VARIATION OF GRID
VOLTAGE
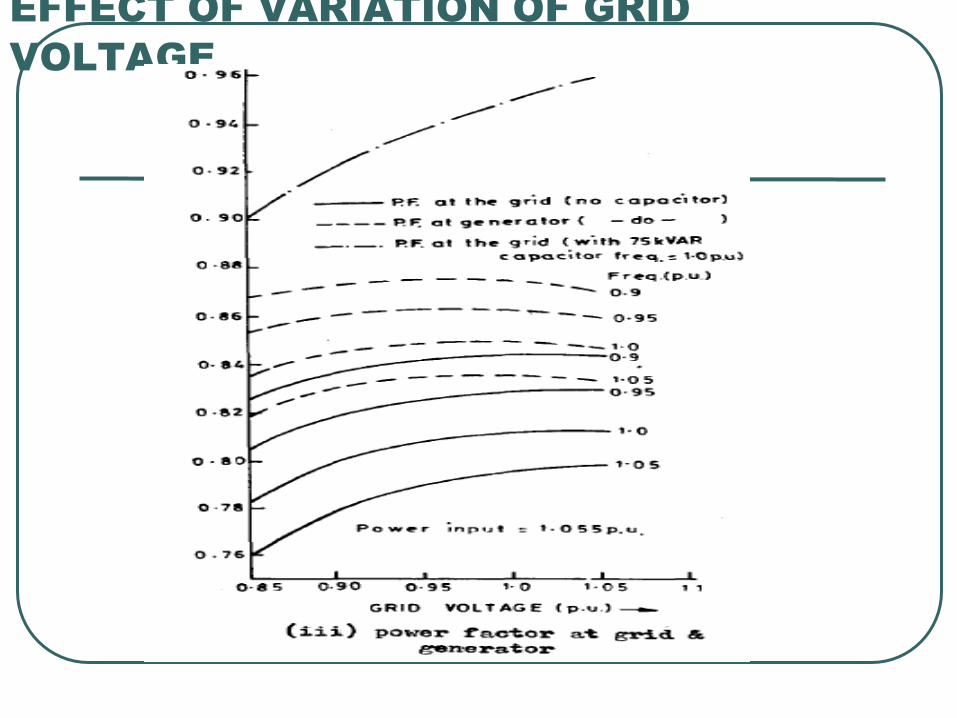
EFFECT OF VARIATION OF GRID
VOLTAGE
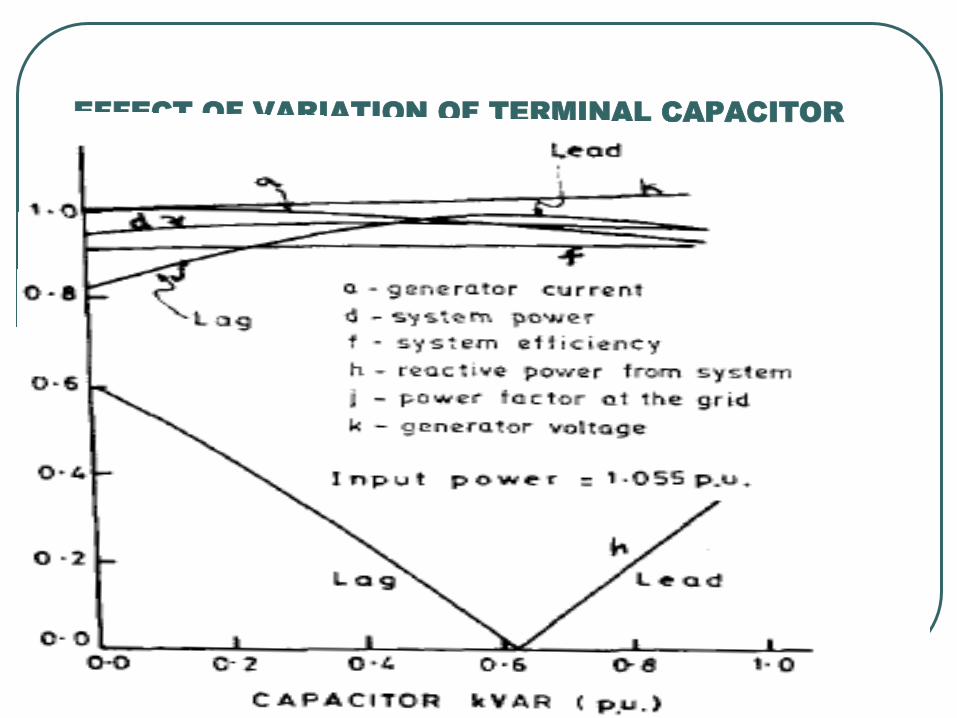
EFFECT OF VARIATION OF TERMINAL CAPACITOR

EFFECT AT VARYING POWER INPUT

EFFECT AT VARYING POWER INPUT

EFFECT AT VARYING POWER INPUT
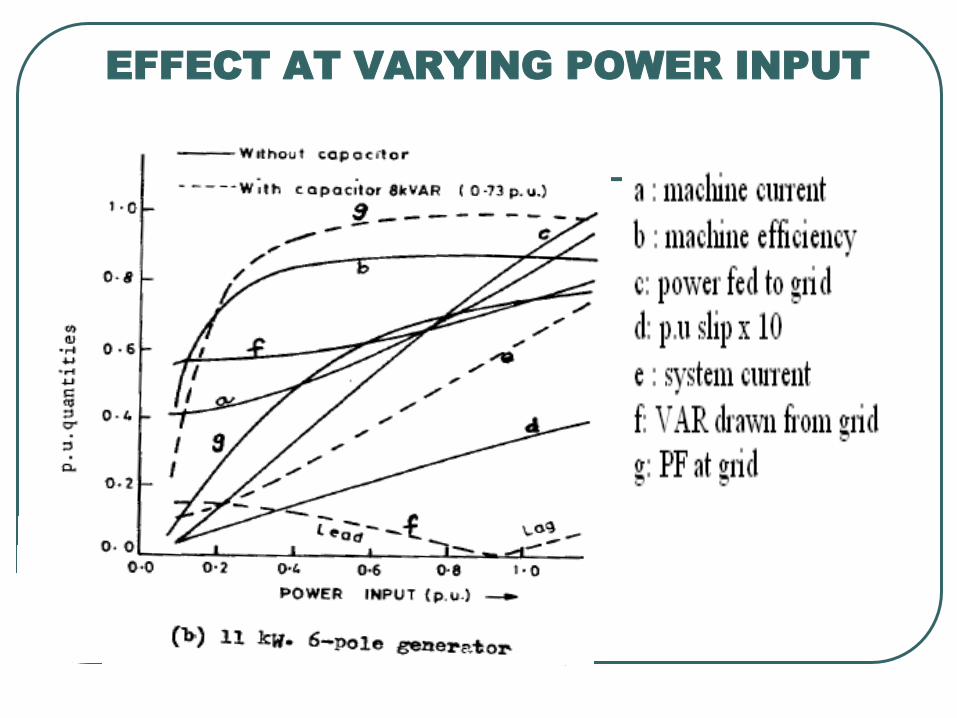
EFFECT AT VARYING POWER INPUT

References..
S.S.Murthy (with C.S.Jha and P.S.N.Rao), "Analysis of Grid Connected Induction Generator driven by Hydro/ Wind Turbines under Realistic System Constraints ", IEEE Trans. on Energy Conversion, March, 1990 Volume 5, No. 1, pp 1-7
S.S.Murthy (with A.H.Ghorashi, B.P.Singh & Bhim Singh), 'Analysis of Wind Driven Grid Connected Induction Generators under unbalanced Grid Conditions', IEEE Trans. on Energy Conversion Vol.9, No.2, June, 1994 pp 217-223
S.S.Murthy (with C.S.Jha, A.H.Ghorashi, P.S.Nagendra Rao), 'Performance Analysis of Grid Connected Induction Generators Driven by Hydro/Wind Turbines including Grid Abnormalities', presented at Inter Society Energy Conversion Engg. Conference (IECEC at Washington DC, Aug., 1 989).
VARIABLE SPEED WIND SYSTEMS
DOUBLY FED
INDUCTION GENERATORS:

DOUBLY FED IND. MACHINE
Pe
Pm Pr
Pg Pcus
Pcur
DFIG
CONVERTOR(BIDIRECTIONAL))
TRANSFORMER
f
fr f
GRID

EQUIVALENT CIRCUIT of DOUBLY
FED WOUND ROTOR I.M- MOTRING
Is
Vs
Rs jxls
Rc xm
I0
Ic Im
Vg Ej sVg
Ir
Rr+jsXlr

sPg= Pr + Pcur
Pg= Pr + (1-s) Pg +Pcur

ROTOR EQUATION
sVg- Ir(Rr+jsxlr)-Ej=0
sVg= Ir(Rr+jsxlr)+Ej
sVg-Ej = Ir(Rr+jsxlr )
(Ej REF. TO STATOR TURNS)

DFIG
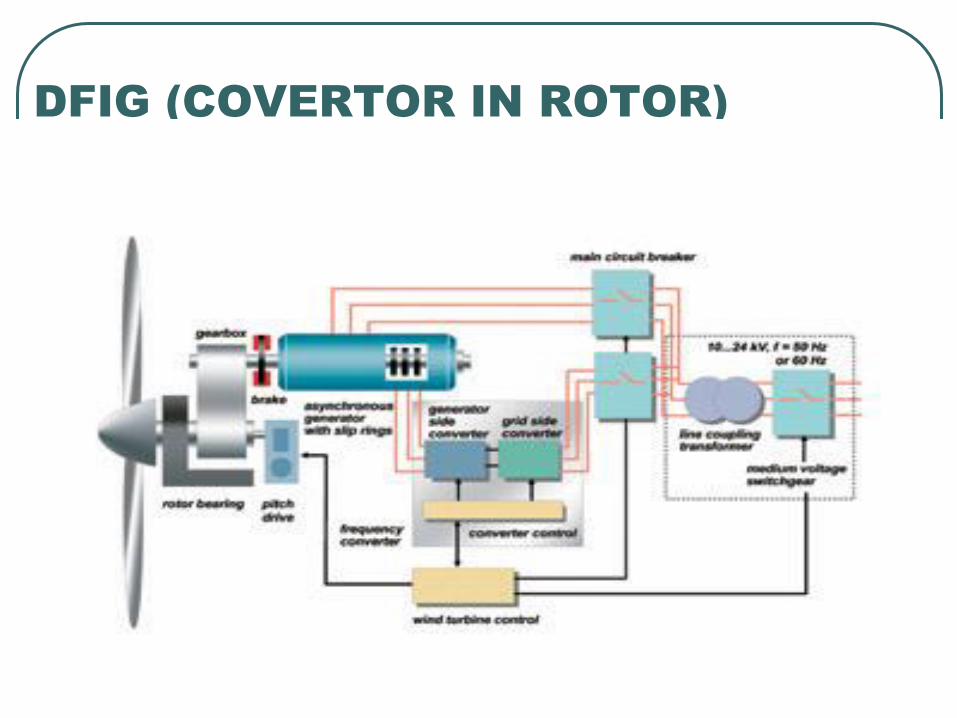
DFIG (COVERTOR IN ROTOR)
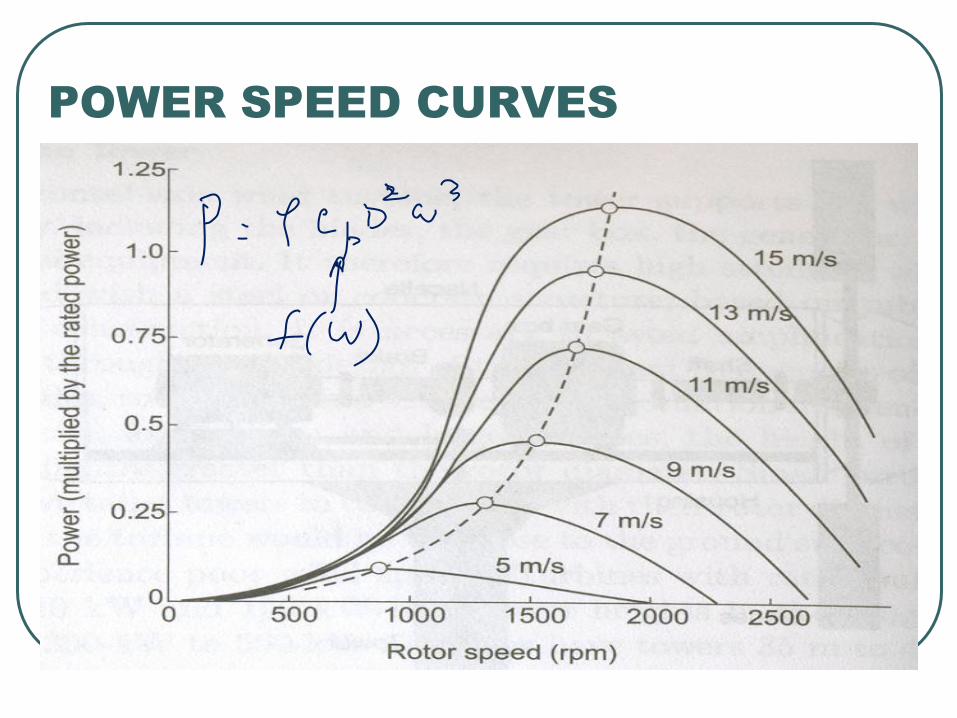
POWER SPEED CURVES

0 1 2 3 4 5 6 70
20
40
60
80
Generator Speed (rad/sec)
Tu
rbin
e P
ow
er (
kW
)Vw=11m/s
Vw
=10m/s
Vw
=9m/s
Vw
=8m/s
Vw
=7m/s
Vw
=6m/s
Vw
=5m/s
Maximum Power Line
Mechanical power output of the wind turbine vs. generator speed for different wind speeds
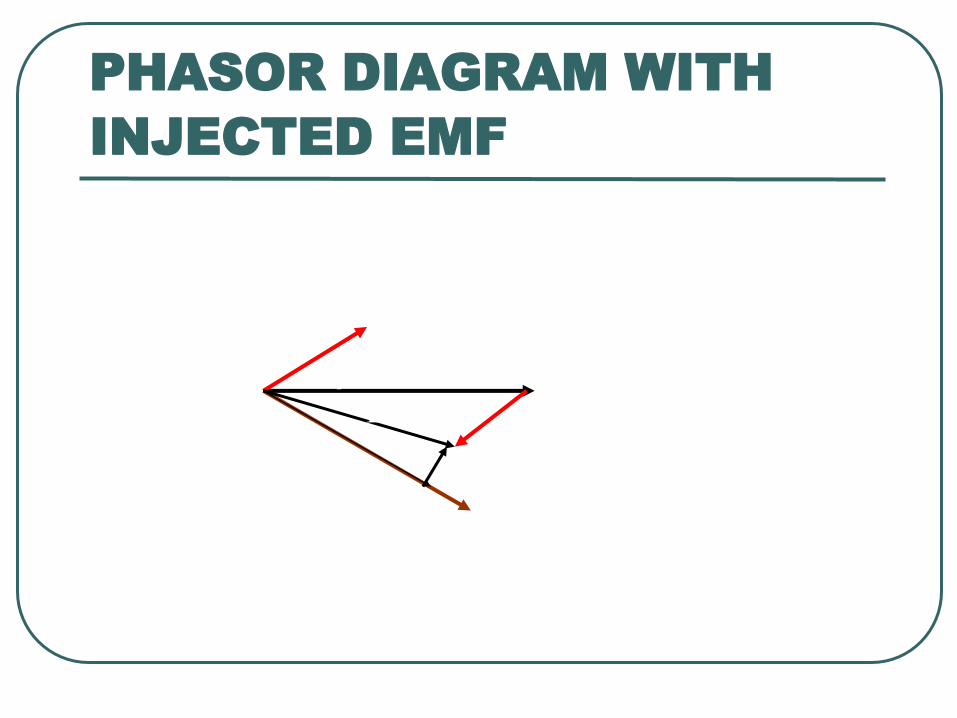
PHASOR DIAGRAM WITH
INJECTED EMF
Ej
sVg
Ir
β
Φr

RESOLVE VOLTAGES AND DROPS
ALONG Ir AXIS
sVg cos Φr= Ir Rr+ Ej cos (Φr + β)
sVg Ir cos Φr= Ir2 Rr+ Ir Ej cos (Φr + β)
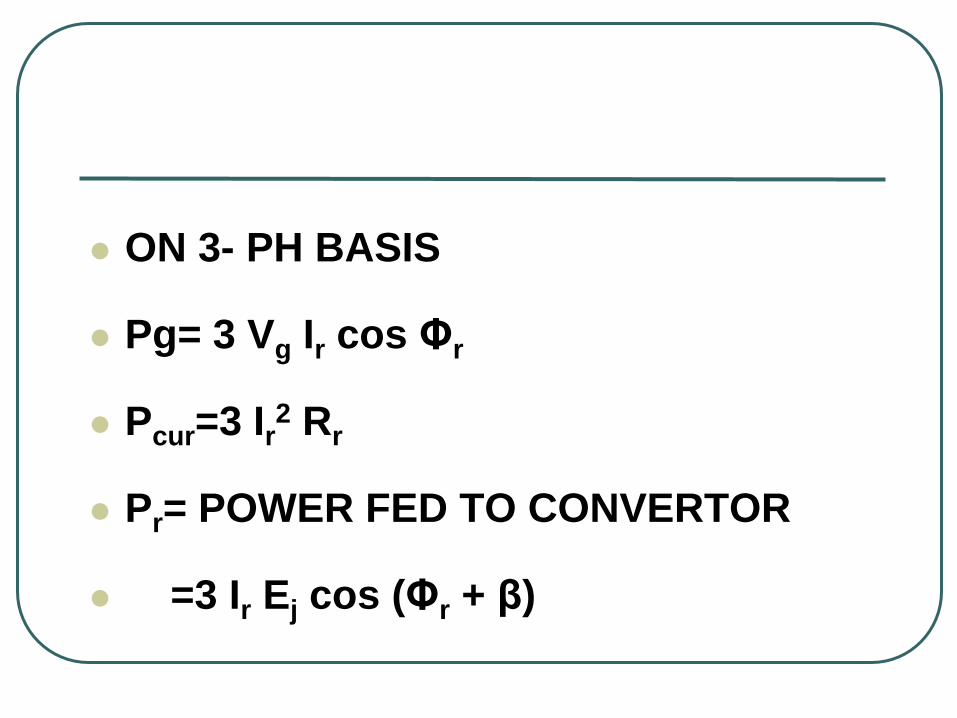
ON 3- PH BASIS
Pg= 3 Vg Ir cos Φr
Pcur=3 Ir2 Rr
Pr= POWER FED TO CONVERTOR
=3 Ir Ej cos (Φr + β)

AIRGAP POWER=
• ROTOR COPPER LOSS+ POWER FED TO
CONVERTOR + MECHANICAL POWER
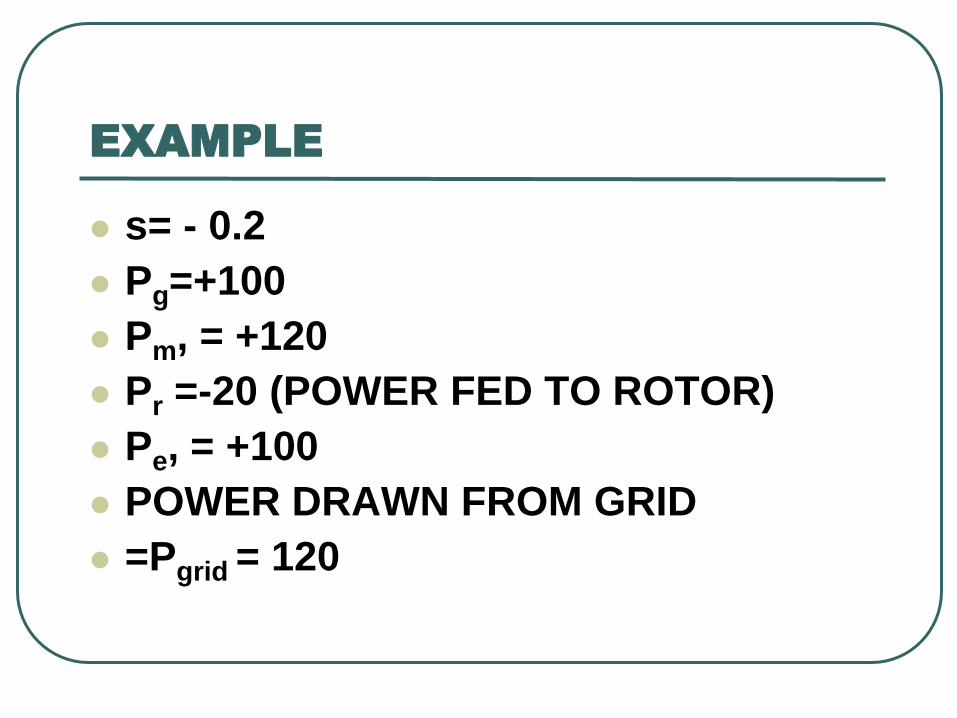
EXAMPLE
s= - 0.2
Pg=+100
Pm, = +120
Pr =-20 (POWER FED TO ROTOR)
Pe, = +100
POWER DRAWN FROM GRID
=Pgrid = 120

MODE-I, SUBSYNCHRONOUS,
MOTORING
0<s <1, s IS +VE
Pg, Pm, Pe, Pr POSITIVE
Pm =(1-s) Pg IS POSITIVE
NEGLECT LOSSES Pcur, Pcus
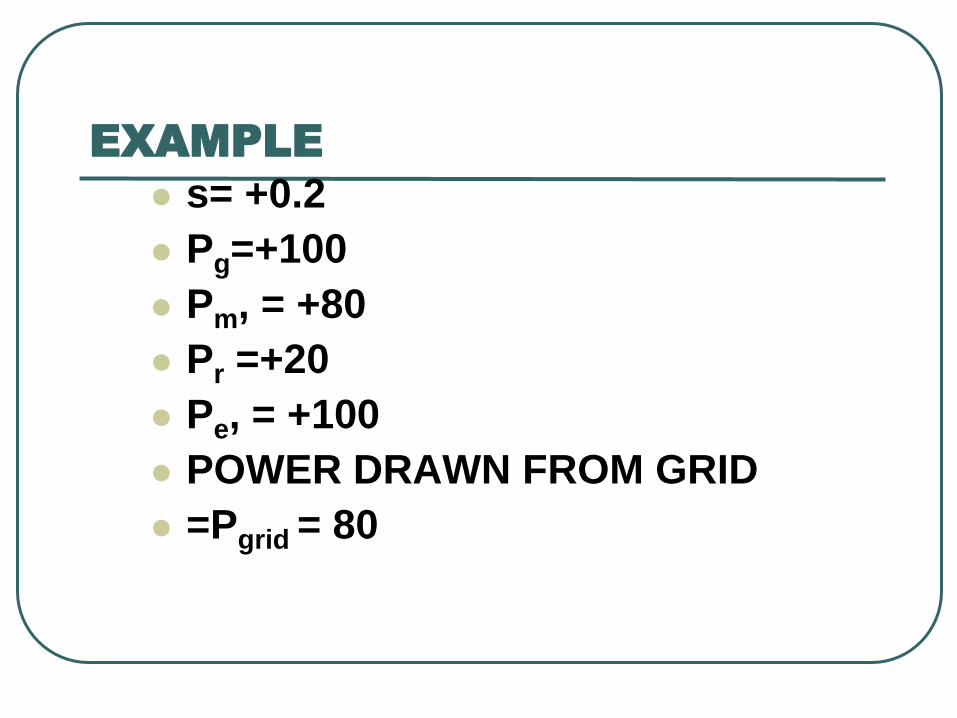
EXAMPLE
s= +0.2
Pg=+100
Pm, = +80
Pr =+20
Pe, = +100
POWER DRAWN FROM GRID
=Pgrid = 80

MOTORING AT s=0.2
Pe
(100)
Pm(80) Pr
(20)
Pg
(100)
Pcus Pcur
DFIG
TRANSFORMER
f
fr f
GRID (80)
CONVERTOR
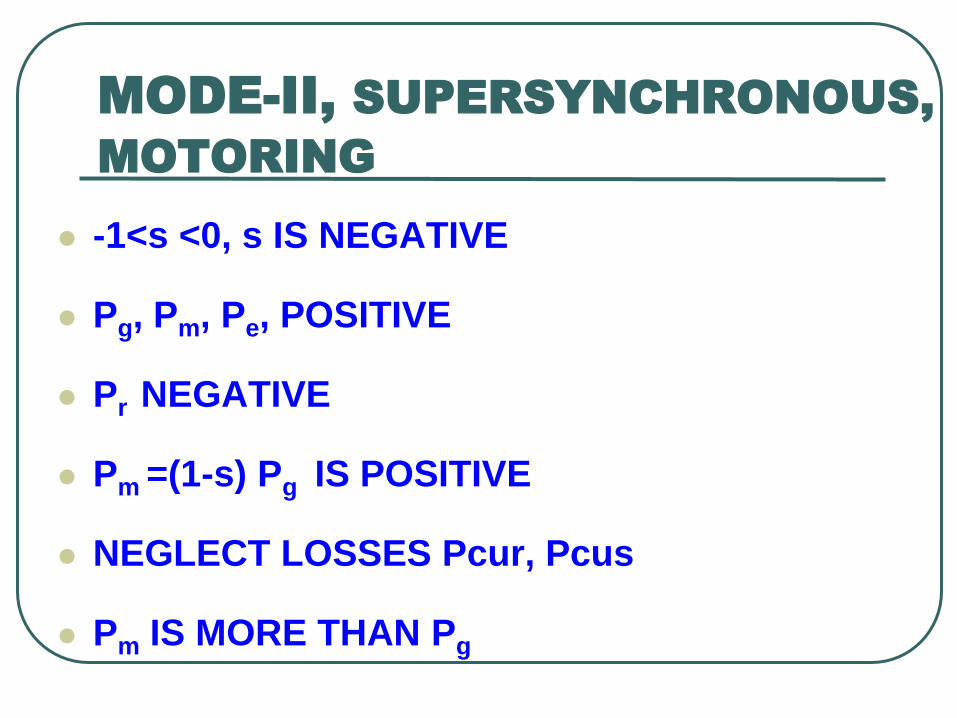
MODE-II, SUPERSYNCHRONOUS,
MOTORING
-1<s <0, s IS NEGATIVE
Pg, Pm, Pe, POSITIVE
Pr NEGATIVE
Pm =(1-s) Pg IS POSITIVE
NEGLECT LOSSES Pcur, Pcus
Pm IS MORE THAN Pg

MOTORING AT s= -0.2
Pe
(100)
Pm(120) Pr
(-20)
Pg
(100)
Pcus Pcur
DFIG
TRANSFORMER
f
fr f
GRID (120)
CONVERTOR
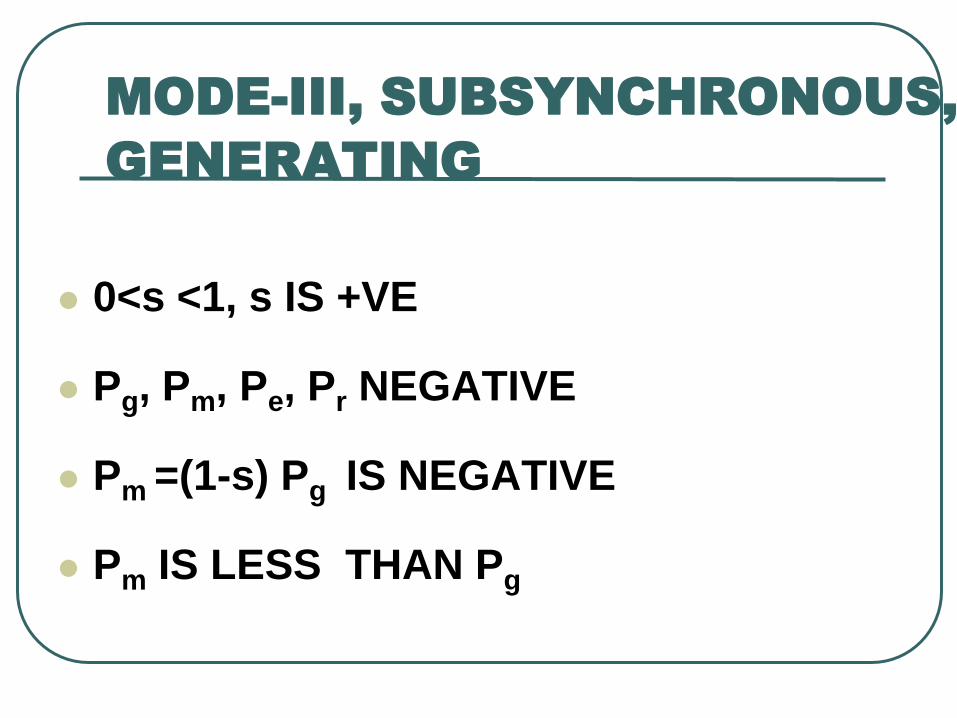
MODE-III, SUBSYNCHRONOUS,
GENERATING
0<s <1, s IS +VE
Pg, Pm, Pe, Pr NEGATIVE
Pm =(1-s) Pg IS NEGATIVE
Pm IS LESS THAN Pg
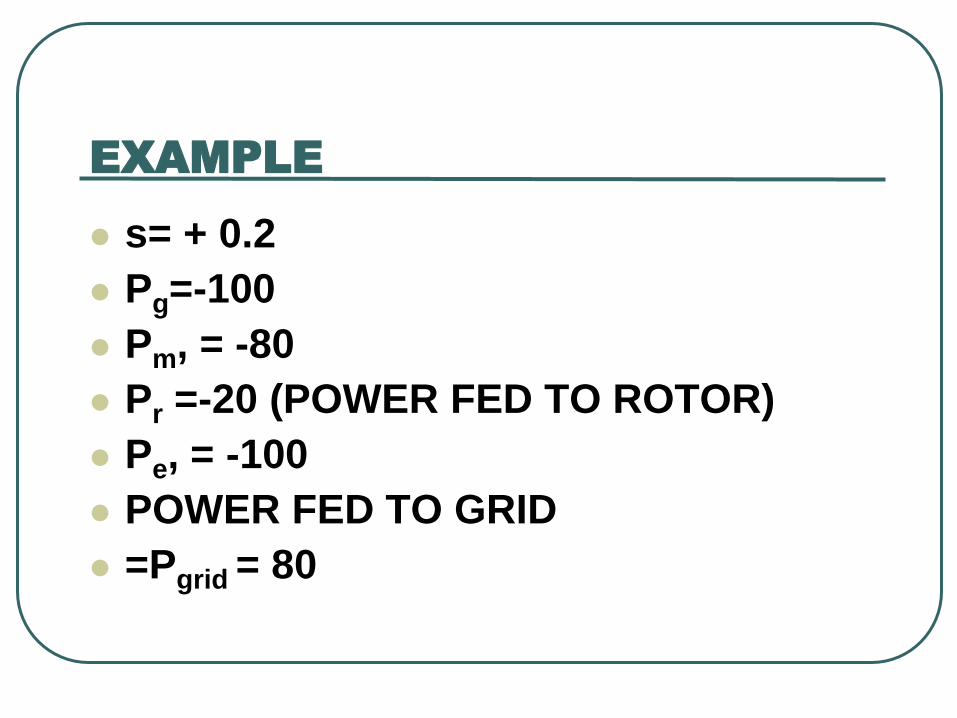
EXAMPLE
s= + 0.2
Pg=-100
Pm, = -80
Pr =-20 (POWER FED TO ROTOR)
Pe, = -100
POWER FED TO GRID
=Pgrid = 80

GENERATING AT s= +0.2
Pe
(-100)
Pm(-80) Pr
(-20)
Pg
(-100)
Pcus Pcur
DFIG
TRANSFORMER
f
fr f
GRID (-80)
CONVERTOR
MOTORING
GENERATING

MODE-IV, SUPERSYNCHRONOUS,
GENERATING
-1<s <0, s IS NEGATIVE
Pg, Pm, Pe, NEGATIVE
Pr POSITIVE
Pm =(1-s) Pg IS NEGATIVE
Pm IS MORE THAN Pg

EXAMPLE
s= - 0.2
Pg=-100
Pm, = -120
Pr =+20 (POWER DRAWN FROM ROTOR & FED TO GRID)
Pe, = -100
POWER FED TO GRID
=Pgrid = 120

GENERATING AT s=-0.2
Pe
(-100)
Pm(-120) Pr
(+20)
Pg
(-100)
Pcus Pcur
DFIG
TRANSFORMER
f
fr f
GRID (-120)
CONVERTOR
GENERATING

POWER Vs SLIP (MOTORING)
0 s -1
Pr
Pm Pg
s

POWER Vs SLIP, GENERATING
0 s
-1
s 0
Pr Pm Pg

Pg Pm Pr
MOTOR SUB
SYNC
+ + +
MOTOR SUPER
SYNC
+ + -
GENERATOR SUB
SYNC
- - -
GENERATOR SUPER
SYNC
- - +

PM GENERATORS
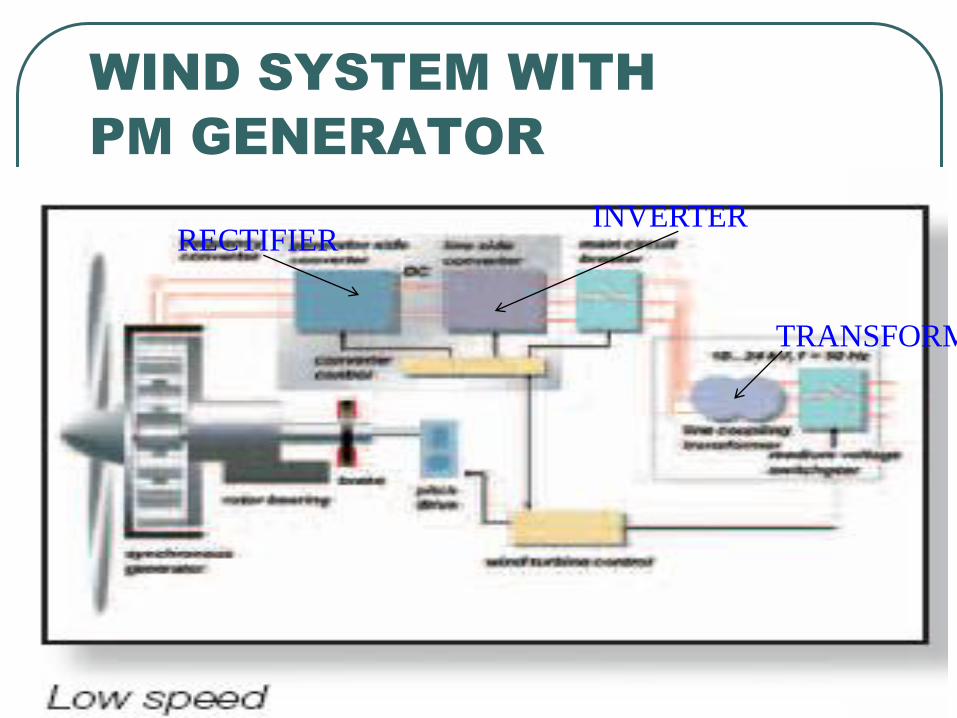
WIND SYSTEM WITH
PM GENERATOR
INVERTER RECTIFIER
TRANSFORMER

WHAT IS IN STORE FOR
FUTURE?

FUTURE IN WIND ENERGY
FIXED SPEED SCIG (UPTO 1 MW)
VARIABLE SPEED SCIG (WITH
CONVERTOR/INVERTOR BETWEEN MACHINE AND
GRID
DFIG (FEW MW)
SYNCH GEN LOW SPEED GEARLESS WITH AC-DC-AC
PM SYNCH GEN WITH AC-DC-AC
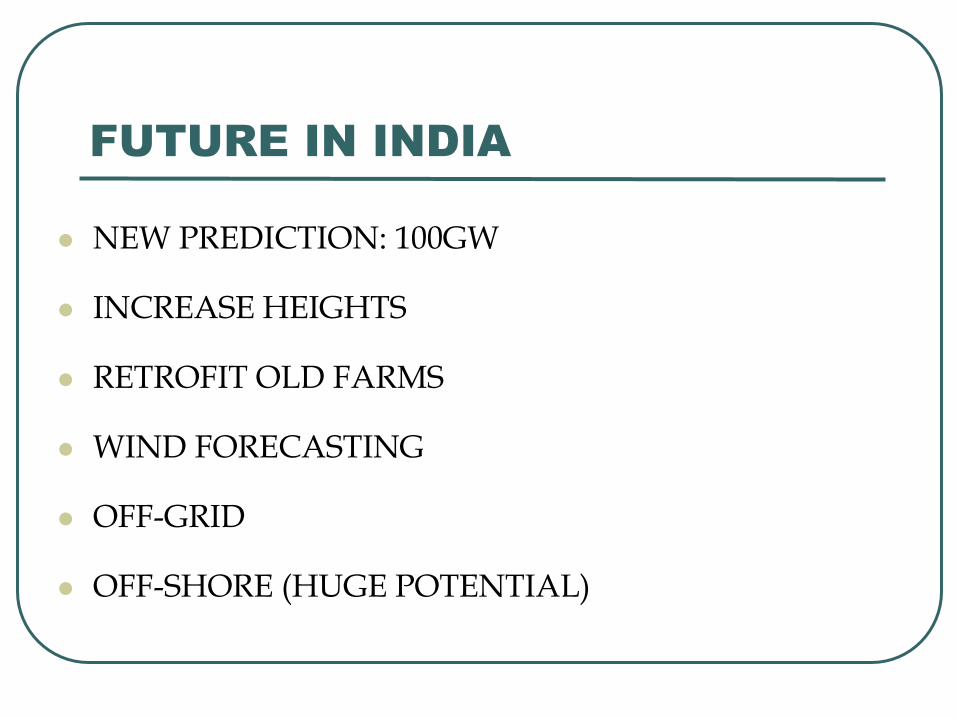
FUTURE IN INDIA
NEW PREDICTION: 100GW
INCREASE HEIGHTS
RETROFIT OLD FARMS
WIND FORECASTING
OFF-GRID
OFF-SHORE (HUGE POTENTIAL)
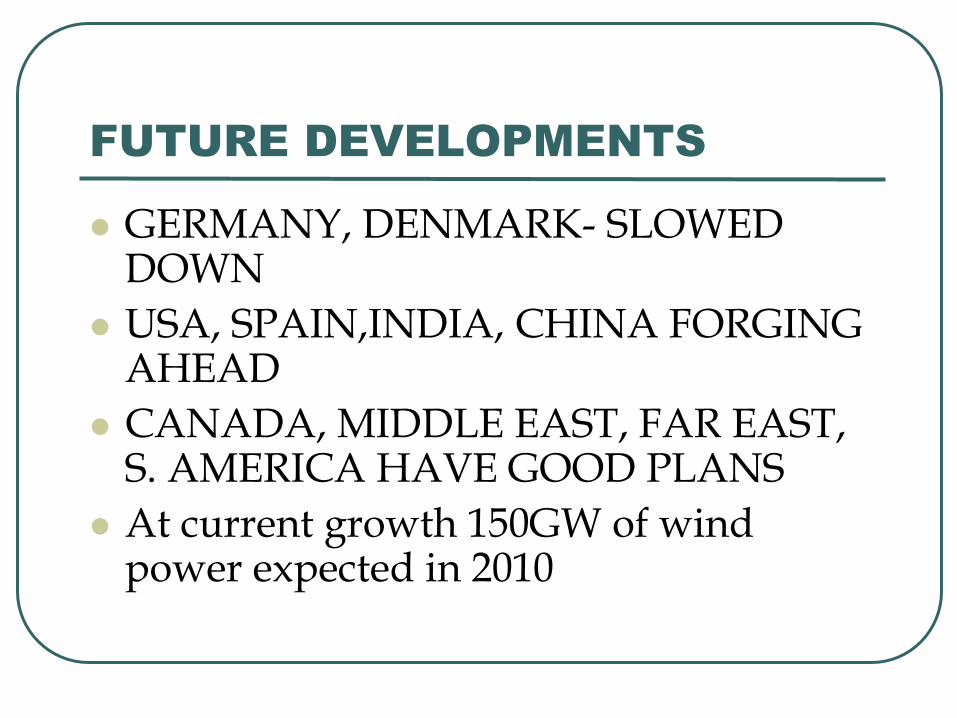
FUTURE DEVELOPMENTS
GERMANY, DENMARK- SLOWED DOWN
USA, SPAIN,INDIA, CHINA FORGING AHEAD
CANADA, MIDDLE EAST, FAR EAST, S. AMERICA HAVE GOOD PLANS
At current growth 150GW of wind power expected in 2010

FACTORS FOR GROWTH
POLITICAL SUPPORT
INTERNATIONAL COMMITMENT
CONCERN FOR CLIMATE CHANGE, EMISSIONS
TECHNOLOGY FAIRLY MATURE
PERFORMANCE AND COST ARE NOW CRUCIAL

THANK YOU