lecture i: a primer on power markets - fields institute
TRANSCRIPT

The NordPool market Stylized facts of power spot prices Stylized facts of electricity forwards
Lecture I: A primer on power markets
Fred Espen Benth
Centre of Mathematics for Applications (CMA)University of Oslo, Norway
Fields Institute, 19-23 August, 2013

The NordPool market Stylized facts of power spot prices Stylized facts of electricity forwards
Overview of lectures
• Goal: give an introduction to the basics of modelling andpricing in energy
• Focus on power, gas and weather:• spot, forwards and options
1. A primer on power• the case of NordPool
2. Stochastic volatility modelling in energy markets• Gas markets as the case
3. Stationary stochastic models• Spot power and weather markets
4. Option pricing in energy markets• Asian, spread and quanto options
5. Heath-Jarrow-Morton modelling of energy markets• Case study on NordPool data

The NordPool market Stylized facts of power spot prices Stylized facts of electricity forwards
For background and some of the theory in the course....

The NordPool market Stylized facts of power spot prices Stylized facts of electricity forwards
The NordPool Market

The NordPool market Stylized facts of power spot prices Stylized facts of electricity forwards
• The NordPool market organizes trade in
• Hourly spot electricity, next-day delivery• Forward and futures contracts on the spot• European options on forwards
• Covers the Nordic region• Norway, Sweden, Denmark and Finland• Estonia and Lithuania
• Power production• Hydro, nuclear, coal, gas, wind, bio

The NordPool market Stylized facts of power spot prices Stylized facts of electricity forwards
• Power generation in the NordPool area in 2011: 377.4 TWh

The NordPool market Stylized facts of power spot prices Stylized facts of electricity forwards
Elspot: the spot market
• A (non-mandatory) hourly market with physical delivery ofelectricity
• About 70% of total production traded through NordPool(2010)
• Participants hand in bids before noon the day ahead
• Volume and price for each of the 24 hours next day• Maximum of 64 bids within technical volume and price limits
• NordPool creates demand and production curves for each hourof the next day

The NordPool market Stylized facts of power spot prices Stylized facts of electricity forwards
• Graphical illustration of the power generation stack

The NordPool market Stylized facts of power spot prices Stylized facts of electricity forwards
• The system price is the equilibrium• Price for delivery of electricity at a specific hour next day• The daily system price is the average of the 24 hourly
• Reference price for the forward market
• A series of hourly prices from Friday 21–Friday 28 March, 2008

The NordPool market Stylized facts of power spot prices Stylized facts of electricity forwards
• Historical daily system price from 1998 until May 2013(NOK/MWh)

The NordPool market Stylized facts of power spot prices Stylized facts of electricity forwards
• Local imbalances in production and demand
• Example: In winter Norway may be in deficit of electricity dueto cold weather
• Importing from Sweden mostly

The NordPool market Stylized facts of power spot prices Stylized facts of electricity forwards
• Due to congestion (non-perfect transmission lines), area pricesare derived
• Finland separate area• Sweden and Denmark split into two• Norway may be split into several areas (up to 5)
• The area prices are the actual prices for theconsumers/producers in the area in question

The NordPool market Stylized facts of power spot prices Stylized facts of electricity forwards
• Areas and area prices on March 28, 2008

The NordPool market Stylized facts of power spot prices Stylized facts of electricity forwards
The forward and futures market
• Contracts with “delivery” of electricity over a period
• Financially settled: The money-equivalent of receivingelectricity is paid to the buyer
• The reference is the hourly system price in the delivery period
• Delivery periods
• Next day or week (futures-style)• Monthly• Quarterly (earlier seasons)• Yearly
• Overlapping delivery periods (!)

The NordPool market Stylized facts of power spot prices Stylized facts of electricity forwards
• Base load contracts• Delivery over all hours in the period
• Peak load contracts• Delivery over peak hours only• Peak hours are from 8 to 20 every day• Weekends and holidays are excluded
• Also here the futures-style contracts have short delivery period
• Contracts frequently called swaps• Fixed for floating spot price

The NordPool market Stylized facts of power spot prices Stylized facts of electricity forwards
• Monthly (base-load) forward prices up to June 1, 2013
• Dotted line is the system price

The NordPool market Stylized facts of power spot prices Stylized facts of electricity forwards
The case of freight rates forwards
• Supramax rates at Baltic Exchange

The NordPool market Stylized facts of power spot prices Stylized facts of electricity forwards
The option market
• European call and put options on electricity forwards
• Quarterly and yearly delivery periods
• Low activity on the exchange
• OTC market for electricity derivatives huge
• Average-type (Asian) options, quanto options, CfD’s, spreadoptions
• Flexible load contracts, other swing options....
The NordPool market Stylized facts of power spot prices Stylized facts of electricity forwards
Stylized facts of power spot prices
The NordPool market Stylized facts of power spot prices Stylized facts of electricity forwards
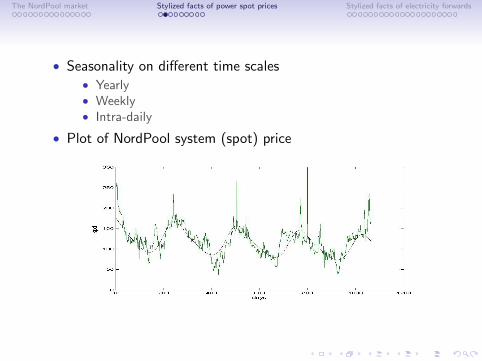
• Seasonality on different time scales• Yearly• Weekly• Intra-daily
• Plot of NordPool system (spot) price

The NordPool market Stylized facts of power spot prices Stylized facts of electricity forwards
• Mean-reversion of spot prices• Energy prices driven by supply and demand• Prices will revert towards an equilibrium level
• However, to what level?• A fixed long-term level?• A stochastic level?
• Plot of UK PX log-spot prices with running mean
The NordPool market Stylized facts of power spot prices Stylized facts of electricity forwards
• Mean reversion shows up in the autocorrelation function(ACF)
• Assuming stationarity in prices
ρ(τ) = corr (S(t + τ), S(t))
• Empirically, ACF’s are often representable as sums ofexponentials,
• This means that we have several scales of mean-reversion• Fast due to spikes• Medium and slow due to “normal” price variations
• Points towards several mean-reversion factors in dynamics

The NordPool market Stylized facts of power spot prices Stylized facts of electricity forwards
• Empirical ACF of EEX spot prices
• Fitted with a sum of two exponentials• Multi-scale mean-reversion

The NordPool market Stylized facts of power spot prices Stylized facts of electricity forwards
• Spikes in spot electricity
• Spike: A large price increase followed by a rapid reversionback to normal levels
• Happens within 2-3 days• May be of several magnitudes
• Nord Pool price series

The NordPool market Stylized facts of power spot prices Stylized facts of electricity forwards
• Zoom-in of the three biggest spikes in NordPool series
• Note the rapid reversion, and magnitude of the increase
• Spikes occur in winter at Nord Pool• Other markets may not have seasonality in spike occurence• e.g. the German energy exchange EEX

The NordPool market Stylized facts of power spot prices Stylized facts of electricity forwards
• Spikes lead to highly leptokurtic spot price returns
• Example with UK electricity returns• Seasonality removed• Daily returns• Normal probability plot

The NordPool market Stylized facts of power spot prices Stylized facts of electricity forwards
• Returns are distinctively heavy tailed• Extreme events have much higher probability than the normal
distribution can explain
• Small variations have higher probability than normal
• The effect of spikes....• ...but maybe also stochastic volatility?• Deseasonalized EEX logarithmic returns:

The NordPool market Stylized facts of power spot prices Stylized facts of electricity forwards
Stylized facts of power forward prices

The NordPool market Stylized facts of power spot prices Stylized facts of electricity forwards
Empirics of power forwards
• Every day at NordPool: Available forward contracts withdifferent delivery periods
• Given weeks, months, quarters, and years• Earlier: blocks (4 weeks) and seasons• Changed delivery periods over the years
• Desirable to have a structured set of power forward prices foreach day
• Why?• To facilitate a study of empirical properties of returns

The NordPool market Stylized facts of power spot prices Stylized facts of electricity forwards
Outline of procedure
• Find a smooth curve of forward prices for each day t
F̂ (t,T1,T2) −→ F (t,T )
• T will be the ”delivery time”, t ≤ T
• Compute structured set of forward prices for each day t
F (t,T ) −→T2∑
T=T1
F (t,T )/(T2 − T1)

The NordPool market Stylized facts of power spot prices Stylized facts of electricity forwards
Constructing forward prices
• Idea is taken from interest-rate theory (forward rate/yieldcurve)
• Adams and van Deventer (1994)• Benth, Koekebakker, Ollmar (2007)
• SupposeF (t,T ) = Λ(T ) + ε(T )
• Λ seasonal structure, ε a polynomial spline, such that...
1. ...implied forward prices match observed ones (or is in bid-askspread when price does not exist)
2. ...has ”least variability” in the sense minimizing∫ τ
0
[ε′′(t,T )]2 dT

The NordPool market Stylized facts of power spot prices Stylized facts of electricity forwards
• Fourth order polynomial spline gives the solution
• Example: Data from Jan 2, 1997, seasonal structure given bya spot prognosis
The NordPool market Stylized facts of power spot prices Stylized facts of electricity forwards
Structured data set
• Available daily prices for the different power forward contracts• Collected from Nordic power exchange NordPool• Ranging from 1997 to 2005
• 1,750 daily forward curves (weekends and holidays excluded)
• Structured data• 7 weekly delivery contracts• 10 block contracts (4 weeks length of delivery)• 6 seasonal contracts (4 blocks, ie 16 weeks)
• Delivery starts sequentially, first week immediately
• All prices converted to NOK (most data in NOK, a few inEuro)

The NordPool market Stylized facts of power spot prices Stylized facts of electricity forwards
• Compute logreturns from forward prices
ri (t) = lnF (t,T1i ,T2i )
F (t − 1,T1i ,T2i )i = 1, ..., 23
• General findings are:
1. Distinct heavy tails across all segments2. No significant skewness3. Volatilities are in general falling with time to delivery
(Samuelson effect)4. Significant correlation between different segments
(idiosyncratic risk)

The NordPool market Stylized facts of power spot prices Stylized facts of electricity forwards
• Expected logreturn (left) and volatility (right)

The NordPool market Stylized facts of power spot prices Stylized facts of electricity forwards
• PP-plot to illustrate the heavy tails• NIG=normal inverse Gaussian distribution
• 45◦ line will be a perfect fit

The NordPool market Stylized facts of power spot prices Stylized facts of electricity forwards
The normal inverse Gaussian (NIG) distribution
• A normal mean-variance mixture model:• Let Z be inverse Gaussian distributed
fIG(z) =δ√2π
z−3/2 exp
(δγ − 1
2
(δ2z−1 + γ2z
)), z > 0
• Conditional distribution of X is normal:
X |Z ∼ N (µ+ βZ ,Z )
• X is NIG with parameters α, β, µ and δ, where
α =√γ2 + β2

The NordPool market Stylized facts of power spot prices Stylized facts of electricity forwards
• Density function
fNIG(x) = c exp (β(x − µ))K1
(α√δ2 + (x − µ)2
)√δ2 + (x − µ)2
• K1(x) modified Bessel function of the third kind with indexone. Normalizing constant c is known
• µ location, β asymmetry, δ scale (”volatility”), α steepness• smaller α yields steeper distribution, and thus fatter tails
δ > 0 , 0 ≤ |β| < α
• Moment generating function (MGF): for −α− β ≤ θ ≤ α− β
MNIG(θ) = exp
(θµ+ δ
√α2 − β2 −
√α2 − (β + θ)2
)

The NordPool market Stylized facts of power spot prices Stylized facts of electricity forwards
• Fitting NIG and normal to logreturns of forwards by maximumlikelihood
• Example: first week

The NordPool market Stylized facts of power spot prices Stylized facts of electricity forwards
• Shape triangle: measure the ”distance” from normality
χ = β/α , ξ = (1 + δ√α2 − β2)−1/2
• Domain for (χ, ξ): |χ| < ξ < 1
• χ measures the asymmetry• χ = 0 symmetric NIG distribution
• ξ measures the steepness (or, tail heaviness)• ξ → 1 gives Cauchy distribution, ξ → 0 gives normal
distribution

The NordPool market Stylized facts of power spot prices Stylized facts of electricity forwards
• Shape triangle parameters for the forwards• Cannot reject symmetric NIG distribution at 5%significant
level in any segment• The ”steepness” ξ larger than 0.8 in all segments

The NordPool market Stylized facts of power spot prices Stylized facts of electricity forwards
Correlation between returns
• Correlation between returns for different contracts• Various length of delivery• Various time to delivery
• Specialize to weekly contracts, over three years• Reconstruct weekly-delivery prices from smooth forward curve• Total 156 weekly-delivery forward prices every day
• Calculate the emprical correlation as a function of distancebetween delivery
• Naturally measured in terms of weeks• Study by Frestad (2009)

The NordPool market Stylized facts of power spot prices Stylized facts of electricity forwards
• Plot of log-correlation as a function of years between delivery
• Correlation decreases in general with distance betweendelivery
• ...but in a highly complex way

The NordPool market Stylized facts of power spot prices Stylized facts of electricity forwards
• A more recent study by Andresen, Koekebakker andWestgaard (2010)
• Analysis of base load quarter contracts constructed fromNordPool data
• The ”forward curve” 1 January, 2006

The NordPool market Stylized facts of power spot prices Stylized facts of electricity forwards
• Observed Samuelson effect• Volatility of forwards decrease with time to maturity• Reflection of the mean-reversion of the forward price• The influence becomes insignificant in the long end of the
market
• Plot of Nordpool quarterly contracts, empirical volatility

The NordPool market Stylized facts of power spot prices Stylized facts of electricity forwards
• Study of the correlation structure of quarterly contracts inNordPool

The NordPool market Stylized facts of power spot prices Stylized facts of electricity forwards
Summary so far
• Forward curve moves as a stochastic process parametrized bytime-to-delivery x
• Also by length-of-delivery
• Increasing volatility as we approach delivery• Samuelson effect
• Strong dependencies between maturity times• High degree of idiosyncratic risk in the market
• Non-Gaussian distributed logreturns• NIG seems to fit nicely

The NordPool market Stylized facts of power spot prices Stylized facts of electricity forwards
Some remarks on modelling and pricing of electricity
• Situation similar to that of fixed-income markets
• Spot price ↔ short rate of interest• Power spot is non-storable!• Cannot create portfolios in the spot
• Forward contracts ↔ forward rates• ... or at least zero-coupon bonds
• Modelling problem:• Spot modeling, to price forwards• What is the link between spot and forwards (Lectures II and
III)?• HJM-approach, that is, direct modeling of forward prices
(Lecture V)

The NordPool market Stylized facts of power spot prices Stylized facts of electricity forwards
Home work...
Ex. 1 Let X (t) be the solution to an Ornstein-Uhlenbeck SDE
dX (t) = (µ− αX (t)) dt + σ dB(t)
Find X (s) given X (t), s ≥ t ≥ 0.
Ex. 2 Compute the conditional expectation
E[exp(X (T )) | Ft ]
with T ≥ t.

The NordPool market Stylized facts of power spot prices Stylized facts of electricity forwards
References
• Adams and van Deventer (1994). Fitting yield curves and forward rate curves with maximum smoothness.J. Fixed Income 4
• Andresen, Koekebakker and Westgaard (2010). Modeling electricity forward prices using the multivariatenormal inverse Gaussian distribution. J. Energy Markets 3(3)
• Benth, Koekebakker and Ollmar (2007). Extracting and applying smooth forward curves from averagebased commodity contracts with seasonal variation. J. Derivatives 15(1).
• Frestad (2009). Correlations among forward returns in the Nordic electricity market. Intern. J. Theor.Applied Finance, 12(5),
• Frestad, Benth and Koekebakker (2010). Modeling term structure dynamics in the Nordic electricity swapmarket. Energy Journal, 31(2)

The NordPool market Stylized facts of power spot prices Stylized facts of electricity forwards
Coordinates:
• folk.uio.no/fredb/
• www.cma.uio.no