lecture no. 3 one component systems (water system)the phase diagram of the sulphur system has four...
TRANSCRIPT

16/04/2019 1
Lecture no. 3One Component Systems
(Water System)

2
➢ Here, one component is the smallest number by which the composition of eachphase is expressed. This means, C = 1
➢ F = C -P + 2→→ F = 1 – P + 2 = 3 – P
➢ Maximum Number of Phases:Fmin = 3 – Pmax ,
0 = 3 – Pmax
Pmax = 3
✓ This means, to define completely one component system, we have to mention two variable factors.
✓ The two variable factors can either be;Pressure and temperature, orPressure and composition, orTemperature and composition
One component system
➢ Maximum Number of F:Fmax = 3 – Pmin
Fmax = 3 – 1Fmax = 2

16/04/2019 3

16/04/2019 4
Water system
1) Water system,2) Ice system,3) Deuterium oxide system,4) Sulphur system,5) Carbon system,6) Phosphorus system.
Various examples for one component system:
❑ H2O is the only chemical compound involved→ One component system❑ Three possible phases, namely, Solid (ice), Liquid (water), vapour❑ Three forms of equilibria:
Liquid→ VapourSolid→ VapourSolid→ Liquid

16/04/2019 5
The phase diagram consists of:I. Curves. There are three curves; OA, OB,
and OC.II. Triple point. The above three curves meet
at the point O, this point is known as triplepoint.
III. Areas. The three curves divide the diagraminto three areas: AOB, AOC, and BOC.
IV. Metastable equilibrium. The curve OA`represents the metastable equilibrium.
Water (H2O) system, phase diagram,
(pressure-temperature diagram)

16/04/2019 6
Water (H2O) system, phase diagram, I. Curves:1. OA curve.
▪ It is known as the vapour pressure curve of liquidwater because it gives the vapour pressure of water atdifferent temperatures.
▪ The curve starts from O (freezing point) and ends at A(the critical temperature of water, 374°C).
▪ Critical temperature is the T at which the boundarysurface between a liquid and its vapour is disappeared.SCF!!
▪ This curve presents the equilibrium Liquid→ Vapour.This means liquid water and vapour merge into eachother.
▪ On any point on this curve, P = 2, so F = 1 - 2 + 2 = 1.▪ For any given temperature there exists a fixed value of
pressure. Similarly, for each vapour pressure,temperature has also a fixed value.
▪ For example, at 1 atm, water and vapour can be inequilibrium at one point only (the boiling point ofwater, 100°C)

16/04/2019 7
I. Curves:2. OB curve.
▪ It is known as the vapour pressure curve of ice, orsublimation curve.
▪ Along this curve, ice is in equilibrium with its vapour.▪ The curve starts at point O, and ends at point B (point of
absolute zero, -273°C). No more vapours.▪ Along this curve, there are two phases F = 1– 2 + 2 = 1,.▪ Thus, the system is univariant. This means, for each
temperature there can be one and only one pressure, andvice vesa.
▪ Please note that, the curve OB is not a prolongation ofOA, but steeps rather rapidly.
Water (H2O) system, phase diagram,

16/04/2019 8
I. Curves:3. OC curve.
▪ It is known as the melting point or fusion curve of ice.▪ This curve inclines towards the pressure axis (Y-axis).▪ This means that, the melting point of ice is lowered by
the increase of pressure. This can be understood asfollow:i. Ice and water are in equilibrium at 0°C, ice
occupies more volume than the corrospondingamount of water at the same temperature.
ii. Ice → water(more volume) (less volume)
iii. If we increase the pressure, equilibrium will shiftin that direction in which the volume is reduced. Itmeans more ice would melt into water. This alsomeans the melting point is lowered by increasingthe pressure.
iv. The freezing point of water at a pressure off4.58mmHg is 0.0098°C, whereas at higherpressure of 760mmHg, it is lowered to 0.0023°C.

16/04/2019 9

16/04/2019 10

16/04/2019 11
II. Points:
Triple point O.
▪ The point at which the three curve OA, OB, and OC meet.▪ At this point, all the three phases (ice, water, and vapour)
are co-exist.▪ F = 1 – 3 + 2 = 0, this means the three phases can only co-
exist at one temeprature and pressure (0.0075°C and4.58mmHg).
▪ At this point neither pressure nor temperature can bealtered even slightly without causing the disappearence ofone of the phases.
Water (H2O) system, phase diagram,

16/04/2019 12
III. Areas or Regions:
Areas AOB, BOC, and AOC▪ In each area, a single phase is existed. Vapour exists in AOB
area, water is only existed in the area AOC, while ice (solidphase) is existed only in the area BOC.
▪ All areas are bivariant. F = 1 – 1 + 2 = 2
IV. Metastable Equilibrium▪ Sometimes, it is possible to cool water below its freezing
point without the separation of solid ice.▪ This water is then said to be in a state of metastable
equilibrium or it is considered to be super-cooled.▪ As soon as a small ice particle is kept in contact with the
super-cooled liquid, it at once changes into the solid ice.▪ This can be presented in the diagram by the curve OA`.
Water (H2O) system, phase diagram,

16/04/2019 13

16/04/2019 14

16/04/2019 15

16/04/2019 16
Xb line
XC line
XY line
XZ line

16/04/2019 17

16/04/2019 18

16/04/2019 19
The Sulphur System
It is a one-component, four-phase system. The four phases are:
(a) Two solid polymorphic forms:
(i) Rhombic Sulphur (SR)
(ii) Monoclinic Sulphur (SM)
(b) Sulphur Liquid (SL)
(c) Sulphur Vapour (SV)
All the four phase can be represented by the only chemical individual
‘sulphur’ itself and hence one component of the system.
The two crystalline forms of sulphur SR and SM exhibit enantiotropywith a transition point at 95.6ºC.
Below this temperature SR is stable, while above it SM is the stable variety.
At 95.6ºC each form can be gradually transformed to the other and the
two are in equilibrium. At
120ºC, SM melts. Thus,

16/04/2019 20

16/04/2019 21

16/04/2019 22

16/04/2019 23
The phase diagram for the sulphur system is shown
in Figure The salient features of the phase diagram
are described below.
(i) The six curves AB, BC, CD, BE, CE, EG
(ii) The three Triple points B, C, E
(iii) The four areas:
ABG marked ‘solid Rhombic’
BEC marked ‘solid Monoclinic’
GECD marked ‘liquid Sulphur’
ABCD marked ‘Sulphur vapour’
(vi) Meta-stable triple point (F).

16/04/2019 24

16/04/2019 25

16/04/2019 26

16/04/2019 27

16/04/2019 28

16/04/2019 29

16/04/2019 30
16/04/2019 31

16/04/2019 32
(1) The curves AB, BC, CD, BE, CE, EG
These six curves divide the diagram into four areas.
Curve AB, the Vapour Pressure curve of SR. It shows the vapour pressure
of solid rhombic sulphur (SR) at different temperatures. Along this curve the
two phases SR and
sulphur vapour (SV) are in equilibrium. The system SR/SV has one degree of
freedom,
F = C – P + 2 = 1 – 2 + 2 = 1 i.e. it is monovariant.
Curve BC, the Vapour Pressure curve of SM: It shows variation of the
vapour pressure of monoclinic sulphur (SM) with temperature. SM and SV
coexist in equilibrium along
this curve. The system SM/SV is monovariant.
Curve CD, the Vapour Pressure curve of SL: It depicts the variation of the
vapour pressure of liquid sulphur (SL) with temperature. SL and SV are in
equilibrium along CD. The
two phase system SL/SV is monovariant. One atmosphere line meets this
curve at a temperature (444.6ºC) which is the boiling point of sulphur.

16/04/2019 33
Curve BE, the Transition curve: It shows the effect of pressure on the
transition temperature for SR and SM. As two solid phases are in equilibrium
along the curve, the system SR/SM is monovariant.
The transformation of SR and SM is accompanied by increase of volume
(density of SR = 2.04; SM = 1.9) and absorption of heat i.e.,
SR + Q (heat energy) ⇌ SM
Thus, the increase of pressure will shift the equilibrium to the left (Le
Chatelier’s Principle) and the transition temperature will, therefore, be raised.
This is why the line BE slopes away from the pressure axis showing thereby
that the transition temperature is raised with increase of pressure.
Curve CE, the Fusion curve of SM. It represents the effect of pressure on the
melting point of SM. The two phases in equilibrium along this curve are SM
and SL. The system SM/SL is monovariant. As the melting or fusion of SM is
accompanied by a slight increase of volume, the melting point will rise by
increase of pressure (Le Chatelier’s principle).
Thus the curve CE slopes slightly away from the pressure axis. The curve
ends at E because SM ceases to exist beyond this point.
Curve EG, the Fusion curve for SR. Here the two phases in equilibrium are SR
and SL. The number of phases being two, the system SR/SL is monovariant.

16/04/2019 34
(2) The Triple points B, C, E
Triple point B. This is the meeting point of the three curves AB, BC and BE.
Three phases, solid SR, solid SM and SV are in equilibrium at the point B. There
being three phases and one component, the system SR/SM/SL is nonvariant.
F = C – P + 2 = 1 – 3 + 2 = 0
At B, SR is changed to SM and the process is reversible. Thus the temperature
corresponding to B is the transition temperature (95.6ºC).
Triple point C. The curves BC, CD, CE meet at this point. The three phases in
equilibrium are SM, SL and SV. There being three phases and one component,
the system SM/SL/SV is nonvariant. The temperature corresponding to C as
indicated on the phase diagram is 120ºC. This is the melting point of SM.
Triple point E. The two lines CE and BE, having different inclinations away
from the pressure axis, meet at E where a third line EG also joins. The three
phases SR, SM and SL are in equilibrium and the system at the point E is
nonvariant. This point gives the conditions of existence of the system SR/SM/SL
at 155ºC and 1290 atmospheres pressure.
16/04/2019 35
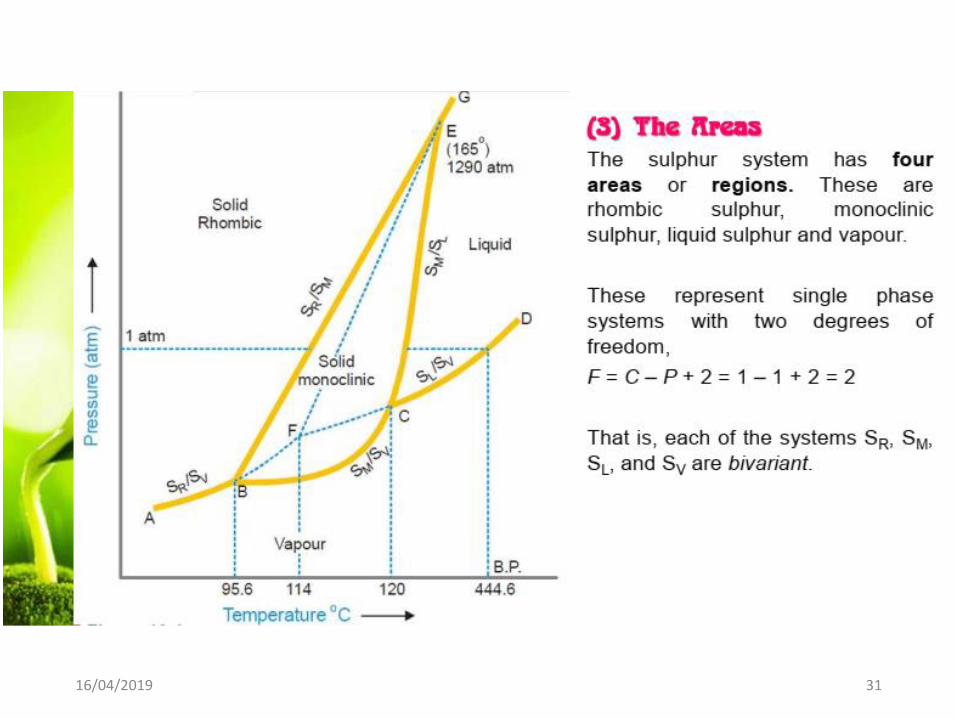
(3) The Areas
The phase diagram of the sulphur system has four areas or regions.
These are labelled as rhombic sulphur, monoclinic sulphur, liquid
sulphur and vapour. These represent
single phase systems which have two degrees of freedom,
F = C – P + 2 = 1 – 1 + 2 = 2
That is, each of the systems SR, SM, SL, and SV are bivariant.

16/04/2019 36

16/04/2019 37

16/04/2019 38

16/04/2019 39

16/04/2019 40