lecture quality management - wzl€¦ · maintenance and repair as well as assembly and...
TRANSCRIPT

Quality Management – Prof. Schmitt Lecture 12
Quality Management in Service Industries L 12 Page 0
© WZL/IPT
© WZL/Fraunhofer IPT
Lecture Quality Management
12 Quality Management in Service Industries
Prof. Dr.-Ing. Robert Schmitt
Quality Management – Prof. Schmitt Lecture 12
Quality Management in Service Industries L 12 Page 1
© WZL/IPT
Page 1© WZL/Fraunhofer IPT
Contents
� Definition of Service, Attributes and Potentials of Service
� Life Cycle and Characteristics of Service
� The Quality of Service
� Techniques of Quality Management in the Service Sector
Literature:
Quartapelle, A.; Larsen, G.: Kundenzufriedenheit. Berlin u.a.O.: Springer, 1996
Ramaswamy, R.: Design and Management of Service Processes. Reading (MA): Addison-Wesley, 1996
Statistisches Bundesamt (Hrsg.): Bruttowertschöpfung nach Wirtschaftsbereichen, http://www.destatis.de/indicators/d/vgr310ad.htm (Zugriff: 02.11.2001); Erwerbstätige nach Wirtschaftsbereichen, http://www.destatis.de/indicators/d/vgr010ad.htm (Zugriff: 02.11.2001)
Zeithaml, V.; Bitner, M.: Service Marketing. New York u.a.O.: McGraw-Hill, 1996
Zeithaml, V.; Parasurman, A.; Berry, L.: Qualitätsservice. Frankfurt a.M. u.a.O.: Campus, 1992
Deutsches Zentrum für Luft- und Raumfahrt (DLR), Projektträger für das Bundesministerium für Bildung und Forschung (BMBF)
Luczak H., Reichwald R., Spath, D. (Hg.): Service Engineering in Wissenschaft und Praxis. Die ganzheitliche Entwicklung von Dienstleistungen, Wiesbaden (Gabler Edition Wissenschaft), 2004
Herrmann, T., Kleinbeck, U., Krcmar, H. (Hrsg.): Konzepte für das Service Engineering, Heidelberg (Physica-Verlag), 2005
Vogel-Weyh, F.; Röhm, A.: „Dienstleistung - von der Renditefalle zum Wettbewerbsvorteil“, Verbesserung der Dienstleistungskompetenz hessischer Umweltunternehmen, Leitfaden für die betriebliche Praxis, TechnologieStiftung Hessen GmbH (TSH), Wiesbaden, 2002
Nitu, B.: ServCHECK: Diagnosetool für Serviceorganisationen, Zeitschrift “Unternehmen der Zukunft, 2006
Sommerlatte, T.: Relevante Wettbewerbsfaktoren im Innovations- und Wissenszeitalter. In: Energiewirtschaftliche Tagesfragen, Vol. 49, No. 12 (1999), p. 806-809.
Jonash, R. S.: The innovation premium. How next ompanies are achieving peak performance and profitability. Reading, Mass.: Perseus 1999.

Quality Management – Prof. Schmitt Lecture 12
Quality Management in Service Industries L 12 Page 2
© WZL/IPT
Page 2© WZL/Fraunhofer IPT
Contents
� Definition of Service, Attributes and Potentials of Service
Life Cycle and Characteristics of Service
The Quality of Service
Techniques of Quality Management in the Service Sector
Literature:
Biermann, T.; Dehr, G.: Kurswechsel Richtung Kunde. Frankfurt a.M.: FAZ, 1996
Bisgaard, S.: Service Quality. In: Belz, Christian; Bieger, Thomas: Dienstleistungs-kompetenz und innovative Geschäftsmodelle. St. Gallen: Thexis, 2000
Bruhn, M.: Qualitätsmanagement für Dienstleistungen. Grundlagen, Konzepte, Methoden. Berlin u.a.O.: Springer-Verlag, 1997
Deutsches Institut für Normung e.V. (Hrsg.): Service Engineering: Entwicklungsbegleitende Normung (EBN) für Dienstleistungen. Berlin u.a.O.: Beuth, 1998
Friedli, T. / Gebauer, H.: Erfolgsfaktoren für professionelles Dienstleistungsmanagement in produzierenden Unternehmen; Industrie Management 19: GITO-Verlag, Berlin, (2003) H. 5, S.74-77
Fourastié, J.: Die große Hoffnung des Zwanzigsten Jahrhunderts. Köln: Bund-Verlag, 1954
Kleinaltenkamp, M.: Der deutsche Maschinenbau im Spannungsfeld zwischen Standardisierung und Individualisierung. Aus: Widmaier, U. (Hrsg.): Der deutsche Maschinenbau in den neunziger Jahren.Kontinuität und Wandel einerBranche. Frankfurt a.M.: Campus, 2000, S. 409 - 454.
Kleinaltenkamp, M.: Service-Blueprinting – Nicht ohne den Kunden. In: technischer vertrieb, April, 2(1999), S.33-39
Hoeth U.; Schwarz, W.: Qualitätstechniken für die Dienstleistung. München u.a.O.: Hanser-Verlag, 1997
Lehman, A.: Dienstleistungsmanagement. Strategien und Ansatzpunkte zur Schaffung von Servicequelität. Stuttgart, Zürich: Schäffer-Poeschel, 1995
Luczak, H. et al.: Service Engineering. Der systematische Weg von der Idee zum Leistungsangebot. München: Transfer-Centrum. 2000
Mayers, B. / Pfeifer, T. / Steins, D. Wie man ein Produkt erfolgreich entwickelt – Die Conjointanalyse als Verfahren zur kundenorientierten Produktinnovation. QZ 42 (1997), H. 3, S. 290-292
Meffert, H.; Bruhn, M.: Dienstleistungsmarketing. Wiesbaden: Gabler, 2000

Quality Management – Prof. Schmitt Lecture 12
Quality Management in Service Industries L 12 Page 3
© WZL/IPT
Page 3© WZL/Fraunhofer IPT
From the „Service-Desert“ via the „Jungle of Service“ up to the „Garden of Service“
Time
Contribution of
Services
-
Turnover-Profit-Customer loyalty
Producing Service Providers /
Hybrid Producers
Garden of Service
Increase the
degree of professionalism in
Service Management
Source: Friedli / Gebauer (2003)
Pure producer
Service Desert
Service Jungle
-Small allocatabilitiy
-Large range of services offered
Low awareness level-
Low cost transparency
In press and media, for some years now, a rising meaning is attached to the topic Service.
It is pointed out that the so-called tertiary sector is assumed to have an obvious potential for further growth, which is limited for production industries.
Generally, it is assumed that in the long run, the companies of some production industries will no longer diversify themselves over the actual physical product but the services offered with it.
In this context, Germany is often regarded as fallow land for the service sector (“Service Desert Germany").
In the course of companies broadening their range of goods, which in the beginning happened in a non-systematic way and without exact ‘pricing’, the term ‘Service Jungle’ came up. In this case unclearly defined ranges of services as well as a lack of organisational preconditions pose a barrier to the professional service offer (Friedli/Dietrich/Gebauer, 2001).
Finally, the systematic and professional expansion of services is aimed at (‘Garden of Service‘) including transparent service portfolios and adequate pricing strategies.

Quality Management – Prof. Schmitt Lecture 12
Quality Management in Service Industries L 12 Page 4
© WZL/IPT
Page 4© WZL/Fraunhofer IPT
Constitutional Characteristics of Services
� Integration of the customer (resp. external factor*)
- the customer is tightly integrated into the service-process
- the customer is present during the delivery of service
� Individuality of the service
- the customer exerts influence on service procedure and results
- each customer has own preferences and wishes
� Simultaneousness of production and consumption- „Uno-actu-principle“ at the production of service
- No warehousing, no transportability
� Process characteristics
- the process of adding value is the service itself
- the customer buys a process
� Immateriality
- Immaterial goods are delivered (tertiary sector)
- Difficult description of immaterial product
- Difficult measurability of service quality
*external factor =
customer and those
objects
(e.g. car to repair) Sourc
e: D
IN F
achbericht75
: S
erv
ice E
ngin
eeri
ng
DIN ISO 8402 (Terms and Definitions of Quality Assurance and Quality Management) and DIN ISO 9004-2 (Quality Management- and Elements of Quality Assurance Systems. Guideline for Services) offer very universal definitions of service. But in the case of Service Design and Service Management, specific characteristics are important and define the differences between services and material products:
- Integration of the external factor
- Individuality of services
- Simultaneousness of production and consumption
- Process characteristics
- Immateriality

Quality Management – Prof. Schmitt Lecture 12
Quality Management in Service Industries L 12 Page 5
© WZL/IPT
Page 5© WZL/Fraunhofer IPT
Forms of Service in the Business-to-Business (B2B) Field
Services
Person oriented Services (B2C)
Demanded by private (groups) of people
Business oriented Services (B2B)
Demanded by organisations/companies
Joint Services
Provider = producingcompanies
Pure Services
Provider = service companies
Product Accom-panying Services
Provider = service providingproducer
Performance Contracting
Provider = producing serviceprovider Source: Kleinaltenkamp (2000)
Industrial Services
Examples:
Pure Services:
- Financial Service Provider, Logistic Service Provider
Joint Services
a) Product Accompanying Service:
- The Manufacturer sells his primary product and offers additional services such as „financing“
and „maintenance “.
b) Performance Contracting:
- Type1: The Manufacturer lets the actual main product including Full-Service for a specific period
of time at a fixed price to the customer. The manufacturer provides the service of the product
carefree; he is not responsible for the usage of the service, i.e. for the operation and thus the
personnel.
- Type 2: The manufacturer is responsible not only for the "technical side" of the contribution of
equipment, but also for the operation, i.e. the personnel. He "operates" the Service for the
equipment completely.

Quality Management – Prof. Schmitt Lecture 12
Quality Management in Service Industries L 12 Page 6
© WZL/IPT
Page 6© WZL/Fraunhofer IPT
Product-Related Services Represent the Bulk of Industrial Services
Product-related services 2002
broken down by types of service
Share of sales in turnover
27%
26%
19%
7%
6%3% 4%
8%
maintenance, repair
assembly and commissioning
planning, consulting and project planning
generation of software
documentation
professional training
Leasing, renting, financing
miscellaneous
Source: Statistisches Bundesamt (2004)
1
23
4
1
2
3
4
In the year 2002 the classical industrial/technical services were offered as product-related services most frequently. The turnovers of maintenance and repair amount to 28% of the total turnovers of product-related services; assembly and commissioning realize 26% of the total turnovers. So these both types of service constitute more than half of the offer of product-related services and can be assumed amongst the traditional services of companies from the manufacturing sector, the industrial/ technical services.
Planning, consulting and project planning follow, with a turnover of 19%, on third position. Together with maintenance and repair as well as assembly and commissioning, planning, consulting and project planning form the „Big Three“ of the product-related services. Almost three quarters of the offer are accounted by them.

Quality Management – Prof. Schmitt Lecture 12
Quality Management in Service Industries L 12 Page 7
© WZL/IPT
Page 7© WZL/Fraunhofer IPT
What Are Industrial Services?
Industrial Services
� are produced by an industrial company
� are linked to industrial goods
� bring on a non-technical potential of differentiation
� may lead to an expansion of market shares, customer
loyalty and the generation of additional sources of earnings
Quelle: ABB GmbH, www.abb.de, Stand:
20.04.2004
Source: Klapper/ Stegner (1991)
Technical potential of differentiation
Potential of cost reduction
Homogenisation material goods
Non-technical potential of differentiation by
Industrial Services
Pote
ntial of com
petition
Life cycle of new products
� Starting with high technical potential
of differentiation
� Followed by potential of cost
reduction
� Services increase the potential of
competition additionallyTime
The more homogenous or standardised material goods are, the lower the costs of production are. But the technical potential of differentiation, which adds unique selling propositions to non-cash benefits and makes them interesting compared to products of competitors, decreases. A cost-effective alternative to reach potential of differentiation is promised by the offering of industrial services.
Quality Management – Prof. Schmitt Lecture 12
Quality Management in Service Industries L 12 Page 8
© WZL/IPT
Page 8© WZL/Fraunhofer IPT
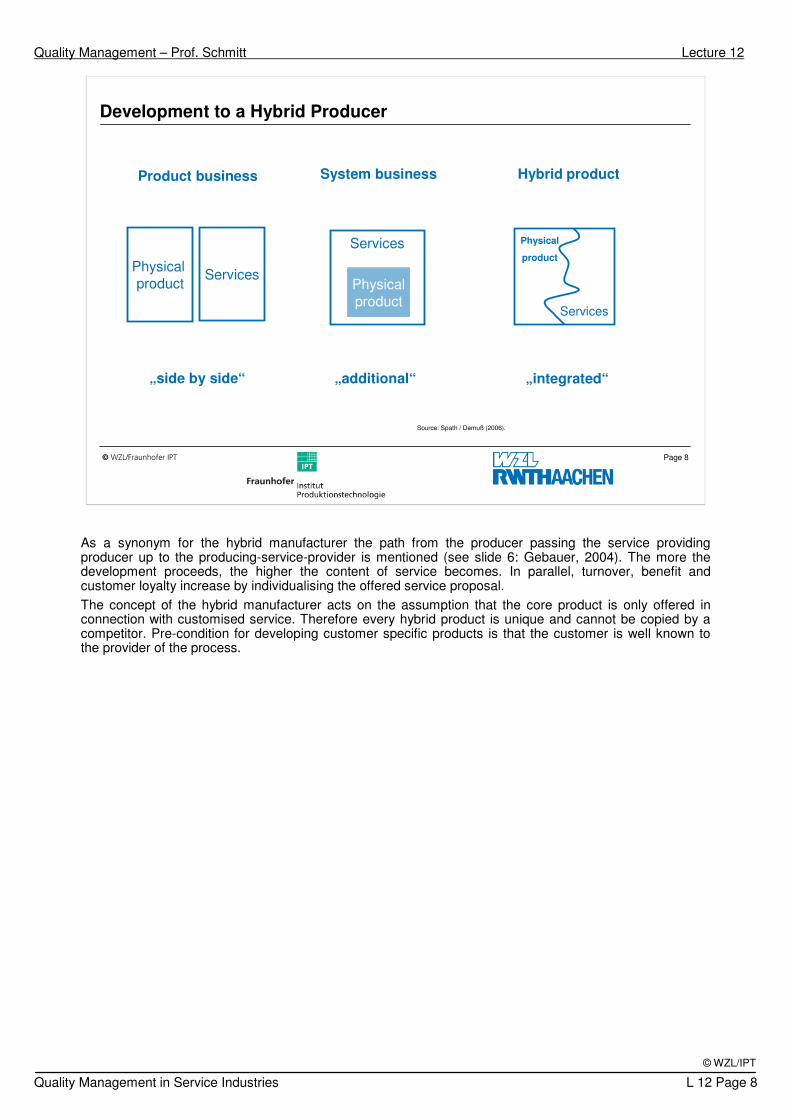
Development to a Hybrid Producer
Hybrid product
Physical
product
Services
„integrated“
Product business
Source: Spath / Demuß (2006).
Services
Physical
product Physical
product
Services
System business
„additional“„side by side“
As a synonym for the hybrid manufacturer the path from the producer passing the service providing producer up to the producing-service-provider is mentioned (see slide 6: Gebauer, 2004). The more the development proceeds, the higher the content of service becomes. In parallel, turnover, benefit and customer loyalty increase by individualising the offered service proposal.
The concept of the hybrid manufacturer acts on the assumption that the core product is only offered in connection with customised service. Therefore every hybrid product is unique and cannot be copied by a competitor. Pre-condition for developing customer specific products is that the customer is well known to the provider of the process.

Quality Management – Prof. Schmitt Lecture 12
Quality Management in Service Industries L 12 Page 9
© WZL/IPT
Page 9© WZL/Fraunhofer IPT
Company-Oriented Service Offers –From the Supplier to the Production Service Provider
Pro
du
cts
Ad
din
gvalu
e
Supplier Packager Integrator Outsourcer Operator
CustomerCustomer Customer Customer Customer
Integration
Maintenance
Production
Distribution
Integration
Maintenance
Production
Distribution
Maintenance
Production
Distribution
Production
Distribution
Integration
Maintenance
Distribution
Integration Integration
Maintenance
Production
= own products
= products from other Manufacturers
Sourc
e: K
lein
alte
nkam
p (
2000)
Different degrees of development of companies are shown:
- Step 1: Supplier
The company is a pure product supplier for its customer.
- Step 2: Packager
The company integrates its product with the one of another manufacturer and delivers the partial system to its customer.
- Step 3: System supplier
The company integrates its products and the ones of further suppliers into a complete system and delivers this sample to its customer.
- Step 4: Outsourcer
By order of the customer the company takes the responsibility for the maintenance of the supplied product.
- Step 5: Operator
The company takes over the operation of the product (Production) by order of the customer.
Principle: Taking on processes, that are not core competencies of business customers -> make products of others to your own products!

Quality Management – Prof. Schmitt Lecture 12
Quality Management in Service Industries L 12 Page 10
© WZL/IPT
Page 10© WZL/Fraunhofer IPT
Contents
Definition of Service, Its Attributes and Potentials
� Life Cycle and Characteristics of Service
The Quality of Service
Techniques of Quality Management in the Service Sector

Quality Management – Prof. Schmitt Lecture 12
Quality Management in Service Industries L 12 Page 11
© WZL/IPT
Page 11© WZL/Fraunhofer IPT
Service creation
Life-Cycle of Services
Service Engineering Service Management
Imp
lem
en
tatio
n
Se
rvic
e p
rovid
ing
Eva
lua
tio
n
Re
pla
ce
me
nt/
Re
cyclin
g
Se
rvic
e
de
sig
n
Asse
ss
cu
sto
me
rn
ee
ds
Ge
ne
rate
& a
sse
ss
se
rvic
eid
ea
s
Ide
ntify
se
rvic
ed
em
an
d
Customer orientation
Cutomer satisfaction
Increase quality Increase loyalty
Regarding the entire life-cycle of services, from Service Creation over Service Engineering to Service Management, the customer influences each phase in different ways.
This life cycle is roughly divided into two sections: the Service Engineering and the Service Management.
While Customer orientation is important during the Service Creation and the Service Engineering, customer satisfaction is essential for the supply and management of services.
The aim is to reach customer’s loyalty, to understand one’s customers and to improve service quality continuously.

Quality Management – Prof. Schmitt Lecture 12
Quality Management in Service Industries L 12 Page 12
© WZL/IPT
Page 12© WZL/Fraunhofer IPT
Product design & Process planning
Marketing & Sales
After-SalesProduction
CompanyCustomer Customer
Co
re p
roc
es
se
sServices in Production Industries
Facility-Management
Se
rvic
es P
roc
es
sd
ep
en
de
nt
Pro
ce
ss
es
ind
ep
en
de
nt
Procurement/Disposition
Toolmaking/Production facilities
Disposalof waste
Logistics Mainte-nance
Forwarding/Distribution
Personnel affairs, Training
Customer careand services
The value adding core processes of a production company can be typically separated in:
Marketing and sales, product development and production process planning, production and After-Sales-Services (customer care).
Beside the conventional After-Sales-Services, company internal services make up an important area. Those internal services are also named “support processes”.
Support processes can be divided into services being independent or dependent on the core processes, i.e. the physical product.
The depending services are e.g.: Tool-making, production facility supply, logistics and maintenance, disposal of waste etc.
The independent services are e.g.: Personnel affairs, training or facility management.

Quality Management – Prof. Schmitt Lecture 12
Quality Management in Service Industries L 12 Page 13
© WZL/IPT
Page 13© WZL/Fraunhofer IPT
Maturity Degrees For the Description of Companies‘ Fitness in the Service Sector
Vogel-Weyh / Röhm (2002)
Improvisation: no strategy, objectives or processes
Orientation: planning & wording of objectives
Definition: rules, implementation, organisation
Realisation: integrated application & measurement
Improvement: holistic Service Management
Nitu (2006)
Sommerlatte (1999)
Maturity degrees are used for:
� Analysis of potentials to reach target states
� Presentation of requirements to the Service
Provider
� Deriving actions to optimize the Service
Quality-Activated guarantee
- Assistance with
commissioning
Service as aAdd-On
Product Quality
-Customer focus
- After-Sales Support-Adjustment
assistances
-Transmission
securing
Service as a
Support
Utility Quality
-Application
Consulting
-Troubleshooting
approach
-Configuration
assistances
-Software-Tailoring
-Result securing
- Individual servicepackage
Service as a
consulting
System Quality
-Insourcing
-Value-Chain-
Partnering
- Marketing of
process-related and
functional skills
Know-How Quality
Service as aStand-alone
offer
Continuous Improvement
controlled by key figures
Introduction of a Management
System controlled by key figures
Service offer is configurated efficiently
by products and process models
Service offer is configurated customer
oriented, continuously and effective
Services are unstructured, „grow organically“, no
strategic orientation, no documented processesStep 1:
Step 2:
Step 3:
Step 4:
Step 5:
Maturity degree models often afford an approach to analyse companies in terms of potencials to reach a specific target state.
In this slide, different approaches are illustrated to describe the maturity degrees, the Service Management and the service offer.
The basis often is the Capability Maturity Model Integration (CMMI) originating from software developmentprojects. Here the steps are adapted to the perspective of analysis of companies which set out on hybrid producer/ fulfilment service provider.
In order to reach the next higher maturity, the compliance of specific requirements is important: e. g. Process orientation, mechanisms to verify the service quality. Below methods are introduced, which areable to take up the customer requirements systematically, to illustrate the service processes, to evaluateand to improve.
Steps according to Vogel-Weyh & Röhm:
Stufe 1: Services are unstructured „grow organically“, no strategic orientation, no documentedprocesses
Stufe 2: Service offer is configurated customer oriented, continuously and effective
Stufe 3: Service offer is configurated efficiently by products and process models
Stufe 4. Introduction of a Management System controlled by key figures
Stufe 5: Continuous Improvement controlled by key figures

Quality Management – Prof. Schmitt Lecture 12
Quality Management in Service Industries L 12 Page 14
© WZL/IPT
Page 14© WZL/Fraunhofer IPT
Contents
Definition of Service, Its Attributes and Potentials
Life Cycle and Characteristics of Service
� The Quality of Service
Techniques of Quality Management in the Service Sector

Quality Management – Prof. Schmitt Lecture 12
Quality Management in Service Industries L 12 Page 15
© WZL/IPT
Page 15© WZL/Fraunhofer IPT
Reasons for customer migration:
63 %
Quelle: Bruhn (2003), Kundenorientierung
63 %Bad service quality
14 %Bad product quality
9 %Price changes
5 %Changing
consumer habits
4 %Misc.
Service quality:Level of satisfaction, that may be reached
for demands, expectations and wishes of a
targeted customer segment.
Service quality:Competency of a provider
to generate the character of a serviceaccording to the customers expectations
on a certain level of request.
Level of request:
Results from the sum of the attributes/
characteristics of service.
Quelle: Bruhn (2006): Qualitätsmanagement für Dienstleistungen
Quelle: Quartepelle & Larsen (1996)
Bad Service quality is the chief cause of customer migration to competitors
Key Factor Service Quality – Reasons For Customer Migration
In the first definition by Quartepelle and Larsen the customer ranks first with his subjective necessities.
In the second definition objective (level of request) and subjective (customer expectations) criteria are considered.

Quality Management – Prof. Schmitt Lecture 12
Quality Management in Service Industries L 12 Page 16
© WZL/IPT
Page 16© WZL/Fraunhofer IPT
Customer Expectations and Service Quality
Sourc
e: Z
eitham
l/ B
itner
(199
6)
Service quality
in accordance withcustomer expectations
Desired service
Adequate service
Perfect service
Enthusiastic customer
Zone of tolerance
Frustrated customer
max.
min.
Factors of influence III
Transitory service alternatives
in case of emergencies or
service problems
Perceived service
alternatives (competition)
Self-perceived consumer role
Situational factors
Factors of influence II
Advertising & public relations
Price
Word of mouth
Past experiences with services
Personal needs
Factors of influence I
Surprising the customer, and
delighting him.
The customer demands a service as it ”could be” or rather “has to be” according to his knowledge.
The research on the subject “service quality” started in the USA in the early 1980’s. In 1983, an extensive research program started at the Marketing Science Institute, Cambridge (MA), out of which the result was the so called GAP-Model of service quality.
The GAP-Model is based on empirical examinations and concentrates on the customer’s expectations towards a service:
- How do customer expectations arise?
- What kind of factors influence this process?
The core of this model is the distinction between desired and acceptable service. Between those two levels lies the zone of tolerance. This range of customer expectations has a dynamical character. Especially the level of acceptable or adequate service quality changes according to:
- Service-level itself (luxurious dinner vs. fast-food-meal)
- Competitors’ service (fast-food-restaurant that offers free refill.)
- Frequency or availability of service supply (normal opening hours vs. 24 hours)
Following measures can influence the perceived Service Quality:
- Market research in order to learn about customer needs
- Customer survey in order to hear opinions on offered services
- Availability of Service Guarantee in order to propose stability for immaterial good
- Secure Service-Supply, even in busy times
- High performance level to underline price premium
Quality Management – Prof. Schmitt Lecture 12
Quality Management in Service Industries L 12 Page 17
© WZL/IPT
Page 17© WZL/Fraunhofer IPT
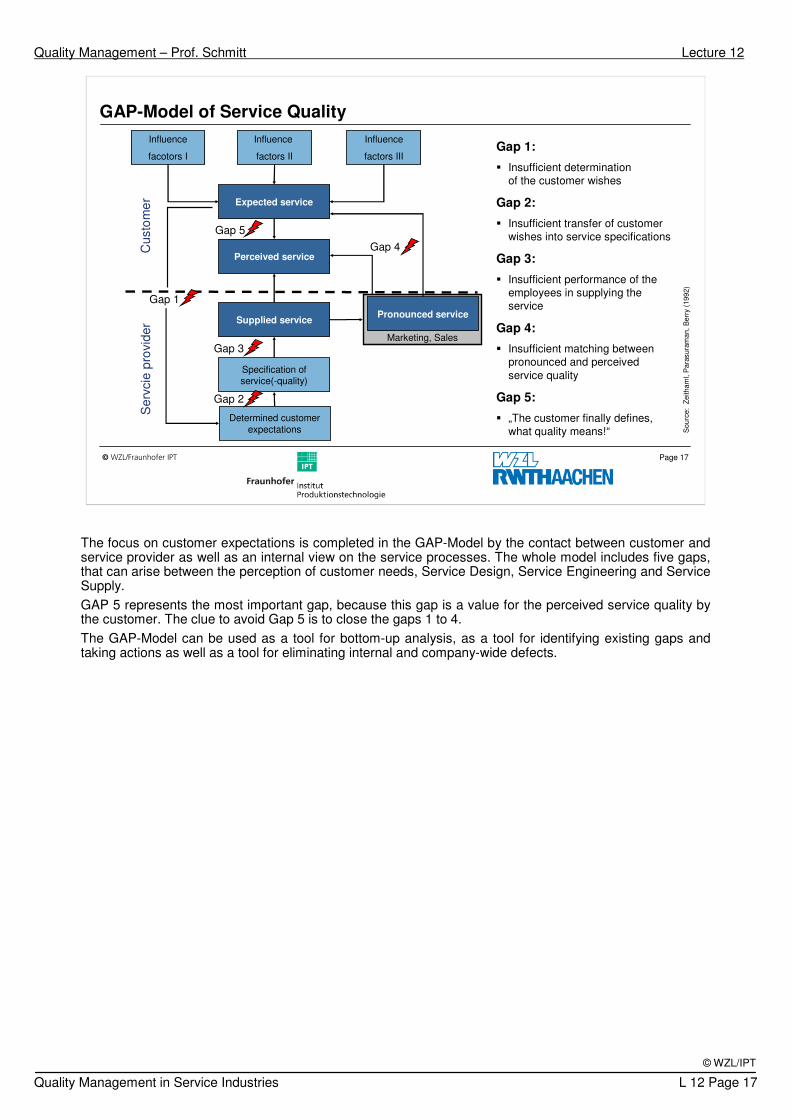
GAP-Model of Service Quality
Sourc
e: Z
eitham
l, P
ara
sura
man,
Berr
y (1
992)
Gap 1:
� Insufficient determination
of the customer wishes
Gap 2:
� Insufficient transfer of customer
wishes into service specifications
Gap 3:
� Insufficient performance of the
employees in supplying the
service
Gap 4:
� Insufficient matching between
pronounced and perceived
service quality
Gap 5:
� „The customer finally defines,
what quality means!“
Specification ofservice(-quality)
Determined customer
expectations
Influence
facotors I
Influence
factors II
Influence
factors III
Expected service
Cu
sto
me
rS
erv
cie
pro
vid
er
Gap 5
Gap 4
Gap 3
Gap 2
Gap 1
Supplied service
Perceived service
Marketing, Sales
Pronounced service
The focus on customer expectations is completed in the GAP-Model by the contact between customer and service provider as well as an internal view on the service processes. The whole model includes five gaps, that can arise between the perception of customer needs, Service Design, Service Engineering and Service Supply.
GAP 5 represents the most important gap, because this gap is a value for the perceived service quality by the customer. The clue to avoid Gap 5 is to close the gaps 1 to 4.
The GAP-Model can be used as a tool for bottom-up analysis, as a tool for identifying existing gaps and taking actions as well as a tool for eliminating internal and company-wide defects.
Quality Management – Prof. Schmitt Lecture 12
Quality Management in Service Industries L 12 Page 18
© WZL/IPT
Page 18© WZL/Fraunhofer IPT
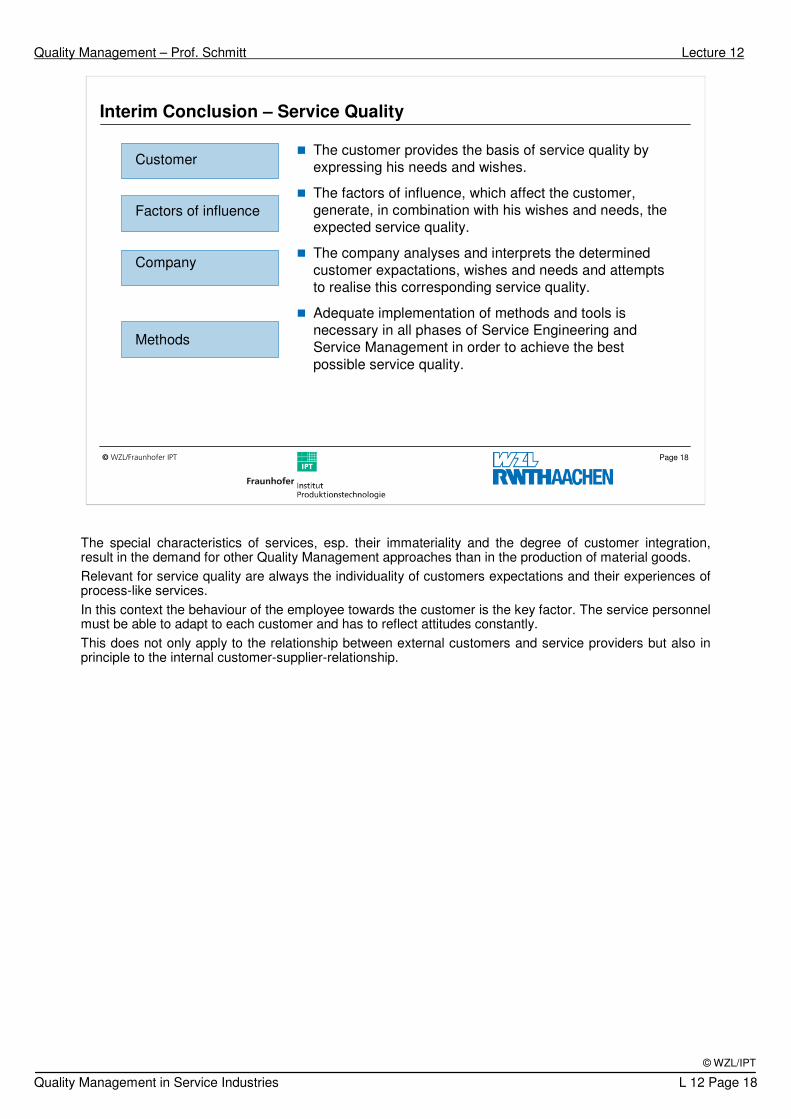
Interim Conclusion – Service Quality
� The customer provides the basis of service quality by
expressing his needs and wishes.
� The factors of influence, which affect the customer,
generate, in combination with his wishes and needs, the
expected service quality.
� The company analyses and interprets the determined
customer expactations, wishes and needs and attempts
to realise this corresponding service quality.
� Adequate implementation of methods and tools is
necessary in all phases of Service Engineering and
Service Management in order to achieve the best
possible service quality.
Customer
Factors of influence
Company
Methods
The special characteristics of services, esp. their immateriality and the degree of customer integration, result in the demand for other Quality Management approaches than in the production of material goods.
Relevant for service quality are always the individuality of customers expectations and their experiences of process-like services.
In this context the behaviour of the employee towards the customer is the key factor. The service personnel must be able to adapt to each customer and has to reflect attitudes constantly.
This does not only apply to the relationship between external customers and service providers but also in principle to the internal customer-supplier-relationship.
Quality Management – Prof. Schmitt Lecture 12
Quality Management in Service Industries L 12 Page 19
© WZL/IPT
Page 19© WZL/Fraunhofer IPT
Contents
Definition of Service, Its Attributes and Potentials
Life Cycle and Characteristics of Service
The Quality of Service
� Techniques of Quality Management in the Service Sector

Quality Management – Prof. Schmitt Lecture 12
Quality Management in Service Industries L 12 Page 20
© WZL/IPT
Page 20© WZL/Fraunhofer IPT
Company focusedCustomer focusedCustomer focusedCompany focused
Objective evaluation methodsSubjective evaluation methods
Overview of Methods For Service-Quality-Evaluation
Source: Bruhn (1997) p.61
� Statistic quality control
� Quality awards
� Quality audits
� Benchmarking� Quality Function
Deployment
(Service-QFD)
� Service-FMEA� Poka-Yoke
� Expert sighting� Silent Shopper
Method
� Product testing
� Contact-Point-Analysis
� Vignette-Technique
� Servqual� Conjoint-Analysis
Feature orientedmethods
� Blueprinting� Critical-Incident-
Technique
Event oriented methods
Problem oriented methods
� Complaint-
Analysis� Problem-
Detecting-
Method
There are several methods to evaluate the service quality. Those can be summarized in different groups according to effort, focus and customer influence.
An exception is the Contact-Point-Analysis being customer focused but supporting objective but also subjective results and thereby being classified as a feature as well as an event oriented method.
Benchmarking: Comparison of company processes and results. Evaluation by certain reference parameters.
The Critical-Incident-Technique deals with strengths and weaknesses of the service process. Acquiring and evaluating so called critical events.
Poka-Yoke: Rules to avoid failures/defects. Prevention of unintended and random failures/defects, reaching for the goal of realising the zero-defect-principle.
Problem-Detecting-Method: Centers the questioning of customers for specific problems and their judging.
Silent Shoppers are test shoppers, which simulate “realistic” service situations, without the awareness of the employees.

Quality Management – Prof. Schmitt Lecture 12
Quality Management in Service Industries L 12 Page 21
© WZL/IPT
Page 21© WZL/Fraunhofer IPT
Pro
cess o
rie
nta
ted
Qua
lity M
an
ag
em
ent
Quality Tools For Service Engineering and Service Management
ServiceEngineering
Service
Management
Quality Function
Deployment
Service
Blueprinting
Vignette-Technique,
Conjoint Analysis
Service-
FMEA
Problem orientated
procedures
Servqual
CIP-
Projects
� Transfer customer expectations in service functions
� Modelling of function fulfilling service processes
� Assessment of service options according to
customer satisfaction
� Preventive detection and avoidance of failures
� Management of complaints
� Appraising customer satisfaction
� Continuous improvement processes
Pro
ject
man
ag
em
ent/
Qua
lity-G
ate
s-C
once
pt
SLA � Specification of the scope of services
Quality Management for Service Engineering and Service Management
The development of services is similar to the development of technical products. Various QM-methods can be derived from of the product development and can be adopted or used in a similar way.
Furthermore special methods and tools for services exist, e.g. Service Blueprinting or the Vignette-Technique.
While supplying services, the Quality Management focus lies on the assessment of the service quality. Through this, it can be assessed, if
- customer’s expectations really are identified and fulfilled.
- defects, that have to be eliminated, still exist.
- customer’s expectations changed and customisation becomes necessary.
Quality Management offers various methods and procedures for all of these tasks, which are primarily used in the production of goods, but can also be applied to the service sector.

Quality Management – Prof. Schmitt Lecture 12
Quality Management in Service Industries L 12 Page 22
© WZL/IPT
Page 22© WZL/Fraunhofer IPT
Determined
service-levels
Deployment of Customer Demands in Service Functions
Determine target group
Pre-survey
Acquire
customer needs
Essential
service functions
Assess
customer needs
Correlation matrix
“conflicts between
service functions“New service idea
Assessed
customer needs
Comparison
with competitors for
customer’s purposes
Comparison with competitors
for service providers’ purposes
Significance of
service functions
Design-
team
Critical quality
characteristics
Correlation matrix
„service functions–
customer demands“
Service functions for
fulfilling customer
demands
The Service QFD Method
Objective:
The systematical transfer of the acquired customer expectations into service functions can be performed by the method “Quality Function Deployment” (QFD). (q.v. L/ E 8)
Procedure:
It is functional for a service provider to:
- Realise several concrete projects with quantifiable quality objectives,
- Determine the available resources
- Select employees and customers, which should be involved in the project.
In this connection it makes sense to involve all these employees which work on service processes which are closely related to the quality and project objectives.
For example, if the project objective would be „waiting time reduction at the counter about 10 % “, it makes sense to involve employees of the front office, back office and IT-department as well as bank manager and concerned customers in the QFD-project.
After the QFD-project, it has to be checked in pilot projects, if the developed measures will be accepted and appreciated by the customer.
Benefit:
-Early detection of risks and benefits
-Integration of staff
Risks:
-Organisational effort for complete tracing of implied measures

Quality Management – Prof. Schmitt Lecture 12
Quality Management in Service Industries L 12 Page 23
© WZL/IPT
Page 23© WZL/Fraunhofer IPT
This page stays empty for technical reasons
The Service QFD Method
Advantages:
- Clear and logical structured steps bring a high level of arrangement and discipline to the project team. Often, only the formalism makes clear complex processes and reveals weak points.
- Early detection of conflicts of objectives (costs vs. quality)
- Increase of motivation will be more probable by early meeting and cooperation.
- New cognitions could be integrated online.
- Furthermore a high level of cost transparency occurs.
Disadvantages:
- QFD induces high effort, especially during the time of adoption.
- The QFD requires a time- and cost intensive discussion within a team of experts from each considered department.
- Not everybody is open minded compared to the used methods (e.g. brainstorming) and qualified as a team member.
Consequent trace of QFD ensures, that the product characteristics have a high overlap with customer requirements and that the resources of the firm could be concentrated on essential, i.e. favoured attributes by the market or by the customer.

Quality Management – Prof. Schmitt Lecture 12
Quality Management in Service Industries L 12 Page 24
© WZL/IPT
Page 24© WZL/Fraunhofer IPT
Characteristic
€ 90,- € 180,-
(20) (0)
Occurrences
Service availability 8 am - 6 pm 8 am - 9 pm 24 h / 7 days
(0) (7) (7)
Service-response time latest next day within 6 hours within 3 hours
(0) (10) (20)
Contact person: Changing Contact persons steady Support-Team
(0) (14)
Special hotline not present present / inclusive
(0) (18)
Operating system without update of operating system with update of operating system
(0) (19)
Price service-agreement / month
€ 120,- € 150,-
(12) (8)
Derive Willingness to Pay by Using Conjoint-Analysis
Que
lle: K
lein
alte
nkam
p (
20
00)
� Based on preference values
� Often used in consumer goods industry
� Statistical evaluation complex
� Used seldomly in engineering
Key:
Numbers in brackets: Number of
nominations by preference interviews
The Conjoint-Analysis Method
Objective:
The Conjoint-Analysis goes back to a work of the psychologist LUCE and the statistician TUCKEY (1964).
With the help of a Conjoint-Analysis (CA) preference values of consumers can be determined for given characteristics (importance), for their occurrences (partial benefits) as well as for combinations of certain characteristics and/or characteristic occurrences (total benefit) for a product and/or a service. The Conjoint-Analysis allows the examination of hypothetical product or service offers by linking certain characteristics to a nearly arbitrary combination of these characteristics.
In the field of the price determination, Conjoint-Analyses are frequently used in order to supply the database for the calculation of the prospective price-sales function for a product on a given market and/or competition field.
With the data of the Conjoint-Analysis a market simulation can be realised. It is used to calculate the price for a given product that yields the optimum profit for the manufacturer.
Procedure:
1. Select characteristics and occurrences
2. List all generated combinations
3. Arrange a customer survey:
- Present the types of service
- Evaluate the types of service via paired comparison
4. Determine the favoured type of service (type of service with highest customer popularity)
Benefits:
- Quantitative method allows subjective ratings to be converted to objective indicators
- Basis for pricing and pricing transparency
Risks:
- Only usable by experts or by use of special software
- Can only include pre-articulated ideas and not new ideas in the process of rating
Quality Management – Prof. Schmitt Lecture 12
Quality Management in Service Industries L 12 Page 25
© WZL/IPT
Page 25© WZL/Fraunhofer IPT
This page stays empty for technical reasons
The Conjoint-Analysis Method
Advantages
- Quantitative determination of the benefits and desires of internal and external customers
- Optimal controlling of R&D resources due to the knowledge of profit rates and ranges
- The influence of subjective characteristics (benefits, imageries) on objective characteristics becomes
transparent.
- By applying adequate software following disadvantages can be reduced or eliminated.
Disadvantages
- Time- and cost intensive
- Extensive statistic-mathematical knowledge necessary
- Past-oriented, conservative gathering of the product characteristics
- The profile method is applicable only for simple products with few characteristics
- The preselection of the characteristics is affected by subjectivism.

Quality Management – Prof. Schmitt Lecture 12
Quality Management in Service Industries L 12 Page 26
© WZL/IPT
Page 26© WZL/Fraunhofer IPT
Que
lle: H
oe
th(1
99
7)
Generate the theoretically possible number of vignettes:
Z = nk with n = number of possible values
with k = number of quality characteristics
Listing of all generated
combinations (vignettes)
1
Conduction of a customer survey:
� Presentation of all vignettes
� Assessing all vignettes
by pair wise comparison
2Availability
Promtptness
Individuality
Value 1
Normal hours
of business
3-4 days
Standard procedure
Value 2
24 h-Service
1 day
Various levels
of service
Characteristic
kValue kn=1 Value kn=2
...
...
...
vignette 1 vignette 2
Customer‘s favourite
service option
Determination of the favourite
service option
3
Assessment of Service Variants According to Customer Satisfaction
How does the customer perceive different
values of quality characteristics?
Quality
characteristics
Use of the Vignette-Technique
(or Conjoint-Analysis etc.)
The Vignette-Technique Method
Objective:
The Vignette-Technique allows to gather assessments from the customer about the quality of services, that
are still to be developed and are not offered on the market yet.
While developing services, the Vignette-Technique tries to realise the fictive services by scenarios.
Proceeding:
The Vignette-Technique is based on the Conjoint-Analysis. The value for the cumulated degree of
satisfaction is achieved by adding up the partial results. Each vignette represents a combination of different
quality characteristics and their respective values. The customer evaluates by means of pairwise
comparison, which of the service packages represented on the vignettes is preferred by him.
Advantages:
The effort for this method is especially worthwhile for complex services, that offer different possibilities in
designing quality features.
Disadvantages:
As with all attribute-oriented procedures, the determination of the relevant quality characteristics
beforehand is of great importance, since the customer does not decide himself which Service combinations
he can have or choose from. Preceding studies such as expert interviews are inevitable. In addition a
survey participant is easily overstrained by the multiplicity of characteristics. If the chosen values are not
balanced within one quality characteristic and/or if no price/cost relation is defined, the test customers
obviously tend to select the superior value.
The differnce between Conjoint-Analysis and Vignette-Technique is the analysis of characteristics. The
Conjoint-Analysis surveys the affinity and the Vignette-Technique the difference of the particular
characteristics.

Quality Management – Prof. Schmitt Lecture 12
Quality Management in Service Industries L 12 Page 27
© WZL/IPT
Page 27© WZL/Fraunhofer IPT
Basic service
process
Modelling and Visualising of Service Processes
Sourc
e: K
lein
alte
nkam
p(1
999)
Onstage activities
Backstage activities
Support activities
Preparation activities
Facility activities
Line of interaction
Line of visibility
Line of internal interaction
Line of order penetration
Line of implementation
Serv
ice p
rovid
er’s a
ctivitie
s
Invis
ible
activitie
s
Secondary
activitie
s
Pote
ntial-
activitie
s
Custo
mer
induced a
ctivitie
s
Service provider’s
activities
Customer’s
activities
Specificevent
FSource of
failure
Decision
Activities’input-/output
Perceived by the
customer
Service Blueprinting
Customer activities
These levels differ in how “far” they are away from the customer.
- Customer Activities: ↑ „line of interaction“: all activities that are arranged and induced by the customer
- Onstage Activities: „line of interaction“ � „line of visibility“: all directly customer-induced activities in interaction with service provider, the customer notices
- Backstage Activities: „line of visibility“ � „line of internal interaction“: all directly customer-related activities, that have to be performed by the customer-interfaces, human or machine, but cannot be experienced by the customer.
- Support Activities: line of internal interaction“ � „line of order penetration“: customer-information is implemented to customer-deserved service by internal divisions. (e.g. IT-support)
- Preparation Activities: line of order penetration“ � „line of implementation“: all activities, that are used for the opening up of new markets or service-preparation, but are not directly depending on a concrete customer order.
- Facility Activities: ↓ „line of implementation“: all activities that provide „Facilities“ to guarantee the efficiency of the company.

Quality Management – Prof. Schmitt Lecture 12
Quality Management in Service Industries L 12 Page 28
© WZL/IPT
Page 28© WZL/Fraunhofer IPT
Modelling and Visualisation of Service Processes
Onstage-Activities
Backstage-Activities
Support-Activities
Line of interaction
Line of visibility
Line of internal interaction
Line of order penetration
Activitie
s d
irectly
induced b
y t
he c
usto
mer
Customer Activities
1. Call IT-Hotline: „Modem
doesn‘t work“
2. Telephone
based fault analysis
5. Internal fault analysis & repair
3. Filing of repairorder
6. Sending
modem back to customer
4. Returning
modem
4. Returning
modem
1. Call IT-Hotline: „Modem
doesn‘t work“
2. Telephone
based fault
analysis
3. Filing of repairorder
5. Internal fault analysis & repair
6. Sending
modem back to customer
… … …
The Service Blueprinting Method
Objective:
The modelling of service processes according to functionality.
Proceeding:
- Picture the service process as well as all the participating activities
- Assign all the activities – independent from the organisational unit - to different levels.
Advantages:
- Service Blueprinting enables the planning and modelling of services in special consideration of the customers point of view
- Service Blueprinting can be used for analyses (failure analysis, potentials for optimisation, calculation of time and cost, etc.)
- Involved organisational units become transparent
- Service Blueprinting is easy to understand
Disadvantages:
- Not qualified for complex processes (wanting straightforwardness)
- Inadequate documentation of requiered ressources
- There is no explicit software support for Service Blueprinting
- It is diffcult to integrate variants

Quality Management – Prof. Schmitt Lecture 12
Quality Management in Service Industries L 12 Page 29
© WZL/IPT
Page 29© WZL/Fraunhofer IPT
Preventive Avoidance of Failures and Critical Situations
Sourc
e: H
oeth
(199
7);
Gogo
ll(1
99
5)
Sources of information for the FMEA (examples):
Service Blueprint
a) Front-office-processes, means above the line of visibility � Online-FMEAb) Back-office-processes, means below the line of visibility � Offline-FMEA
Quality Function Deployment and Vignette-Technique
� Critical quality characteristics and their specific values
Particular importance of the FMEA for services:
1. Uno-actu-principle � Failures can’t be removed easily or can’t be removed at all.
2. Customer’s integration � What can/ could the customer do wrong?
Severity
Dete
ction
Occur-
rence
Risk-
Assessment
Severity
Dete
ction
Occur-
rence
Risk-
Assessment
Reason ActionsResponsible
person
Service
process
Possible
failures
Failure
consequence
The Service-FMEA Method
After determining the customer favourite service alternative and having modeled all necessary service
processes, possible sources of failure and critical situations must be detected and eliminated.
Therefore, the well known method “Failure Modes and Effects Analysis” (FMEA) can be used. The
particularity of the service-FMEA is its focus on the service process and especially on processes, that are
perceived by the customer (see Service Blueprinting).
Objective:
Prevention of failures and critical situations
Proceeding FMEA:
1. Preparation
2. Assembling FMEA-Team
3. Analysis
4. Function and function structure
5. Failure analysis
6. Realising risk assessment on the basis of failure analysis (pt. 5) and expressing as Risk Priority
Number (RPN)
7. Optimisation
Advantages:
- Determining of all possible potential types of failures of the product or process
- Determining of activities to prevent the occurrence of failure
- Good documentation of the product and the process
Disadvantages:
- Subjective und tedious proceeding
- Focussing on types of failure and not on the cause-and-effect chain of incidents
- Aspects of the process or the product, which could be described directly by measured values, are
ignored.

Quality Management – Prof. Schmitt Lecture 12
Quality Management in Service Industries L 12 Page 30
© WZL/IPT
Page 30© WZL/Fraunhofer IPT
ServiceLevel
Agreement
ServiceLevel
Agreement
Service Level Agreement as a Crucial Management Instrument
� Service development
– Definition of the service proposal
� Resource management
– Agreement on provided service
resources
� Customer-supplier relationship
– Agreement on rights and duties of
customers and suppliers (service
provider)
� Evaluation
– Determination of measurable service-
level criteria
– Agreement on evaluation methods and
intervals
• Purpose
• Contractual partner • Changelog
• Service description
• Responsibility service provider
• Responsibility service recipient • Availability of service
• Standards
• Job-Planning / -Maintenance
• Service-Level-Parameters
• Measuring-period
• Monitoring and reporting
• Miscellaneous definitions
• External contracts • Pricing
• Legal ramifications of regulation violations
• Contract duration
• Signatures
Contents
The Service Level Agreement Method
Objective:
To clarify, between customer and supplier, which service the internal service provider has to provide to what extent and costs.
Proceeding:
The so-called Service Level Agreement can be understood as the basis of the approaches introduced here: An agreement between internal customer and supplier referring to the service degree within the different service products, which is obliging.
- Referring to Service Engineering, the service offer must be described in its full range
- The service level must be expressed by indicators on availability
- Assessing the compliance of the Service Level Agreements, measurement categories of each service are to be defined and their assessment methods and frequency are to be declared.
- The activity quantity describes how much capacity is actually provided by the service provider and has to be fixed in the Service Level Agreement.

Quality Management – Prof. Schmitt Lecture 12
Quality Management in Service Industries L 12 Page 31
© WZL/IPT
Page 31© WZL/Fraunhofer IPT
This page stays empty for technical reasons
The Service Level Agreement Method
Advantages:
- Determination of objectives and measured variables
- Better presentability of the performance of service provider:
- More transparency
- More comparability
- Reaching the balance between customer needs and the economic/technical capabilities by service provider and service customer
- Effect a better defining of performances of the service provider
- Reaching clear conceptions of the roles, responsibilities and requirements of service provider and service customer (by means of an accountability- and function delimination matrix)
- Optimise continuously the cooperation between service provider und service customer
- Put the planning on a company footing
Disadvantages:
- Expectations of the service customer are often too high:
- 99,99 % availability,
- Extremely long periods of service time,
- No data loss.
It is essential to find the balance between requirements and economic/technical capabilities!
Altogether, the Service Level Agreement comprises a lot of Quality Management elements.

Quality Management – Prof. Schmitt Lecture 12
Quality Management in Service Industries L 12 Page 32
© WZL/IPT
Page 32© WZL/Fraunhofer IPT
ServQual: Determination of the Customer Satisfaction
Source: Parasuraman, Zeithaml, Berry (1985)
„Tangibles“
„Reliability“
„Responsiveness“
„Assurance“
„Empathy“
Physical environment, equipment
and employees’ outside
Ability, to provide the pronounced service
reliably and accurately.
Willingness to help the customer
and to offer a prompt service.
Employee’s competence, politeness and professional
skill to build up customer’s confidence.
Best care and individual attention
towards the customer.
Service
quality
Perceived
service
Expected
service
=
–
Actual state
Target state
77
I totally agree! I do not agree at all!
114466 55 33 22
77 114466 55 33 22
Servqual - Quality dimensions
Servqual double scale
The ServQual Method
Objective:
The method SERVQUAL (SERVice QUALity) is based on perceptions of the GAP-model and focuses on GAP 5. The result is an evaluation of the service quality as difference between customer expectations towards the service and his perception of the supplied service.
The method was developed by Zeithaml, Parasuraman, and Berry. It is a multi-attributive procedure of the satisfaction research and bases on measurement techniques of the empirical social research. ServQualacquires a differentiated view of the subjective perception from the customer’s point of view by asking about goods and bads of defined quality dimensions.
Proceeding:
First the customer is asked by a standard questionnaire how the service should be ideally (expectations). Then, he is asked how the service really was perceived (perception). The difference between both values represents the necessity of improvement actions.
Example: In excellent restaurants you are never too busy to consider particular customer demands!
Expectation = 5
Perception = 2
Difference: 2 - 5= -3
Advantages:
- Diversified applicability
- Good validity
- Oblique quote request
- Survey of effective customers
Disadvantages:
- twin scale demands a qualified judgement from the test person.
- Possible “inflation of requirements” caused by exaggerated expectations
- Building the difference leads to falsifying values

Quality Management – Prof. Schmitt Lecture 12
Quality Management in Service Industries L 12 Page 33
© WZL/IPT
Page 33© WZL/Fraunhofer IPT
Conclusion
� Company-related services are “the” growth sectorwithin the service economy.
� Company-related services represent an important starting
point for industrial companies to achieve advantagesover market competitors.
� Customer oriented creation of performance attributes is
the key for the development of services and products.
These attributes need to be performed professionally
when it comes to serving the customer. To know about
the customers’ willingness to pay is just as important as
the knowledge of your own costs.
� A variety of methods is available to systematically
enhance the quality of services during their creation and
their provision and to safeguard their success from a
customer‘s point of view.