lee, april unrisd
TRANSCRIPT
1
Lee, April 2007
UNRISD UNITED NATIONS RESEARCH INSTITUTE FOR SOCIAL DEVELOPMENT
“Social policies and private sector participation in water supply – the case of Malaysia”
Cassey Lee Hong Kim
University of Nottingham, Malaysia
prepared for the UNRISD project on
“Social Policy, Regulation and Private Sector Involvement in Water Supply”
DRAFT WORKING DOCUMENT Do not cite without the author’s approval

2
The United Nations Research Institute for Social Development (UNRISD) is an autonomous agency engaging in multidisciplinary research on the social dimensions of contemporary problems affecting development. Its work is guided by the conviction that, for effective development policies to be formulated, an understanding of the social and political context is crucial. The Institute attempts to provide governments, development agencies, grassroots organizations and scholars with a better understanding of how development policies and processes of economic, social and environmental change affect different social groups. Working through an extensive network of national research centres, UNRISD aims to promote original research and strengthen research capacity in developing countries. Research programmes include: Civil Society and Social Movements; Democracy, Governance and Well-Being; Gender and Development; Identities, Conflict and Cohesion; Markets, Business and Regulation; and Social Policy and Development. A list of the Institute’s free and priced publications can be obtained by contacting the Reference Centre.
UNRISD, Palais des Nations 1211 Geneva 10, Switzerland
Tel: (41 22) 9173020 Fax: (41 22) 9170650
E-mail: [email protected] Web: http://www.unrisd.org
Copyright © United Nations Research Institute for Social Development (UNRISD). This is not a formal UNRISD publication. The responsibility for opinions expressed in signed studies rests solely with their author(s), and availability on the UNRISD Web site (http://www.unrisd.org) does not constitute an endorsement by UNRISD of the opinions expressed in them. No publication or distribution of these papers is permitted without the prior authorization of the author(s), except for personal use.
3
Contents 1. Introduction 2.The water sector in Malaysia 2.1. Role of water sector in development 2.2. Water resources 2.3. Design capacity and production 2.4. Water coverage 2.5. Water consumption 3. Water institutions in Malaysia 3.1. Public and private participation 3.2. Financial performance in the water sector 3.3. Private water companies 4. Social and economic regulation in the water sector 5. Water tariff in Malaysia 5.1. Water tariff structure 5.2. Tariff revision 5.3. Affordability: Lifeline Consumption 5.4. Recent regulatory reforms 5. Evidence from household expenditure data 5.1. Data source 5.2. Equity 5.3. Access 5.4. Affordability 6. Conclusion References

4
1. Introduction Infrastructure development has been an important component of Malaysia’s economic development strategy since the country’s independence in 1957. Significant amount of investments were made in the infrastructure sector to enhance and maintain the country’s export competitiveness. These investments have also contributed to the eradication of poverty and the elevation of the quality of life in the country. However, despite the progress made in these areas, infrastructure development across and in the different sectors has been uneven.
In the water sector, the more developed states have achieved almost universal access while others continue to struggle with providing access to treated water supply particularly in the rural areas. The inability to recover revenue from water produced (non-revenue water) continues to be a serious problem in the sector. Underinvestment in the sector has also resulted in the deterioration of the water distribution systems.
In Malaysia, water is constitutionally a state matter and some states have opted to privatise their water sector. However, there is currently no consensus on whether privatisation is the solution to water problems in Malaysia. Implicitly, some states continue to support privatisation but others have no plans to privatise their water sector. Many non-governmental organizations (NGOs) continue to vehemently object to privatisation of the water sector. Surprising, despite the significant amount of interest generated by the debate on the efficacy of privatisation, there has been no empirical studies on the issue.
This chapter attempts to shed some light on the impact of privatisation in the Malaysian water sector by employing a quantitative-based empirical analysis. Malaysia is useful country case study on the impact of privatisation in the water sector. There is a variety of forms of institutions in its water sector – full privatisation, partial privatisation and state. The country is also a developing economy, with a significant rural area where access to treated water continues to be serious problem. Thus, the Malaysian water sector provides an opportunity for an empirical test of the impact of privatisation in a developing economy. Finally, this is the first study of the Malaysian water sector using household expenditure data.
The outline of the rest of the chapter is as follows. A brief background of the water sector in Malaysia is presented in the next Section. This is followed by a discussion of water institutions in Malaysia. In the subsequent Section, we examine social and economic regulation in the sector. Next, water tariffs are discussed. Issues of equity, access, and affordability are examined in the following Section using household expenditure data. The last Section concludes. 2.The water sector in Malaysia 2.1. Role of water sector in development Infrastructure development has made significant contributions to Malaysia’s economic growth and development since the country’s independence in 1957.1 Malaysia’s success in transforming its economy from one dependent on primary commodity exports in the 1 See Naidu and Lee (1997) for further discussions.
5
1950s and 1960s (e.g. rubber and tin) to one based on manufacturing activities is partly due to the government’s emphasis on investments in infrastructure development. Foreign direct investment has played a significant role in the development of the manufacturing sector in Malaysia. The availability of efficient infrastructure has been instrumental in attracting foreign direct investment (FDI) in the manufacturing sector.
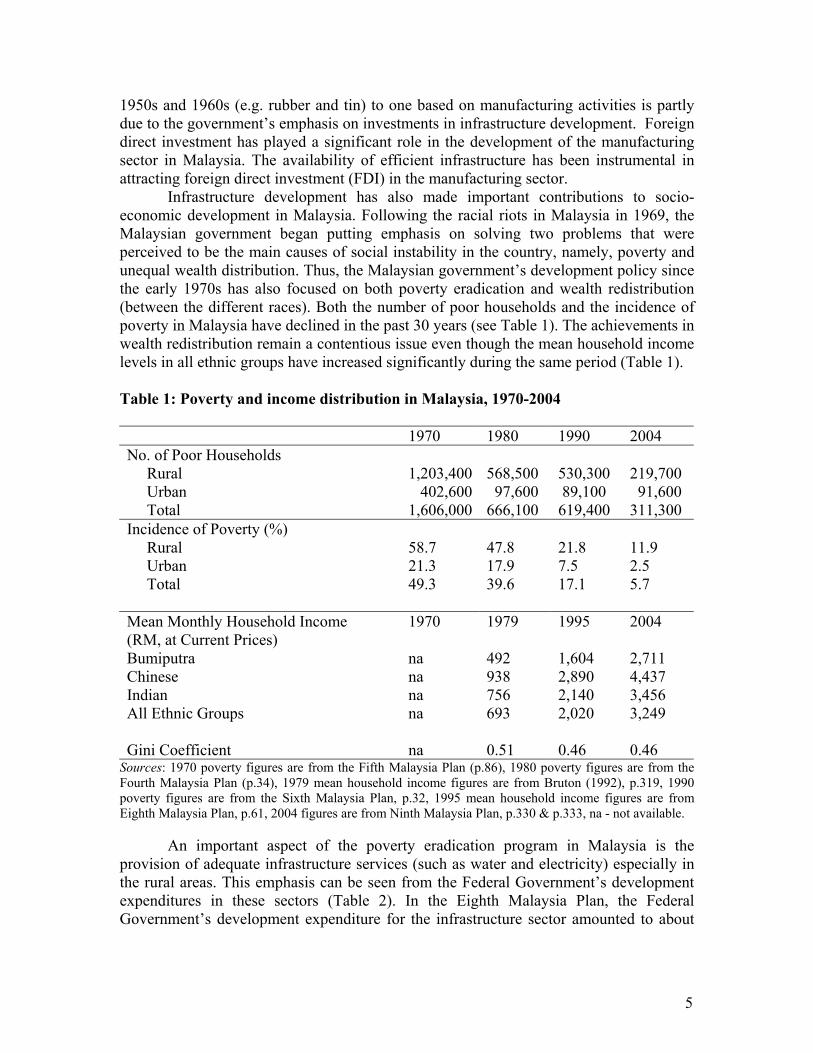
Infrastructure development has also made important contributions to socio-economic development in Malaysia. Following the racial riots in Malaysia in 1969, the Malaysian government began putting emphasis on solving two problems that were perceived to be the main causes of social instability in the country, namely, poverty and unequal wealth distribution. Thus, the Malaysian government’s development policy since the early 1970s has also focused on both poverty eradication and wealth redistribution (between the different races). Both the number of poor households and the incidence of poverty in Malaysia have declined in the past 30 years (see Table 1). The achievements in wealth redistribution remain a contentious issue even though the mean household income levels in all ethnic groups have increased significantly during the same period (Table 1). Table 1: Poverty and income distribution in Malaysia, 1970-2004 1970 1980 1990 2004 No. of Poor Households Rural 1,203,400 568,500 530,300 219,700 Urban 402,600 97,600 89,100 91,600 Total 1,606,000 666,100 619,400 311,300 Incidence of Poverty (%) Rural 58.7 47.8 21.8 11.9 Urban 21.3 17.9 7.5 2.5 Total 49.3 39.6 17.1 5.7 Mean Monthly Household Income (RM, at Current Prices)
1970 1979 1995 2004
Bumiputra na 492 1,604 2,711 Chinese na 938 2,890 4,437 Indian na 756 2,140 3,456 All Ethnic Groups na 693 2,020 3,249 Gini Coefficient na 0.51 0.46 0.46
Sources: 1970 poverty figures are from the Fifth Malaysia Plan (p.86), 1980 poverty figures are from the Fourth Malaysia Plan (p.34), 1979 mean household income figures are from Bruton (1992), p.319, 1990 poverty figures are from the Sixth Malaysia Plan, p.32, 1995 mean household income figures are from Eighth Malaysia Plan, p.61, 2004 figures are from Ninth Malaysia Plan, p.330 & p.333, na - not available.
An important aspect of the poverty eradication program in Malaysia is the provision of adequate infrastructure services (such as water and electricity) especially in the rural areas. This emphasis can be seen from the Federal Government’s development expenditures in these sectors (Table 2). In the Eighth Malaysia Plan, the Federal Government’s development expenditure for the infrastructure sector amounted to about
6
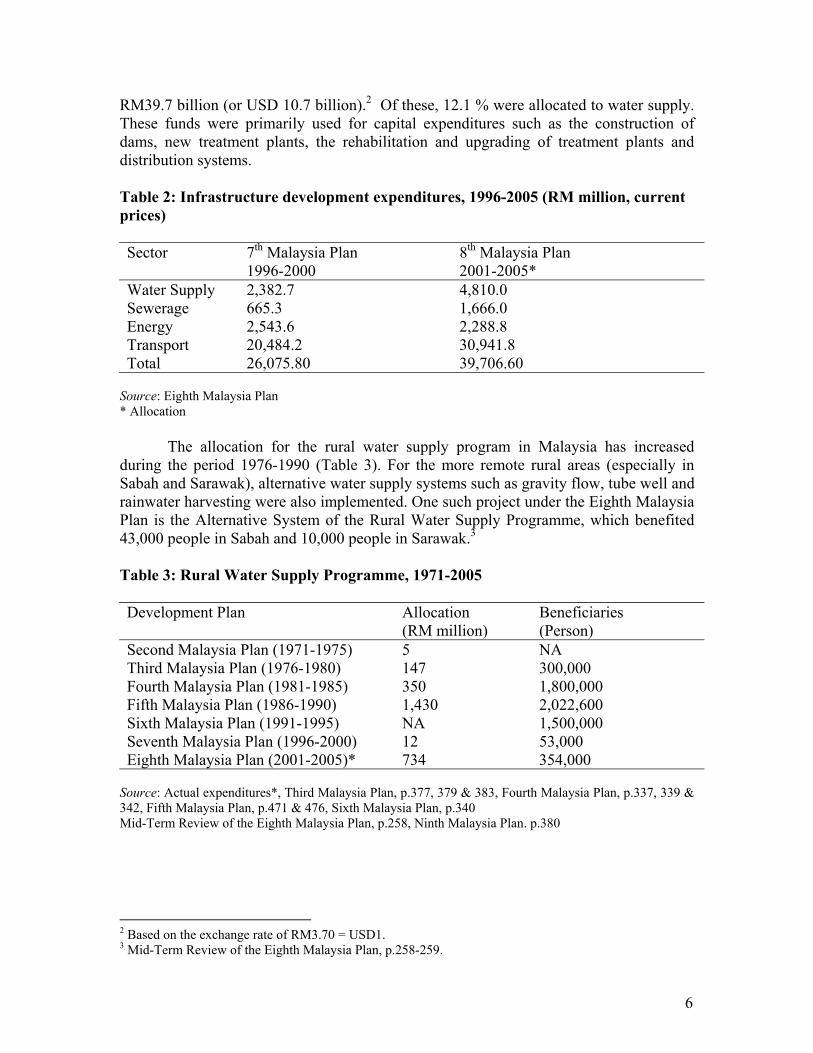
RM39.7 billion (or USD 10.7 billion).2 Of these, 12.1 % were allocated to water supply. These funds were primarily used for capital expenditures such as the construction of dams, new treatment plants, the rehabilitation and upgrading of treatment plants and distribution systems. Table 2: Infrastructure development expenditures, 1996-2005 (RM million, current prices) Sector 7th Malaysia Plan
1996-2000 8th Malaysia Plan 2001-2005*
Water Supply 2,382.7 4,810.0 Sewerage 665.3 1,666.0 Energy 2,543.6 2,288.8 Transport 20,484.2 30,941.8 Total 26,075.80 39,706.60
Source: Eighth Malaysia Plan * Allocation
The allocation for the rural water supply program in Malaysia has increased during the period 1976-1990 (Table 3). For the more remote rural areas (especially in Sabah and Sarawak), alternative water supply systems such as gravity flow, tube well and rainwater harvesting were also implemented. One such project under the Eighth Malaysia Plan is the Alternative System of the Rural Water Supply Programme, which benefited 43,000 people in Sabah and 10,000 people in Sarawak.3
Table 3: Rural Water Supply Programme, 1971-2005 Development Plan Allocation
(RM million) Beneficiaries (Person)
Second Malaysia Plan (1971-1975) 5 NA Third Malaysia Plan (1976-1980) 147 300,000 Fourth Malaysia Plan (1981-1985) 350 1,800,000 Fifth Malaysia Plan (1986-1990) 1,430 2,022,600 Sixth Malaysia Plan (1991-1995) NA 1,500,000 Seventh Malaysia Plan (1996-2000) 12 53,000 Eighth Malaysia Plan (2001-2005)* 734 354,000
Source: Actual expenditures*, Third Malaysia Plan, p.377, 379 & 383, Fourth Malaysia Plan, p.337, 339 & 342, Fifth Malaysia Plan, p.471 & 476, Sixth Malaysia Plan, p.340 Mid-Term Review of the Eighth Malaysia Plan, p.258, Ninth Malaysia Plan. p.380 2 Based on the exchange rate of RM3.70 = USD1. 3 Mid-Term Review of the Eighth Malaysia Plan, p.258-259.

7
2.2. Water resources Malaysia’s location within the equatorial zone ensures that the country has a fairly abundant amount of water resources. Average monthly rainfall in the country varies from 190mm to as high as 450mm in some states during the monsoon season. Annual rainfall volume is estimated to be around 990 km³, of which 36 % (or 360 km³) are lost to evapotranspiration.4 The country’s total amount internal water resource is estimated at 580 km³/year.5 Water resources are not equally distributed across the different states in the country. Several inter-state water transfer projects and agreements between the different states have been implemented to deal with the unequal distribution of water resources. Direct extraction from rivers is the most important source of raw water – accounting for two third of raw water supply in the country (Table 4). Second in importance are storage dams. Groundwater is an important source of raw water in some of the less developed states such as Sabah and Kelantan. Table 4: Raw Water Resources in Malaysia, 2003 (m3/year) State Direct Extraction
from River Storage Dam Groundwater Total
Kedah 335,531,444 1,766,168 0 357,297,612 Sarawak* 58,035,000 0 0 58,035,000 Labuan 9,938,360 2,975,940 0 12,914,300 Perlis 16,097,000 15,175,000 2,493,000 33,765,000 Pahang 246,827,600 0 0 246,827,600 N.Sembilan 162,716,598 80,134,090 331,785 243,182,473 Sabah 196,094,090 72,381,086 12,064,928 280,540,104 Perak 343,877,960 0 0 343,877,960 Melaka 143,120,024 54,928,877 0 198,048,901 Kuching** 108,040,941 0 0 108,040,941 Sibu** 33,827,631 0 0 33,827,631 Pulau Pinang 278,526,228 29,337,081 0 307,863,309 Terengganu 85,075,726 55,960,145 79,012 141,114,883 Selangor*** 909,768,401 939,680,294 0 1,849,448,695 Johor 167,141,518 256,073,108 0 423,214,626 Kelantan 39,364,288 1,742,340 42,165,524 83,272,152 LAKU** 32,500,699 29,751,900 1,678,015 63,930,614 Total 3,186,483,508 1,539,906,029 58,812,264 4,785,201,801
Note: *Excluding the divisions of Kuching, Sibu, and LAKU ** Kuching and Sibu are divisions within the state of Sarawak. *** Includes Kuala Lumpur and Putrajaya. Source: MWA (2005)
4 FAO, http://www.fao.org/ag/agl/aglw/aquastat/countries/Malaysia/index.stm 5 Ibid.
8
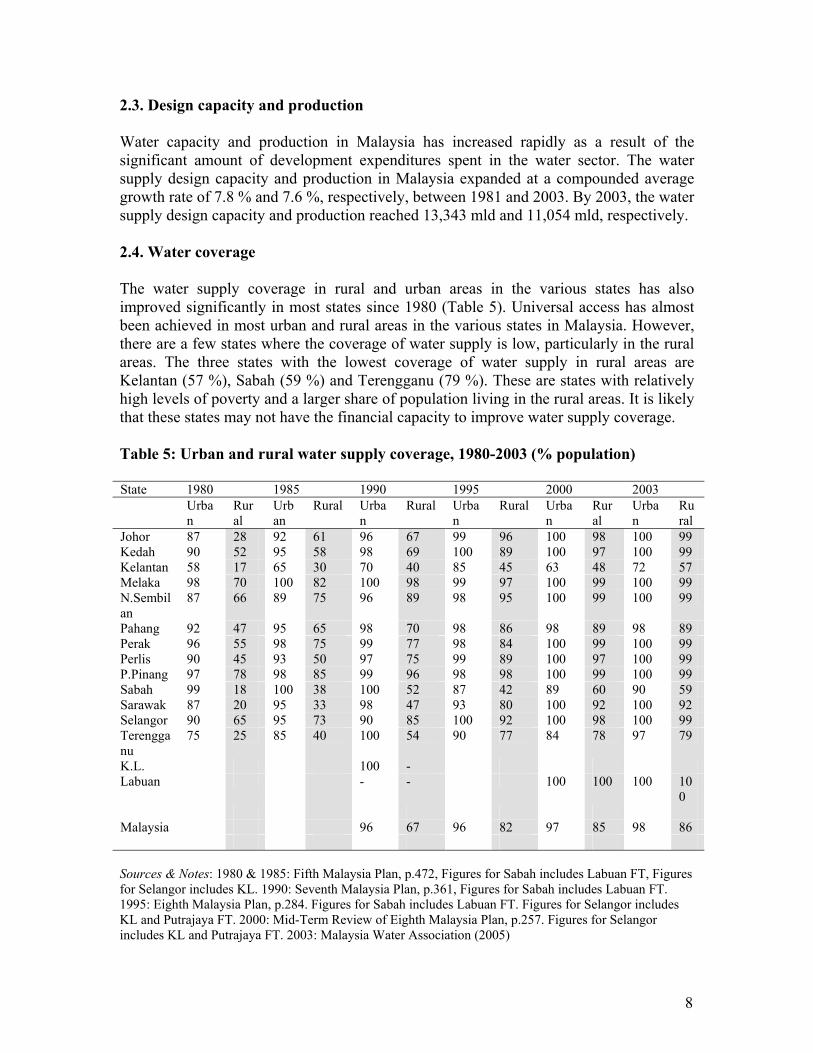
2.3. Design capacity and production Water capacity and production in Malaysia has increased rapidly as a result of the significant amount of development expenditures spent in the water sector. The water supply design capacity and production in Malaysia expanded at a compounded average growth rate of 7.8 % and 7.6 %, respectively, between 1981 and 2003. By 2003, the water supply design capacity and production reached 13,343 mld and 11,054 mld, respectively. 2.4. Water coverage The water supply coverage in rural and urban areas in the various states has also improved significantly in most states since 1980 (Table 5). Universal access has almost been achieved in most urban and rural areas in the various states in Malaysia. However, there are a few states where the coverage of water supply is low, particularly in the rural areas. The three states with the lowest coverage of water supply in rural areas are Kelantan (57 %), Sabah (59 %) and Terengganu (79 %). These are states with relatively high levels of poverty and a larger share of population living in the rural areas. It is likely that these states may not have the financial capacity to improve water supply coverage. Table 5: Urban and rural water supply coverage, 1980-2003 (% population) State 1980 1985 1990 1995 2000 2003 Urba
n Rural
Urban
Rural Urban
Rural Urban
Rural Urban
Rural
Urban
Rural
Johor 87 28 92 61 96 67 99 96 100 98 100 99 Kedah 90 52 95 58 98 69 100 89 100 97 100 99 Kelantan 58 17 65 30 70 40 85 45 63 48 72 57 Melaka 98 70 100 82 100 98 99 97 100 99 100 99 N.Sembilan
87 66 89 75 96 89 98 95 100 99 100 99
Pahang 92 47 95 65 98 70 98 86 98 89 98 89 Perak 96 55 98 75 99 77 98 84 100 99 100 99 Perlis 90 45 93 50 97 75 99 89 100 97 100 99 P.Pinang 97 78 98 85 99 96 98 98 100 99 100 99 Sabah 99 18 100 38 100 52 87 42 89 60 90 59 Sarawak 87 20 95 33 98 47 93 80 100 92 100 92 Selangor 90 65 95 73 90 85 100 92 100 98 100 99 Terengganu
75 25 85 40 100 54 90 77 84 78 97 79
K.L. 100 - Labuan - - 100 100 100 10
0 Malaysia 96 67 96 82 97 85 98 86 Sources & Notes: 1980 & 1985: Fifth Malaysia Plan, p.472, Figures for Sabah includes Labuan FT, Figures for Selangor includes KL. 1990: Seventh Malaysia Plan, p.361, Figures for Sabah includes Labuan FT. 1995: Eighth Malaysia Plan, p.284. Figures for Sabah includes Labuan FT. Figures for Selangor includes KL and Putrajaya FT. 2000: Mid-Term Review of Eighth Malaysia Plan, p.257. Figures for Selangor includes KL and Putrajaya FT. 2003: Malaysia Water Association (2005)

9
2.5. Water consumption The distribution of population across the different states in Malaysia is fairly uneven. A significant proportion of the population is concentrated in the more developed states (such as Kuala Lumpur, Johor, Pulau Pinang and Selangor) or in the large states (such as Sabah and Sarawak) (Table 6). Total water consumption is highest in the states of Sarawak, Selangor (including KL), Pulau Pinang and Perak. Smaller states (such as Perlis) and less developed states (such as Kelantan and Sabah) have relatively low level of total water consumption. This likely to be partly due to lack to access to treated water supply (see earlier section). Domestic per capita water consumption does not seem to be correlated with per capita GDP for the various states.6 Table 6: Water consumption in Malaysia, 2003 Population
Served Domestic Water Consumption (m3)
Non-Domestic Water Consumption (m3)
Total Water Consumption (m3)
Per Capita Domestic Water Consumption (litre per day)
Johor 2,931,650 204,471,885 89,771,186 294,243,071 191 Kedah 1,668,044 141,613,051 49,451,417 191,064,468 232 Kelantan 865,523 34,343,485 12,798,236 47,141,721 109 Melaka 681,756 55,925,509 52,333,426 108,258,935 225 N.Sembilan 909,025 62,279,282 44,666,278 106,945,560 202 Pahang 1,298,456 77,020,703 47,749,296 124,769,999 162 Perak 2,105,966 164,205,440 54,547,917 218,753,357 213 Perlis 216,454 17,023,079 2,689,725 19,712,804 215 P.Pinang 1,414,080 137,654,109 85,735,510 223,389,619 266 Sabah 2,027,468 57,007,465 35,452,649 92,460,114 77 Sarawak 2,194,919 116,151,542 763,421,162 879,572,704 145 Selangor 6,748,040 478,995,217 245,490,214 724,485,431 194 Terengganu 864,385 56,981,602 42,962,716 99,944,318 180 Labuan 80,000 5,902,324 3,397,688 9,300,012 202 Malaysia 24,005,766 1,609,574,6
93 843,388,420 2,452,963,1
13 194
6 A simple OLS regression using domestic per capita water consumption as the dependent variable and per capita GDP as the independent variable indicates that the positive relationship between the two variables is not statistically significant.

10
3. Water institutions in Malaysia 3.1. Public and private participation Under Malaysia’s Federal Constitution, water resources fall under the jurisdiction of the respective states. In the past, the treatment and distribution of water was undertaken exclusively by state water agencies. These may differ from state to state and can either be: State Public Works Department (PWD); State Water Supply Department (WSD); or State Water Supply Board (WSB).
Since the early 1990s, many states have opted to establish water supply
companies via corporatization (via establishment of limited liability firms that are wholly-owned by the state). In a few cases, these companies were privatised via partial or full divestiture of equity in these companies. Table 7 summarizes the current situation of water institutions in Malaysia.

11
Table 7: Water supply institutions in Malaysia, 2005 Public Works Dept Kedah (1) Production and distribution by PWD
(2) Privatised production and distribution (3) Privatisation of 5 treatment plants
Sarawak (1) Production and distribution by PWD (2) Miri, Bintulu and Limbang (LAKU) – served by a state-owned corporatized body
Labuan (1) Distribution by PWD (2) Management contract of production
Perlis Production and distribution by PWD Water Supply Dept Pahang Production and distribution by WSD N.Sembilan (1) Distribution by WSD
(2) Privatisation of 2 water treatment plants Sabah (1) Distribution by WSD
(2) Privatisation of 3 water treatment plants Water Supply Board Perak (1) Distribution by WSB
(2) Privatisation of 3 water treatment plants Melaka Production and distribution by WSB Water Supply Company Pulau Pinang Privatised in 2000:
Production and distribution by PBA Holdings Berhad (State government share 55%)
Terengganu Corporatized in 1999: Production and distribution by Syarikat Air Terengganu Sdn Bhd (state government share 100%)
Selangor Privatised in 2002: (1) Monopoly distribution by Perbadanan Urus Air Selangor (state government share 30%) (2) 7 water treatment plants (4 existing, 3 BOT) operated by 5 firms
Johor Privatised in 2001: Production and distribution by SAJ Holdings Sdn Bhd (state government share 0%)
Kelantan Privatised in 1996: Production and distribution by Air Kelantan Sdn Bhd (state government share 70%)
Source: MWA (2004)
Some states have fully privatised the provision of water services. These include the more developed states (in terms of GDP per capita) such as Selangor, Pulau Pinang and Johor. In most cases, the state government continues to hold equity in the privatised

12
water entities. A few states (Labuan, N.Sembilan and Sabah) have chosen a dual structure water system – whereby distribution is undertaken by state agencies and water treatment is privatised via concessions. Some of the smaller states (Melaka and Perlis) and less-developed states (Kedah, Sarawak and Pahang) have generally chosen to maintain a public water provision system. The four states where water services are fully privatised (namely, Kelantan, Selangor, Pulau Pinang and Johor) account for 49%of total water production and 46.2% of total population served in 2003. It is estimated that 64% of the total population is served by the private sector. 3.2. Financial performance in the water sector In 2003, the Malaysian water sector experiences a revenue-cost deficit of about RM245.5 million (or about 9.1% of cost – defined as operating and maintenance costs). However, about half of the states in Malaysia are currently experiencing a financial deficit in their water operations (see Table 5.8). Of these, states with large deficits include Selangor (-RM449.1 million) and Sabah (-RM125.0 million). Interestingly, the unit revenue exceeds the unit cost in all the states experiencing financial deficits in water operations, with the exception of Labuan.7 Of the four states where water is fully privatised – namely, Selangor, Pulau Pinang, Johor and Kelantan – only one state (Selangor) suffered losses in 2005. However, ownership status in the water sector (private/public) is not a significant explanatory variable for profitability.8
7 Unit cost is derived by dividing total operating and maintenance costs by total production while unit revenue is derived by dividing total revenue by total metered water sold. 8 This is based on results from panel regression models (random-effects models and fixed-effects models) involving profitability as the dependent variable and a dummy ownership status as the independent variable.

13
Table 8: Financial performance of water operations in Malaysia, 2003 State Cost Revenue Revenue –
Cost Gap % Deficit
Unit Cost
Unit Revenue
Kedah 117,110,842 148,520,086 31,409,244 0.37 0.81 Sarawak 26,209,664 22,001,870 -4,207,794 16.1 0.48 0.51 Labuan 16,555,975 9,640,336 -6,915,639 41.8 1.35 0.98 Perlis 13,748,304 12,849,629 -898,675 6.5 0.43 0.67 Pahang 109,257,244 98,722,938 -10,534,306 9.6 0.47 0.83 N.Sembilan 72,752,318 99,561,120 26,808,802 0.32 0.95
Sabah 200,872,317 75,850,000 -125,022,317 62.2 0.80 1.15
Perak 166,221,930 201,056,555 34,834,625 0.55 0.95 Melaka 77,837,946 105,486,723 27,648,777 0.62 1.20 Kuching 55,743,344 62,795,270 7,051,926 0.54 0.91 Sibu 21,247,969 19,508,893 -1,739,076 8.2 0.76 0.98 P.Pinang 107,501,332 167,950,719 60,449,387 0.38 0.75 Terengganu 45,619,654 80,750,864 35,131,210 0.34 0.89
Selangor 1,310,523,468 861,421,335 -449,102,133 34.3 1.07 1.28
Johor 270,722,202 382,373,342 111,651,140 0.59 1.23 Kelantan 34,183,814 45,704,857 11,521,043 0.43 1.05 LAKU 40,283,687 46,679,330 6,395,643 0.68 0.96
2,686,392,010 2,440,873,867-245,518,143 9.1 0.69 1.05
Source: MWA (2005)
A major reason for these financial deficits is the loss of revenues from non-
revenue waters (NRW) i.e. water that are produced but not billed to consumers due to leakages, under-meter registration, and pilferage. NRW, which is measured by the difference between the quantity of water that leaves the treatment plants and the quantity billed to users based on metered consumption. The average %age of NRW in Malaysia is very high at 40.6 % in 2003. This problem is more serious in some states than in others (Table 5.9). The states with the highest levels of NRW include: Sabah (73.9 %); N.Sembilan (53.8 %); Kelantan (44.9 %); and Selangor (44.7 %).
The states that have involved private sector seem to have lower levels of NRW
and most of them have lower levels compared to the national average NRW of 40.6%. This may be an indicator of efficiency with the private sector. The main causes of water losses are leakages (16-30%), meter under registration (3-7%) and pilferages (1-8%).9 9 See MWA (2004), p.14.

14
Table 9: Non-Revenue Water, 2003 State Metered
Consumption Non-Revenue Water
Production % NRW
Kedah 183,189,082 132,097,188 315,286,270 41.9 Sarawak* 43,151,590 11,598,410 54,750,000 21.2 Labuan 9,860,698 2,410,967 12,271,665 19.6 Perlis 19,162,722 12,809,453 31,972,175 40.1 Pahang 119,213,467 111,355,573 230,569,040 48.3 N.Sembilan 104,690,218 121,830,972 226,521,190 53.8 Sabah 65,913,151 186,236,149 252,149,300 73.9 Perak 211,553,576 91,407,374 302,960,950 30.2 Melaka 87,756,775 38,405,110 126,161,885 30.4 Kuching** 69,032,641 33,807,204 102,839,845 32.9 Sibu** 19,850,605 8,068,610 27,919,215 28.9 Pulau Pinang 224,632,200 55,528,660 280,160,860 19.8 Terengganu 90,794,768 43,916,877 134,711,645 32.6 Selangor*** 674,900,649 545,898,791 1,220,799,440 44.7 Johor 309,702,905 150,182,495 459,885,400 32.7 Kelantan 43,444,811 35,448,479 78,893,290 44.9 LAKU** 48,495,573 10,663,627 59,159,200 18.0 Total 2,325,345,431 1,591,665,939 3,917,011,370 40.6
Note: * Excluding the province of Kuching, Sibu and LAKU; **Province within Sarawak *** Includes Kuala Lumpur and Putrajaya Source: MWA (2004)
In Table 10, we compute the level of losses in revenues from NRW and compare them with the financial deficits from each state’s water operations. Clearly, the financial deficits in state water operations can be reduced if the level of NRW is lower. For some states, the magnitude of reduction in NRW is small to achieve a breakeven point e.g. Perlis (10 %) and Pahang (11 %). Others require more substantial reduction in NRW to achieve breakeven e.g. Sabah (58 %), Selangor (64 %) and Sarawak (71 %).

15
Table 10: Reducing financial deficits via NRW reduction in water operations in Malaysia, 2003 (RM) State Revenue – Cost
Gap NRW Losses
Augmented R-C Gap
% Reduction in NRW for Breakeven
Kedah 31,409,244 107,097,462 138,506,706 Sarawak -4,207,794 5,913,727 1,705,933 71% Labuan -6,915,639 2,357,088 -4,558,551 Perlis -898,675 8,589,423 7,690,748 10% Pahang -10,534,306 92,215,667 81,681,361 11% N.Sembilan 26,808,802 115,862,095 142,670,897 Sabah -125,022,317 214,312,496 89,290,179 58% Perak 34,834,625 86,871,856 121,706,481 Melaka 27,648,777 46,164,290 73,813,067 Kuching 7,051,926 30,752,590 37,804,516 Sibu -1,739,076 7,929,715 6,190,639 22% P.Pinang 60,449,387 41,517,104 101,966,491 Terengganu 35,131,210 39,058,702 74,189,912 Selangor -449,102,133 696,767,541 247,665,408 64% Johor 111,651,140 185,422,163 297,073,303 Kelantan 11,521,043 37,292,547 48,813,590 LAKU 6,395,643 10,264,256 16,659,899 -245,518,143 1,670,743,514 1,425,225,371
Source: MWA (2005)
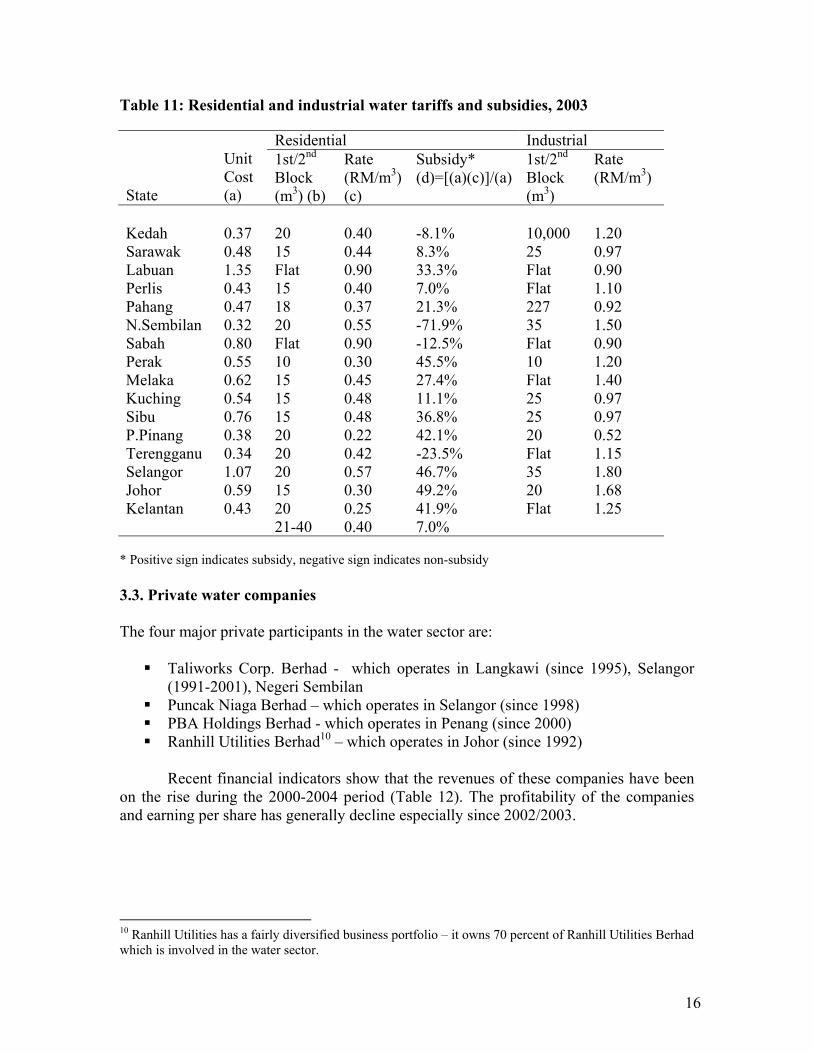
It may be that part of the financial deficit experienced by state water operations is due to the subsidy on residential water consumption. Generally, water subsidies are only available for residential water consumption (see Table 11). These subsidies usually apply only for the first block of consumption (around 10-20 m3). These subsidies range between 7 % (in Perlis) to as high as 49 % (in Johor). With the exception of the island of Labuan, there is no subsidy for industrial water consumption.
16
Table 11: Residential and industrial water tariffs and subsidies, 2003
Residential Industrial
State
Unit Cost (a)
1st/2nd Block (m3) (b)
Rate (RM/m3)(c)
Subsidy* (d)=[(a)(c)]/(a)
1st/2nd Block (m3)
Rate (RM/m3)
Kedah 0.37 20 0.40 -8.1% 10,000 1.20 Sarawak 0.48 15 0.44 8.3% 25 0.97 Labuan 1.35 Flat 0.90 33.3% Flat 0.90 Perlis 0.43 15 0.40 7.0% Flat 1.10 Pahang 0.47 18 0.37 21.3% 227 0.92 N.Sembilan 0.32 20 0.55 -71.9% 35 1.50 Sabah 0.80 Flat 0.90 -12.5% Flat 0.90 Perak 0.55 10 0.30 45.5% 10 1.20 Melaka 0.62 15 0.45 27.4% Flat 1.40 Kuching 0.54 15 0.48 11.1% 25 0.97 Sibu 0.76 15 0.48 36.8% 25 0.97 P.Pinang 0.38 20 0.22 42.1% 20 0.52 Terengganu 0.34 20 0.42 -23.5% Flat 1.15 Selangor 1.07 20 0.57 46.7% 35 1.80 Johor 0.59 15 0.30 49.2% 20 1.68 Kelantan 0.43 20
21-40 0.25 0.40
41.9% 7.0%
Flat 1.25
* Positive sign indicates subsidy, negative sign indicates non-subsidy 3.3. Private water companies The four major private participants in the water sector are: Taliworks Corp. Berhad - which operates in Langkawi (since 1995), Selangor
(1991-2001), Negeri Sembilan Puncak Niaga Berhad – which operates in Selangor (since 1998) PBA Holdings Berhad - which operates in Penang (since 2000) Ranhill Utilities Berhad10 – which operates in Johor (since 1992)
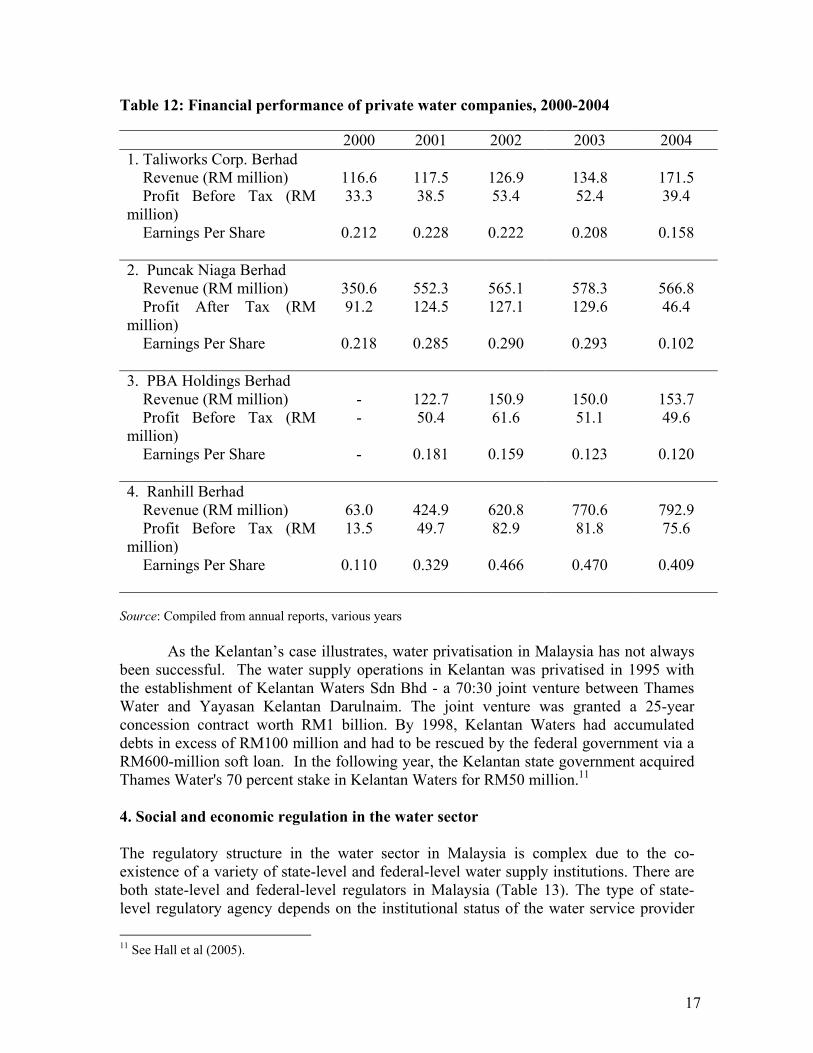
Recent financial indicators show that the revenues of these companies have been
on the rise during the 2000-2004 period (Table 12). The profitability of the companies and earning per share has generally decline especially since 2002/2003.
10 Ranhill Utilities has a fairly diversified business portfolio – it owns 70 percent of Ranhill Utilities Berhad which is involved in the water sector.
17
Table 12: Financial performance of private water companies, 2000-2004 2000 2001 2002 2003 2004 1. Taliworks Corp. Berhad Revenue (RM million) 116.6 117.5 126.9 134.8 171.5 Profit Before Tax (RM million)
33.3 38.5 53.4 52.4 39.4
Earnings Per Share 0.212 0.228 0.222 0.208 0.158 2. Puncak Niaga Berhad Revenue (RM million) 350.6 552.3 565.1 578.3 566.8 Profit After Tax (RM million)
91.2 124.5 127.1 129.6 46.4
Earnings Per Share 0.218 0.285 0.290 0.293 0.102 3. PBA Holdings Berhad Revenue (RM million) - 122.7 150.9 150.0 153.7 Profit Before Tax (RM million)
- 50.4 61.6 51.1 49.6
Earnings Per Share - 0.181 0.159 0.123 0.120 4. Ranhill Berhad Revenue (RM million) 63.0 424.9 620.8 770.6 792.9 Profit Before Tax (RM million)
13.5 49.7 82.9 81.8 75.6
Earnings Per Share 0.110 0.329 0.466 0.470 0.409
Source: Compiled from annual reports, various years
As the Kelantan’s case illustrates, water privatisation in Malaysia has not always been successful. The water supply operations in Kelantan was privatised in 1995 with the establishment of Kelantan Waters Sdn Bhd - a 70:30 joint venture between Thames Water and Yayasan Kelantan Darulnaim. The joint venture was granted a 25-year concession contract worth RM1 billion. By 1998, Kelantan Waters had accumulated debts in excess of RM100 million and had to be rescued by the federal government via a RM600-million soft loan. In the following year, the Kelantan state government acquired Thames Water's 70 percent stake in Kelantan Waters for RM50 million.11 4. Social and economic regulation in the water sector The regulatory structure in the water sector in Malaysia is complex due to the co-existence of a variety of state-level and federal-level water supply institutions. There are both state-level and federal-level regulators in Malaysia (Table 13). The type of state-level regulatory agency depends on the institutional status of the water service provider 11 See Hall et al (2005).

18
within each state. Self-regulation is practiced in states where water is supplied by government agencies such as the public works department and the water supply department. For corporatized bodies and privatised companies, new state regulatory agencies are created. Generally, state-level regulatory agencies undertake economic regulation such as setting tariff levels. On the other hand, Federal-level regulatory agencies undertake technical regulate and the coordination of matters involving: (a) several states (such as inter state water transfers) and, (b) funding from the Federal government. Table 13: Regulatory structure in the Malaysian water sector Types of Water Supply Institutions Public
Works Dept Water Supply Dept
Water Supply Board
Corporatised Company
Privatised Company
States / District
Kedah Perlis Labuan Sarawak*
Pahang N.Sembilan Sabah
Melaka Perak Kuching & Sibu
Terengganu LAKU
Penang Johor Selangor Kelantan
Status Federal Government
State Government
Statutory Body
Corporatised State-owned
Private Company
State-Level Regulator
State Public Works Dept
State Water Supply Dept
State Water Supply Board
State Water Dept / Board
State Water Dept / Board
Federal-Level Regulator
Water Unit, Ministry of Energy, Water and Communication Environmental Health Engineering Section, Ministry of Health Department of Drainage and Irrigation, Ministry of Natural Resources and Environment
* Except for Kuching & Sibu
Regulation of the sector at the Federal level has undergone some significant changes in recent years. On the 27th of March 2004, the Federal-level regulatory function was transferred from the Water Supply Branch under the Ministry of Works to the Water Unit under the Ministry of Energy, Water and Communication. The functions of the Water Unit include: To plan, impart technical advice and coordinate projects which are related to the
development of water resources. To investigated, design and prepare tender document for water supply projects
which are funded by Federal Government (through grants or loans). To provide water quality control (raw and processed), control of water loss, safety
of dam, coordination of fluoridization programme, water supply material and information management.

19
Other Federal-level agencies are also involved in regulatory matters in the sector. The Environmental Health Engineering Section under the Ministry of Health monitors the quality of drinking water supply in the country. The Department of Drainage and Irrigation under the Ministry of Natural Resources and Environment undertakes river basin management including the monitoring of pollution levels in rivers. The National Water Resource Council (NWRC) is a council comprising of representatives from Federal and state governments that is in charge of formulating national level policies.
Both state and federal agencies addresses the issue of access to treated water supply. State regulatory agencies plan and propose water projects to the federal government that can be funded by the latter. This can take the form of soft loans to State Governments for public water supply infrastructure and grants for rural water supply development. At the federal level, projects to improve access to water supply in rural areas are undertaken by the Ministry of Regional and Rural Development. As discussed earlier, the federal government has allocated a large amount of resources to improve access to water supply in the rural areas. It is estimated that the Government has provided RM8.3 billion loan to State Governments for the water supply sector.12
There are currently no universal service provisions (USP) in the privatisation agreements in the water sector. This is probably due to the fact that activities related to USP are carried out by the federal government via the Ministry of Regional and Rural Development. However, private water companies have been observed to improve access to treated water supply in their efforts to expand their markets. 5. Water tariff in Malaysia 5.1. Water tariff structure The general principles underlying the present water tariffs in Malaysia include the following13: Higher rated for higher consumption to discourage wastage. Cross-subsidy for domestic consumers by industrial consumers. A very low ‘lifeline’ rate to meet the ‘ability to pay’ criterion of the lower-income
group to cover basic everyday need for domestic purposes.
The incentives for efficient use of water are applied through the use of volumetric charges (based on measured water use) under an increasing block structure (where block price rises with use rise). This approach is used for the water tariffs for residential homes (with the exception of Sabah which uses a flat rate). There are significant differences in the structure of residential water tariffs between the different states. Most states have a three-tiered structure while one state (Sabah) has a flat rate. Similarly, many states use an increasing block tariff structure for industrial and commercial water tariffs. However, such block structures are not very steep i.e. the block increments are relatively small. There are also quite a few states (Melaka, Terengganu, Perlis, Kelantan and Sabah) that use flat rate tariffs for industrial and commercial users. Overall, in almost all states (with 12 See Raja Dato’ Zaharaton. (2005). 13 MWA (2003), p.45.

20
the exception of Sabah), residential water users are subsidized by industrial/commercial water users. This is illustrated by Table 14 which summarizes the average tariff rates in various states.14 The industry-domestic tariff ratio ranges from 1.7 to 3.0.
Table 14: Average domestic and industry water rates, 2004 (RM / m3) State/Area Domestic Rate Industry Rate Ratio:
Industry/Domestic Kelantan 0.31 0.70 2.26 Pulau Pinang 0.31 0.94 3.03 Terengganu 0.52 1.15 2.21 Kedah 0.53 1.20 2.26 Sarawak 0.56 1.19 2.13 Perlis 0.57 1.30 2.28 Pahang 0.57 1.40 2.46 Melaka 0.59 1.40 2.37 Bintulu 0.61 1.21 1.98 Kuching 0.62 1.06 1.71 Sibu 0.62 1.06 1.71 Sri Aman 0.62 1.06 1.71 Limbang 0.62 1.06 1.71 Sarikei 0.62 1.06 1.71 Kapit 0.62 1.06 1.71 Perak 0.67 1.45 2.16 N. Sembilan 0.68 1.59 2.34 Selangor 0.72 1.91 2.65 Labuan 0.90 0.90 1.00 Sabah 0.90 0.90 1.00 Johor 0.90 2.93 3.26
Source: MWA (2004)
14 The average tariff rates are computed using total water revenue divided by consumption volumes for the different categories.
21
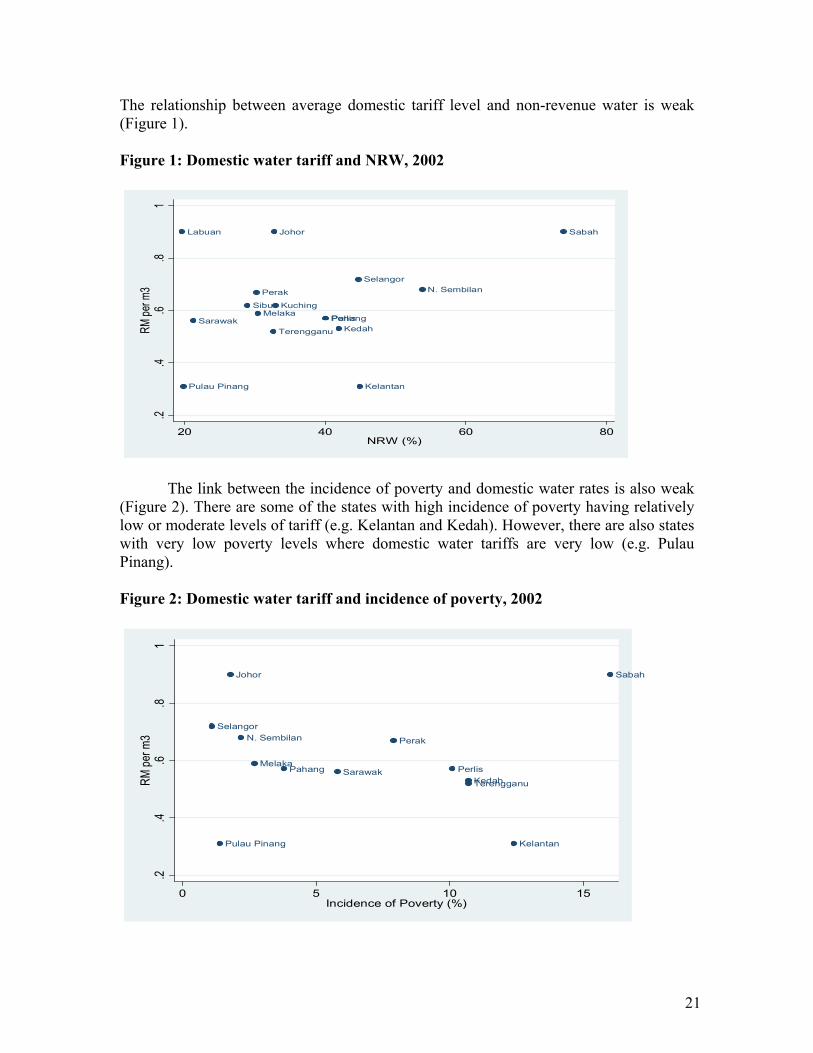
The relationship between average domestic tariff level and non-revenue water is weak (Figure 1). Figure 1: Domestic water tariff and NRW, 2002
KelantanPulau Pinang
Terengganu KedahSarawak PerlisPahang
MelakaKuchingSibu
Perak N. SembilanSelangor
Labuan SabahJohor
.2.4
.6.8
1RM
per m
3
20 40 60 80NRW (%)
The link between the incidence of poverty and domestic water rates is also weak (Figure 2). There are some of the states with high incidence of poverty having relatively low or moderate levels of tariff (e.g. Kelantan and Kedah). However, there are also states with very low poverty levels where domestic water tariffs are very low (e.g. Pulau Pinang). Figure 2: Domestic water tariff and incidence of poverty, 2002
KelantanPulau Pinang
TerengganuKedahSarawak PerlisPahang
Melaka
PerakN. SembilanSelangor
SabahJohor
.2.4
.6.8
1RM
per m
3
0 5 10 15Incidence of Poverty (%)

22
5.2. Tariff revision As water is a state matter, revisions of water tariffs are approved at the state level. However, cabinet approval is required for cases where the privatisation agreement provides for federal level approval e.g. the case PUAS in the state of Selangor. There are no formal schedules for tariff revisions in the water sector in Malaysia. As a result, there have been significant variations in the frequency of tariff revisions across the different states in Malaysia. In some states such as Pahang and Sabah, tariffs were revised only twice since the 1960s (Table 15). Table 15: History of tariff revisions in the water sector 1950s 1960s 1970s 1980s 1990s 2000 - Johor 1968 1977 1983,1986 1991 2001,2
003 Kedah 1980, 1983 1993 Kelantan 1968 1983 2001 Melaka 1965 1976 1983 1992 2005 N.Sembilan
1973 1981,1984 1993 2002
Pahang 1958 1983 Perak 1966 1982, 1985 1991 Perlis 1960 1984 1993, 1996 P.Pinang 1981,1983,1985 1993 2001 Sabah 1975 1982 Sibu 1982 1992 Kuching 1982 1992 Sarawak 1982, 1984 1992 Selangor 1976 1984, 1989 1991 2001 Terengganu
1960, 1969
1975 1982, 1984 1997
Labuan 1975 1982 Source: MWA
In other states such as Johor and Pulau Pinang, water tariffs have been revised five times since the 1980s. There appears to be some relationship between tariff revision and privatisation. Five of the six states have revised their water tariff since 2000 are states where water distribution has been corporatized or privatised (Table 16).
23
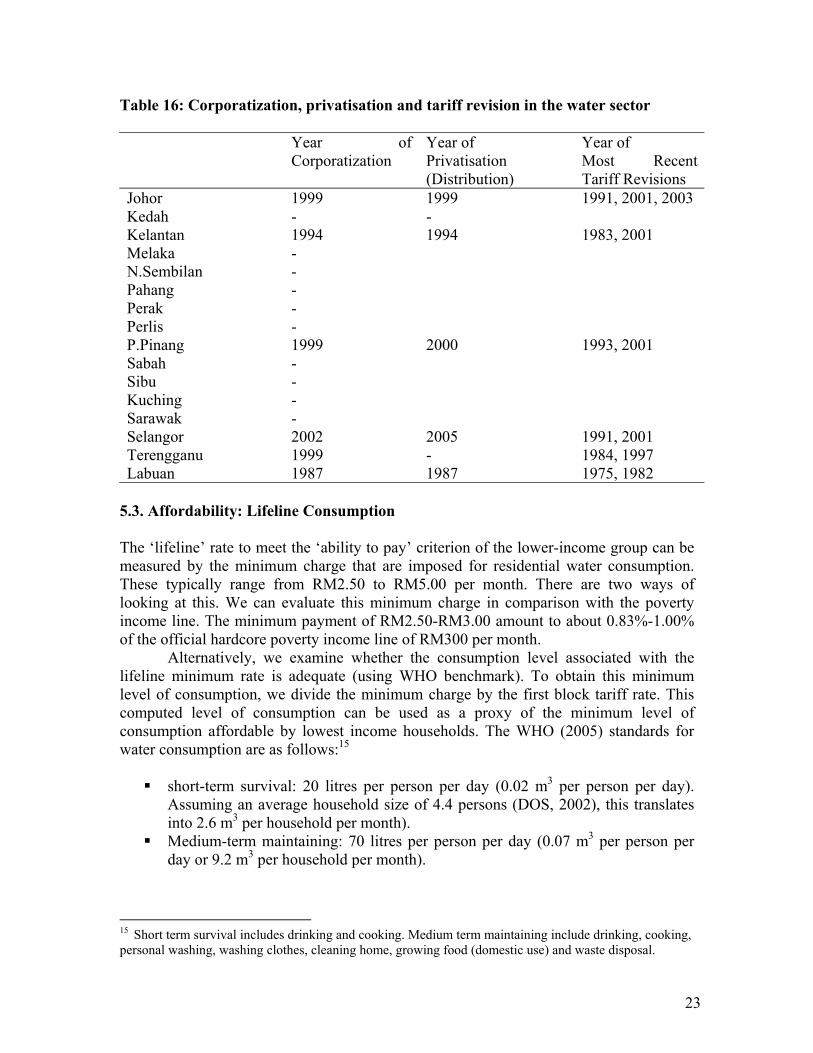
Table 16: Corporatization, privatisation and tariff revision in the water sector Year of
Corporatization Year of Privatisation (Distribution)
Year of Most Recent Tariff Revisions
Johor 1999 1999 1991, 2001, 2003 Kedah - - Kelantan 1994 1994 1983, 2001 Melaka - N.Sembilan - Pahang - Perak - Perlis - P.Pinang 1999 2000 1993, 2001 Sabah - Sibu - Kuching - Sarawak - Selangor 2002 2005 1991, 2001 Terengganu 1999 - 1984, 1997 Labuan 1987 1987 1975, 1982
5.3. Affordability: Lifeline Consumption The ‘lifeline’ rate to meet the ‘ability to pay’ criterion of the lower-income group can be measured by the minimum charge that are imposed for residential water consumption. These typically range from RM2.50 to RM5.00 per month. There are two ways of looking at this. We can evaluate this minimum charge in comparison with the poverty income line. The minimum payment of RM2.50-RM3.00 amount to about 0.83%-1.00% of the official hardcore poverty income line of RM300 per month.
Alternatively, we examine whether the consumption level associated with the lifeline minimum rate is adequate (using WHO benchmark). To obtain this minimum level of consumption, we divide the minimum charge by the first block tariff rate. This computed level of consumption can be used as a proxy of the minimum level of consumption affordable by lowest income households. The WHO (2005) standards for water consumption are as follows:15 short-term survival: 20 litres per person per day (0.02 m3 per person per day).
Assuming an average household size of 4.4 persons (DOS, 2002), this translates into 2.6 m3 per household per month).
Medium-term maintaining: 70 litres per person per day (0.07 m3 per person per day or 9.2 m3 per household per month).
15 Short term survival includes drinking and cooking. Medium term maintaining include drinking, cooking, personal washing, washing clothes, cleaning home, growing food (domestic use) and waste disposal.

24
Based on a comparison between the computed consumption (associated with the minimum charges and minimum tariff rates) and the WHO standards, we estimated that water consumption exceed the medium-term ‘lifeline’ level (corresponding to 9.2 m3 per household per month) in only six out of the 13 states surveyed (Figure 3). Interestingly, three of these six states (Johor, Kelantan, Pulau Pinang) have fully privatised their water sector. The above analysis indicates that the prevailing lifeline tariff rates in some states are sufficiently high.16 Figure 3: Level of residential water consumption associated with minimum charge
5.4. Recent regulatory reforms On 18 January 2005, the Malaysian Parliament amended the Constitution to affect the transfer of the jurisdiction of water supply management from the respective states to the Federal government. With this change, the Federal Government now has full control over water supply management in the country.17
In May 2006, the government enacted two legislations that further transformed the industry, namely the Water Services Industry Bill 2006 (WSI) and National Water Service Commission Bill 2006 (SPAN, the Malay acronym for Suruhanjaya Perkhidmatan Air Negara). Both legislations contained provisions for the establishment of a government-owned, tentatively named the Water Asset Management Company (WAMCo) and an industry regulator, namely the National Water Service Commission.
16 Unfortunately, there are no published state-level data on the number of households paying the minimum charge. 17 Under the proposal, rights over water resources remain with each state.
25
These reforms are expected to overcome some of the perceived shortcomings and weaknesses of the existing water institutions in Malaysia, namely:18
Lack of coordination amongst various stakeholders leading to awarding ad hoc
contracts; Ineffective regulatory structure and poor enforcement; Capital expenditure constraints; and Varied success of privatisation of water supply projects.
In the past, regulation was agreed within the terms of the individual contracts. In
some cases, there were inputs from the government regarding health and environmental matters.
The problem of capital expenditure constraints is attributed to the inability of existing operators to obtain sufficient revenues to cover capital expenditures (investment). This, in turn, is due to water tariffs being currently set at less than full-cost recovery levels.
With the enactment of the Water Services Industry Bill 2006 all State water departments will be corporatized and be regulated by SPAN. WAMCo was established to overcome this problem by providing financing to upgrade water supply infrastructure in the country. It is estimated that Malaysia needs to spend RM50 billion (US$3.2 billion) to upgrade water and sewage services between 2005 and 2010. The Minister of Energy, Water and Communications envisaged WAMCo as a temporary entity that “will be relevant until the water services industry reached a full cost recovery level”.19 This implies a gradual reduction of water subsidies in Malaysia in the future. There has been some public concern about affordability under the proposed changes particularly the possibility of future tariff increase. Some argue that the quality of treated water ought to be improved before any increase in water tariff. NGOs argue for a re-examination of water privatisation. The media also continue to occasionally highlight the lack of access to treated water, particularly in the rural areas. 5. Evidence from household expenditure data 5.1. Data source The two sets of household expenditure data used in this section are: the 1993/1994 Household Expenditure Survey (HES94); and the 1998/1999 Household Expenditure Survey (HES99).
Both data sets were obtained from the Department of Statistics, Malaysia. The
HES94 dataset contains 14,631 observations while the HES99 contains 9,198 observations. Unfortunately, both surveys do not collect information on income. Total expenditure is used as a basis for constructing percentile tables. The distribution of respondents by state for both surveys is very similar to each other. The largest share of 18 See Lim (2004). 19 “Ministry Needs Over USD500 million to Get WAHCO Going,” Bernama Report, 31 March 2005.

26
total number of respondents came from the states of Selangor, Sabah, Sarawak, Perak and Kuala Lumpur (Table 17).
Table 17: Distribution of respondents by state in HES94 and HES99 HES94 HES99
State Number of Respondents %age
Number off Respondents %age
Johor 1,593 10.9 1,023 11.1 Kedah 926 6.3 567 6.2 Kelantan 781 5.3 553 6.0 Melaka 441 3.0 357 3.9 N.Sembilan 528 3.6 444 4.8 Pahang 757 5.2 529 5.8 P.Pinang 761 5.2 648 7.1 Perak 1,435 9.8 855 9.3 Perlis 146 1.0 224 2.4 Selangor 2,059 14.1 1,048 11.4 Terengganu 533 3.6 476 5.2 Sabah 1,739 11.9 825 9.0 Sarawak 1,889 12.9 897 9.8 Kuala Lumpur 995 6.8 718 7.8 Labuan 48 0.3 34 0.4 Total 14,631 100.0 9,198 100.0
5.2. Equity Household with no access to water supply is defined as one with zero expenditure on water. As expected, the %age of households without access to water supply declines with higher levels of total expenditures (Table 18 and Figure 4).
27
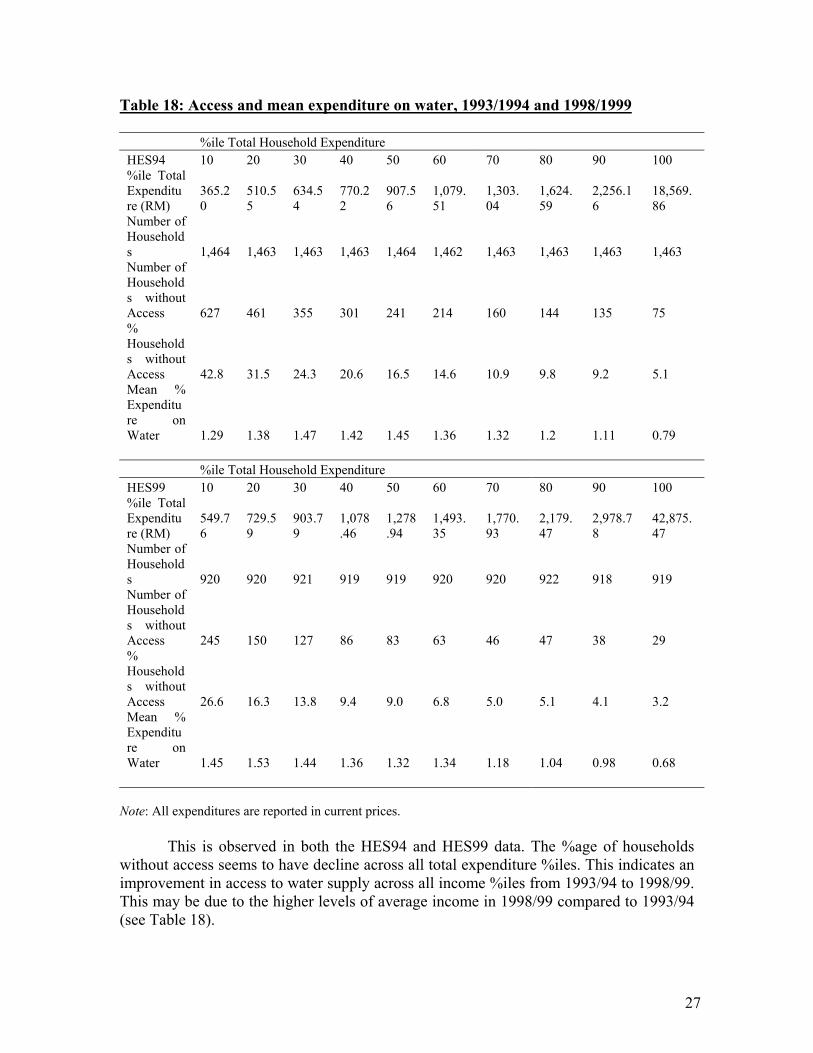
Table 18: Access and mean expenditure on water, 1993/1994 and 1998/1999
%ile Total Household Expenditure HES94 10 20 30 40 50 60 70 80 90 100 %ile Total Expenditure (RM)
365.20
510.55
634.54
770.22
907.56
1,079.51
1,303.04
1,624.59
2,256.16
18,569.86
Number of Households 1,464 1,463 1,463 1,463 1,464 1,462 1,463 1,463 1,463 1,463 Number of Households without Access 627 461 355 301 241 214 160 144 135 75 % Households without Access 42.8 31.5 24.3 20.6 16.5 14.6 10.9 9.8 9.2 5.1 Mean % Expenditure on Water 1.29 1.38 1.47 1.42 1.45 1.36 1.32 1.2 1.11 0.79 %ile Total Household Expenditure HES99 10 20 30 40 50 60 70 80 90 100 %ile Total Expenditure (RM)
549.76
729.59
903.79
1,078.46
1,278.94
1,493.35
1,770.93
2,179.47
2,978.78
42,875.47
Number of Households 920 920 921 919 919 920 920 922 918 919 Number of Households without Access 245 150 127 86 83 63 46 47 38 29 % Households without Access 26.6 16.3 13.8 9.4 9.0 6.8 5.0 5.1 4.1 3.2 Mean % Expenditure on Water 1.45 1.53 1.44 1.36 1.32 1.34 1.18 1.04 0.98 0.68
Note: All expenditures are reported in current prices.
This is observed in both the HES94 and HES99 data. The %age of households without access seems to have decline across all total expenditure %iles. This indicates an improvement in access to water supply across all income %iles from 1993/94 to 1998/99. This may be due to the higher levels of average income in 1998/99 compared to 1993/94 (see Table 18).

28
Figure 4: Percentage of households with access to water, 1993/94 and 1998/99
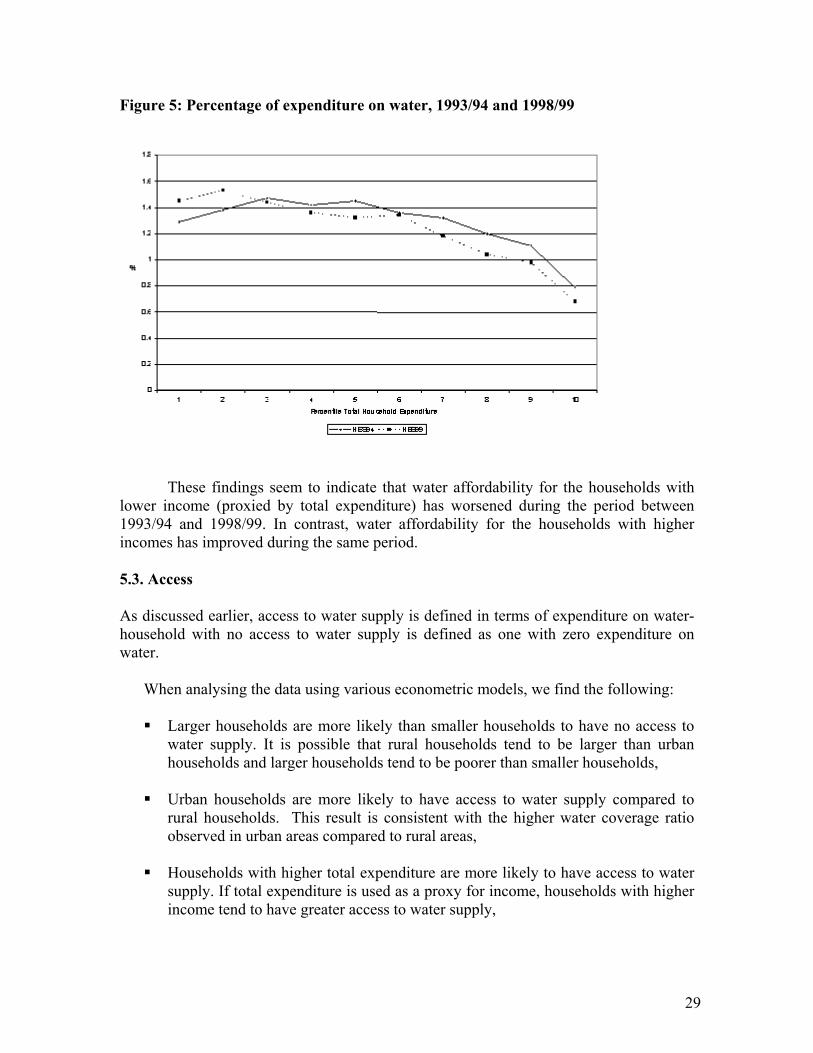
A comparison between the mean expenditure on water by total household expenditure %iles indicates the following (Table 17 and Figure 5): The %age of expenditure on water has increased for households in the lowest 20
%ile of total expenditures between 1993/94 and 1998/99 (and decreased or remained stable for other %ile).
The %age of expenditure on water has increased for households in the 30 %ile and above of total expenditures between 1993/94 and 1998/99.
29
Figure 5: Percentage of expenditure on water, 1993/94 and 1998/99
These findings seem to indicate that water affordability for the households with lower income (proxied by total expenditure) has worsened during the period between 1993/94 and 1998/99. In contrast, water affordability for the households with higher incomes has improved during the same period. 5.3. Access As discussed earlier, access to water supply is defined in terms of expenditure on water- household with no access to water supply is defined as one with zero expenditure on water.
When analysing the data using various econometric models, we find the following: Larger households are more likely than smaller households to have no access to
water supply. It is possible that rural households tend to be larger than urban households and larger households tend to be poorer than smaller households,
Urban households are more likely to have access to water supply compared to
rural households. This result is consistent with the higher water coverage ratio observed in urban areas compared to rural areas,
Households with higher total expenditure are more likely to have access to water
supply. If total expenditure is used as a proxy for income, households with higher income tend to have greater access to water supply,

30
Households in states where water distribution is undertaken by state-owned companies are more likely to have access to water than households in states where water distribution is undertaken by private companies. Privatisation does not seem to improve access to water.
5.4. Affordability Using various econometric models, we investigated the relationship between the affordability of water supply and other variables. Affordability in the above specification is couched in terms of the notion of ‘expenditure water poor’. A threshold of 5 % is adopted for this study. Generally, it is accepted that water bills should be around 3-5% of household expenditure. We took the higher threshold. The results imply that: Larger households are more likely to be ‘expenditure water poor’ than smaller
households. This implies that larger households tend to spend a larger proportion of their total expenditure on purchasing water,
Interestingly, urban households are more likely to be more ‘expenditure water
poor’ compared to rural households. It is possible that urban households have less alternative sources of water compared to their rural counterparts – thus resulting in greater proportion of total expenditure spent on water.
Households with higher total expenditures (a proxy for income) are less likely to
be ‘expenditure water poor’. This implies that households with higher income spend a smaller proportion of their income on purchasing water,
Households in states where water distribution is undertaken by private companies
are less likely to become ‘expenditure’ water poor compared to households in states where water distribution is undertaken by state-owned companies. One possibility is that water tariff in states with private water distribution companies are lower than water tariff in states with state-owned water distribution companies. The water tariff cannot be included as a variable in the models due to lack of data for the period before 2001.
In terms of difference in tariff levels between private and public sector, we find that: the range of tariff levels for states with private water distribution companies is
wider than those with state-owned ones the median tariff level in the former appears to be lower than the latter.
Our analysis with 2003 data shows that the tariff is kept reasonably low in
privatised states. This is linked to the fact that PSP and its varieties are still very sensitive
31
issues. This makes increasing prices to cost-recovery levels is difficult. This has been demonstrated by some political fallout over revising sewerage tariffs after privatization.
Finally, if lower threshold levels for ‘expenditure water poor’ is used (i.e. three and four %), the sign of the coefficient for total expenditures become positive. This implies that adopting a threshold level that is too low result in a definition of ‘expenditure poverty’ that is not very useful empirically.
These results show that the Malaysian government has been concerned only on assuring cheap water to its citizens. In this process, it neglected the need for increasing investments (or efficiency) to expand coverage and renew the water infrastructure. As a result, there is increasing pressure to privatise water services in order to recover increased costs. 6. Conclusion The development of water sector is crucial in order to improve and maintain Malaysia’s competitiveness as well as to eradicate poverty and improve the quality of life of its citizens. The achievements in this sector are fairly mixed. Water coverage is uneven across the different states. The more developed states have almost achieved universal water coverage while less developed states continue to improve water access particularly in the rural areas. Underinvestment in the water distribution systems has also resulted in very serious non-revenue water problem in some states. As a result, about half of the states in Malaysia are currently experiencing a financial deficit in their water operations. Many of the larger and more-developed states have opted to privatise the provision of water services in an attempt to solve problems in their water sector.
For consumers, the prevailing ‘lifeline’ tariff rates (based on WHO’s minimum water consumption benchmark) in the some of the states are relatively high. Access to treated water has improved in all income (proxied by total expenditure) categories between 1993/94 and 1998/99. However, water affordability for the households with lower incomes has worsened during the same period. The impact of privatisation on issues of access and affordability is mixed. Our analysis indicates that privatisation does not seem to have improved access to water. This is due partly by the fact that there is huge problem of cost-recovery, which hinders investments. Consequently, we also find that due to very strict rules for increasing tariff, the poor are safe from price hikes. What this study shows is that in order to expand coverage, renew infrastructure and cushion citizens from abusive tariff increase, the government should be able to strike a balance between encouraging investment (or improving efficiency) and at the same time having appropriate social policies. In the case of Malaysia, there is more emphasis placed on social policies without consideration of the broader issues of expanding coverage and investment.
At present, the Federal government is planning to reform the sector further to solve existing problems – particularly the non-revenue problem. More specifically, it proposes to place water supply management under the Federal government’s jurisdiction and create a national water asset company to undertake long-term investments in the sector. While this study indicates this to be in the right direction, it also suggests that the government needs to examine more carefully issues of equity, access and affordability in the context of the different institutional options for provision of water services.
32
References Amemiya, T. (1981). “Qualitative Response Models: A Survey,” Journal of Economic Literature, Vol.19, pp.1483-1536. Amemiya, T. (1984). “Tobit Models: A Survey,” Journal of Econometrics, Vol.24, pp.3-
61. Bennett, M., D.Cooke, C.Waddams Price.(2002). “Left out in the cold? New energy
tariffs, low-income households and the fuel poor,” Fiscal Studies, Vol.23, No.2, pp.167-194.
Asian Development Bank. (2001). “Project Completion Report on the Rehabilitation and
Upgrading of water Supply Systems Sector Project in Malaysia”, December. Brutton, Henry J. (1992). The Political Economy of Poverty, Equity and Growth: Sri
Lanka and Malaysia. New York: Oxford University Press. Department of Statistics (2000). Report on Household Expenditure Survey Malaysia
1998/99, Department of Statistics. Hall, David, Violeta Corral, Emanuele Lobina, and Robin de la Motte. (2005). “Water
Privatisation and Restructuring in Asia-Pacific”, Report Commissioned by Public Services International (PSI), January.
Lim Keng-Yaik. (2004). “Water Services Reform – The Way Forward,” Keynote address
Water Services Reform Seminar, Kuala Lumpur. Maddala, G. S. (1983). Limited-Dependent and Qualitative Variables in Econometrics.
Cambridge: Cambridge University Press. McFadden, D. F. (1974). “Conditional Logit Analysis of Qualitative Choice Behaviour,”
in Frontiers in Econometrics, edited by P. Zaremba. New York: Academic Press. Naidu, G. and Cassey Lee. 1997. “The Transition to Privatization: Malaysia.” In Ashoka
Mody (ed.), Infrastructure Strategies in East Asia: The Untold Story. World Bank, Washington DC.
United States Agency for International Development and OECD. (2005). Regional
Assessment Survey and Workshop on Full Cost Recovery for Water Utilities in Southeast Asia: Sharing International Experience and best Practice”,
Rachagan, S.Sothi. (2003). “Managing Water..…For People: Privatisation of Water –
Who Benefits?”, paper presented at Environmental Protection Society of Malaysia’s Annual Public Forum, 5 June, Kuala Lumpur.

33
Raja Dato’ Zaharaton Raja Zainal Abidin. (2005). “Water Services Agenda In The Ninth Plan”, Presentation at the Water Malaysia 2005 Conference, Kuala Lumpur, 12 -13 April.
Malaysian Water Association. (2001). Malaysia Water Industry Guide. Kuala Lumpur. ________ . (2002). Malaysia Water Industry Guide. Kuala Lumpur. ________ . (2003). Malaysia Water Industry Guide. Kuala Lumpur. ________ . (2004). Malaysia Water Industry Guide. Kuala Lumpur. World Health Organization. (2005). “Minimum water quantity needed for domestic use
in emergencies,” Technical Note No.5. Verbeek, M. (2004). A Guide to Modern Econometrics, Second Edition. New York: John
Wiley. Wooldridge, J. M. (2003), Introductory Econometrics: A Modern Approach, Second
Edition, New York: Thomson.