les études du cnc l’exportation television program exports ... · pdf...
TRANSCRIPT

les études du CNC L’exportation
september 2016 des
en 2015
French Television Program Exports in 2015

French television program exports in 2015 1
French Television Program
Exports in 2015
September 2016

French television program exports in 2015 2
ISSN 2110-5634
TV France International
5, rue Cernuschi 75017 Paris
Tel: +33 1 40 53 23 00
www.tvfrance-intl.com
Luc Bucaille, Stéphane Fournier, Mathieu Béjot
Centre national du cinéma et de l’image animée
Department of Studies, Statistics and Forecasting
12, rue de Lübeck 75784 Paris cedex 16
Tel: +33 1 44 34 38 26
www.cnc.fr
Louis Gauthier, Benoît Danard

French television program exports in 2015 3
CONTENTS
Definitions and methodology .......................................................................................... 4
I. Highlights ............................................................................................................... 5
II. Sales of TV programs ............................................................................................ 8
A. Geographical breakdown in sales of TV programs ........................................................ 8
a. Growth in French-speaking territories, Spain, and the UK .......................................................... 9
b. Strong growth in Poland, dip in Russia ...................................................................................... 12 c. Decline in North American markets............................................................................................ 13 d. Boom in multi-territory sales; rise in South Korea, but falls in China, Japan, and Southeast Asia
14 e. Growth in Africa .......................................................................................................................... 16
f. Rise in sales in the Middle East ................................................................................................. 16 g. Reduction in Latin America ........................................................................................................ 16
B. Analysis of sales by program genre ............................................................................. 17
a. Rise in animation sales .............................................................................................................. 18 b. Rise in fiction sales .................................................................................................................... 20 c. Rise in documentary exports ...................................................................................................... 21 d. Stability in format sales, fall in performing arts .......................................................................... 23
C. Diversification in program exports................................................................................ 24
a. New distribution outlets (VoD, mobile, IPTV) ............................................................................. 24
b. Inflight ......................................................................................................................................... 25 c. Other revenues........................................................................................................................... 25
III. Change in presales and international coproductions ...................................... 26
A. Fall in presales ............................................................................................................ 28
a. Dynamic investments from Germany, Belgium and Scandinavia, while UK and Netherlands slip
back ................................................................................................................................................ 29 b. Drop in North America and Asia................................................................................................. 31
B. Slight dip in coproduction spend .................................................................................. 31
a. Increase across all European countries except Belgium ........................................................... 33
b. Dip in North America and Asia ................................................................................................... 34
C. Higher volume of international coproductions .............................................................. 34
a. Fall in foreign input to majority-French coproductions for fiction and animation, stability for
documentaries ................................................................................................................................ 35 b. Rise in foreign funding for minority-French coproductions for documentary and animation ..... 37
IV. Companies exporting French TV programs ...................................................... 39
A. Change in concentration in the sector ......................................................................... 39
B. Change in concentration by genre ............................................................................... 39
Appendix ...................................................................................................................... 41

French television program exports in 2015 4
Definitions and methodology
Financial flows generated by French programs between France and abroad are examined here
from two angles:
- That of the participation of foreign partners in the prefinancing of French television programs
in the form of presales or investment in coproduction. It should be noted that presales and
coproductions are two separate legal categories. Investment through a coproduction gives the
investor certain ownership rights in the property, which may be shared with other coproducers.
A prebuy or presale only grants the buyer the right to broadcast the program within a limited
timescale and according to predefined terms of use. For the purposes of this document, where
the term “coproduction” is used without further qualification, it covers all programs benefitting
from foreign investment whether through a coproduction arrangement and/or presales. The
statistics on presales and coproduction investments come from the database of the CNC and
may differ to those published previously by the CNC due to subsidy adjustments paid in arrears
for previous years.
- That of the sale and export of programs. In this case, we are concerned with income which
was not anticipated in the program’s initial finance plan. The data provided here comes from an
ad hoc survey conducted among all the companies, whether members of TV France
International or not, engaged in distributing television programs abroad, or failing that, from
those producers who benefit from revenue generated for them by foreign distributors of their
programs.
Receipts from merchandising, sales of sports rights, and from publishing French channels
abroad (sales from the signal and extension of licenses), despite representing major sources of
revenue from the export of French television programs, are not included in the statistics within
the framework of this report.
In this report, a distinction is made between French-initiated coproductions and foreign-initiated
coproductions. French-initiated coproductions comprise:
Coproductions for which the financing from the French partners (broadcasters, producers,
financial aid, etc.) makes up the majority
Coproductions where the French partners’ financial stake outweighs that of any other
country involved in the venture and is therefore in a relative majority
A preponderant French contribution to the financing of a coproduction is considered as an
indication that the French producers involved have the main say on the artistic content and
production management. This is what is meant by a “French-initiated coproduction”.
Foreign-initiated coproductions may, in certain respects, be regarded as an investment in a
foreign production, meaning an import transaction rather than an export venture. However, for a
foreign-initiated coproduction to become entitled to French subsidies (which determines its
inclusion in these statistics), the French contribution to the project’s financing must amount to at
least 30% (20% for projects managed with Canada), with the same percentage of spending
made in France. However junior the French partners’ stake, the scale of financing and the
responsibility French production companies have in this type of coproduction justifies their
inclusion in this report.
French television program exports in 2015 5
I. Highlights
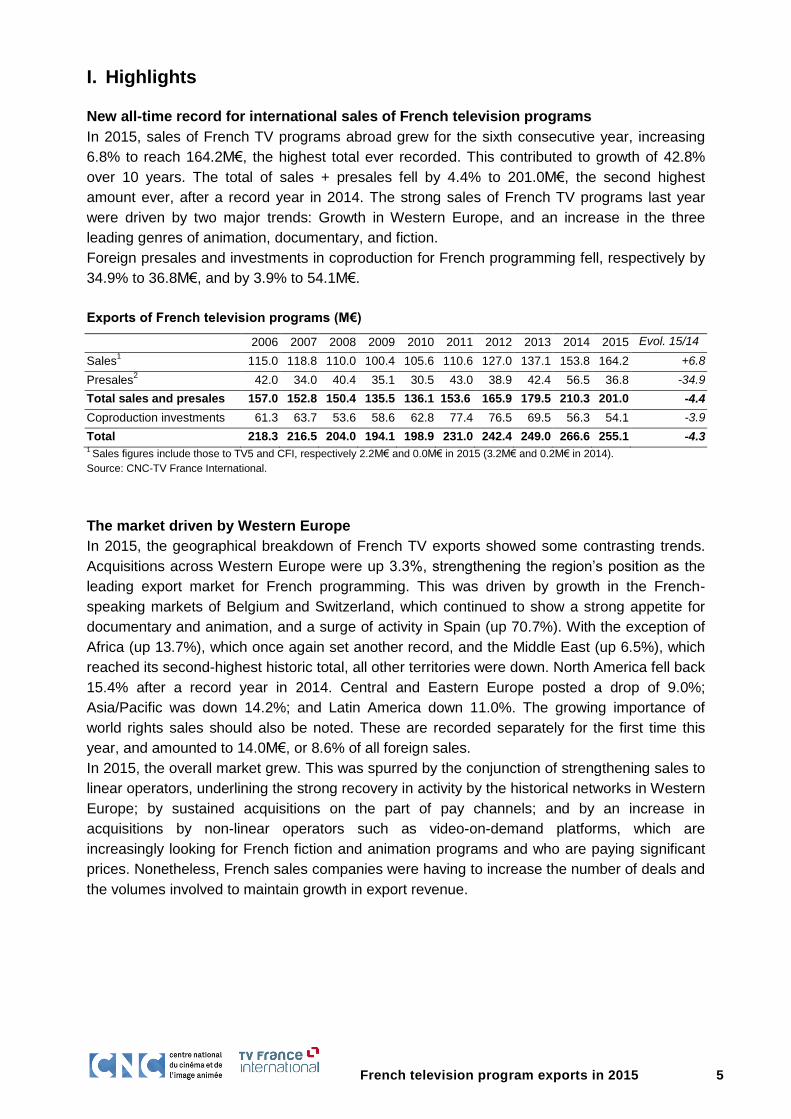
New all-time record for international sales of French television programs
In 2015, sales of French TV programs abroad grew for the sixth consecutive year, increasing
6.8% to reach 164.2M€, the highest total ever recorded. This contributed to growth of 42.8%
over 10 years. The total of sales + presales fell by 4.4% to 201.0M€, the second highest
amount ever, after a record year in 2014. The strong sales of French TV programs last year
were driven by two major trends: Growth in Western Europe, and an increase in the three
leading genres of animation, documentary, and fiction.
Foreign presales and investments in coproduction for French programming fell, respectively by
34.9% to 36.8M€, and by 3.9% to 54.1M€.
Exports of French television programs (M€)
2006 2007 2008 2009 2010 2011 2012 2013 2014 2015 Evol. 15/14
(%) Sales1 115.0 118.8 110.0 100.4 105.6 110.6 127.0 137.1 153.8 164.2 +6.8
Presales2 42.0 34.0 40.4 35.1 30.5 43.0 38.9 42.4 56.5 36.8 -34.9
Total sales and presales 157.0 152.8 150.4 135.5 136.1 153.6 165.9 179.5 210.3 201.0 -4.4
Coproduction investments 61.3 63.7 53.6 58.6 62.8 77.4 76.5 69.5 56.3 54.1 -3.9
Total 218.3 216.5 204.0 194.1 198.9 231.0 242.4 249.0 266.6 255.1 -4.3 1 Sales figures include those to TV5 and CFI, respectively 2.2M€ and 0.0M€ in 2015 (3.2M€ and 0.2M€ in 2014).
Source: CNC-TV France International.
The market driven by Western Europe
In 2015, the geographical breakdown of French TV exports showed some contrasting trends.
Acquisitions across Western Europe were up 3.3%, strengthening the region’s position as the
leading export market for French programming. This was driven by growth in the French-
speaking markets of Belgium and Switzerland, which continued to show a strong appetite for
documentary and animation, and a surge of activity in Spain (up 70.7%). With the exception of
Africa (up 13.7%), which once again set another record, and the Middle East (up 6.5%), which
reached its second-highest historic total, all other territories were down. North America fell back
15.4% after a record year in 2014. Central and Eastern Europe posted a drop of 9.0%;
Asia/Pacific was down 14.2%; and Latin America down 11.0%. The growing importance of
world rights sales should also be noted. These are recorded separately for the first time this
year, and amounted to 14.0M€, or 8.6% of all foreign sales.
In 2015, the overall market grew. This was spurred by the conjunction of strengthening sales to
linear operators, underlining the strong recovery in activity by the historical networks in Western
Europe; by sustained acquisitions on the part of pay channels; and by an increase in
acquisitions by non-linear operators such as video-on-demand platforms, which are
increasingly looking for French fiction and animation programs and who are paying significant
prices. Nonetheless, French sales companies were having to increase the number of deals and
the volumes involved to maintain growth in export revenue.

French television program exports in 2015 6
Growth in sales in the main genres: Animation, fiction, documentary
In 2015, growth in French TV program sales abroad was driven by animation (up 12.4% to
50.6M€), fiction (up 6.0% to 41.2M€), and documentary (up 6.3% to 37.1M€). Sales of formats
(fiction, game shows, light entertainment) were stable (up 0.1% to 22.9M€).
Exports by program genre (%)
Sales Evol. 15/14
(%)
Presales Evol. 15/14
(%)
Total Evol. 15/14
(%) Documentary 37.1 +6.3 6.4 +22.7 43.5 +8.4
Animation 50.6 +12.4 18.0 -15.3 68.6 +3.5
Fiction 41.2 +6.0 11.3 -60.4 52.6 -22.1
Music, performing arts 4.2 -11.7 1.0 -26.9 5.3 -15.1
Formats (fiction, game shows…) 22.9 +0.1 - - 22.9 +0.1
Various (news, excerpts...) 8.1 +11.2 - - 8.1 +11.2
Total 164.2 +6.8 36.8 -34.9 201.0 -4.4
Source: CNC-TV France International.
Fall in presales
In 2015, foreign presales of French TV programs registered a fall of 34.9% to 36.8M€, due to a
drop in presales of animation (down 15.3% to 18.0M€), and of fiction (down 60.4% to 11.3M€).
However, presales of documentaries increased by 22.7% to 6.4M€ in 2015. With an increased
market share of 12.0 points to 61.4% of total presales, Western Europe remained the leading
foreign partner of French producers in financing TV programs via presales. Meanwhile, North
America showed a slight dip of 4.9 points to 30.9% of the total. Presales of French programs to
the rest of the world fell to 6.6% of total presales in 2015, from 12.1% the previous year. This
notably involved a fall in Central and Eastern Europe (down 2.0 points to 0.5%), and in
Asia/Pacific (down 0.3 points to 2.2%).
Slight fall in coproduction investments
In 2015, foreign coproduction spending in French productions was down for the fourth
consecutive year to 54.1M€, compared to 56.3M€ in 2014. This fall was due to the drop in
coproduction money from North America (down 38.6%), after 2014, which saw some
exceptional performance for fiction. North America thus slipped from being the leading
coproducer in 2014, overtaken by Western Europe in 2015. The latter region registered an
increase of 59.7% to 34.9M€, accounting for 64.5% of total coproduction spending in 2015,
compared to 38.8% in 2014.
There was also a sharp fall in Asia/Pacific (down 75.9% to 1.3M€), which accounted for 2.4% of
all coproduction investments, down from 9.5% in 2014.

French television program exports in 2015 7
The volume of French programs coproduced with foreign investment (excluding magazine
shows) was up 11.8% in 2015 to 1,193 hours, compared to 1,067 hours in 2014.
The proportion of coproductions (majority- and minority-French) as part of the total volume of
French TV programming increased in 2015 to 24.7%, compared to 22.1% in 2014. One should
also note that in 2015, 88.5% of the volume of animation was coproduced with foreign partners,
up from 73.1% in 2014. Meanwhile, 44.5% of the volume of fiction programs was coproduced
with foreign partners, up from 39.0% in 2014.
Exports of French television programs by genre (M€)
1 Including sales to TV5 and CFI.
Source: CNC-TV France International.
Sales1 Presales Total sales + presales Investment in coproduction
2011 110.6 43.0 153.6 77.4
Fiction 20.0 18.9 38.8 17.8
Documentary 27.1 5.9 32.9 11.1
Animation 35.3 17.4 52.7 43.4
Music, performing arts 4.3 0.9 5.2 5.1
Formats (fiction, game shows…) 19.8 - 19.8 -
Various (news, excerpts...) 4.1 - 4.1 -
2012 127.0 38.9 165.9 76.5
Fiction 22.8 14.3 37.2 32.7
Documentary 29.7 4.5 34.2 15.0
Animation 43.9 18.8 62.7 23.2
Music, performing arts 4.6 1.3 5.9 5.4
Formats (fiction, game shows…) 21.4 - 21.4 -
Various (news, excerpts...) 4.4 - 4.4 -
2013 137.1 42.4 179.5 69.5
Fiction 26.0 5.2 31.3 21.9
Documentary 30.8 9.4 40.2 16.6
Animation 46.9 26.5 73.3 25.6
Music, performing arts 5.0 1.2 6.2 5.4
Formats (fiction, game shows…) 22.1 0.1 22.1 -
Various (news, excerpts...) 6.4 - 6.4 -
2014 153.8 56.5 210.3 56.3
Fiction 38.9 28.6 67.5 16.7
Documentary 34.9 5.2 40.1 9.9
Animation 45.0 21.2 66.3 24.4
Music, performing arts 4.8 1.4 6.2 5.3
Formats (fiction, game shows…) 22.8 0.0 22.8 -
Various (news, excerpts...) 7.3 - 7.3 -
2015 164.2 36.8 201.0 54.1
Fiction 41.2 11.3 52.6 8.3
Documentary 37.1 6.4 43.5 13.0
Animation 50.6 18.0 68.6 25.7
Music, performing arts 4.2 1.0 5.3 7.0
Formats (fiction, game shows…) 22.9 - 22.9 0.1
Various (news, excerpts...) 8.1 - 8.1 -

French television program exports in 2015 8
II. Sales of TV programs
In 2015, sales of French TV programs abroad rose by 6.8% to reach 164.2M€, a historic high.
This increase was driven by growth in the principal genres of programming. Sales of animation
returned to growth, and were up 12.4% to 50.6M€, an all-time record, after a slight dip in 2014.
However, the underlying growth curve has been constant since 2008 (30.7M€), equivalent to a
64.8% rise over the past eight years. Fiction and documentary programs were both up by more
than 6%. At the same time, sales of news/various programming grew by 11.2%. Only sales of
music/performing arts programs showed a fall of 11.7%.
Sales of French television programs (M€)
Source: CNC-TV France International.
A. Geographical breakdown in sales of TV programs
In 2015, the geographical breakdown of French TV program exports exhibited some contrasting
tendencies. Still the leading market for French productions, Western Europe saw acquisitions
increase by 3.3%, with a greater number of deals. The region generated more than half of all
export revenue (53.0%), a fall of 1.8 points. Sales to North America remained at a high level,
despite a 15.4% fall. Asia/Pacific was also down (14.2%), along with Central and Eastern
Europe (down 9.0%) and Latin America for the second consecutive year (down 11.0%).
Conversely, Africa showed strong growth for the fourth consecutive year, up 13.7% to set a
new record. Similarly, the Middle East again increased acquisitions (up 6.5%) to reach its
second highest ever level. The high level of world rights sales should be noted. These have not
been treated separately in the statistics for previous years, usually being attributed to the home
country of the company that acquired them. Such transactions involved 14.0M€, a significant
8.6% chunk of worldwide sales.
22.1 22.0 26.8 21.6 19.1 20.0 22.8 26,0 38.9 41.2
28.5 30.2 28.7
23.2 26.4 27.1 29.7
30,8
34.9 37.1
42.6 41.7 30.7
31.9 34.8 35.3
43.9 46,9
45.0 50.6 10.1 5.9 13.0
16.4 17.2
19.8
21.4 22.1
22.8
22.9
7.2 12.4 3.1
2.9 3.8
4.1
4.4
6.4
7.3
8.1
0
20
40
60
80
100
120
140
160
180
2006 2007 2008 2009 2010 2011 2012 2013 2014 2015
Fiction DocumentaryAnimation Music, performing artsFormat (fiction, game shows, light entertainment) Various (news, excerpts)
115.0 118.8 110.0
100.4 105.6
110.6
127.0
137.1
153.8
164.2

French television program exports in 2015 9
Sales of French television programs by geographical region (M€)
2006 2007 2008 2009 2010 2011 2012 2013 2014 2015 Evol. 15/14 (%)
Western Europe 72.0 77.7 72.1 62.9 62.2 61.3 62.2 78.1 84.2 87.0 +3.3
North America 14.2 10.3 8.4 9.5 12.2 12.2 16.9 16.1 21.6 18.3 -15.4
Asia/Pacific 9.3 6.4 5.6 8.6 10.2 14.3 18.4 13.1 17.5 15.0 -14.2
Central and Eastern Europe 9.6 11.8 10.7 10.5 12.3 13.8 16.9 13.9 14.2 13.0 -9.0
Africa 3.7 5.9 5.2 2.1 1.8 1.5 1.8 3.7 6.1 7.0 +13.7
Middle East 3.9 4.6 5.0 4.6 3.4 3.4 4.9 6.5 5.3 5.7 +6.5
Latin America 2.3 2.0 3.1 2.3 3.7 4.1 5.9 5.8 4.8 4.2 -11.0
World Rights² - - - - - - - - - 14.0 -
Total1 115.0 118.8 110.0 100.4 105.6 110.6 127.0 137.1 153.8 164.2 +6.8
1 Including sales to TV5 and CFI.
2 Contracts covering several territories worldwide.
Source: CNC-TV France International.
Breakdown of sales of French television program by region (%)
Source: CNC-TV France International.
a. Growth in French-speaking territories, Spain, and the UK
Despite a 16.5% drop in acquisitions in 2015, the German-speaking region remained the
leading buyer of French TV programs with 19.2M€, the second highest level ever. It was the
world’s leading market for French fiction and animation. However, imports of French programs
dipped across all genres, especially fiction (down 22.9%), documentary (down 19.2%), and to a
lesser extent animation (down 2.5%).
German channels continued to show an appetite for French drama series, which remain the
leading genre sold with revenue of 9.3M€ in 2015. The major national networks and theme
channels bought French fiction, such as RTL, which acquired season 2 of The Transporter
(12x45’ – Atlantique Productions/Maximal Productions/M6) from Lagardère Studios Distribution,
and Lazy Company (30x26’, Empreinte Digitale and Six Pieds sur Terre Production) from AB
International Distribution for its RTL Nitro channels; Pro7, which bought all available seasons of
Profiling from TF1 Studio (64x54’ – Beaubourg Audiovisuel); and ZDFneo, which acquired
Candice Renoir (38x52’ – Boxeur de Lune) from Newen Distribution.
Pay channels were also active, like Sky Deutschland which bought Versailles (6x52’ – Capa
Drama) from Zodiak Rights and The Last Panthers (6x52’ – Warp Film, Haut et Court TV) from
StudioCanal, while Sony Pictures Television International bought The Line, Spiral, and Spin.
Among successes in the area of documentary, blue-chip programs with a historical theme were
Western Europe
62.6
North America
12.3
Asia, Pacific
8.1
Central and
Eastern Europe
8.3
Middle East 3.4
Latin America
2.0
Africa 3.3
2006
Western Europe
53.0
North America
11.1
Asia, Pacific
9.1
Central and
Eastern Europe
7.9
Middle East 3.5
Latin America
2.5
Africa 4.3
World Rights
8.6
2015

French television program exports in 2015 10
popular with German broadcasters. For example, After Hitler (2x45’ – Cinétévé) was sold by
ZED to N24. And despite a slight fall in sales, German channels were still keen on French
animation, notably for strong properties such as Zig & Sharko (78x8’ – Xilam Animation), the
second season of which was sold to Super RTL by Xilam, and the series Polo (104x6’ - Bayard
Jeunesse, Fabrique d’images), sold by Newen Distribution to the KiKA channel.
For the fifth consecutive year, sales of French programs to Belgium increased to a historic high
of 15.2M€ (up 16.4%). Acquisitions were up across all genres except formats. Fiction remained
the leading genre sold (up 6.4%), while documentary and animation both showed strong growth
(up 81.5% and 53.8% respectively). Belgian channels remained loyal to French drama
programs, such as season 2 of The Returned (8x52’ – Haut et Court TV) sold by Zodiak Rights
to VRT and the commercial channel Be tv. Versailles was sold to the public broadcasters RTBF
and VRT to air on Eén. In terms of animation, Zorro the Chronicles (26x22’ – Cyber Group
Studios) was sold by Cyber Group Studios to RTBF and VRT.
Sales to the United Kingdom grew by 19.3% to 10.7M€. This upward trend was driven by a rise
in sales of fiction (up 143.0%), documentary (up 51.9%), and animation (up 8.9%). French
drama attracted sustained interest from a range of channels. Versailles and the second season
of The Returned were acquired respectively by BBC Two and Channel 4. Season 2 of The
Transporter was sold to Channel 5. The first season of Versailles was picked up by Amazon
Prime, the online retailer’s VoD service.
The Italian market has undergone some restructuring, but remains fragile, as shown by a
21.0% drop in acquisitions to 9.7M€ in 2015. The leading buyer of French animation in 2014,
sales to Italy more than halved in 2015 (down 55.5%). Commercial channels were interested in
programs such as Get Blake! (52x11’ – Marathon Media), sold by Zodiak Kids to Super!, and
Zig & Sharko, the second season of which was sold to K2, the kids’ channel owned by
Discovery. Conversely, Italian channels increased their acquisitions in terms of fiction (up
57.7%). This involved everything from cop dramas like Candice Renoir, sold to Fox Crime, and
Captain Sharif (28x52’ – Making Prod) sold by 100% Distribution to Giallo TV, a digital
terrestrial channel owned by Discovery, to family dramas like Josephine Guardian Angel
(75x90’ – DEMD, TF1) sold by Lagardère Studios Distribution to La Sette.
Spanish channels resumed buying French TV programming, with acquisitions jumping from
4.6M€ in 2014 to 7.9M€ in 2015 (up 70.7%), returning to their level before 2011. All genres
were up, with the exception of animation. Fiction benefited most from this recovery, with sales
of 4.3M€ in 2015, compared to 0.3M€ in 2014. For example, Versailles sold to the Movistar pay
channel, and The Transporter sold to pubcaster Antena 3. In terms of animation, acquisitions
tended to move away from the mainstream channels to digital youth channels, such as the kids’
channel Clan, part of the public RTVE group, which bought French animations like Zou
(156x11’ – Cyber Group Studios) and Get Blake!

French television program exports in 2015 11
With a 15.9% increase in acquisitions to 7.6M€, Switzerland set a new record, mainly thanks to
orders by TSR. Acquisitions were concentrated on documentary (up 69.8%), fiction (down
9.1%), and animation (up 42.7%).
Activity in Scandinavian countries fell for the second consecutive year (down 2.8% to 5.6M€).
Sales mainly involved animation (33.6%), formats (26.2%), and documentary (19.8%).
However, sales of fiction more than doubled from 0.5M€ in 2014 to 1.1M€ in 2015. It is
noteworthy that historical documentaries can find lucrative outlets with public groups like SVT
and NRK. As such, Surrender (1x90’ – Roche Productions) was sold to SVT2 by Terranoa.
Multi-territory deals in the Western Europe region fell by 28.0% to 4.2M€.
Sales of French television programs in Western Europe (M€)
2006 2007 20081 2009 2010 2011 2012 2013 2014 2015 Evol. 15/14 (%)
Germany, Austria 16.6 16.8 13.7 10.6 10.2 8.6 12.0 16.6 23.0 19.2 -16.5
Belgium 10.3 7.5 10.1 9.1 8.7 7.4 8.0 12.8 13.1 15.2 +16.4
United Kingdom, Ireland 7.0 8.4 6.9 4.6 5.2 7.4 8.3 6.5 9.0 10.7 +19.3
Italy 13.5 17.9 14.5 11.9 11.1 12.3 8.4 10.1 12.3 9.7 -21.0
Spain 9.1 9.9 11.6 8.9 8.8 8.0 4.0 5.4 4.6 7.9 +70.7
Switzerland 3.9 3.3 4.0 4.7 5.1 4.3 4.2 6.1 6.5 7.6 +15.9
Scandinavia, Iceland 4.5 6.0 4.4 4.4 7.3 5.6 6.2 6.7 5.8 5.6 -2.8
Netherlands, Luxembourg 1.5 2.0 2.4 2.0 2.1 1.9 2.9 1.6 2.7 4.6 +72.6
Western Europe² 1.5 2.1 1.3 1.5 0.6 3.5 6.6 11.4 5.9 4.2 -28.0
Portugal 0.9 1.5 1.1 2.4 1.8 1.7 1.1 0.7 1.0 1.5 +60.9
Greece, Cyprus, Malta - - 2.0 2.9 1.3 0.7 0.5 0.4 0.4 0.7 +56.9
Greece, Turkey 3.1 2.1 - - - - - - - - -
Total 72.0 77.7 72.1 62.9 62.2 61.3 62.2 78.1 84.2 87.1 +3.3 1 In 2008, the “Greece, Turkey” region became “Greece, Cyprus, Malta”. Turkey was broken out and counted in the Central and
Eastern Europe region. 2 Contracts covering several Western Europe territories.
Source: CNC-TV France International.
Country breakdown of French television program sales in Western Europe (%)
Source: CNC-TV France International.
Germany, Austria
23.1
Belgium 14.3
Spain 12.7
Great Britain, Ireland
9.7
Geece, Turkey
4.6
Italy 18.7
Netherlands, Luxembourg
2.0
Portugal 1.3
Scandinavia, Iceland
6.2
Switzerland 5.4
Western Europe Region
2.1
2006
Germany, Austria
22.1
Belgium 17.5
Spain 9.1
Great Britain, Ireland 12.3
Greece, Cyprus, Malta 0.7
Italy 11.1
NetherlandsLuxembourg
5.3
Portugal 1.8
Scandinavia Iceland
6.5
Switzerland 8.7
Western Europe Region
4.9
2015

French television program exports in 2015 12
b. Strong growth in Poland, dip in Russia
In 2015, Poland became the leading market in Central and Eastern Europe for the first time,
ahead of Russia, Ukraine, and the countries of the CIS. The country posted a surge in
acquisition of 147.1% to 3.8M€. The territory accounted for 29.6% of all imports of French
programs to Central and Eastern Europe, compared to 10.9% in 2014. Polish buyers were
particularly keen on fiction, notably period series like The Odyssey (12x52’ – Making Prod),
which 100% Distribution sold to TVP2, and crime series like Witnesses [Les Témoins] (6x52’ –
Cinétévé), sold to Ulica 13 by Newen Distribution.
Sales of French programs to Russia, Ukraine, and the countries of the CIS dropped by 48.1%
to 3.2M€ in 2015, which was notable for some drastic shifts in regulations towards more
protectionism and by a deep economic crisis. The region accounted for 25.0% of imports to
Central and Eastern Europe, compared to 43.8% in 2014. Animation soared by 78.7%,
becoming the top-selling genre in the region. For example, season 2 of Zig & Sharko was sold
to Carousel TV. Sales of fiction fell sharply (down 88.7%), as did formats (down 65.0%) and
documentaries (down 19.5%). Despite these big falls, there were a few standout sales, such as
the documentary series The Adventurers of Modern Art (6x52’ – Arte, Silex Films), sold by Arte
France to TV Kultura. Elsewhere, Channel One acquired Witnesses [Les Témoins] and
Versailles.
Revenue from the “Romania, Croatia, Bulgaria, Slovenia, others” region slipped back 5.0% to
1.4M€.
Sales of French TV programs to Turkey climbed to 1.4M€ in 2015, a rise of 14.8% on 2014.
Exports to the “Czech Republic, Slovakia” region slumped 30.1% to 1.1M€ in 2015.
Sales of French television programs in Central and Eastern Europe (M€)
2006 2007 20081 2009 2010 2011 2012 2013 2014 2015 Evol. 15/14 (%)
Poland 1.4 2.0 2.1 1.8 1.6 2.0 1.6 1.7 1.6 3.8 +147.1
Russia and CIS (Ukraine, Belarus, others) 3.9 4.8 3.1 4.1 5.7 6.8 7.6 4.4 6.2 3.2 -48.1
Romania, Croatia, Bulgaria, Slovenia, others - - 1.3 1.3 1.2 1.1 1.3 1.9 1.4 1.4 -5.0
Romania, Croatia, Bulgaria 0.5 1.0 - - - - - - - - -
Turkey - - 0.8 0.7 0.9 1.0 1.7 1.5 1.2 1.4 +14.8
Czech Republic, Slovakia - - 1.9 1.4 1.5 1.6 1.7 2.0 1.6 1.1 -30.1
Czech Republic 0.8 0.8 - - - - - - - - -
Hungary 0.7 1.2 0.8 0.7 0.5 0.5 0.7 1.0 1.4 0.9 -35.1
Central and Eastern Europe² 0.4 0.8 0.3 0.3 0.7 0.5 2.0 1.0 0.6 0.8 +24.2
Baltic countries (Lithuania, Estonia, Latvia) - - 0.4 0.3 0.2 0.3 0.3 0.4 0.3 0.4 +53.6
Baltic countries, Slovakia, Malta, Cyprus,
Slovenia 1.8 1.3 - - - - - - - - -
Total 9.6 11.8 10.7 10.5 12.3 13.8 16.9 13.9 14.2 13.0 -9.0 1
In 2008, Slovakia was combined with Czech Republic to make the “Czech Republic, Slovakia” region. Slovenia was included in
the “Romania, Croatia, Bulgaria” region, to give rise to the “Romania, Croatia, Bulgaria, Slovenia, other” region. The Baltic
countries have been combined in a single region, “Baltic countries (Lithuania, Estonia, Latvia)”. 2 Contracts covering several territories in Central and Eastern Europe.
Source: CNC-TV France International.

French television program exports in 2015 13
Country breakdown of French television program sales in Central and Eastern Europe (%)
Source: CNC-TV France International.
c. Decline in North American markets
In 2015, sales of French TV programs to North America fell 15.4% to 18.3M€, but still recorded
their second highest total after the peak of 2014. The United States remained the leading
territory in the region with 10.4M€ in imports in 2015 (down 24.0%). This fall is due to the drop
in sales of fiction (down 54.3%) and documentary (down 33.0%). However, these drops can be
explained by the exceptionally high figures in 2014 due to the signing of several major sales in
the country, and by the effect of declaring “world rights” deals separately for the first time, as
explained below. On the other hand, sales of animation were up 12.4%. Animation became the
leading genre in the territory, accounting for 45.9% of all exports in 2015, compared to 31.1%
the previous year. This was driven by demand from channels like Boomerang, which acquired
Peanuts (104x7’ – Normaal) from francetv distribution and Garfield from Mediatoon Distribution;
Disney Junior which bought Pjmasks (Frog Box); Nickelodeon which picked up Miraculous (Zag
Toon/Method Animation); and Nick Junior which acquired Alvin and the Chipmunks! (OuiDO
Productions).
Specialist channels like Sundance TV extended deals, such as the acquisition of the second
season of The Returned, while MHz Networks picked up six seasons of The Line (60x52’ –
Tetra Media Fiction) from 100% Distribution for broadcast followed by subscription VoD. Blue-
chip historical documentaries were also in demand from groups such as Discovery and Nat
Geo International, which notably bought Surrender (1x90’ – Roche Productions) from Terranoa.
VoD platforms, mainly subscription ones, are extending their reach around the world, especially
in North America. French productions are among the most popular programming offered by
these operators. For example, in animation, Netflix bought world rights to Oggy and the
Cockroaches (270x7’ – Xilam) from Xilam, while in terms of French fiction, Netflix acquired the
first season of Versailles. Documentary also benefited from this outlet, with the sale of the
historical series The Butterfly Effect (13x26’ – Mad Films, Les Films de la Butte) by Balanga to
Curiosity Stream, a VoD platform specializing in documentary.
A probable reason for the fall in reported sales to North America is that French exporters would
previously often declare world rights sales to US operators as sales to the United States,
depending on the legal domicile of the platform. In 2015, sales of world rights totaled 14.0M€.
Hungary 7.4
Baltic countries, Slovakia,
Malta, Cyprus, Slovenia
18.9
Poland 14.7
Czech Republic
8.4
Romania, Croatia, Bulgaria
5.3
Russia and CIS
(Ukrainia, Belarus, others)
41.1
Central and
Eastern Europe region
4.2
2006
Hungary 6.8
Baltic countries
(Lithuania, Estonia, Latvia)
3.2
Poland 29.6
Czech Republic, Slovakia
8.7
Romania, Croatia, Bulgaria, Slovenia,
others 10.4
Russia and CIS
(Ukrainia, Belarus, others)
25.0
Turkey 10.5
Central and
Eastern Europe region
5.8
2015

French television program exports in 2015 14
With imports worth 7.9M€ in 2015 (down 0.5%), sales to Canada were stable. Animation
became the leading genre sold in the territory (up 72.8%), and accounted for 36.7% of total
sales in 2015, compared to 21.1% in 2014. Public French-speaking channels like Radio
Canada and Télé-Québec remained the main clients for French sellers. Télé-Québec bought
Zorro the Chronicles. Documentary sales were also up 12.2%, driven by English-speaking
channels like Blue Ant, which acquired After Hitler (13x26’ – Mad Films, Les Films de la Butte),
sold by ZED. After four years of continual growth, format sales fell back in 2015 by 40.4%.
There was, however, one standout hit for the format Adam, the third season of which was sold
by CALT Distribution in Quebec.
Sales of French TV programs in North America (M€)
2006 2007 2008 2009 2010 2011 2012 2013 2014 2015 Evol. 15/14 (%)
United States 8.1 7.0 4.6 5.0 5.6 5.6 9.9 8.1 13.7 10.4 -24.0
Canada 6.1 3.3 3.8 4.5 5.7 5.9 6.5 8.0 7.9 7.9 -0.5
North America1 - - - - 0.8 0.7 0.5 0.0 0.0 0.0 -
Total 14.2 10.3 8.4 9.5 12.2 12.2 16.9 16.1 21.6 18.3 -15.4 1 Contracts covering several territories in North America.
Source: CNC-TV France International.
d. Boom in multi-territory sales; rise in South Korea, but falls in China, Japan, and
Southeast Asia
Multi-territory sales of French programs in Asia showed strong growth, going from 1.0M€ in
2014 to 3.8M€ in 2015. The region accounted for 25.5% of French program imports to Asia,
compared to 6,0% in 2014, often involving major international distribution platforms.
With sales worth 3.2M€ in 2015, exports to “China, Hong Kong, Taiwan” were down 10.0% on
2014. Access to the market in mainland China remains difficult, with contacts changing
frequently. Documentary and prestige performing arts programming appeal to Chinese
broadcasters, as illustrated by the sale of The International Circus Festival of Massy (1x90’ and
1x180’ – CLC Productions) by 100% Distribution. French animation found an outlet on local
VoD platforms like WeKids, which bought several cartoon shows from Cyber Group Studios
(Zou, Zorro the Chronicles, Mini Ninjas).
Sales to the “Singapore, Indonesia, and other Asian countries” region tumbled 62.6% to 2.5M€
in 2015. Territories in Southeast Asia remained keen on French animation, with the sale of Get
Blake! to Bright TV in Thailand and Zorro the Chronicles to Spectrum in Indonesia.
Broadcasters also bought some French fiction, such as season 2 of The Returned by VSTV in
Vietnam and The Transporter by RCTI in Indonesia.
In Japan, sales of French programs shrank by 19.2% in 2015 to 2.1M€. The country’s main
buyer, NHK made acquisitions in documentary and performing arts. The network bought Face
to Face (16x52’) from Balanga, and The Man Who Saved the Louvre (1x60’ – Ladybird Films)
from Wide. In terms of performing arts, NHK acquired Anna Karenina (1x90’ – Telmondis,
Mariinsky Theatre) from Telmondis Distribution.
In South Korea, sales of French TV programs soared 75.7% to 1.5M€ in 2015. Channels were
looking for documentary programming, such as The Adventurers of Modern Art (6x52’ – Arte,

French television program exports in 2015 15
Silex Films), which was sold to Skylife TV by Arte France. French animation also benefited from
some fresh opportunities, like the sale of Boyster (52x13’ – Je suis bien Content) by Superights
to Animax, which is the first European acquisition by the Korean channel.
Exports to Australia and New Zealand slipped 35.6% to 1.4M€ in 2015. Broadcasters in the
region were keen on historical documentaries and lifestyle series, but there were also some
exceptions is the area of fiction, like the sale of Witnesses and The Last Panthers to SBS.
Sales of French television programs in Asia-Pacific (M€)
2006 2007 20081 2009 2010 2011 2012 2013 2014 2015 Evol. 15/14 (%)
Asia/Pacific2 1.8 0.7 0.2 0.2 1.1 1.6 2.9 1.6 1.0 3.8 +261.3
China, Hong Kong, Taiwan - - 0.6 2.2 2.2 3.1 5.1 2.6 3.5 3.2 -10.0
China, Hong Kong 1.1 0.2 - - - - - - - - -
Singapore, Indonesia, other Asian countries - - 0.9 1.4 2.2 3.8 2.9 3.0 6.7 2.5 -62.6
Singapore, Thailand, Taiwan, other Asian
countries 1.1 0.6 - - - - - - - - -
Indonesia 0.3 0.0 - - - - - - - - -
Japan 1.9 2.4 1.6 2.0 2.0 2.2 3.1 1.8 2.6 2.1 -19.2
South Korea 0.7 0.8 0.6 0.5 0.9 1.2 1.5 0.9 0.8 1.5 +75.7
Australia, New Zealand 2.2 1.2 1.0 2.2 1.2 1.9 1.9 2.5 2.2 1.4 -35.6
India 0.1 0.5 0.6 0.1 0.6 0.5 1.0 0.7 0.5 0.5 -7.0
Total 9.3 6.4 5.6 8.6 10.2 14.3 18.4 13.1 17.5 15.0 -14.2 1 In 2008, Indonesia was included in the region “Singapore, Thailand, Taiwan, other Asian countries”, to form the region
“Singapore, Indonesia, other Asian countries”. Taiwan was included in the “China, Hong Kong” region. 2 Contracts covering several territories in Asia/Pacific.
Source: CNC-TV France International.
Country breakdown of French television program sales in Asia-Pacific (%)
Source: CNC-TV France International.
Australia, New
Zealand 24.6
China, Hong Kong 12.1
South Korea
7.8 India 1.3
Japan 20.4
Singapore, Thailand, Taiwan,
other Asian
countries 11.4
Asia / Pacific 19.0
Indonesia 3.4
2006 Australia, New
Zealand 9.4
China, Hong Kong,
Taiwan 21.1
South Korea
9.9
India 3.2 Japan
14.1
Singapore, Indonesia,
other Asian
countries 16.9
Asia / Pacific 25.4
2015

French television program exports in 2015 16
e. Growth in Africa
In 2015, exports of French TV programs to Africa totaled 7.0M€, up 13.7% over 2014. This
increase was driven by growth in fiction sales (up 424.3%), animation (up 232.9%),
documentaries (up 50.6%), and formats (up 124.4%). In animation, the series Zorro the
Chronicles was sold to e.tv in South Africa, while in the formats market, Parenthood Instruction
Manual (60x3’ – Elephant Story) was sold by Francetv distribution for a local version on TV5
Monde Afrique and Kanal 7 in Gabon.
f. Rise in sales in the Middle East
In 2015, receipts from program exports to the Middle East rose 6.5% to 5.7M€. This growth was
powered by the strong increase in sales of fiction, up 125.8%. However, sales remained
concentrated on formats, which fell 28.1% to 1.7M€ in 2015. In parallel, sales of animation
dipped by 11.1% and those of documentary by 10.8%. Channels like Al Arabiya continued to
show an interest in historical documentaries, illustrated by its acquisition of the program After
Hitler.
g. Reduction in Latin America
In 2015, exports of French programming to Latin America slipped 11.0% to 4.2M€. This drop
was due to sharp falls in Brazil (down 35.8%), Mexico
(down 23.0%), and Argentina (down 40.7%), the main markets in the region. The top-selling
genre in the region remained animation (down 19.3%). Despite the slowdown in local
economies and stiff competition from mainly American transnational operators, fiction sales
were up 16.5%, with standout sales such as The Transporter to UCV TV in Chile, and
Versailles and Captain Sharif to Globosat Brazil. Some lifestyle documentaries found buyers,
like Bon Appétit (10x52’ – Les Films d’Ici), which was sold by Balanga to Globo.
Multi-territory sales rose by 43.6% to 2.4M€. In animation, Discovery Kids Latin America
acquired Wubby School (52x13’ – Superprod) from Superights, while Sonic Boom (52x11’ –
OuiDo! Productions) was sold by Lagardère Studios Distribution to Cartoon Network. In the
area of fiction, the second season of The Returned (8x52’ – Haut et Court TV) was sold by
Zodiak Rights to HBO Latin America.

French television program exports in 2015 17
B. Analysis of sales by program genre
In 2015, sales across all genres of French TV program were up, with the exception of
music/performing arts. Sales of French animation shows returned to growth, with a rise of
12.4% in 2015 after a slight dip in 2014. They accounted for one third of total export receipts
(up 1.6 points to 30.8%). Fiction sales were up 6.0%, stabilizing the genre’s share at 25.1% of
all sales and retaining its position as the second-biggest selling genre, which it attained in 2014.
Sales of documentaries and magazine shows rose 6.3% for a stable share at 22.6% of total
receipts in 2015. Formats, game shows and light entertainment were up fractionally (up 0.1%)
and accounted for 13.9% of total revenue (down 1.0 point). On a smaller scale, sales of music
and performing arts programming shrank to 2.6% of total sales, whereas programs in the
“various” category edged up 0.2 points to 5.0% of the total.
Sales of French television programs by genre (M€)
2006 2007 20081 2009 2010 2011 2012 2013 2014 2015 Evol. 15/14 (%)
Animation 42.6 41.7 30.7 31.9 34.8 35.3 43.9 46.9 45.0 50.6 +12.4
Fiction 22.1 22.0 26.8 21.6 19.1 20.0 22.8 26.0 38.9 41.2 +6.0
Documentary,
magazine shows 28.5 30.2 28.7 23.2 26.4 27.1 29.7 30.8 34.9 37.1 +6.3
Formats (fiction, game shows,
light entertainment) - - 13.0 16.4 17.2 19.8 21.4 22.1 22.8 22.9 +0.1
Formats, news, various 7.2 12.4 - - - - - - - - -
Various (news, excerpts...) - - 3.1 2.9 3.8 4.1 4.4 6.4 7.3 8.1 +11.2
Game shows, light
entertainment 10.1 5.9 - - - - - - - - -
Music, performing arts 4.5 6.6 7.8 4.4 4.3 4.3 4.6 5.0 4.8 4.2 -11.7
Total 115.0 118.8 110.0 100.4 105.6 110.6 127.0 137.1 153.8 164.2 +6.8 1 In 2008, the classification of genres was changed to differentiate sales of formats from sales of news and excerpts.
Source: CNC-TV France International.
Breakdown of French television program sales by genre (%)
Source: CNC-TV France International.
Animation 37.0
Documentary 24.8
Fiction 19.2
Game shows, light
entertainment 8.9
Format, news, various
6.3
Music, performing
arts 3.9
2006
Animation 30.8
Documentary 22.6
Fiction 25.1
Formats (fiction, game shows, light entertain-
ment) 13.9
Various (news,
excerpts...) 5.0
Music, performing
arts 2.6
2015

French television program exports in 2015 18
a. Rise in animation sales
In 2015, sales of French animation programming once again grew, climbing 12.4% over 2014
to reach 50.6M€. The genre accounted for 30.8% of all foreign sales – an all-time record.
In many countries, the big mainstream networks have shifted their animation offer to the
specialist digital terrestrial channels that have blossomed, and to multinational kids’ channels
(Disney Channel, Cartoon Network, Nickelodeon, etc.). These channels have much lower
programming budgets, which means prices are now half or one-third of what was previously
paid, even in relatively wealthy territories. Exporters have, however, managed to make up for
this shortfall by selling larger volumes and through more intense management of rights
windows.
The major American groups like Cartoon Network and Discovery continued to offer large sums
for world rights, but these deal were concentrated on only a few programs, and often involved a
wide geographical area.
Video-on-demand platforms like Netflix and Amazon continued to be active players, and now
make up a significant part of the animation marketplace. This development is more visible in
English-speaking territories (United States, United Kingdom, Canada), where sales used to be
the exception.
Broadcasters were chiefly looking for comedy animation shows for 6-10-year-olds. Pre-school
animation was also in strong demand, since it is usually sold in large volumes and is more
resistant to obsolescence, making it especially adapted to the consumer patterns of on-demand
platforms. In terms of show length, the 12-13 minute and 7-8 minute formats were most
popular, marking a shift away from the traditional runtime of 26 minutes. These increasingly
short programs require a shorter attention span on the part of children, allowing broadcasters to
insert ad breaks more easily.
Breakdown of French animation sales by region (%)
Source: CNC-TV France International.
Africa 1.4
North America
16.4
Latin America
3.2
Asia / Pacific
9.8
Western Europe
60.7
Central and
Eastern Europe
5.8
Middle East 2.8
2006
Africa 2,4% North
Amrica 13,1%
Latin America
3,9%
Asia / Pacific 14,0%
Western Europe 40,1%
Central and Eastern Europe 9,2%
Middle East 1,9%
World Rights 15,4%
2015

French television program exports in 2015 19
Since 2006, there has been increasing diversification in the territories buying French animation,
notably in Asia, Central and Eastern Europe, and Latin America. Animation sales to Western
Europe fell by 24.4% to 20.3M€ in 2015. The region accounted for 40.9% of receipts from the
genre in 2015, compared to 59.6% in 2014. Germany became the leading European buyer of
French animation, ahead of the English-speaking region (UK + Ireland). Germany has a well-
developed kids’ channel market (Super RTL, Kika, Nickelodeon), and is receptive to French
shows. For example, the series Angelo Rules (78x7’, TeamTO and Cake Entertainment) has
proved a sustained hit on Super RTL for the past five years.
Animation sales in Asia/Pacific were up 14.3% to 7.1M€ in 2015, remaining the second-biggest
export region after Western Europe. Asia/Pacific generated 14% of export receipts from French
animation in 2015, compared to 13.8% in 2014. Sales were driven by major volume deals to
emerging countries such as Thailand and Indonesia, where there are growth opportunities for
merchandising and ancillary rights for powerful properties. Specialist operators like Disney
Channel and Cartoon Network remain key partners in the region, both for sales and pre-
financing.
French animation sales to North America rose 14.7% to 6.6M€. The region accounted for
13.1% of total animation sales, compared to 12.8% in 2014. While activity was maintained
among established broadcasters, this growth was mainly driven by the acquisition policy of VoD
platforms like Netflix and Hulu, which are looking for shows that extend to several seasons.
In Central and Eastern Europe, sales of animation topped 4.7M€ in 2015, a hike of 104.9%
over 2014. The region accounted for 9.2% of French animation exports in 2015, compared to
5.1% in 2014. Sales to Russia grew by 78.7% to 1.5M€ in 2015, up from 0.8M€ in 2014. Given
the low prices involved in territories like Slovenia and Hungary, package sales are favored
there.
In 2015, animation sales to Latin America dipped 19.3% to 2.0M€. The most lucrative deals
were mainly done with the major American groups operating transnational channels.
Negotiations with the national public broadcasters remain complicated, with long decision-
making processes, notably in Mexico, Chile, and Brazil. Nonetheless, there have been some
successful deals concluded. Half of the schedule and half of the audience on Gloob is made up
of French programs. Thanks to the ratings for ALVINNN!!! and the Chipmunks and Miraculous
(a 25% audience share for the latter), Gloob is the third most-watched kids’ channel in Brazil.
In the Middle East, sales of French animation slipped back 11.1% to 1.0M€.

French television program exports in 2015 20
b. Rise in fiction sales
In 2015, sales of French fiction sales on the international marketplace climbed for the fifth
consecutive year, up 6.0% to 40.6M€. Western Europe confirmed its place as the leading
export region for French fiction, accounting for 74.5% of total sales in 2015, compared to 60.5%
in 2014. The genre’s share of total export sales fell by 0.2 points in 2015 to 25.1%.
There is now strong interest in the international marketplace for French fiction shows. The
quality of French series is widely acknowledged, and the increase in volumes produced (two
seasons for The Returned, three seasons for Braquo, six seasons for The Line, three seasons
for Candice Renoir) has opened the door for new linear and non-linear distributors. Prices are
also rising. French fiction can boast a diverse offer, from the cop series Captain Sharif, to the
fantasy series Trepalium and the family and youth-oriented series Parenthood Instruction
Manual.
Foreign channels were also looking for mini-series and stand-alone films dealing with topical
issues, such as Woman Under Influence (1x98’ – Leonis Productions) sold by TF1 Studio.
The top-selling length abroad remained the 52-minute format, mainly in the form of series or
mini-series.
Geographical breakdown of French fiction sales (%)
Source: CNC-TV France International.
In 2015, sales of fiction to Western Europe grew by 30.6% to 30.7M€. The region was the main
export market for French fiction, generating 74.5% of total receipts, up 14 points on 2014.
Taken together, Germany and Austria remained the leading buyer of French fiction, ahead of
Belgium. French fiction was attracting renewed interest in markets in southern Europe. Sales to
Spain set a new record with 4.3M€ in 2015, compared to 0.3M€ in 2014, while exports to Italy
grew by 57.7%. Beyond flagship series, channels in southern Europe were also seeking large-
volume mainstream series like Cordier and Son, Judge and Cop, and Josephine Guardian
Angel.
Africa 0.9
North America
4.7
Latin America
1.6
Asia / Pacific
3.0
Western Europe
74.1
Central and
Eastern Europe
14.5
Middle East 1.2
2006 Africa 5,0%
North Amrica 7,0%
Latin America
2,3%
Asia / Pacific 3,1%
Western Europe 74,5%
Central and Eastern Europe 5,8%
Middle East 0,8%
World Rights 1,6%
2015

French television program exports in 2015 21
Sales of French fiction to North America halved to 2.9M€. Broadcasters in the United States cut
back on acquisitions (down 54.3%) last year, after 2014 that was notable for sales of some
major series. The total reported receipts figure was affected by the probable shift of some sales
declared in 2014 as US deals, but which now appear in the new category of “world rights”.
Local competition remained very strong, while dubbing and subtitling still represent a significant
cultural barrier. Canada also saw fewer acquisitions, down 6.8%.
Sales of French fiction in Central and Eastern Europe fell by 58.3% to 2.4M€. The region
showed less interest in French fiction, notably across the Czech Republic, Hungary, Slovakia,
and Slovenia. These countries were turning more towards local production, or, for economic
reasons, to Turkish telenovelas, which are low-cost series with big volumes.
In Africa, sales of fiction surged from 0.4M€ in 2014 to 2.1M€ in 2015, showing a very
encouraging level of activity for French fiction programming. The region has strong potential for
growth. There are increasing opportunities for adapting formats for short comedy series.
French fiction sales to Asia/Pacific fell by 48.3% to 1.3M€ in 2015. Apart from Japan and the
occasional deal with China and South Korea, selling fiction programs in Asia remains very
complicated, due to cultural differences and the production language.
In Latin America, sales of fiction were up 16.5% to 0.9M€. Competition is very stiff from local
productions, a situation not helped by the acquisitions policies of pan-American channels,
which prefer US-made fictions.
c. Rise in documentary exports
Sales of French documentaries abroad were up 6.3% to 37.1M€ in 2015. The genre accounted
for 22.6% of total receipts, compared to 22.7% in 2014.
Channels were increasingly looking for event programming linked to anniversary dates, with
high-end production values, as illustrated by sales of Surrender by Terranoa and After Hitler by
ZED. Besides event documentaries, often with a topical link, broadcasters are looking for series
with large volumes for fairly low prices. This particularly involves lifestyle, travel and discovery
programming. Historical and scientific documentaries were also a popular export, whether as
stand-alone or series. In terms of runtime, 52 and 26 minutes remained the most sought-after
formats by foreign channels.

French television program exports in 2015 22
Geographical breakdown of French documentary sales (%)
Source: CNC-TV France International.
In 2015, Western Europe remained the leading foreign market for Gallic documentaries,
accounting for 45.8% of total receipts. With the exception of Germany + Austria, Scandinavia,
and Italy, documentary acquisitions were up across the region. The German-speaking countries
nonetheless remained the leading buyers in 2015, despite a drop of 19.2%. The biggest growth
was seen in the French-speaking territories of Belgium and Switzerland, especially the former,
where acquisitions were up 81.4%, driven by RTBF.
Documentary sales in North America fell back 16.2% to 6.4M€ in 2015. The region accounted
for 17.3% of documentary receipts in 2015, compared to 22.0% in 2014. Receipts from Canada
were up 12.2%, with most sales being made in the French-speaking province to Radio Canada
or Télé-Québec, notably in the travel, discovery and current affairs segments.
In Asia, sales of French documentaries fell by 22.2% to 4.0M€ in 2015. In Japan, NHK
remained a loyal client for French programs, especially with a historic theme. China is still a
complex market, were closing a deal remains a complicated affair, particularly due to regular
changes in both negotiation partners and regulations. Emerging countries like Indonesia,
Thailand, and Vietnam all tend to favor package deals, especially for series dealing with fashion
and French lifestyle. The ability to deliver in HD or 4K is now a major plus in the eyes of
Japanese and Korean buyers.
In Central and Eastern Europe, acquisitions of French documentaries slipped by 17.8% to
3.8M€, which meant the region’s market share dipped 3 points to 10.3% of total sales. Sales to
Russia fell 19.5%. In Central and Eastern Europe, buyers were seeking high volumes of
programming, and were keen on historical, travel, and discovery documentaries.
Receipts from Latin America in 2015 from French documentaries fell 25.3% to 0.8M€. The
region remains of marginal significance for the export of French documentary, with Brazil and
Argentina the main buyers on the continent. The need for a Spanish or Portuguese version can
complicate sales.
In the Middle East, sales of French documentaries edged back to 1.0M€ in 2015, compared to
1.1M€ in 2014.
Africa 2.9 North
America 17.1
Latin America
1.2
Asia / Pacific 13.2 Western
Europe 55.1
Central and
Eastern Europe
7.3
Middle 3.1
2006 Africa 2,9%
North Amrica 17,3%
Latin America
2,1%
Asia / Pacific 10,7%
Western Europe 45,8%
Central and
Eastern Europe 10,3%
Middle East 2,6%
World Rights 8,2%
2015

French television program exports in 2015 23
d. Stability in format sales, fall in performing arts
Foreign sales of French formats (fiction, game shows and light entertainment) were stable (up
0.1%), going from 22.8M€ in 2014 to 22.9M€ in 2015. Prices attained for format rights were
down in practically all territories, though this was sometimes compensated by a favorable
exchange rate with the dollar. Revenue from format sales was maintained by an increase in the
number of programs optioned or adapted.
The leading territories (UK, Belgium, Canada) all saw a fall in format acquisitions, whereas new
territories were turning to French formats, such as the United States and Africa.
Formats allow risk to be minimized, since they are built on a formula that has already proved
itself, while at the same time offering audiences programming with a local feel. French exports
in the field are very diverse, ranging from now-classic game shows like Countdown (Des
Chiffres et des Lettres) (francetv distribution) and Intervilles (Mistral), whose success is well
established, and more recent concepts which are starting to break through on the international
stage like Slam (Effervescence Prod), which sold to SLO1, Slovenia’s leading public
broadcaster.
In terms of fiction, the format market is developing for short programs, such as Parenthood
Instruction Manual, which has attracted interest from major markets in both Western Europe
and North America. Adaptation rights have also been optioned or exercised for some big
international hits in major territories like the United States for parallel broadcast of the original
work.
Geographical breakdown of French format sales (%)
Source: CNC-TV France International.
In 2015, the majority of receipts from format sales came from Western Europe
(up 9.4 points to 65.5%). The main buyers were the UK and Belgium. Sales to Belgium involved
both the original French programs and their local adaptation.
Sales of French formats to the Middle East fell by 28.1% to 1.7M€.
Africa 5.3
North America
7.0 Latin America
1.3
Asia / Pacific
6.1
Western Europe
65.5
Central and Eastern Europe
7.2
Middle East 7.6
2015

French television program exports in 2015 24
Central and Eastern Europe accounted for 7.2% of French format acquisitions in 2015, down
from 9.8% in 2014. Revenues from Russia, the main buyer in the region, tumbled 65.0% to
0.3M€.
Sales of French formats to North America fell 39.3% to 1.6M€ in 2015. While sales to the
United States rose by 17.4% to 0.4M€, those to Canada, a regular buyer of French formats,
dropped by 40.4%.
Sales to the Asia/Pacific region fell by 27.1% to 1.4M€.
Sales in the category “various”, which mainly comprises news programming and extracts,
increased 11.2% to 8.1M€.
In 2015, exports of music and performing arts programs dipped to 4.2M€ (down 11.7%). Asian
channels showed an appetite for prestige performing arts programs, for which French
producers have a solid reputation.
C. Diversification in program exports
a. New distribution outlets (VoD, mobile, IPTV)
For the purposes of this study, all new means of transmitting programs other than traditional TV channels – whether terrestrial, cable, satellite or ADSL – are considered as new methods of distribution. Revenues from the distribution of French programs on new media abroad in 2015 rose to
11.2% of export receipts, up from 8.9% in 2014. Revenue from video-on-demand (VoD) grew
from 7.9% in 2014 to 10.8% in 2015. This is an average across all genres, but is significantly
higher in terms of animation, while fiction and documentary are carving out a growing space.
This market is developing in particular in the area of subscription VoD. Besides the global
operators like Netflix and Amazon, each major territory and media group has its own
subscription offer. For example, the platform Walter Presents was launched in December 2015
in the United Kingdom, and is dedicated to non-English-speaking drama. Formed as a
partnership between Global Series Network and Channel 4, it screens a great many French
series such as No Limit, Elite Squad, and Flight of the Storks sold by TF1 Studio, Spin sold by
100% Distribution, and Kaboul Kitchen sold by AB International Distribution. The prices paid
remain modest, but this new type of distribution channel provides excellent exposure for French
fiction. The platform currently offers 700 hours of series, which is expected to triple by the end
of 2016.
These new operators look set to multiply and become fresh clients for French sales companies.
They are a vector for growth and herald the prospect of new markets by providing visibility to
French distributors and by boosting the notoriety of their catalogs that could result in sales to
mainstream channels.
However, sales companies draw attention to the technical constraints of meeting the VoD
platforms’ requirements for the delivery of programs.
Receipts from the physical video market were down to 3.1% of all receipts (down 1.8 points on
2014).

French television program exports in 2015 25
b. Inflight
In 2015, the inflight market (sale of film and TV rights to airlines) generated 0.8% of total export
receipts. It represents an attractive additional source of revenue since it rarely involves
exclusive rights. Animation, documentary, and “light” fiction were the most popular genres with
airlines. Language remains an obstacle, since sellers need to have several versions available
to access this market.
c. Other revenues
Receipts from merchandising, the sale of sport rights, and broadcasting French channels
abroad (sales of the signal and extension of licenses, such as Mezzo and TiJi throughout
Europe and in Russia) are not covered by this study, but they do nonetheless represent
significant revenues.

French television program exports in 2015 26
III. Change in presales and international coproductions
In 2015, foreign financing in French TV production (covering both coproduction and presales)
fell to 90.9M€, down 19.4% on 2014. This trend is explained by a sharp drop in foreign
presales, which totaled 36.8M€ in 2015, a 34.9% fall on the previous year, and slight fall in
coproduction funding, down 3.9% to 54.1M€.
Geographical breakdown of international investments in presales and coproductions1 (M€)
Western
Europe
North
America
Central and
Eastern
Europe
Asia /
Pacific
Latin
America
Middle
East Africa Others²
Total
world
2006
Presales 27.1 9.0 0.1 3.9 0.0 0.1 0.0 1.6 42.0
Coproductions 29.0 20.3 0.6 8.0 0.2 0.4 0.5 2.3 61.3
Total 56.1 29.3 0.7 11.9 0.2 0.5 0.5 3.9 103.3
2007
Presales 22.2 7.6 0.1 0.5 0.4 0.0 0.2 2.8 34.0
Coproductions 36.1 11.1 1.0 12.9 0.6 0.0 0.2 1.9 63.7
Total 58.3 18.7 1.2 13.4 1.0 0.1 0.3 4.7 97.7
2008
Presales 27.1 10.9 0.3 0.6 0.1 0.1 0.1 1.1 40.4
Coproductions 33.3 16.3 1.2 1.5 0.2 0.9 0.1 0.3 53.6
Total 60.3 27.2 1.5 2.1 0.2 1.1 0.2 1.4 94.0
2009
Presales 26.8 3.8 0.2 2.3 0.0 0.1 0.3 1.5 35.1
coproductions 40.0 9.9 1.0 6.5 0.3 0.3 0.2 0.4 58.6
Total
T
66.8 13.7 1.2 8.8 0.3 0.4 0.5 1.9 93.6
2010
Presales 18.7 8.0 0.2 1.4 0.0 0.1 0.1 2.0 30.5
Coproductions 34.2 13.8 1.1 8.2 1.0 0.3 1.2 3.2 62.8
Total 52.9 21.7 1.3 9.6 1.0 0.4 1.3 5.2 93.3
2011
Presales 20.9 15.3 2.8 0.3 0.2 0.1 0.2 3.3 43.0
Coproductions 42.2 23.0 2.0 7.4 0.2 0.4 0.5 1.6 77.4
Total 63.1 38.3 4.9 7.7 0.4 0.5 0.6 4.9 120.4
2012
Presales 22.8 7.7 0.1 2.3 0.7 0.1 0.0 5.2 38.9
Coproductions 40.6 17.6 1.6 10.0 3.2 0.3 1.8 1.3 76.5
Total 63.4 25.2 1.7 12.4 3.9 0.4 1.9 6.5 115.4
2013
Presales 24.9 7.5 0.3 4.9 0.4 0.1 0.1 4.2 42.4
Coproductions 51.6 8.4 1.8 4.7 0.2 1.1 0.8 0.9 69.5
Total 76.4 15.9 2.1 9.6 0.6 1.3 0.9 5.1 111.9
2014
Presales 27.9 20.2 1.4 1.4 0.2 0.3 0.4 4.7 56.5
Coproductions 21.9 23.9 2.8 5.4 0.3 0.3 1.5 0.3 56.3
Total 49.8 44.1 4.2 6.8 0.4 0.6 1.9 5.0 112.8
2015
Presales 22.6 11.4 0.2 0.8 0.2 0.1 0.0 1.5 36.8
Coproductions 34.9 14.7 1.2 1.3 0.2 0.5 0.4 0.9 54.1
Total 57.5 26.0 1.4 2.1 0.5 0.6 0.4 2.4 90.9 1 Including performing arts.
2 Including unspecified: cases for which the detail of the presales territories and/or foreign coproductions did not figure in the
financing plan of works at the time of extraction of data from the CNC figures. This is programming awaiting definitive authorization.
Source: CNC.

French television program exports in 2015 27
International investments in presales and coproductions by genre (M€)
Animation Fiction Documentary Performing arts Magazine
shows Total
2006
Presales 24.0 6.7 9.1 2.1 - 42.0
Coproductions 32.7 10.6 15.8 2.0 0.2 61.3
Total 56.7 17.3 24.9 4.1 0.2 103.3
2007
Presales 18.3 7.8 6.5 1.4 0.1 34.0
Coproductions 35.2 16.3 9.5 2.5 0.1 63.7
Total 53.5 24.1 16.0 3.9 0.2 97.7
2008
Presales 17.2 15.5 6.1 1.5 - 40.4
Coproductions 25.7 10.2 15.5 2.2 0.1 53.6
Total 42.9 25.7 21.6 3.7 0.1 94.0
2009
Presales 20.2 5.0 7.7 2.1 - 35.1
Coproductions 31.1 12.2 12.9 2.4 - 58.6
Total 51.3 17.2 20.6 4.5 - 93.7
2010
Presales 11.3 8.7 9.0 1.3 0.3 30.5
Coproductions 31.3 12.8 13.7 5.0 0.1 62.8
Total 42.6 21.5 22.7 6.3 0.4 93.3
2011
Presales 17.4 18.9 5.9 0.9 0.0 43.0
Coproductions 43.4 17.8 11.1 5.1 - 77.4
Total 60.8 36.7 17.0 6.0 0.0 120.4
2012
Presales 18.8 14.3 4.5 1.3 - 38.9
Coproductions 23.2 32.7 15.0 5.4 0.2 76.5
Total 42.0 47.0 19.5 6.7 0.2 115.4
2013
Presales 26.5 5.2 9.4 1.2 0.1 42.4
Coproductions 25.6 21.9 16.6 5.4 - 69.5
Total 52.1 27.1 26.0 6.6 0.1 111.9
2014
Presales 21.2 28.6 5.2 1.4 0.0 56.5
Coproductions 24.4 16.7 9.9 5.3 - 56.3
Total 45.6 45.3 15.1 6.7 0.0 112.8
2015
Presales 18.0 11.3 6.4 1.0 - 36.8
Coproductions 25.7 8.3 13.0 7.0 0.1 54.1
Total 43.7 19.6 19.4 8.0 0.1 90.9
Source: CNC.

French television program exports in 2015 28
A. Fall in presales
In 2015, presales of French TV programs abroad fell by 34.9% to 36.8M€, after an exceptional
year in 2014, notably for sales into North America.
With a 12-point increase in its market share to 61.4% of total presales, Western Europe
remained the leading partner for French producers in terms of financing TV programs through
presales. Meanwhile, North America showed a slight fall of 4.9 points to 30.9% of total
presales. Presales of French programming to the rest of the world tumbled to 6.6% of total
presales in 2015 (12.1% in 2014). This notably involved a dip in Central and Eastern Europe of
2.0 points to 0.5% of the total, and a fall in Asia/Pacific of 0.3 points to 2.2%.
Geographical breakdown of international presales of French television programs (M€)
2006 2007 2008 2009 2010 2011 2012 2013 2014 2015 Evol. 15/14 (%)
Western Europe 27.1 22.2 27.1 26.8 18.7 20.9 22.8 24.9 27.9 22.6 -19.2
North America 9.0 7.6 10.9 3.8 8.0 15.3 7.7 7.5 20.2 11.4 -43.8
Others 1
1.6 2.8 1.1 1.5 2.0 3.2 5.2 4.2 4.7 1.5 -67.8
Asia / Pacific 3.9 0.5 0.6 2.3 1.4 0.3 2.3 4.9 1.4 0.8 -44.1
Latin America 0.0 0.4 0.1 0.0 0.0 0.2 0.7 0.4 0.1 0.2 +123.2
Central and Eastern Europe 0.1 0.1 0.3 0.2 0.2 2.8 0.1 0.3 1.4 0.2 -86.9
Middle East 0.1 0.0 0.1 0.1 0.1 0.1 0.1 0.1 0.3 0.1 -78.2
Africa 0.0 0.2 0.1 0.3 0.1 0.2 0.0 0.1 0.4 0.0 -92.7
Total 42.0 34.0 40.4 35.1 30.5 43.0 38.9 42.4 56.5 36.8 -34.9 1
Including unspecified: Cases for which the detail of the presales territories and/or foreign coproductions did not figure in the
financing plan of works at the time of extraction of data from the CNC figures. This is programming awaiting definitive authorization.
Source: CNC.
Geographical breakdown of international presales of French television programs (%)
2006 2015
1
Including unspecified: Cases for which the detail of the presales territories and/or foreign coproductions did not figure in the
financing plan of works at the time of extraction of data from the CNC figures. This is programming awaiting definitive authorization.
Source: CNC.
Western Europe
64.5
Central and Eastern Europe
0.2
North America
21.4
Asia / Pacific
9.3
Others ¹ 4.6
Western Europe
61.4 Central and
Eastern Europe
0.5
North America
30.9
Asia / Pacific
2.2
Middle East 0.2
Others ¹ 4.1
Latin America
0.7
Africa 0.1

French television program exports in 2015 29
In 2015, presales of French animation slipped 15.3% to 18.0M€, and accounted for 48.9% of
total presales (down 11.3 points). Foreign presales of fiction fell by more than half to 11.3M€,
after 2014 which was notable for several major international series like The Transporter and
Panthers. The proportion of fiction slumped from 50.7% in 2014 to 30.8% in 2015. Presales of
documentaries were up by 22.7%, reaching 6.4M€ in 2015. The genre accounted for 17.5% of
total foreign presales for French programs in 2015, compared to 9.3% in 2014.
International presales of French television programs by genre (M€)
2006 2007 2008 2009 2010 2011 2012 2013 2014 2015 Evol. 15/14 (%)
Animation 24.0 18.3 17.2 20.2 11.3 17.4 18.8 26.5 21.2 18.0 -15.3
Fiction 6.7 7.8 15.5 5.0 8.7 18.9 14.3 5.2 28.6 11.3 -60.4
Documentary 9.1 6.5 6.1 7.7 9.0 5.9 4.5 9.4 5.2 6.4 +22.7
Performing arts 2.1 1.4 1.5 2.1 1.3 0.9 1.3 1.2 1.4 1.0 -26.9
Magazine shows - 0.1 - - 0.3 0.0 - 0.1 0.0 - -
Total 42.0 34.0 40.4 35.1 30.5 43.0 38.9 42.4 56.5 36.8 -34.9
Source: CNC.
Breakdown of foreign presales of French television programming by genre (%)
2006 2015
Source: CNC.
a. Dynamic investments from Germany, Belgium and Scandinavia, while UK and
Netherlands slip back
In 2015, presales to countries in Western Europe showed a fall of 19.2% to 22.6M€. Leaving
aside the English-speaking markets of the UK and Ireland, Western Europe saw growth of
10.8M€. In English-speaking territories, presales slipped 94.2% to 1.0M€, the lowest level since
records began, after an exceptional year in 2014 thanks to two drama series, Versailles and
Panthers. These two countries accounted for 4.4% of presales to Western Europe in 2015
(down 56.9 points compared to 2014). On the contrary, presales to the German-speaking
region of Germany and Austria rose to 5.9M€ (up 75.1%). This region accounted for 26.0% of
presales to Western Europe in 2015 (up 14.0 points on 2014). Seasons 4 and 5 of the
animation series Yakari (26x12’ – Method Animation) accounted for the majority of German
prebuys by the WDR channel. Multi-territory presales to Western Europe grew strongly,
Fiction 16.0
Docu-mentairy
21.7
Animation 57.1
Perform-ing arts
5.2
Fiction 30.8
Docu-mentary
17.5
Animation 48.9
Perform-ing arts
2.8

French television program exports in 2015 30
Great Britain, Ireland 39.9
Belgium 11.4
Germany, Austria
12.5
Netherlands Luxembourg
1.8
Italy 6.3
Switzerland 8.1
Spain 2.3
ScandinaviaIceland
3.3
Western Europe region 14.4
Great Britain, Ireland
4.4
Belgium 13.7
Germany, Austria
26.0
Netherlands, Luxembourg
1.8
Italy 11.7
Switzerland 8.2
Spain 2.9
ScandinaviaIceland
13.1
Western Europe region 14.1
Others 4.1
reaching 3.2M€. Belgium continued to be an active market (up 11.2% to 3.1M€), notably
through RTBF’s fiction and documentary acquisitions. Meanwhile, presales to Scandinavia
grew tenfold, with the drama Jour Polaire (8x52’ – Nice Drama/Atlantique Productions) bought
by SVT, which accounted for the majority of the incoming financing.
Presales of French television programming to Western Europe (M€)
2006 2007 2008 2009 2010 2011 2012 2013 2014 2015 Evol. 15/14 (%)
Germany, Austria 3.4 5.5 1.4 4.8 7.0 5.6 5.9 9.6 3.4 5.9 +75.1
Western Europe region1
3.9 1.5 1.5 2.8 1.5 0.9 0.7 1.3 0.1 3.2 +2,626.1
Belgium 3.1 2.8 5.1 4.2 4.0 4.4 6.5 3.7 2.8 3.1 +11.2
Scandinavia, Iceland 0.9 0.3 0.4 0.5 0.6 0.3 0.1 0.6 0.3 3.0 +977.4
Italy 1.7 4.1 7.0 5.7 1.9 0.7 2.4 3.5 1.9 2.6 +36.3
Switzerland 2.2 3.5 1.6 1.6 1.9 1.6 1.7 1.6 1.6 1.8 +18.4
United Kingdom, Ireland 10.8 1.8 9.5 4.5 1.6 3.6 2.6 3.4 17.1 1.0 -94.2
Others - 0.6 0.1 0.0 0.0 0.3 0.0 0.3 0.0 0.9 +4,687.2
Spain 0.6 0.2 0.2 0.2 0.1 0.8 0.2 0.8 0.2 0.7 +204.2
Netherlands, Luxembourg 0.5 2.0 0.2 1.4 0.2 2.6 2.6 0.1 0.5 0.4 -27.7
Total 27.1 22.2 27.1 26.8 18.7 20.9 22.8 24.9 27.9 22.6 -19.2 1 Contracts covering several Western Europe territories.
Source: CNC.
Breakdown of presales of French television programming in Western Europe (%)
2006 2015
Source: CNC.

French television program exports in 2015 31
b. Drop in North America and Asia
In 2015, presales of French programs to North America fell by 43.8% to 11.4M€. Investments
from the United States dipped to 7.7M€ in 2015, compared to 10.3M€ in 2014. Half of this
amount involved season 3 of the animation show Les Lapins Crétins (78x7’ – Ubisoft). Presales
to Canada tumbled 63.6% to 3.6M€ in 2015. Just under half of all Canadian investments went
into season 2 of Versailles (10x52’ – Capa Drama).
Presales to the Asia/Pacific region fell for the second consecutive year, slipping to 0.8M€ in
2015. Japan remained the most dynamic country in the region, notably investing in
documentary and performing arts programming. Activity in Australia resumed, notably in
animation with season 2 of Jamie a des tentacules (52x12’ – Samka Productions).
B. Slight dip in coproduction spend
In 2015, foreign coproduction investment in French programs fell for the fourth consecutive
year to 54.1M€, down from 56.3M€ in 2014, despite a strong increase in coproductions with
Western Europe to 13.0M€ (up 59.7%). This dip is mainly explained by the fall in coproduction
spend from North America (down 15.4 points, for a share of total investments of 27.1%). The
region saw its place as leading coproducer in 2014 move to Western Europe in 2015. The latter
increased investments by 59.7% to 34.9M€, and accounted for 64.5% of total coproduction
spend in 2015, compared to 38.8% in 2014.
There was a significant fall in the Asia/Pacific region (down 75.9% to 1.3M€), which meant the
region accounted for 2.4% of all coproduction funding, compared to 9.5% in 2014.
Geographical breakdown of international coproduction investment in French television programs
(M€)
2006 2007 2008 2009 2010 2011 2012 2013 2014 2015 Evol. 15/14 (%)
Western Europe 29.0 36.1 33.3 40.0 34.2 42.2 40.6 51.6 21.9 34.9 +59.7
North America 20.3 11.1 16.3 9.9 13.8 23.0 17.6 8.4 23.9 14.7 -38.6
Asia / Pacific 8.0 12.9 1.5 6.5 8.2 7.4 10.0 4.7 5.4 1.3 -75.9
Central and Eastern Europe 0.6 1.0 1.2 1.0 1.1 2.0 1.6 1.8 2.8 1.2 -55.9
Others 1 2.3 1.9 0.3 0.4 3.2 1.6 1.3 0.9 0.3 0.9 +169.2
Middle East 0.4 0.0 0.9 0.3 0.3 0.4 0.3 1.1 0.3 0.5 +106.2
Africa 0.5 0.2 0.1 0.2 1.2 0.5 1.8 0.8 1.5 0.4 -76.0
Latin America 0.2 0.6 0.2 0.3 1.0 0.2 3.2 0.2 0.3 0.2 -22.4
Total 61.3 63.7 53.6 58.6 62.8 77.4 76.5 69.5 56.3 54.1 -3.9 1
Including unspecified: Cases for which the detail of the presales territories and/or foreign coproductions did not figure in the
financing plan of works at the time of extraction of data from the CNC figures. This is programming awaiting definitive authorization.
Source: CNC.

French television program exports in 2015 32
Geographical breakdown of international coproduction investment in French television programs
(%)
2006 2015
1
Including unspecified: Cases for which the detail of the presales territories and/or foreign coproductions did not figure in the
financing plan of works at the time of extraction of data from the CNC figures. This is programming awaiting definitive authorization
Source: CNC.
The drop in foreign coproduction funding is largely due to a fall in fiction (down 50.5% to
8.3M€). Fiction’s share of total coproduction spend fell from 29.7% in 2014 to 15.3% in 2015.
On the contrary, coproduction funding in other programming genres was up. The strongest
growth was seen in documentary, up 31.8% to 13.0M€. The genre accounted for 24.1% of total
coproduction investment in 2015, compared to 17.5% in 2014.
International investment in coproduction in French television programs by genre (M€)
2006 2007 2008 2009 2010 2011 2012 2013 2014 2015 Evol. 15/14 (%)
Animation 32.7 35.2 25.7 31.1 31.3 43.4 23.2 25.6 24.4 25.7 +5.2
Documentary 15.8 9.5 15.5 12.9 13.7 11.1 15.0 16.6 9.9 13.0 +31.8
Fiction 10.6 16.3 10.2 12.2 12.8 17.8 32.7 21.9 16.7 8.3 -50.5
Performing arts 2.0 2.5 2.2 2.4 5.0 5.1 5.4 5.4 5.3 7.0 +31.6
Magazine shows 0.2 0.1 0.1 - 0.1 - 0.2 - - 0.1 -
Total 61.3 63.7 53.6 58.6 62.8 77.4 76.5 69.5 56.3 54.1 -3.9
Source: CNC.
Breakdown in international coproduction investment in French television programs by genre (%)
2006 2015
Source: CNC.
Western Europe
47.3
Central and
Eastern Europe
1.0
North America
33.1
Asia / Pacific 13.1
Middle East 0.7
Others ¹ 3.8
Latin America
0.2
Africa 0.8
Western Europe
64.5
Central and
Eastern Europe
2.3
North America
27.1
Asia / Pacific
2.4
Middle East 1.0
Others ¹ 1.6
Latin America
0.4
Africa 0.6
Fiction 17.3
Documentary 25.9
Animation 53.5
Performing arts 3.3 Fiction
15.3
Documentary 24.1
Animation 47.6
Performing arts 13.0

French television program exports in 2015 33
a. Increase across all European countries except Belgium
In 2015, coproduction funding from countries in Western Europe grew 59.7% to 34.9M€. This
increase was mainly due to a rise in investments from the UK and Ireland, which soared from
1.1M€ in 2014 to 7.0M€ in 2015. Just under half of this funding went on the animation show
Noddy (52x11’ – Gaumont Animation). Italy also posted a huge increase in coproduction spend
in 2015, up 245.2% to 3.4M€, compared to 1.0M€ in 2014.
Investments from Belgium dipped 7.5% to 11.7M€, with funding notably concentrated on
animation (Popples and Yakari) and drama (Section Zéro), encouraged by tax incentives.
Belgium nonetheless remained the leading European partner for French producers (33.6% of
funding from Western Europe), and also became the leading partner worldwide, accounting for
21.7% of worldwide funding. Taken together, European countries posted an increase in
coproduction funding.
Coproduction investment in French television programs in Western Europe (M€)
2006 2007 2008 2009 2010 2011 2012 2013 2014 2015 Evol. 15/14 (%)
Belgium 6.1 5.3 9.1 7.2 10.6 13.0 7.1 9.1 12.7 11.7 -7.5
United Kingdom, Ireland 2.0 6.5 11.3 9.4 2.2 10.4 4.3 5.2 1.1 7.0 +520.6
Germany, Austria 3.8 6.9 3.3 6.6 2.1 1.9 20.7 23.2 2.7 3.9 +47.6
Italy 0.6 6.6 6.0 6.0 6.2 7.2 5.5 5.8 1.0 3.4 +245.2
Spain 4.4 2.0 0.6 1.6 1.2 2.4 0.1 1.3 1.2 3.2 +178.5
Netherlands, Luxembourg 7.1 2.2 0.7 5.9 7.9 5.5 0.0 3.8 0.3 2.3 +720.2
Switzerland 4.0 3.8 1.8 2.1 2.8 1.1 2.4 2.1 1.4 2.0 +43.0
Scandinavia, Iceland 0.5 0.3 0.3 0.4 0.5 0.1 0.2 0.3 0.4 0.8 +85.9
Western Europe - 2.4 0.0 0.2 0.6 0.5 0.0 0.5 1.0 0.2 -76.1
Others 0.4 0.2 0.1 0.2 0.0 0.0 0.0 0.0 0.0 0.2 +108.1
Portugal 0.0 0.1 0.0 0.6 0.0 0.0 0.0 0.1 0.0 0.1 +100.0
Total 29.0 36.1 33.3 40.0 34.2 42.2 40.6 51.6 21.9 34.9 +59.7
Source: CNC.
Breakdown in coproduction investment in French television programs in Western Europe (%)
2006 2015
Source: CNC.
Great Britain, Ireland
6.9
Belgium 21.1
Germany, Austria
13.1 Netherland Luxem-bourg 24.6
Italy 2.1
Switzerland 13.8
Spain 15.2
ScandinaviaIceland
1.7
Others 1.4
Great Britain, Ireland 20.2
Belgium 33.6
Germany Austria
11.2
Netherlands Luxembour
g 6.6
Italy 9.8
Switzerland 5.8
Spain 9.2
Portugal 0.2
ScandinaviaIceland
2.4
Western Europe
0.7 Others 0.5

French television program exports in 2015 34
b. Dip in North America and Asia
In 2015, coproduction investments from North American countries in French TV programs
dropped 38.6% to 14.7M€. Canada became the second most important partner for French
producers, despite a drop to 10.4M€ in coproduction funding in 2015, down from 16.9M€ in
2014. One-third of this involved the drama series Versailles.
Meanwhile, coproduction investment from the United States slumped to 4.2M€ in 2015,
compared to 6.8M€ in 2014. The bulk of this involved the animation show Popples.
Coproduction funding from the Asia/Pacific region fell sharply, from 5.4M€ in 2014 to 1.3M€ in
2015 (down 75.9%). Japan became the main contributor from the region, with 0.6M€ in funding,
mainly in documentaries.
C. Higher volume of international coproductions
The volume of French programming coproduced with foreign investment (excluding magazine
shows) was up 11.8% in 2015 to 1,193 hours, compared to 1,067 hours in 2014.
The volume of majority-French coproductions made with foreign partners increased from
1,011 hours in 2014 to 1,082 hours in 2015, up 7.1%. These French-initiated programs
attracted 56.2M€ of foreign financing, down from 81.0M€ in 2014.
The volume of minority-French coproductions increased to 111 hours in 2015 (up 96.3%).
Foreign financing in minority-French coproductions was also up, by 8.4% to 34.5M€.
Volume of French television programs financed by international capital (in hours)
Source: CNC.
1,176 974 952 1,004 1,014 1,048 946
1,180 1,011
1,082
116
80 127 112 92
128
126
82
57
111
0
200
400
600
800
1 000
1 200
1 400
2006 2007 2008 2009 2010 2011 2012 2013 2014 2015
Majority-French coproductions Minority-French coproductions
1,054
1,292
1,079 1,116 1,106 1,176
1,073
1,262
1,067
1,193

French television program exports in 2015 35
The share of coproductions (majority and minority) in the total volume of French TV programs
increased in 2015 to 24.7%, up from 22.1% in 2014. It should also be noted that in 2015, 88.5%
of the volume of animation programming was coproduced with foreign partners (73.1% in
2014).
Volume of French television programs financed by international capital (%)
2006 2007 2008 2009 2010 2011 2012 2013 2014 2015
Fiction 51.0 49.6 39.8 50.6 42.0 43.9 43.6 37.9 39.0 44.5
Documentary 24.6 20.0 22.8 18.6 19.7 17.0 13.3 17.3 15.9 15.7
Animation 79.9 77.7 66.9 72.6 71.7 76.6 75.6 86.4 73.1 88.5
Performing arts 13.6 13.5 18.1 14.2 16.0 17.8 17.8 18.7 17.9 23.0
Total 35.6 28.7 27.1 26.3 25.0 24.3 20.8 23.3 22.1 24.7
Source: CNC.
a. Fall in foreign input to majority-French coproductions for fiction and animation,
stability for documentaries
In 2015, 333 hours of French-initiated fiction attracted 19.6M€ in foreign investment, of which
8.3M€ came through coproductions and 11.3M€ as presales. In 2014, 282 hours of French-
initiated fiction was produced, with foreign funding of 31.6M€ (13.7M€ as coproductions and
18.0M€ as presales).
Some 371 hours of documentary was made as majority-French coproductions in 2015, for total
foreign input of 12.4M€, of which 8.6M€ came as coproduction funding and 3.8M€ as presales.
In 2014, 392 hours of documentary was produced with foreign funding of 12.6M€.
In 2015, 174 hours of majority-French animation was initiated with total foreign investment of
18.8M€, of which 9.9M€ was coproduction money and 8.9M€ presales. This compares to
170 hours with foreign input of 31.4M€ in 2014.

French television program exports in 2015 36
Majority-French coproductions (1/2)
Hours M€ Foreign input
(coproductions + presales) (M€) %
2006
Fiction 423 386.7 14.6 3.8
Documentary 435 92.9 14.3 15.4
Animation 266 146.6 15.2 10.4
Performing arts 52 17.2 2.8 16.3
Total 1,176 643.4 46.9 7.3
2007
Fiction 387 371.9 18.4 4.9
Documentary 352 75.9 12.3 16.2
Animation 194 107.5 32.1 29.9
Performing arts 41 13.4 3.3 24.6
Total 974 568.7 66.1 11.6
2008
Fiction 346 318.3 11.6 3.6
Documentary 427 102.2 13.2 12.9
Animation 108 62.4 14.1 22.6
Performing arts 71 16.9 3.6 21.3
Total 952 499.8 42.5 8.5
2009
Fiction 374 325.4 11.3 3.5
Documentary 380 95.5 14.2 14.9
Animation 198 116.3 27.2 23.4
Performing arts 51 11.5 1.1 9.6
Total 1,004 548.7 53.8 9.8
2010
Fiction 305 316.2 19.5 6.2
Documentary 465 120.8 18.0 14.9
Animation 177 106.3 23.4 22.0
Performing arts 67 15.5 3.0 19.4
Total 1,014 558.8 63.9 11.4
2011
Fiction 329 332.8 13.1 3.9
Documentary 428 96.4 12.9 13.4
Animation 197 117.8 26.0 22.1
Performing arts 94 15.8 2.9 18.4
Total 1,048 562.8 54.9 9.8
2012
Fiction 327 329.6 29.5 9.0
Documentary 365 99.4 15.4 15.5
Animation 144 94.4 12.7 13.5
Performing arts 110 20.8 4.0 19.2
Total 946 544.2 61.5 11.3
2013
Fiction 277 283.3 5.5 1.9
Documentary 506 133.7 17.2 12.9
Animation 270 177.5 46.3 26.1
Performing arts 128 21.2 3.4 16.0
Total 1,180 615.7 72.4 11.8
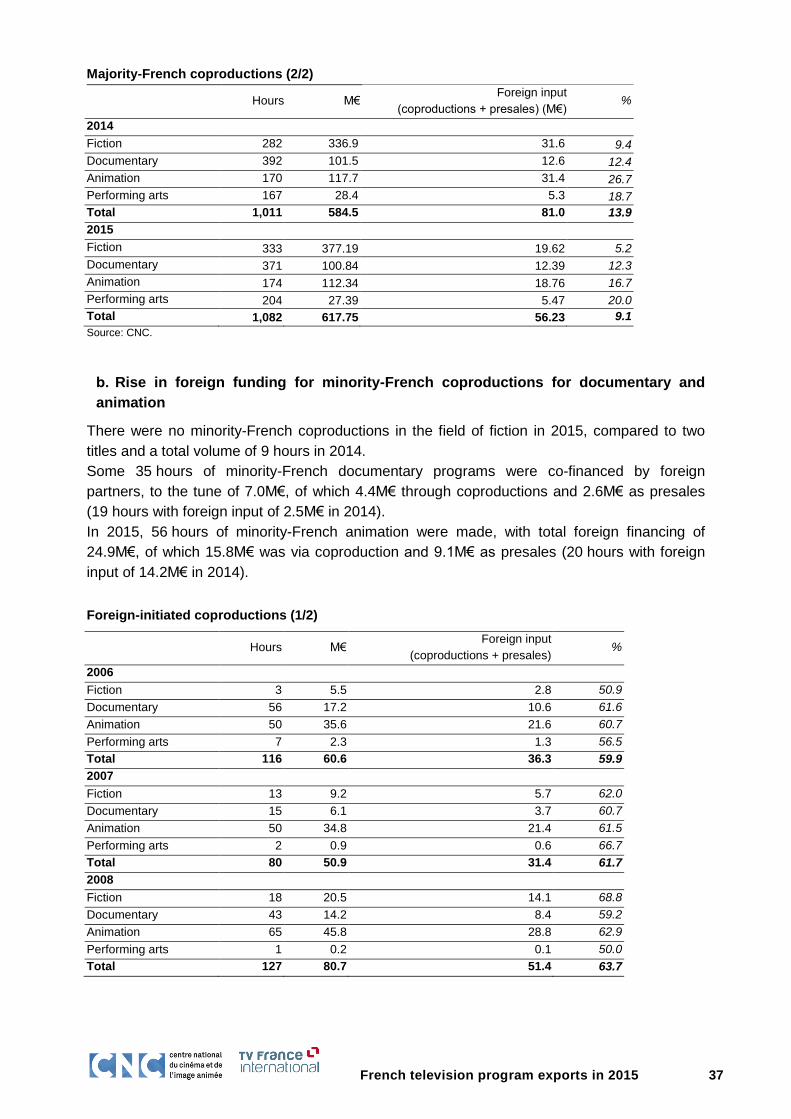
French television program exports in 2015 37
Majority-French coproductions (2/2)
Hours M€ Foreign input
(coproductions + presales) (M€)
%
2014
Fiction 282 336.9 31.6 9.4
Documentary 392 101.5 12.6 12.4
Animation 170 117.7 31.4 26.7
Performing arts 167 28.4 5.3 18.7
Total 1,011 584.5 81.0 13.9
2015
Fiction 333 377.19 19.62 5.2
Documentary 371 100.84 12.39 12.3
Animation 174 112.34 18.76 16.7
Performing arts 204 27.39 5.47 20.0
Total 1,082 617.75 56.23 9.1
Source: CNC.
b. Rise in foreign funding for minority-French coproductions for documentary and
animation
There were no minority-French coproductions in the field of fiction in 2015, compared to two
titles and a total volume of 9 hours in 2014.
Some 35 hours of minority-French documentary programs were co-financed by foreign
partners, to the tune of 7.0M€, of which 4.4M€ through coproductions and 2.6M€ as presales
(19 hours with foreign input of 2.5M€ in 2014).
In 2015, 56 hours of minority-French animation were made, with total foreign financing of
24.9M€, of which 15.8M€ was via coproduction and 9.1M€ as presales (20 hours with foreign
input of 14.2M€ in 2014).
Foreign-initiated coproductions (1/2)
Hours M€ Foreign input
(coproductions + presales) %
2006
Fiction 3 5.5 2.8 50.9
Documentary 56 17.2 10.6 61.6
Animation 50 35.6 21.6 60.7
Performing arts 7 2.3 1.3 56.5
Total 116 60.6 36.3 59.9
2007
Fiction 13 9.2 5.7 62.0
Documentary 15 6.1 3.7 60.7
Animation 50 34.8 21.4 61.5
Performing arts 2 0.9 0.6 66.7
Total 80 50.9 31.4 61.7
2008
Fiction 18 20.5 14.1 68.8
Documentary 43 14.2 8.4 59.2
Animation 65 45.8 28.8 62.9
Performing arts 1 0.2 0.1 50.0
Total 127 80.7 51.4 63.7

French television program exports in 2015 38
Foreign-initiated coproductions (2/2)
Hours M€ Foreign input
(coproductions + presales) (M€) %
2009
Fiction 6 11.6 5.9 50.9
Documentary 34 10.6 6.4 60.4
Animation 54 39.9 24.2 60.7
Performing arts 18 5.6 3.4 60.7
Total 112 67.7 39.9 58.9
2010
Fiction 2 2.9 2.0 69.0
Documentary 20 7.5 4.7 62.7
Animation 53 30.0 19.2 64.0
Performing arts 19 5.2 3.3 63.5
Total 92 45.6 29.1 63.8
2011
Fiction 11 36.8 23.5 63.9
Documentary 25 6.8 4.1 60.3
Animation 75 55.2 34.8 63.0
Performing arts 16 5.2 3.1 59.6
Total 128 104.0 65.5 63.0
2012
Fiction 8 26.4 17.6 66.7
Documentary 23 6.9 4.2 60.9
Animation 81 49.9 29.4 58.9
Performing arts 14 4.6 2.6 56.5
Total 126 87.8 53.7 61.2
2013
Fiction 19 33.9 21.7 64.0
Documentary 30 13.7 8.7 63.5
Animation 11 9.0 5.8 64.4
Performing arts 21 5.3 3.2 60.4
Total 82 61.8 39.4 63.8
2014
Fiction 9 26.6 13.7 51.5
Documentary 19 4.4 2.5 56.8
Animation 20 21.3 14.2 66.7
Performing arts 8 2.4 1.5 62.5
Total 57 54.7 31.9 58.3
2015
Fiction 0 - - -
Documentary 35 11.84 7.0 59.1
Animation 56 40.91 24.9 60.9
Performing arts 20 4.41 2.6 59.0
Total 111 57.16 34.5 60.4
Source: CNC.

French television program exports in 2015 39
IV. Companies exporting French TV programs
A. Change in concentration in the sector
In 2015, concentration in the marketplace for the sale of French programs abroad fell to its
lowest level since records began. As such, the five most active companies accounted for 25.3%
of all international sales, down 1.5 points on 2014. The combined revenue generated by the
five leading companies was up 0.6% to 41.5M€ in 2015. The combined share of the top 10
companies fell to 41.5% in 2015, down 1.0 points on the previous year.
Concentration in the French TV export sector
2008 2009 2010 2011 2012 2013 2014 2015
Receipts of the 5 leading companies (M€) 35.1 31.0 30.0 28.3 33.6 36.0 41.2 41.5
Share of total receipts (%) 33.6 32.4 28.4 25.6 26.5 26.2 26.8 25.3
Receipts of the 10 leading companies (M€) 52.0 44.8 45.8 44.1 51.0 57.9 65.4 68.1
Share of total receipts (%) 49.8 46.9 43.4 39.9 40.1 42.2 42.5 41.5
Receipts of all companies (M€)1 104.4 95.6 101.0 106.3 122.6 133.5 150.5 151.6
Share of total receipts (%) 100.0 100.0 100.0 100.0 100.0 100.0 100.0 100.0 1 Excluding sales to TV5 and CFI.
Source: CNC-TV France International.
B. Change in concentration by genre
Given that producers often specialize in a specific genre, concentration in the French TV
program export market by genre is structurally greater than that observed across the whole
sector. This data must nonetheless be treated with caution, since the sale of a single program
can make the results vary considerably from one year to the next.
In 2015, the degree of concentration in the animation export sector was down, but remained far
higher than the average across all genres. The five leading companies accounted for 52.7% of
international receipts for the genre (down 6 points on 2014), while the top 10 companies
amassed 73.9% of all sales (down 4.8 points). This high level of concentration reflects the
overall complexity of the animation production process, in terms of financing, technical and
artistic expertise, and the timescales involved. What’s more, international distribution of
animation series requires significant investment, both for marketing and for different language
versions, all of which restricts access to the sector.
Concentration in French animation exports
2008 2009 2010 2011 2012 2013 2014 2015
Receipts of the 5 leading companies (M€) 18.9 19.9 21.0 19.1 28.3 27.2 26.4 26.7
Share of total receipts (%) 61.5 62.4 60.4 54.1 64.4 58.1 58.7 52.7
Receipts of the 10 leading companies (M€) 26.4 28.1 27.9 27.1 37.3 36.8 35.5 37.4
Share of total receipts (%) 86.1 88.2 80.2 76.6 84.9 78.6 78.7 73.9
Receipts of all companies (M€)1 30.7 31.9 34.8 35.3 43.9 46.9 45.0 50.6
Share of total receipts (%) 100.0 100.0 100.0 100.0 100.0 100.0 100.0 100.0
Source: CNC-TV France International.

French television program exports in 2015 40
The degree of concentration in the documentary export sector fell slightly, with the five most
active companies cornering 42.5% of international sales for the genre (down 0.4 points). The
market share of the 10 leading companies rose to 63.8% of total sales in 2014 (up 2.4 points).
Concentration in French documentary exports
2008 2009 2010 2011 2012 2013 2014 2015
Receipts of the 5 leading companies (M€) 15.4 10.2 11.5 11.4 11.5 12.9 15.0 15.7
Share of total receipts (%) 53.6 44.1 43.5 42.1 38.7 41.9 42.9 42.5
Receipts of the 10 leading companies (M€) 20.8 15.1 16.6 16.0 17.7 18.2 21.4 23.7
Share of total receipts (%) 72.7 65.3 62.9 59.0 59.4 59.1 61.4 63.8
Receipts of all companies (M€)1 28.7 23.2 26.4 27.1 29.7 30.8 34.9 37.1
Share of total receipts (%) 100.0 100.0 100.0 100.0 100.0 100.0 100.0 100.0
Source: CNC-TV France International.
In 2015, concentration in French fiction exports remained stable. The five leading sales
companies generated 57.0% of total revenue for the genre, compared to 57.1% in 2014.
However, the activity of the top 10 companies saw a dip in concentration, with a combined
share of 76.7% of total fiction sales abroad in 2015, down 4.5 points on 2014.
Concentration in French fiction exports
2008 2009 2010 2011 2012 2013 2014 2015
Receipts of the 5 leading companies (M€) 19.3 15.1 10.6 9.0 12.8 14.2 22.2 23.5
Share of total receipts (%) 71.8 69.8 55.2 45.2 56.0 54.5 57.1 57.0
Receipts of the 10 leading companies (M€) 24.0 19.0 14.6 13.7 18.3 19.3 31.6 31.6
Share of total receipts (%) 89.3 88.0 76.3 68.4 80.3 74.3 81.2 76.7
Receipts of all companies (M€)1 26.8 21.6 19.1 20.0 22.8 26.0 38.9 41.2
Share of total receipts (%) 100.0 100.0 100.0 100.0 100.0 100.0 100.0 100.0
Source: CNC-TV France International.

French television program exports in 2015 41
Appendix
The CNC and TV France International would like to thank:
1. The sales companies listed below who were surveyed for this report:
- 100% DISTRIBUTION, Cécilia Rossignol.
- FRANCETV DISTRIBUTION, Erick Rouillé.
- JAVA FILMS, Roch Bozino.
- KWANZA, Benjamin Ternynck.
- LAGARDÈRE STUDIOS DISTRIBUTION, Emmanuelle Bouilhaguet.
- LUKARN, Sandrine Frantz.
- MEDIATOON DISTRIBUTION, Jérôme Alby.
- NEWEN DISTRIBUTION, Julien Leroux.
- TERRANOA, Isabelle Graziadey.
- TF1 STUDIO, Sabine Chemaly.
- ZED, Céline Payot Lehmann.
- ZODIAK RIGHTS, Isabelle Quême.
2. All the companies in the production and international distribution sector who agreed to share their revenue figures to produce this statistical data.

French a publication direction des études, avec la collaboration édité par la direction
Television of the Centre national des statistiques de TV France de la communication
Program Exports du cinéma et de la prospective International conception graphique
in 2015 et de l’image animée 3 rue Boissière 75784 3 rue Cernuschi 75017 couverture : c-album
12 rue de Lübeck Paris Cedex 16 Paris impression : Stipa
75784 Paris Cedex 16 tél. 01 44 34 38 26 tél. 01 40 53 23 00 septembre 2016
www.cnc.fr [email protected] fax : 01 40 53 23 01
www.tvfrance-intl.com