lessons from ten years of crystallization experiments at ... · pdf filesparse-matrix screens;...
TRANSCRIPT

research papers
224 http://dx.doi.org/10.1107/S2059798315024687 Acta Cryst. (2016). D72, 224–235
Received 12 September 2015
Accepted 22 December 2015
Edited by J. Newman, Bio21 Collaborative
Crystallisation Centre, Australia
Keywords: crystallization screening strategy;
sparse-matrix screens; large-scale data sets; data
mining; redundancy of conditions.
Supporting information: this article has
supporting information at journals.iucr.org/d
Lessons from ten years of crystallizationexperiments at the SGC
Jia Tsing Ng,a Carien Dekker,b Paul Reardonc and Frank von Delfta,d,e*
aStructural Genomics Consortium, University of Oxford, Roosevelt Drive, Oxford OX3 7DQ, England, bCenter for
Proteomic Chemistry, Novartis Institutes for Biomedical Research, CH-4002 Basel, Switzerland, cSwissci AG,
Industriestrasse 3, CH-6345 Neuheim, Switzerland, dDiamond Light Source Ltd, Harwell Science and Innovation
Campus, Didcot OX11 0QX, England, and eDepartment of Biochemistry, University of Johannesburg, Aukland Park,
Johannesburg 2006, South Africa. *Correspondence e-mail: [email protected]
Although protein crystallization is generally considered more art than science
and remains significantly trial-and-error, large-scale data sets hold the promise
of providing general learning. Observations are presented here from retro-
spective analyses of the strategies actively deployed for the extensive
crystallization experiments at the Oxford site of the Structural Genomics
Consortium (SGC), where comprehensive annotations by SGC scientists were
recorded on a customized database infrastructure. The results point to the
importance of using redundancy in crystallizing conditions, specifically by
varying the mixing ratios of protein sample and precipitant, as well as incubation
temperatures. No meaningful difference in performance could be identified
between the four most widely used sparse-matrix screens, judged by the yield of
crystals leading to deposited structures; this suggests that in general any
comparison of screens will be meaningless without extensive cross-testing.
Where protein sample is limiting, exploring more conditions has a higher
likelihood of being informative by yielding hits than does redundancy of either
mixing ratio or temperature. Finally, on the logistical question of how long
experiments should be stored, 98% of all crystals that led to deposited structures
appeared within 30 days. Overall, these analyses serve as practical guidelines for
the design of initial screening experiments for new crystallization targets.
1. Introduction
One of the promises offered by large-scale structural genomics
efforts, which first launched at the turn of the century, was that
the extensive accumulation of data would help to demystify
aspects of crystallography that were limited to, or certainly
dominated by, anecdotes and the confirmation bias of
experienced practitioners. Crystallization was a particularly
notorious process, and many studies did emerge from the
large-scale facilities with real practical consequences for the
ever-growing protein crystallography community (Asada et al.,
2013; Burley et al., 2008; Elsliger et al., 2010; Rupp et al., 2002).
Rigorous verdicts on the various strategies remain unavail-
able, however, as they are difficult to arrive at objectively,
even though these are most relevant to the day-to-day crys-
tallographer in pursuit of a biological rather than a metho-
dological question.
The Structural Genomics Consortium (SGC), Oxford
deposited its first structure in the Protein Data Bank (PDB)
on 20 April 2004 (PDB entry 1t2a). At the cutoff point for the
current analysis, 31 March 2014, SGC Oxford has contributed
700 deposited X-ray structures, 462 of which were novel at
their time of release (i.e. the first representative X-ray
ISSN 2059-7983

structure of that polypeptide or a particular protein–protein
complex, within 95% homology). The methods and practices
implemented over the years for solving these structures have
been outlined in past SGC publications, including the strategy
for cloning, expression and purification methods used in the
laboratory (Savitsky et al., 2010) and the techniques and
procedures for data collection at synchrotron sources (Krojer
et al., 2013). This work bridges these publications through
retrospective analyses of the nano-droplet crystallization
strategies employed at the SGC.
As in many crystallography laboratories, robotics and
automation are crucial to our crystallization facility. Emphasis
was placed on making it accessible to any protein scientist to
ensure that only protein quality and quantity should ever be
limiting, rather than the expertise or non-protein materials
required to carry out the crystallization experiments. Standard
crystallization practice was implemented largely by ensuring
the recommended experiment was also the most convenient,
including ensuring that primary sparse-matrix screens and
plate types were always adequately stocked, predefining
liquid-handling protocols with obvious names and setting up
relevant defaults in the software and databases.
As a result of this philosophy, more than 200 scientists used
the facility over the ten-year period covered here, generating
over 60 000 crystallization plates from 2339 targets and over
24 000 protein purifications. Of all targets for which purified
protein was ever available, 43% eventually yielded diffracting
crystals.
The focus of this paper is the first phase of the crystal-
lization process, namely the coarse screen, i.e. the screening of
conditions for crystallization (McPherson & Gavira, 2014).
Shaw Stewart & Mueller-Dieckmann (2014) highlight that
there are four main parameters for initial screening experi-
ments: (i) the ratio of sample to crystallization cocktail, (ii) the
incubation temperature, (iii) the number and choice of initial
screens and (iv) the crystallization method. Our data and
analyses inform the first three, but provide no insight into the
fourth, because sitting-drop vapour diffusion was the only
research papers
Acta Cryst. (2016). D72, 224–235 Ng et al. � Lessons from ten years of crystallization experiments at the SGC 225
Figure 1Summary of novel structures deposited by the SGC, Oxford over ten years. (a) 61 protein families are represented, as annotated a priori based onbioinformatics. (b, c) Masses range between 2.5 and 108 kDa, with chains of up to 967 amino acids in length. (d) The majority of structures were singleprotein structures, either apo or ligand-bound; a small proportion were protein–protein complexes. (e) Comparison of protein concentrations incrystallization experiments for those that led to PDB depositions (blue) and all crystallization plates (red). Both populations have a very similardistribution.

format compatible with high throughput in our particular
hardware configuration.
We reviewed different aspects of the crystallization strate-
gies employed and report the conclusions from these, focusing
on (i) repeating screening conditions with different protein-to-
precipitant mixing ratios; (ii) repeating screening conditions at
different incubation temperatures (277 and 293 K); (iii) the
choice of sparse-matrix screens; (iv) the protein sample
concentration for crystallization; and (v) the storage time of
crystallization plates.
Given the retrospective nature of the analysis, all observa-
tions pertain to the strategies actually used to accumulate
these data and say little about orthogonal approaches.
Nevertheless, since our procedures were designed taking into
account actual costs, the conclusions drawn should be helpful
whenever setting up crystallization screening experiments.
2. Data set
The SGC has focused on human proteins from multiple
families. Fig. 1(a) shows the families of deposited novel
structures over the period analysed, along with the distribu-
tion of mass (Fig. 1b) and protein length (Fig. 1c). Protein
classes not explored at the SGC, and hence not informed by
this analysis, include viruses and large complexes. A few
protein–DNA and protein–RNA complexes are among the
structures solved in this period, as are a very small number of
integral membrane proteins. However, these classes are not
represented in our analysis owing to their negligible repre-
sentation. The structures deposited comprise of apo structures,
protein–ligand structures and protein–protein complexes
(Fig. 1d).
Preparation of protein samples was performed by almost
200 scientists, who varied purification protocols at their own
discretion as deemed necessary depending on sample.
However, the dominant strategy was affinity chromatography,
primarily by His tag/nickel but also glutathione S-transferase
tag/glutathione, followed by size-exclusion chromatography;
a final ion-exchange chromatography step was occasionally
used. Millipore centrifugal parallel membrane concentrators
were the standard device for concentrating proteins; as the
primary constraint was protein stability and the goal was to
avoid precipitation of protein, a concentration of 10 mg ml�1
was the target in the first instance. The routine workflow did
not include a systematic protein concentration test, and
attempts to introduce it fell on barren ground, presumably
because it does not provide a clear either/or read-out, and with
the infrastructure in place it was evidently easier to set up the
crystallization experiment. The distribution of concentrations
of proteins for crystallization is shown in Fig. 1(e): the majority
of experiments, including those that led to PDB depositions,
were concentrated to no higher than 20 mg ml�1.
In line with common practice in laboratories with robotics,
the crystallization strategy was to set up multiple sparse-
matrix (coarse) screens (Jancarik & Kim, 1991); the screens
used in meaningful quantities are summarized in Table 1 and
three of these were in-house designs.
(i) The Ligand Friendly Screen (LFS) is based on the PACT
screen (Newman et al., 2005). It samples combinations of PEG
1K to 6K, salts and buffers at near-physiological pH in a semi-
systematic way: the goal was to obtain crystals that were
directly usable for studying compound binding.
(ii) Basic ChemSpace (BCS) consolidates a wide diversity
of PEG precipitants into a single screen by using four PEG
mixtures or ‘smears’ grouped by molecular weight, thereby
retaining the potential specific properties of a given polymer
size without a combinatorial explosion (Chaikuad et al., 2015).
(iii) JCSG+ is similar to the commercial version (Newman et
al., 2005), but was optimized with the author’s help to reduce
the number of stock solutions required.
All screens were mixed in-house with a MultiPROBE II
Plus HT/EX Robotic Liquid Handling System (Perkin Elmer;
http://www.perkinelmer.co.uk) until 2013, and since then have
been commercially sourced from Molecular Dimensions
(http://www.moleculardimensions.com), including the in-
house designed screens. Over the period analysed, scientists
could request or design optimization or fine-grid screens
themselves, with a laboratory technician available to formu-
late the requested screens robotically using commercial stock
solutions. The goal was to make it as simple as possible for
experimenters to optimize hits from coarse screens if the
original crystals did not satisfactorily diffract sufficiently.
The standard crystallization screening experiment entailed
two to four sparse-matrix screens with three 150 nl droplets
per well prepared by mixing protein and precipitant in ratios
of 2:1, 1:1 and 1:2. Prior to February 2009, the primary plate
type used was the CrystalQuick Plus 96 Well (Greiner; flat
bottom, three subwells, available from http://www.hampton-
research.com), with 80 ml reservoir solution; after that, 3 Lens
Crystallization Microplates (http://www.swissci.com) were
exclusively used. This plate type has three concave subwells
per well and was developed by Swissci in partnership with the
SGC by modifying the MRC 2-Well Crystallization Plate to
accommodate our preference for three droplets per condition,
and to additionally lower the reservoir volume to only 20 ml
leading to lower reagent consumption.
research papers
226 Ng et al. � Lessons from ten years of crystallization experiments at the SGC Acta Cryst. (2016). D72, 224–235
Table 1Selected screens commonly used at the SGC.
Screen Abbreviation Vendor† Product code
JCSG+ JCSG MD (modified) MD1-40Ligand Friend Screen LFS In-house‡Crystal Screen HT HCS HR HR2-130Index HIN HR HR2-134Basic ChemSpace BCS In-house‡Modern Intelligent Dynamic
Alternative ScreenMIDAS MD MD1-60
(Emerald Bio) PrecipitantSynergy Screen
EPS JB CS-EB-PS-B
Morpheus MORPHEUS MD MD1-47SaltRX HT SaltRx HR HR2-136MemGold MemGold MD MD1-41MemGold2 MemGold2 MD MD1-64
† MD, Molecular Dimensions; HR, Hampton Research; JB, Jena Bioscience. ‡ In-house indicates design by SGC and formulation by MD. See Supplementary Tables S1and S2 for the full list of conditions for our modified versions of JCSG+ and LFS.

Crystallization droplets were mixed with Mosquito Crystal
robots (http://www.ttplabtech.com) robots at room tempera-
ture, and plates were incubated at 277 or 293 K, with drops
automatically imaged at fixed time intervals by Minstrel HT
systems (http://www.rigaku.com). The inspection schedule was
nominally 1, 2, 4, 7, 14, 28 and 56 days from setup, with the
time tolerance being tighter for early inspections; the actual
inspection times varied with imaging load and backlogs.
Vendor software was set up to enable experimenters to view
and score their own experiments from their desk. All crys-
tallization experiment information, including details of the
protein, its preparation and its co-crystallization compounds,
along with downstream experiments up to deposition in the
PDB, were recorded in an in-house database; user-assigned
crystal drop scores were also copied to this database from the
vendor’s imaging database.
Viewing images was optional, and typically only a few
inspections were actually viewed, although viewing generally
entailed seeing every drop of the inspection. Considerable
care was taken in advance to achieve high reliability of
scoring: the mundane problem of ensuring that the viewing
client was always available and responsive required constant
maintenance, while the database was configured such that
recording a score the proper way greatly simplified the
registration of downstream experiments. Finally, a scoring
scheme was designed that would be both robust and intuitive
(Fig. 2): to factor in the inevitable category errors (Buchala &
Wilson, 2008), it was set up as a 1-to-10 sliding scale and scores
were attached to vivid colouring of increasing intensity
alongside descriptive yet deliberately subjective labels.
Although compliance is notoriously hard to assess, we feel
confident in assuming that most instances of crystallinity were
labelled, given that most of the many images per plate (up to
eight inspections � 288 droplets = 2304) were indeed never
labelled. In a previous analysis (Ng et al., 2014) we concluded
subjectively that the score of crystallinity is broadly reliable,
although it inevitably carries significant error bars owing to its
subjectivity. The sliding scale of Image Score was designed
specifically to mitigate the effect of such subjectivity.
Crystals that were tested for diffraction with our in-house
rotating-anode generator or at synchrotron sources were
tagged with a Crystal Quality Score, which captures very
reliably whether or not a crystal diffracted (any Crystal
Quality Score � 1 indicates diffraction, with higher diffraction
quality receiving a higher score).
For the purpose of this analysis, we define the following:
Hits have an Image Score of �3, where the image was
evaluated by an experimenter to contain microcrystals or
larger, and there is at least potential for further optimization.
Diffracting crystals have a Crystal Quality Score of �1,
where the crystal was subjected to an X-ray beam and
produced protein diffraction patterns.
3. Protein:precipitant mixing ratio
While sparse-matrix screens ideally yield well diffracting
crystals directly, more generally they are also effective even if
they generate only crystallinity (‘hits’), as this provides a quick
read-out of whether the particular protein preparation is of
sufficient quality. These also inform subsequent follow-up
strategies. We analysed whether the practice of multiple
mixing ratios in sparse-matrix screening experiments
increased hit identification, i.e. whether the three-droplet
strategy resulted in hits that would otherwise not have been
found if fewer droplets had been employed.
To this end, we generated the distribution of crystallinity in
all sparse-screen subwells. All human recorded scores for all
19 817 sparse-matrix plates set up since June 2004 and
containing at least one annotated hit, were retrieved from our
database. We considered all scores indicating crystallinity (3–
10) to be hits, and the last recorded score was taken as
conclusive. For each plate, the number of wells or conditions
that gave hits in any subwell was identified: plates with no
more than five crystallizing conditions were classed as ‘diffi-
cult’ experiments and the protein as a rare crystallizer, since
they only crystallized in a narrow range of conditions; plates
with more were classed as ‘easy’ and the protein was consid-
ered promiscuous. For each crystallizing well, the subwell(s)
that gave the hit(s) was identified. All plates were treated as
independent experiments, even though some would have
shared the same protein: this analysis was meant to reflect a
hit-identification exercise, which is the simplest form of
analysing crystallization screening results.
The analysis is summarized in Fig. 3(a), and three obser-
vations support its accuracy. Firstly, hits occur in multiple
subwells more frequently when there are more crystallizing
research papers
Acta Cryst. (2016). D72, 224–235 Ng et al. � Lessons from ten years of crystallization experiments at the SGC 227
Figure 2The scoring system used at the SGC for recording crystalline behaviour,Scores of �3 are considered to be hits. Other scores/classes forprecipitates and droplet errors are not shown. The tags and colourscheme are reproduced here exactly as they are configured in thesoftware, since this is the only description of these categories that wasever seen by all users (although most were given training by moreexperienced scientists). This sparseness of information was deliberate,since it was always assumed that scoring would be largely subjective.
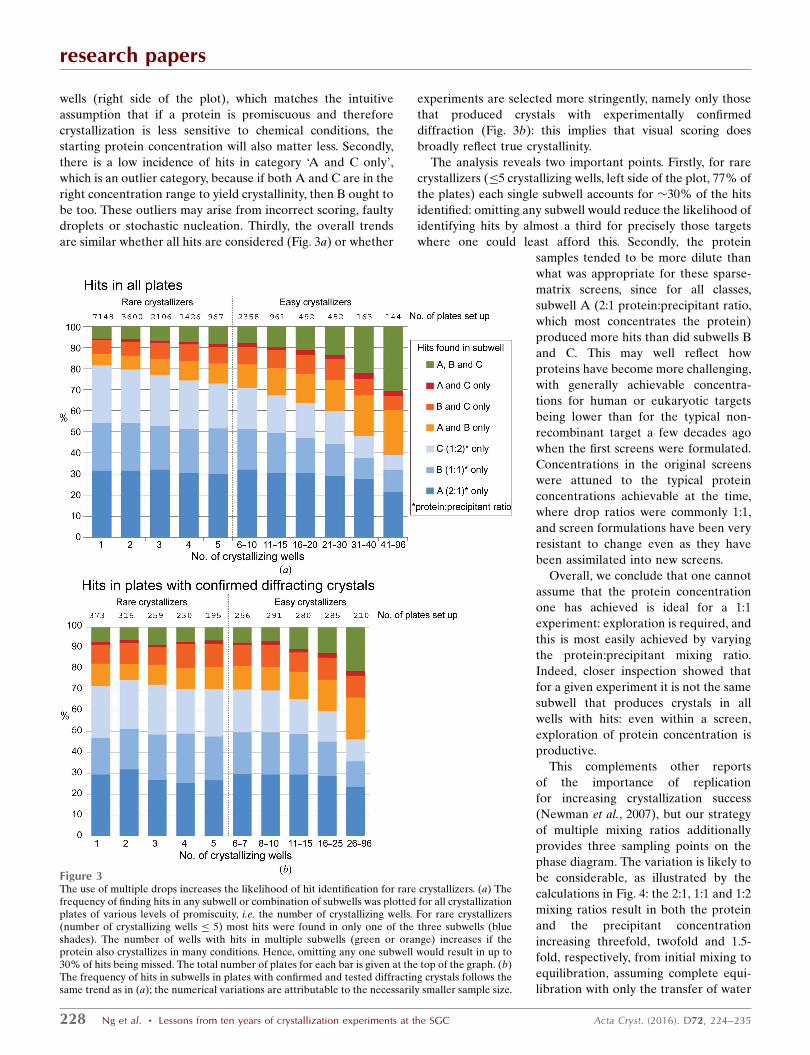
wells (right side of the plot), which matches the intuitive
assumption that if a protein is promiscuous and therefore
crystallization is less sensitive to chemical conditions, the
starting protein concentration will also matter less. Secondly,
there is a low incidence of hits in category ‘A and C only’,
which is an outlier category, because if both A and C are in the
right concentration range to yield crystallinity, then B ought to
be too. These outliers may arise from incorrect scoring, faulty
droplets or stochastic nucleation. Thirdly, the overall trends
are similar whether all hits are considered (Fig. 3a) or whether
experiments are selected more stringently, namely only those
that produced crystals with experimentally confirmed
diffraction (Fig. 3b): this implies that visual scoring does
broadly reflect true crystallinity.
The analysis reveals two important points. Firstly, for rare
crystallizers (�5 crystallizing wells, left side of the plot, 77% of
the plates) each single subwell accounts for �30% of the hits
identified: omitting any subwell would reduce the likelihood of
identifying hits by almost a third for precisely those targets
where one could least afford this. Secondly, the protein
samples tended to be more dilute than
what was appropriate for these sparse-
matrix screens, since for all classes,
subwell A (2:1 protein:precipitant ratio,
which most concentrates the protein)
produced more hits than did subwells B
and C. This may well reflect how
proteins have become more challenging,
with generally achievable concentra-
tions for human or eukaryotic targets
being lower than for the typical non-
recombinant target a few decades ago
when the first screens were formulated.
Concentrations in the original screens
were attuned to the typical protein
concentrations achievable at the time,
where drop ratios were commonly 1:1,
and screen formulations have been very
resistant to change even as they have
been assimilated into new screens.
Overall, we conclude that one cannot
assume that the protein concentration
one has achieved is ideal for a 1:1
experiment: exploration is required, and
this is most easily achieved by varying
the protein:precipitant mixing ratio.
Indeed, closer inspection showed that
for a given experiment it is not the same
subwell that produces crystals in all
wells with hits: even within a screen,
exploration of protein concentration is
productive.
This complements other reports
of the importance of replication
for increasing crystallization success
(Newman et al., 2007), but our strategy
of multiple mixing ratios additionally
provides three sampling points on the
phase diagram. The variation is likely to
be considerable, as illustrated by the
calculations in Fig. 4: the 2:1, 1:1 and 1:2
mixing ratios result in both the protein
and the precipitant concentration
increasing threefold, twofold and 1.5-
fold, respectively, from initial mixing to
equilibration, assuming complete equi-
libration with only the transfer of water
research papers
228 Ng et al. � Lessons from ten years of crystallization experiments at the SGC Acta Cryst. (2016). D72, 224–235
Figure 3The use of multiple drops increases the likelihood of hit identification for rare crystallizers. (a) Thefrequency of finding hits in any subwell or combination of subwells was plotted for all crystallizationplates of various levels of promiscuity, i.e. the number of crystallizing wells. For rare crystallizers(number of crystallizing wells � 5) most hits were found in only one of the three subwells (blueshades). The number of wells with hits in multiple subwells (green or orange) increases if theprotein also crystallizes in many conditions. Hence, omitting any one subwell would result in up to30% of hits being missed. The total number of plates for each bar is given at the top of the graph. (b)The frequency of hits in subwells in plates with confirmed and tested diffracting crystals follows thesame trend as in (a); the numerical variations are attributable to the necessarily smaller sample size.
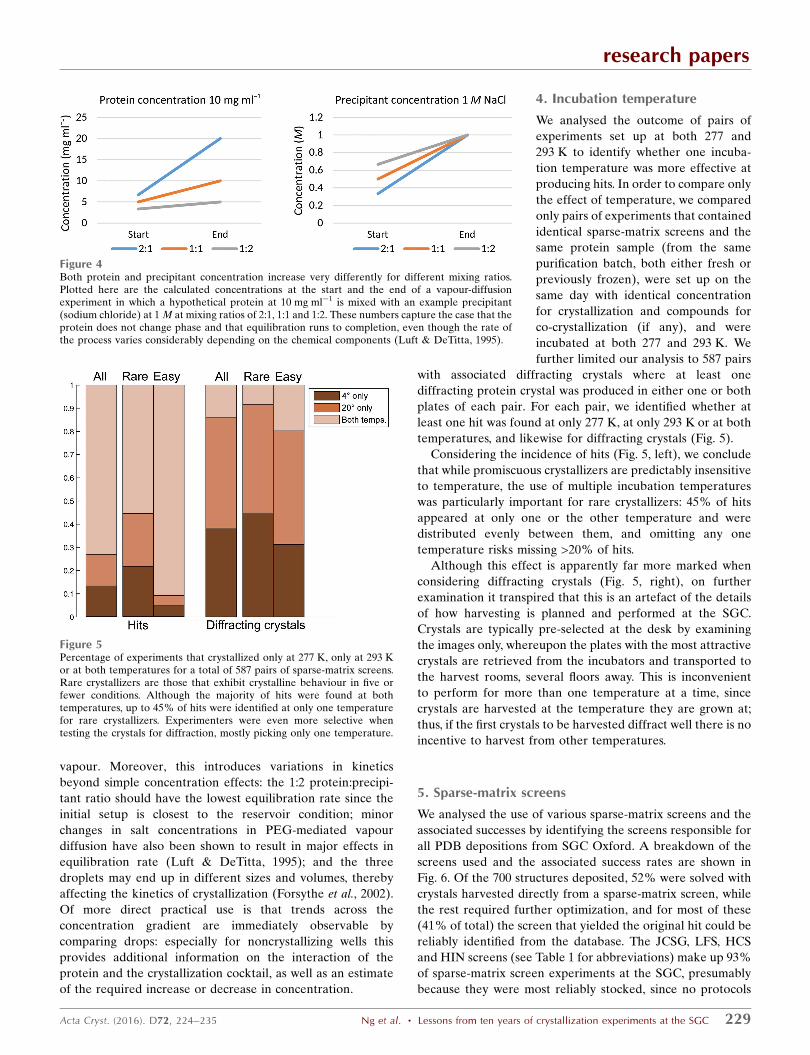
vapour. Moreover, this introduces variations in kinetics
beyond simple concentration effects: the 1:2 protein:precipi-
tant ratio should have the lowest equilibration rate since the
initial setup is closest to the reservoir condition; minor
changes in salt concentrations in PEG-mediated vapour
diffusion have also been shown to result in major effects in
equilibration rate (Luft & DeTitta, 1995); and the three
droplets may end up in different sizes and volumes, thereby
affecting the kinetics of crystallization (Forsythe et al., 2002).
Of more direct practical use is that trends across the
concentration gradient are immediately observable by
comparing drops: especially for noncrystallizing wells this
provides additional information on the interaction of the
protein and the crystallization cocktail, as well as an estimate
of the required increase or decrease in concentration.
4. Incubation temperature
We analysed the outcome of pairs of
experiments set up at both 277 and
293 K to identify whether one incuba-
tion temperature was more effective at
producing hits. In order to compare only
the effect of temperature, we compared
only pairs of experiments that contained
identical sparse-matrix screens and the
same protein sample (from the same
purification batch, both either fresh or
previously frozen), were set up on the
same day with identical concentration
for crystallization and compounds for
co-crystallization (if any), and were
incubated at both 277 and 293 K. We
further limited our analysis to 587 pairs
with associated diffracting crystals where at least one
diffracting protein crystal was produced in either one or both
plates of each pair. For each pair, we identified whether at
least one hit was found at only 277 K, at only 293 K or at both
temperatures, and likewise for diffracting crystals (Fig. 5).
Considering the incidence of hits (Fig. 5, left), we conclude
that while promiscuous crystallizers are predictably insensitive
to temperature, the use of multiple incubation temperatures
was particularly important for rare crystallizers: 45% of hits
appeared at only one or the other temperature and were
distributed evenly between them, and omitting any one
temperature risks missing >20% of hits.
Although this effect is apparently far more marked when
considering diffracting crystals (Fig. 5, right), on further
examination it transpired that this is an artefact of the details
of how harvesting is planned and performed at the SGC.
Crystals are typically pre-selected at the desk by examining
the images only, whereupon the plates with the most attractive
crystals are retrieved from the incubators and transported to
the harvest rooms, several floors away. This is inconvenient
to perform for more than one temperature at a time, since
crystals are harvested at the temperature they are grown at;
thus, if the first crystals to be harvested diffract well there is no
incentive to harvest from other temperatures.
5. Sparse-matrix screens
We analysed the use of various sparse-matrix screens and the
associated successes by identifying the screens responsible for
all PDB depositions from SGC Oxford. A breakdown of the
screens used and the associated success rates are shown in
Fig. 6. Of the 700 structures deposited, 52% were solved with
crystals harvested directly from a sparse-matrix screen, while
the rest required further optimization, and for most of these
(41% of total) the screen that yielded the original hit could be
reliably identified from the database. The JCSG, LFS, HCS
and HIN screens (see Table 1 for abbreviations) make up 93%
of sparse-matrix screen experiments at the SGC, presumably
because they were most reliably stocked, since no protocols
research papers
Acta Cryst. (2016). D72, 224–235 Ng et al. � Lessons from ten years of crystallization experiments at the SGC 229
Figure 4Both protein and precipitant concentration increase very differently for different mixing ratios.Plotted here are the calculated concentrations at the start and the end of a vapour-diffusionexperiment in which a hypothetical protein at 10 mg ml�1 is mixed with an example precipitant(sodium chloride) at 1 M at mixing ratios of 2:1, 1:1 and 1:2. These numbers capture the case that theprotein does not change phase and that equilibration runs to completion, even though the rate ofthe process varies considerably depending on the chemical components (Luft & DeTitta, 1995).
Figure 5Percentage of experiments that crystallized only at 277 K, only at 293 Kor at both temperatures for a total of 587 pairs of sparse-matrix screens.Rare crystallizers are those that exhibit crystalline behaviour in five orfewer conditions. Although the majority of hits were found at bothtemperatures, up to 45% of hits were identified at only one temperaturefor rare crystallizers. Experimenters were even more selective whentesting the crystals for diffraction, mostly picking only one temperature.

were enforced as to how they should be prioritized. While our
yield of structures direct from the coarse screen is high
compared with other analyses (17–25%; Fazio et al., 2014), we
tentatively attribute this to the stringent enforcement of best
practice for crystal testing and data collection (Krojer et al.,
2013). Specifically, this yielded usable data sets for many
crystals that might have appeared unusable to less experi-
enced practitioners.
These four screens were also responsible for over 94% of
all deposited structures when counting crystals grown both
directly in, and through optimization of conditions present in,
these screens. A breakdown of these numbers is given in
Fig. 6(a): success rates (green line) were calculated as the
number of structures attributable to that screen divided by the
total number of screens set up. Also shown are the proportions
of structures solved from crystals directly obtained from the
sparse-matrix screen (blue) or an optimized condition from
the screen (yellow).
On the face of it, the older, original screen (HCS) was
outperformed by the more modern screens (JCSG, HIN and
LFS). HIN was explicitly formulated to cover regions of
chemical space not covered by HCS, and JCSG was the
consolidation of successful conditions from at least six
commercial screens tested against hundreds of proteins.
However, the fact that LFS has both the highest success rate
and the most structures directly from coarse screens is parti-
cularly interesting: although its coverage of chemical space is
narrow, by design it has high internal redundancy. This lends
further support to the importance of redundancy, as discussed
in the previous sections. On the other hand, this is a drawback
when protein supply is limited, as discussed later, and the
other screens sample chemical space significantly more widely
than LFS (Table 2), which should be more informative as long
as an efficient infrastructure is in place to design and mix
optimization screens and thus pursue marginal hits rapidly.
Such solutions are available from vendors (although expen-
sive), but not at the SGC, where the home-grown infra-
structure was initially rudimentary and later merely adequate;
therefore, fewer marginal hits from the non-LFS screens will
have been pursued, particularly whenever a ‘better’ hit had
been identified elsewhere. Thus, the superiority of the LFS
screen is misleading and is unlikely to reflect the true useful-
ness of exploring chemical space in the coarse screen.
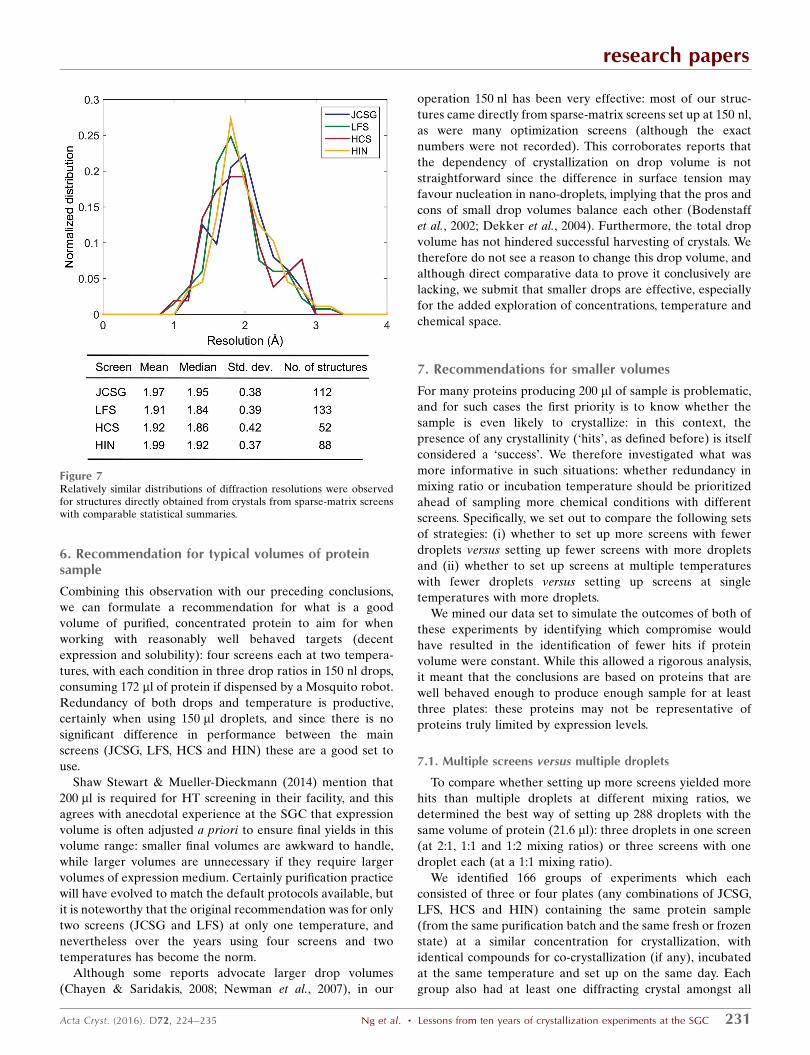
The distributions of diffraction resolutions are similar for all
four major sparse-matrix screens (Fig. 7); this is consistent
with the assumption that it is the protein itself whose prop-
erties dictate crystal quality.
Other screens that also contributed to PDB depositions are
shown in Fig. 6(b), although without showing success rates, as
the number of samples is too low for these to be meaningful.
The fact that these screens were so rarely used, even though
they were always available, leads us to conclude cautiously
that it is adequately informative to set up only a few screens
(four in our case); the main caveat to this conclusion is that
training bias is likely to be strong, since most users were not
experienced crystallographers.
research papers
230 Ng et al. � Lessons from ten years of crystallization experiments at the SGC Acta Cryst. (2016). D72, 224–235
Table 2Diversity and distinct chemicals vary considerably in the four mostpopular screens at the SGC.
The internal diversity score was calculated by taking the mean of cocktaildistances for all conditions, as defined by Bruno et al. (2014). The number ofchemical components refers to the stock solutions necessary for mixing eachscreen.
ScreenInternal diversityscore
No. of distinctchemical components
JCSG 0.5650 59LFS 0.2728 35HIN 0.5754 46HCS 0.6196 54
Figure 6Comparable success rates observed for the four most popular screens used at the SGC. (a) shows the number and proportion of structures solved withcrystals directly harvested from sparse-matrix screens (blue) or those that required optimization (yellow) for these screens. Novel structures and follow-up structures have also been separated as they do not necessarily have the same crystallizing conditions and hence are often re-screened. The green lineindicates the success rate (percentage of structures derived from the screen/total number of screens set up). (b) shows a breakdown of the remainingdeposited structures (6%) from other screens. See Table 1 for the abbreviations used.
6. Recommendation for typical volumes of proteinsample
Combining this observation with our preceding conclusions,
we can formulate a recommendation for what is a good
volume of purified, concentrated protein to aim for when
working with reasonably well behaved targets (decent
expression and solubility): four screens each at two tempera-
tures, with each condition in three drop ratios in 150 nl drops,
consuming 172 ml of protein if dispensed by a Mosquito robot.
Redundancy of both drops and temperature is productive,
certainly when using 150 ml droplets, and since there is no
significant difference in performance between the main
screens (JCSG, LFS, HCS and HIN) these are a good set to
use.
Shaw Stewart & Mueller-Dieckmann (2014) mention that
200 ml is required for HT screening in their facility, and this
agrees with anecdotal experience at the SGC that expression
volume is often adjusted a priori to ensure final yields in this
volume range: smaller final volumes are awkward to handle,
while larger volumes are unnecessary if they require larger
volumes of expression medium. Certainly purification practice
will have evolved to match the default protocols available, but
it is noteworthy that the original recommendation was for only
two screens (JCSG and LFS) at only one temperature, and
nevertheless over the years using four screens and two
temperatures has become the norm.
Although some reports advocate larger drop volumes
(Chayen & Saridakis, 2008; Newman et al., 2007), in our
operation 150 nl has been very effective: most of our struc-
tures came directly from sparse-matrix screens set up at 150 nl,
as were many optimization screens (although the exact
numbers were not recorded). This corroborates reports that
the dependency of crystallization on drop volume is not
straightforward since the difference in surface tension may
favour nucleation in nano-droplets, implying that the pros and
cons of small drop volumes balance each other (Bodenstaff
et al., 2002; Dekker et al., 2004). Furthermore, the total drop
volume has not hindered successful harvesting of crystals. We
therefore do not see a reason to change this drop volume, and
although direct comparative data to prove it conclusively are
lacking, we submit that smaller drops are effective, especially
for the added exploration of concentrations, temperature and
chemical space.
7. Recommendations for smaller volumes
For many proteins producing 200 ml of sample is problematic,
and for such cases the first priority is to know whether the
sample is even likely to crystallize: in this context, the
presence of any crystallinity (‘hits’, as defined before) is itself
considered a ‘success’. We therefore investigated what was
more informative in such situations: whether redundancy in
mixing ratio or incubation temperature should be prioritized
ahead of sampling more chemical conditions with different
screens. Specifically, we set out to compare the following sets
of strategies: (i) whether to set up more screens with fewer
droplets versus setting up fewer screens with more droplets
and (ii) whether to set up screens at multiple temperatures
with fewer droplets versus setting up screens at single
temperatures with more droplets.
We mined our data set to simulate the outcomes of both of
these experiments by identifying which compromise would
have resulted in the identification of fewer hits if protein
volume were constant. While this allowed a rigorous analysis,
it meant that the conclusions are based on proteins that are
well behaved enough to produce enough sample for at least
three plates: these proteins may not be representative of
proteins truly limited by expression levels.
7.1. Multiple screens versus multiple droplets
To compare whether setting up more screens yielded more
hits than multiple droplets at different mixing ratios, we
determined the best way of setting up 288 droplets with the
same volume of protein (21.6 ml): three droplets in one screen
(at 2:1, 1:1 and 1:2 mixing ratios) or three screens with one
droplet each (at a 1:1 mixing ratio).
We identified 166 groups of experiments which each
consisted of three or four plates (any combinations of JCSG,
LFS, HCS and HIN) containing the same protein sample
(from the same purification batch and the same fresh or frozen
state) at a similar concentration for crystallization, with
identical compounds for co-crystallization (if any), incubated
at the same temperature and set up on the same day. Each
group also had at least one diffracting crystal amongst all
research papers
Acta Cryst. (2016). D72, 224–235 Ng et al. � Lessons from ten years of crystallization experiments at the SGC 231
Figure 7Relatively similar distributions of diffraction resolutions were observedfor structures directly obtained from crystals from sparse-matrix screenswith comparable statistical summaries.

plates in the group, to ensure that protein quality was not
limiting in this analysis. The success rates for all three-screen
combinations are shown in Fig. 8. For each combination, we
extracted whether at least one hit was scored for (i) all three
screens in 1:1 drops (dark blue bars) or (ii) any individual
screen with three drops (green bars) or (iii) hits were not
found in either method, therefore requiring the full three-
drop/three-screen protocol (red/orange bars). While this
definition of ‘success’ does rely on user scoring, as mentioned
before (x2) we have found them broadly reliable even indi-
vidually, without scores for later drops not being affected by
hits found in earlier drops; it thus seems safe to assume that
accuracy remains good when scores are effectively pooled by
the criterion of at least one hit as we do here.
The comparison indicates that setting up three screens with
one drop was always but only marginally more effective at
finding hits than one screen with three drops (the blue bars are
consistently higher than the highest green bar); in particular,
the combination of JCSG, HCS and HIN was the most effec-
tive. Some of this may be attributable to the considerable
overlap in conditions between JCSG and both HCS and HIN.
Of the one-screen/three-drop experiments, JCSG was
consistently more effective than HIN and HCS, but only
slightly so. In contrast, LFS was systematically far worse than
the others when used in this context. This appears at odds with
the conclusion from Fig. 6, where LFS had the highest overall
success rate and also the most structures obtained directly
without further optimization. The most likely explanation is
that the proteins in the experiments selected here happened
not to crystallize well in the narrow chemical space sampled by
LFS. The corollary is that it is a screen that, when it works, it
works well, often directly producing crystals sufficient for
diffraction analysis; yet when it fails, it yields little informa-
tion.
This leads to a further conclusion: the ‘success rate’ of
screens will always depend on the proteins actually sampled
during its evaluation. Thus, statements on the success rate of
individual screens are meaningless unless all proteins were
equally tested in all screens and followed up with equal rigour.
This also applies to our analysis: while JCSG was consistently
the most successful single screen, this cannot be generalized
beyond this sample. The only robust conclusion is that a
strategy that samples more conditions yields more hits, but
only marginally so.
Regarding the protein ratio in the single-drop/multi-screen
approach, the 1:1 ratio had consistently higher success rates
(Fig. 9). While the data set is somewhat small, with only �100
experiments, it is nevertheless consistent with the assumption
that coarse screens were historically derived from 1:1 drop
ratio crystallizations: the experiments in this subset were self-
selected by the presence of diffracting crystals, which implies
that the respective protein concentrations were tuned to the
concentrations of the screens. In contrast, the slight bias
for 2:1 drop ratios discussed in Fig. 3(a) is observed for the
research papers
232 Ng et al. � Lessons from ten years of crystallization experiments at the SGC Acta Cryst. (2016). D72, 224–235
Figure 8Setting up multiple screens with single droplets leads to better identification of hits when compared with setting up single screens with multiple droplets.Here, we compared the hit-identification rates for experiments with one drop at a 1:1 mixing ratio in three screens (blue bars) and with three drops at 2:1,1:1 and 1:2 mixing ratios in a single screen (green bars) to keep the required protein sample constant. Each screen was only compared with permutationsthat include itself. Red bars indicate how many hits were missed by both methods.
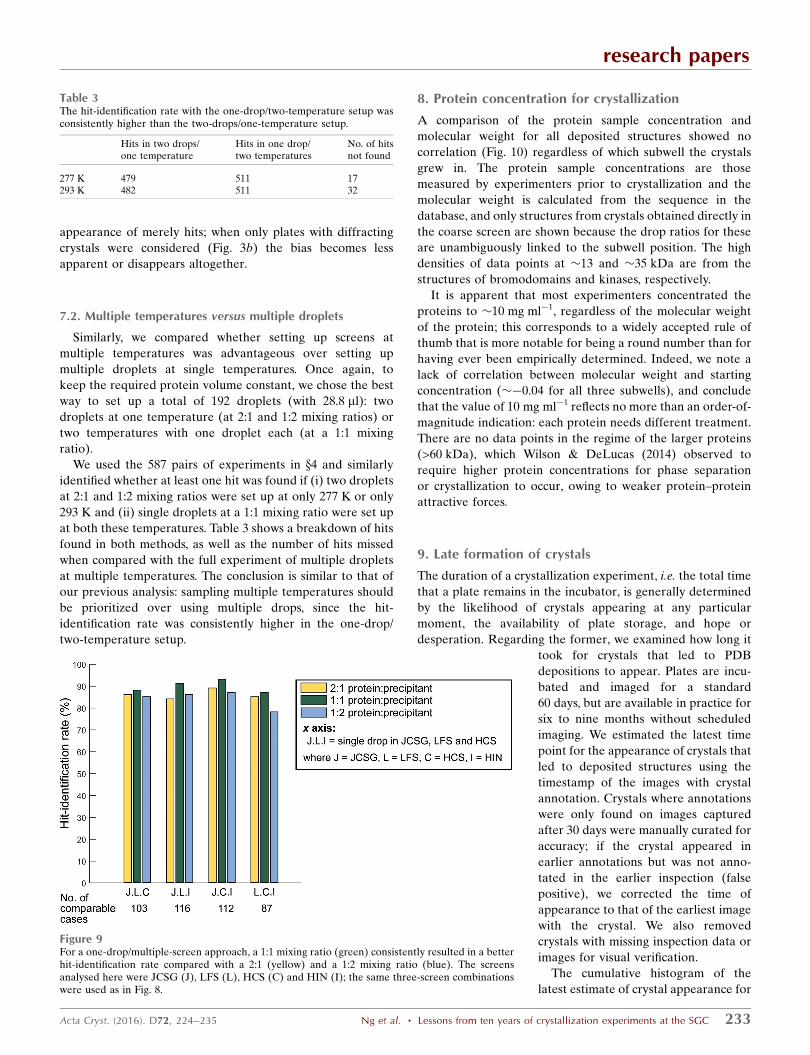
appearance of merely hits; when only plates with diffracting
crystals were considered (Fig. 3b) the bias becomes less
apparent or disappears altogether.
7.2. Multiple temperatures versus multiple droplets
Similarly, we compared whether setting up screens at
multiple temperatures was advantageous over setting up
multiple droplets at single temperatures. Once again, to
keep the required protein volume constant, we chose the best
way to set up a total of 192 droplets (with 28.8 ml): two
droplets at one temperature (at 2:1 and 1:2 mixing ratios) or
two temperatures with one droplet each (at a 1:1 mixing
ratio).
We used the 587 pairs of experiments in x4 and similarly
identified whether at least one hit was found if (i) two droplets
at 2:1 and 1:2 mixing ratios were set up at only 277 K or only
293 K and (ii) single droplets at a 1:1 mixing ratio were set up
at both these temperatures. Table 3 shows a breakdown of hits
found in both methods, as well as the number of hits missed
when compared with the full experiment of multiple droplets
at multiple temperatures. The conclusion is similar to that of
our previous analysis: sampling multiple temperatures should
be prioritized over using multiple drops, since the hit-
identification rate was consistently higher in the one-drop/
two-temperature setup.
8. Protein concentration for crystallization
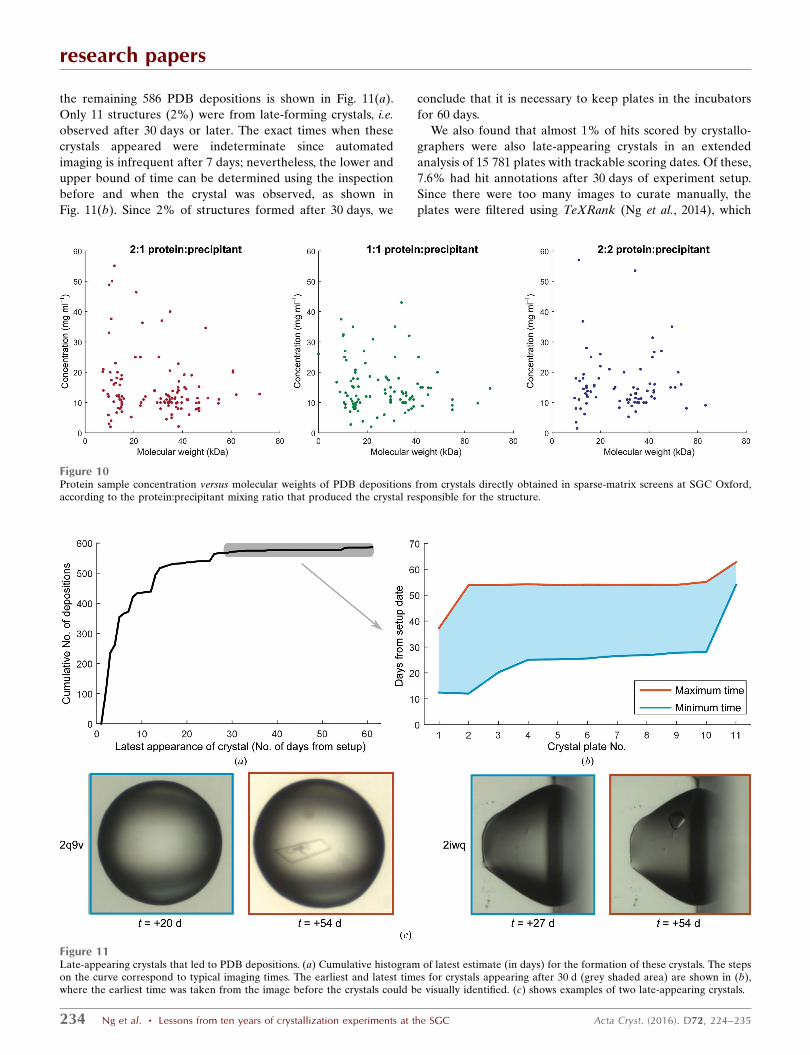
A comparison of the protein sample concentration and
molecular weight for all deposited structures showed no
correlation (Fig. 10) regardless of which subwell the crystals
grew in. The protein sample concentrations are those
measured by experimenters prior to crystallization and the
molecular weight is calculated from the sequence in the
database, and only structures from crystals obtained directly in
the coarse screen are shown because the drop ratios for these
are unambiguously linked to the subwell position. The high
densities of data points at �13 and �35 kDa are from the
structures of bromodomains and kinases, respectively.
It is apparent that most experimenters concentrated the
proteins to �10 mg ml�1, regardless of the molecular weight
of the protein; this corresponds to a widely accepted rule of
thumb that is more notable for being a round number than for
having ever been empirically determined. Indeed, we note a
lack of correlation between molecular weight and starting
concentration (��0.04 for all three subwells), and conclude
that the value of 10 mg ml�1 reflects no more than an order-of-
magnitude indication: each protein needs different treatment.
There are no data points in the regime of the larger proteins
(>60 kDa), which Wilson & DeLucas (2014) observed to
require higher protein concentrations for phase separation
or crystallization to occur, owing to weaker protein–protein
attractive forces.
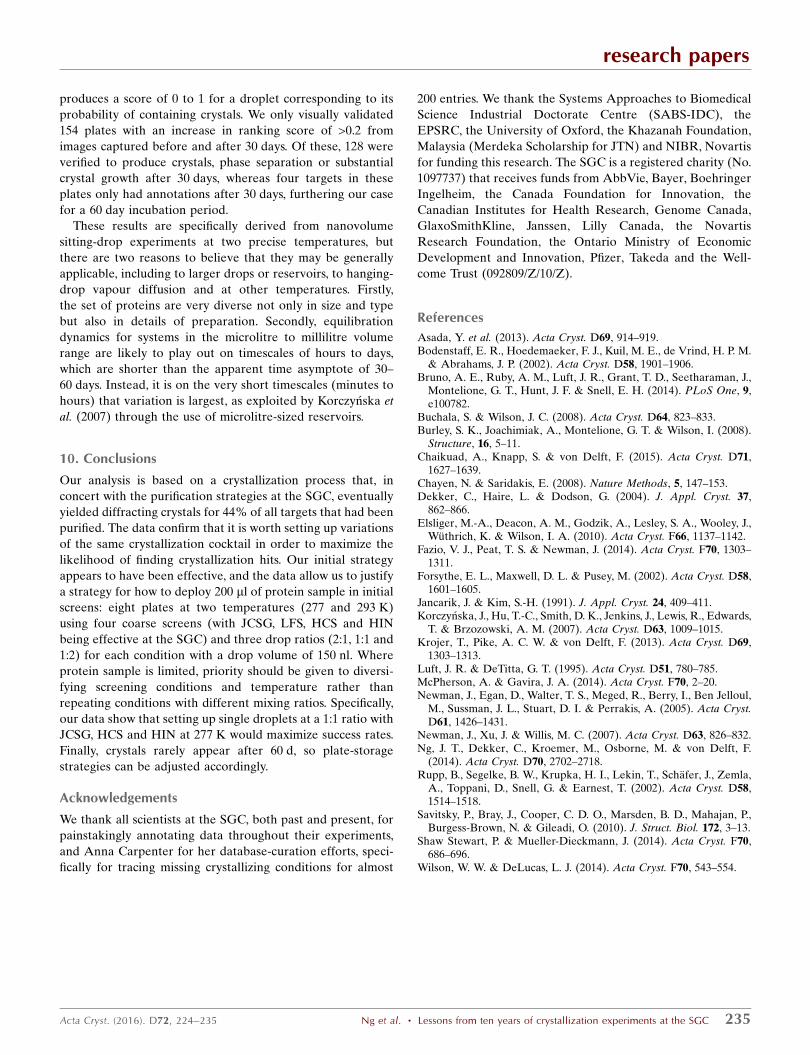
9. Late formation of crystals
The duration of a crystallization experiment, i.e. the total time
that a plate remains in the incubator, is generally determined
by the likelihood of crystals appearing at any particular
moment, the availability of plate storage, and hope or
desperation. Regarding the former, we examined how long it
took for crystals that led to PDB
depositions to appear. Plates are incu-
bated and imaged for a standard
60 days, but are available in practice for
six to nine months without scheduled
imaging. We estimated the latest time
point for the appearance of crystals that
led to deposited structures using the
timestamp of the images with crystal
annotation. Crystals where annotations
were only found on images captured
after 30 days were manually curated for
accuracy; if the crystal appeared in
earlier annotations but was not anno-
tated in the earlier inspection (false
positive), we corrected the time of
appearance to that of the earliest image
with the crystal. We also removed
crystals with missing inspection data or
images for visual verification.
The cumulative histogram of the
latest estimate of crystal appearance for
research papers
Acta Cryst. (2016). D72, 224–235 Ng et al. � Lessons from ten years of crystallization experiments at the SGC 233
Figure 9For a one-drop/multiple-screen approach, a 1:1 mixing ratio (green) consistently resulted in a betterhit-identification rate compared with a 2:1 (yellow) and a 1:2 mixing ratio (blue). The screensanalysed here were JCSG (J), LFS (L), HCS (C) and HIN (I); the same three-screen combinationswere used as in Fig. 8.
Table 3The hit-identification rate with the one-drop/two-temperature setup wasconsistently higher than the two-drops/one-temperature setup.
Hits in two drops/one temperature
Hits in one drop/two temperatures
No. of hitsnot found
277 K 479 511 17293 K 482 511 32
the remaining 586 PDB depositions is shown in Fig. 11(a).
Only 11 structures (2%) were from late-forming crystals, i.e.
observed after 30 days or later. The exact times when these
crystals appeared were indeterminate since automated
imaging is infrequent after 7 days; nevertheless, the lower and
upper bound of time can be determined using the inspection
before and when the crystal was observed, as shown in
Fig. 11(b). Since 2% of structures formed after 30 days, we
conclude that it is necessary to keep plates in the incubators
for 60 days.
We also found that almost 1% of hits scored by crystallo-
graphers were also late-appearing crystals in an extended
analysis of 15 781 plates with trackable scoring dates. Of these,
7.6% had hit annotations after 30 days of experiment setup.
Since there were too many images to curate manually, the
plates were filtered using TeXRank (Ng et al., 2014), which
research papers
234 Ng et al. � Lessons from ten years of crystallization experiments at the SGC Acta Cryst. (2016). D72, 224–235
Figure 11Late-appearing crystals that led to PDB depositions. (a) Cumulative histogram of latest estimate (in days) for the formation of these crystals. The stepson the curve correspond to typical imaging times. The earliest and latest times for crystals appearing after 30 d (grey shaded area) are shown in (b),where the earliest time was taken from the image before the crystals could be visually identified. (c) shows examples of two late-appearing crystals.
Figure 10Protein sample concentration versus molecular weights of PDB depositions from crystals directly obtained in sparse-matrix screens at SGC Oxford,according to the protein:precipitant mixing ratio that produced the crystal responsible for the structure.
produces a score of 0 to 1 for a droplet corresponding to its
probability of containing crystals. We only visually validated
154 plates with an increase in ranking score of >0.2 from
images captured before and after 30 days. Of these, 128 were
verified to produce crystals, phase separation or substantial
crystal growth after 30 days, whereas four targets in these
plates only had annotations after 30 days, furthering our case
for a 60 day incubation period.
These results are specifically derived from nanovolume
sitting-drop experiments at two precise temperatures, but
there are two reasons to believe that they may be generally
applicable, including to larger drops or reservoirs, to hanging-
drop vapour diffusion and at other temperatures. Firstly,
the set of proteins are very diverse not only in size and type
but also in details of preparation. Secondly, equilibration
dynamics for systems in the microlitre to millilitre volume
range are likely to play out on timescales of hours to days,
which are shorter than the apparent time asymptote of 30–
60 days. Instead, it is on the very short timescales (minutes to
hours) that variation is largest, as exploited by Korczynska et
al. (2007) through the use of microlitre-sized reservoirs.
10. Conclusions
Our analysis is based on a crystallization process that, in
concert with the purification strategies at the SGC, eventually
yielded diffracting crystals for 44% of all targets that had been
purified. The data confirm that it is worth setting up variations
of the same crystallization cocktail in order to maximize the
likelihood of finding crystallization hits. Our initial strategy
appears to have been effective, and the data allow us to justify
a strategy for how to deploy 200 ml of protein sample in initial
screens: eight plates at two temperatures (277 and 293 K)
using four coarse screens (with JCSG, LFS, HCS and HIN
being effective at the SGC) and three drop ratios (2:1, 1:1 and
1:2) for each condition with a drop volume of 150 nl. Where
protein sample is limited, priority should be given to diversi-
fying screening conditions and temperature rather than
repeating conditions with different mixing ratios. Specifically,
our data show that setting up single droplets at a 1:1 ratio with
JCSG, HCS and HIN at 277 K would maximize success rates.
Finally, crystals rarely appear after 60 d, so plate-storage
strategies can be adjusted accordingly.
Acknowledgements
We thank all scientists at the SGC, both past and present, for
painstakingly annotating data throughout their experiments,
and Anna Carpenter for her database-curation efforts, speci-
fically for tracing missing crystallizing conditions for almost
200 entries. We thank the Systems Approaches to Biomedical
Science Industrial Doctorate Centre (SABS-IDC), the
EPSRC, the University of Oxford, the Khazanah Foundation,
Malaysia (Merdeka Scholarship for JTN) and NIBR, Novartis
for funding this research. The SGC is a registered charity (No.
1097737) that receives funds from AbbVie, Bayer, Boehringer
Ingelheim, the Canada Foundation for Innovation, the
Canadian Institutes for Health Research, Genome Canada,
GlaxoSmithKline, Janssen, Lilly Canada, the Novartis
Research Foundation, the Ontario Ministry of Economic
Development and Innovation, Pfizer, Takeda and the Well-
come Trust (092809/Z/10/Z).
References
Asada, Y. et al. (2013). Acta Cryst. D69, 914–919.Bodenstaff, E. R., Hoedemaeker, F. J., Kuil, M. E., de Vrind, H. P. M.
& Abrahams, J. P. (2002). Acta Cryst. D58, 1901–1906.Bruno, A. E., Ruby, A. M., Luft, J. R., Grant, T. D., Seetharaman, J.,
Montelione, G. T., Hunt, J. F. & Snell, E. H. (2014). PLoS One, 9,e100782.
Buchala, S. & Wilson, J. C. (2008). Acta Cryst. D64, 823–833.Burley, S. K., Joachimiak, A., Montelione, G. T. & Wilson, I. (2008).
Structure, 16, 5–11.Chaikuad, A., Knapp, S. & von Delft, F. (2015). Acta Cryst. D71,
1627–1639.Chayen, N. & Saridakis, E. (2008). Nature Methods, 5, 147–153.Dekker, C., Haire, L. & Dodson, G. (2004). J. Appl. Cryst. 37,
862–866.Elsliger, M.-A., Deacon, A. M., Godzik, A., Lesley, S. A., Wooley, J.,
Wuthrich, K. & Wilson, I. A. (2010). Acta Cryst. F66, 1137–1142.Fazio, V. J., Peat, T. S. & Newman, J. (2014). Acta Cryst. F70, 1303–
1311.Forsythe, E. L., Maxwell, D. L. & Pusey, M. (2002). Acta Cryst. D58,
1601–1605.Jancarik, J. & Kim, S.-H. (1991). J. Appl. Cryst. 24, 409–411.Korczynska, J., Hu, T.-C., Smith, D. K., Jenkins, J., Lewis, R., Edwards,
T. & Brzozowski, A. M. (2007). Acta Cryst. D63, 1009–1015.Krojer, T., Pike, A. C. W. & von Delft, F. (2013). Acta Cryst. D69,
1303–1313.Luft, J. R. & DeTitta, G. T. (1995). Acta Cryst. D51, 780–785.McPherson, A. & Gavira, J. A. (2014). Acta Cryst. F70, 2–20.Newman, J., Egan, D., Walter, T. S., Meged, R., Berry, I., Ben Jelloul,
M., Sussman, J. L., Stuart, D. I. & Perrakis, A. (2005). Acta Cryst.D61, 1426–1431.
Newman, J., Xu, J. & Willis, M. C. (2007). Acta Cryst. D63, 826–832.Ng, J. T., Dekker, C., Kroemer, M., Osborne, M. & von Delft, F.
(2014). Acta Cryst. D70, 2702–2718.Rupp, B., Segelke, B. W., Krupka, H. I., Lekin, T., Schafer, J., Zemla,
A., Toppani, D., Snell, G. & Earnest, T. (2002). Acta Cryst. D58,1514–1518.
Savitsky, P., Bray, J., Cooper, C. D. O., Marsden, B. D., Mahajan, P.,Burgess-Brown, N. & Gileadi, O. (2010). J. Struct. Biol. 172, 3–13.
Shaw Stewart, P. & Mueller-Dieckmann, J. (2014). Acta Cryst. F70,686–696.
Wilson, W. W. & DeLucas, L. J. (2014). Acta Cryst. F70, 543–554.
research papers
Acta Cryst. (2016). D72, 224–235 Ng et al. � Lessons from ten years of crystallization experiments at the SGC 235