letter to mhc members - louisville
TRANSCRIPT

State of Metropolitan Housing Report
Metropolitan Housing Coalition
2011

This year the 2011 State of Metropolitan Housing Report uses updates from the 2010 Census and combines that with new data from the American Community Survey. We continue to document deep changes that have occurred in our community since 2005 when the foreclosure crisis began to dovetail with the economic crisis. The trends in foreclosure, vacant properties, homeless families with children and loss of value in some of our neighborhoods have led to a Louisville in crisis. There are over 25,000 households on the waiting list for housing assistance and our median income has decreased.
This year our focus topic is the environmental issues that affect fair and affordable housing. Air, water, and soil are issues that have environmental justice components. Answers such as energy-effi cient housing, better public transit and sustainable development not only address cost and choice issues, but keep our community healthy for us all.
The data in the 2011 SMHR shows:
• Subsidized housing in Louisville Metro remains highly concentrated. Nearly three-fourths of all subsidized housing units in Jefferson County are located in seven out of 26 Metro Council districts (districts 1, 2, 3, 4, 5, 6, and 15), while districts 7 and 16’s combined total of subsidized units is only 0.3 percent.
• In 2010, 15.3 percent of all people in the Louisville Metropolitan Statistical Area (MSA) were below the poverty threshold (American Community Survey, 2010).
• Within the Louisville MSA, renters comprise a little over a third of the total number of households, and nearly half (48 percent) of renter households cannot afford a two-bedroom unit at Fair Market Rent.
• Of the 22 major industry sectors in the Louisville MSA, six of these (comprising 28 percent of the total employment) have median annual incomes that fall below the annual income needed for a household to afford a two-bedroom rental unit at Fair Market Rent.
• There has been a 6 percent decrease in the number of affordable housing units in Louisville Metro over the past year, which includes a loss of 663 public housing units.
• The 2010 homeownership rate in the Louisville MSA dropped to 63.4 percent, the lowest rate since 2005.
• The Louisville MSA saw a total of 8,361 foreclosures in 2010, an increase of 17 percent from 2009.
• During the 2010-2011 school year, 9.6 percent of the total student enrollment for Jefferson County Public Schools (JCPS) was homeless at some point during the school year.
While the data paint a picture of need, MHC always looks to how things can be better and this year is no exception. Instead of just listing our accomplishments since last year, we give you a way to work on all of these issues.
MHC is working on ways to increase investment in fair and affordable housing and we see several bright spots.
• The Louisville Affordable Housing Trust Fund (LAHTF) is up and running and Mayor Fischer has given the LAHTF a challenge match grant to start raising funds for programs. Join us in advocating for funding for the LAHTF.
• MHC’s Annual Meeting speaker, Dan Kildee from the Center for Community Progress, gave us a roadmap to keep money from the collection of delinquent property taxes in our community instead of exporting those funds. Local control of this process will not only mean increased funds for housing (without raising any fee or tax) but will result in the equal treatment of all delinquent taxpayers instead of the unequal and unpredictable treatment that is currently happening.
Join the Local Options for Kentucky Liens (LOKL) coalition to give local control of collecting delinquent property taxes back to Kentucky’s counties.
• The Land Development Code (LDC) is under review and requires vigilance and advocacy to make sure that fair and affordable housing is allowed in all parts of Louisville Metro. MHC published the State of Fair Housing in Louisville: Impediments and Improvements this year which showed that where we zone to permit or prevent affordable housing keeps Louisville segregated by race, family type, sex and disability. MHC participated in redrafting the LDC to allow shelters and transitional housing for homeless people and families and successfully demonstrated that we can be more inclusive.
MHC will continue to ask for your participation as the LDC gets reviewed to give strength to the commitment of affordable housing opportunities throughout Louisville Metro.
• MHC was an Intervener in three cases before the Public Service Commission in which the cost of utilities was under review. MHC represented the need for energy-effi cient rehab programs for low-income households, particularly as we face rising energy costs. Investments like these have a huge impact in affordability of shelter.
• MHC continues to operate a loan pool for non-profi t developers with the support of the Kentucky Housing Corporation. Despite setbacks in funding, the pool was able to invest in the construction and rehabilitation of 166 affordable housing units in Program Year 2010.
• MHC collaborated with many partners on issues relating to homeless children which resulted in a day-long training event for staff of JCPS, Family Court and the Kentucky Department of Community-Based Services. This collaboration is being recognized in the Pyramid Awards and has also led to MHC’s fi rst HUD grant for research. This work has solidifi ed our partnership with JCPS, Spalding University and the Coalition for the Homeless.
We want to thank the major donors who have made our work possible as well as the members of MHC who support this work fi nancially and with their time and commitment.
Cathy HinkoExecutive DirectorMetropolitan Housing Coalition
Christie McCravyMHC Board President
Letter to MHC Members
i 2011 State of Metropolitan Housing Report

Letter to MHC Members ................................................................................................................ i
Introduction .................................................................................................................................. 1
Measures of Housing Affordability
Measure 1: Concentration of Subsidized Housing .........................................................................10
Measure 2: Housing Segregation ..................................................................................................12
Measure 3: Renters with Excessive Cost Burden ..........................................................................14
Measure 4: Production and Rehabilitation of Affordable Housing .................................................16
Measure 5: Homeownership Rate .................................................................................................17
Measure 6: Access to Homeownership .........................................................................................18
Measure 7: Foreclosures ...............................................................................................................19
Measure 8: Homelessness ............................................................................................................21
Measure 9: Community Development Block Grants (CDBG) and HOME Funds .............................22
Appendix
Data Sources ..............................................................................................................................................23
Defi nitions ..................................................................................................................................................24
References .................................................................................................................................................26
Annual Meeting Sponsors ....................................................................................................................................28
State of Metropolitan Housing Report Sponsors .................................................................................................28
MHC Board of Directors .......................................................................................................................................29
Foundations and Grant-Making Institutions ........................................................................................................30
MHC Staff .............................................................................................................................................................30
Acknowledgements ..............................................................................................................................................30
MHC Individual Members ....................................................................................................................................31
MHC Organizational Members .............................................................................................................................32
Table of Contents
www.metropolitanhousing.org ii

Environmental factors are an integral part of defi ning safe, fair and affordable housing. The link between the environment and housing is not a new or radical concept. Energy effi ciency and housing affordability, the proximity of housing to air and water pollution sources, lead paint in the home and in the surrounding soil, the environmental impacts of vacant properties, and energy use as it relates to housing and transportation options are all examples of established links between environmental issues and housing. This year’s State of Metropolitan Housing Report focuses on this relationship and how it impacts the Louisville area. We provide an overview of some of these concerns, examine these issues locally, and present case studies and examples to inform action in Louisville.
Environmental Justice is the fair treatment and meaningful involvement of all people regardless of race, color, national origin, or income with respect to the development, implementation, and enforcement of environmental laws, regulations, and policies.
– U. S Environmental Protection Agency
ENVIRONMENTAL IMPACTS OF HOUSING
There are several strategies that can be used to promote housing that is fair, affordable, and environmentally sound. Affordable housing should be built near existing jobs and centers of job creation to reduce work commutes for residents. A reduction in commute time reduces the auto emissions that result from long commutes; saves commuters money on gasoline and auto maintenance; and, in cases where other transportation options such as walking, biking, or public transit are available, removes auto emissions from that commute, altogether. Affordable housing development should also prioritize infi ll in already-developed areas to reduce construction on undeveloped greenspace and promote adaptive reuse of existing buildings to reduce construction materials and waste. Affordable housing can also be created by converting existing housing to affordable units, thereby avoiding any costs for new construction or development of unused land. In addition, energy effi ciency and the cost of utilities are an important and often overlooked component of housing affordability, and units should be constructed, or retrofi tted with, energy-effi cient features to reduce energy costs for residents.
Housing Affordability vs. Greenspace Preservation
Are the goals of affordable housing and greenspace preservation at odds? Some have argued that preserving greenspace and mandating higher-density development increases housing prices, thereby reducing the availability of affordable homes. However, affordable
housing strategies that mandate the creation of affordable units such as inclusionary zoning (see the 2006 and 2010 State of Metropolitan Housing Reports) can provide affordable units even in high-cost areas, to give residents access to other cost-saving benefi ts such as multiple transportation options and proximity to job centers and community amenities. The Vermont Housing and Conservation Trust Fund is seen as a model for linking the goals of greenspace preservation and housing affordability. Since its inception in 1987, it has provided affordable housing for over 10,000 people and saved over 165,000 acres of farms and open space. A broad-based coalition, which included the State’s land trusts, housing advocates, historic preservation groups, and environmentalists, was formed and lobbied to pass legislation to create the joint trust fund (Axel-Lute, 1999). The groups found a common goal in the recognition that affordable housing was a necessity, but should be developed without promoting low-density sprawl and sacrifi cing Vermont’s farmland and greenspace. Other similar coalitions have been formed through an understanding of the relationship between urban disinvestment and the loss of open space.
Location Effi ciency and Housing Type
A recent study conducted for the U.S. Environmental Protection Agency (EPA) examined the relationship between housing type, location, and energy use to determine what type of development is the most energy effi cient. The study concluded that both the type of housing (single-family vs. multi-family) and the location of housing play an important role in household energy usage (Hernandez, Lister, and Suarez, 2011). Both housing location and type also play a greater role in energy usage than energy-effi cient construction and fuel-effi cient cars. The researchers compared the effects of conventional suburban development (CSD) with transit-oriented development (TOD) on household energy usage in British Thermal Units (BTUs). The study found that TOD households use 38 to 50 percent less energy (depending on housing type) than their CSD counterparts. These energy savings are 53 to 62 percent greater if the TOD home is energy effi cient and the household drives an energy-effi cient vehicle. The researchers use the term location effi cient housing to describe more energy-effi cient development patterns such as TOD, where housing is located in a walkable neighborhood near public transit, employment centers, schools, and other amenities that allow residents to drive less, thereby reducing transportation costs and vehicle emissions. These higher-density developments also use less land, preserve greenspace, and typically include multi-family housing which is more energy effi cient and uses fewer building materials than single-family construction.
2011 State of Metropolitan Housing Report
1 2011 State of Metropolitan Housing Report

Environmental Impacts of Vacant Properties and Brownfi elds
The negative economic impacts of vacant land on surrounding properties are well-documented, but vacant properties also have negative environmental impacts on neighborhoods. Vacant properties, whether vacant structures or empty lots that are not maintained, can potentially produce a number of conditions that negatively impact both the natural environment and human safety, including leaking sewage, fi re hazards, rodent infestations, and illegal dumping. Deteriorating structures, particularly older homes such as those found throughout Louisville’s urban neighborhoods, deposit lead from paint and other contaminants into the soil, which can eventually reach waterways and impact other areas within the watershed. Severely deteriorated vacant structures are sometimes demolished, the process of which can result in environmental and health concerns, as well. Demolition of older structures, which often contain lead paint and pipes and other harmful chemicals, can produce signifi cant increases in lead dust within 10 meters of a demolition site (Farfel et al., 2003). Even debris removal following
0
50
100
150
200
250
108
132
240
87
71
158
108
41
149
87
26
113
89
132
221
71
71
142
89
41
130
71
26
97
54
132
186
44
71
115
54
41
95
44
26
70
Single Family Detached
CSDCSD – Conventional Suburban DevelopmentTOD – Transit Oriented Development
Mill
ion
BTU
Per Y
ear
TOD CSD TOD CSD TOD
Single Family Attached
Multi-Family
■ Transportation Energy Use■ With Green Automobiles
■ Home Energy Use■ With Green Buildings
Location Effi ciency and Housing Type: A Comparison of Energy Usage
A “Deep Energy Retrofi t” for Public Housing in Boston
The cost of utilities and energy effi ciency are a component of housing affordability (see the 2008 State of Metropolitan Housing Report). As energy costs rise, some affordable housing providers are taking action. Boston’s public housing authority assembled funding from over a dozen entities at the local, state, and federal level for a “Deep Energy Retrofi t” of the Castle Square Apartments. The 1960s-era mid-rise building includes 192 public housing units, and is being retrofi tted to provide a 50 to 70 percent reduction in energy use. The goal of the project is to cut energy use by 72 percent, reduce residents’ energy bills, and reduce the building’s carbon footprint. It will also add a retail component and a community center to the development. The project is 100 percent funded by grants, loans, the Low-Income Housing Tax Credit (LIHTC) program, and some owner equity (including partial funding from federal stimulus dollars). Operational costs will be less vulnerable to spikes in energy costs, providing more stability and predictability in preserving affordability. The units will then be more affordable to operate and maintain over the long-term. The project also provides an example of reuse and retrofi t in providing affordable housing that offers access to amenities and transportation options in an urban area, thereby keeping auto emissions low while also reducing the building’s carbon footprint (Frey, 2011).
7 Continued on next page
www.metropolitanhousing.org 2

demolition can produce lead dust fall as high as during demolition itself. In some cases, older homes are demolished and the debris pushed into the basement of the home and covered over, leaving the burden of lead and other building materials and contaminants buried on the property for future owners or developers.
Brownfi elds are a special vacant or under-utilized property problem that carry the additional stigma of perceived and real contamination from previous uses. Neighborhoods in or near former industrial areas all over the country are contending with assessment and clean-up of these areas. While some have focused on maintaining the industrial use of former brownfi elds, others have succeeded in reusing brownfi elds for housing. An example of this in Louisville is the development at Shipp and 7th Street, a 42-acre brownfi eld upon which student housing for the University of Louisville was built. The area was assessed, cleaned and contaminants were contained with a vapor intrusion barrier. Another example is Rowan Place at 2132 Rowan St. The former Distler Warehouse, when remediated, became 42 affordable senior housing units (Pike, 2003). One area in Louisville that is the focus of Louisville Metro’s Brownfi elds Assessment grants is the Park Hill Corridor, roughly from Broadway to Algonquin, and 7th to 22nd streets. The city has adopted an economic development implementation plan that will help address many of the vacant and under-utilized properties in the corridor. The city has the opportunity to incorporate clean industry and a mixed use of housing and retail in the corridor (see Norton, 2005 for more information about redeveloping brownfi elds sites for affordable housing).
ENVIRONMENTAL JUSTICE
Environmental justice refers to remedying the uneven distribution of environmental harms and environmental benefi ts across populations based on race, ethnicity, class or other salient social categories. Executive Order No. 12898 signed in 1994 by President Clinton requires federal agencies to include “achieving environmental justice as part of [their] mission” and both identify and address uneven distributions across minority or low-income populations (Executive Order 12898). Research over the past 30 years has found that environmental harms and benefi ts are indeed unevenly distributed in the U.S. by race, ethnicity and class under a variety of contexts and geographies. Causes for the uneven distribution have been attributed directly to environmental racism and classism, but also indirectly through land use decisions, industry siting decisions, zoning decisions, economic development efforts, and even individuals’ choice to locate near job development (Lester, Allen, and Hill, 2001). Equitable access
to environmental benefi ts and protection from uneven distribution of the effects of environmental harm are directly connected to how a community plans and builds.
Access to Environmental Benefi ts: Greenspace and Trees
Access to greenspace is of vital concern to the health of neighborhoods and the people that live in them. Greenspaces include parks, trails, and undeveloped areas. These greenspaces, including tree cover in residential yards, provide valuable environmental services such as removing air pollutants (Zeigler, 1973), improving water quality and reducing stormwater runoff (Sanders, 1986), and mitigating the urban heat island effect (Akbari, 1992; Heisler, 1986). Human health benefi ts have also been associated with access to greenspace. Access to close recreational facilities was shown to increase physical activity by 48 percent (Gies, 2006) and can also reduce stress levels and healing times and improve the symptoms of Attention Defi cit Disorder (Lasley, 2008). Greenspaces also encourage community cohesion and increase quality of life. In addition, parks increase property values which, in turn, increase tax revenues (Crompton, 2001).
Access to environmental benefi ts in the form of greenspace and tree canopy is unevenly distributed in Louisville Metro. Using 2000 U.S. Census data, Lasley (2008) found that, in Louisville Metro, minority areas had a median park size of 3.61 acres while parks in predominantly white areas have a median park size of 24 acres. Her evaluation of the planned improvements to the park system through the City of Parks revealed that it includes many additional acres of park being added to predominantly white areas, while minority areas will have improvements to or restoration of sports facilities but no additional park acres. In addition, a study examining tree cover and soil contamination in 10 Louisville Metro Council districts (Scroggins, 2011) found that west end neighborhoods (where most of the subsidized housing is concentrated) such as the Portland/Shawnee and Park Duvalle/Algonquin areas, had two of the four lowest tree cover percentages (see Our Trees and Soils: Local Research, page 8).
Exposure to Environmental Harms: Air, Water, and Soil
Minority/low-income neighborhoods are more likely to be located near pollution sources, contaminated sites, and industrial facilities, increasing the health risks for residents. For example, in 2000, over 32 percent of the industrial land uses in Louisville Metro were located in minority census blocks (Lasley, 2008). Proximity to industrial land uses can result not only in environmental harms such
7 Continued from previous page
3 2011 State of Metropolitan Housing Report

in low-income neighborhoods (Metropolitan Housing Coalition, 2005), we can expect differential effects to PM2.5 exposure across our community.
Louisville’s problems with toxic air emissions are also complex. For years communities around the country have attempted to document toxic emissions and hold the emitters accountable. Since 2005, the APCD has in place one tool to address toxic emissions, the Strategic Toxic Air Reduction Program (STAR) (APCD, 2011). Even with this package of regulations and monitoring stations, it is diffi cult to document the exact source of certain air toxins. To complicate matters further, even if the overall measures of a particular toxic emission are within a “normal” range over a period of time, on days when there is a “spike” there are immediate negative impacts on residents of vulnerable communities who are exposed to the “spike.” Attempts to document and remedy the disproportionate impact of toxic air emissions on residents near Rubbertown have met with uneven results. Most recently, the settlement of the Rubbertown neighbors’ lawsuit against Zeon resulted in the loss of rights to sue the company for damages for residents who did not opt out of the negotiated settlement (Bruggers, 2011).
A recent study by the R.J. Lee Group for Louisville Gas and Electric (LG&E) examined surface dust particles found on homes near LG&E’s Cane Run power plant. The study was conducted in response to residents’ complaints. The study found signifi cant amounts of fl y ash and bottom ash on the homes, although the distribution was uneven and the results should be considered only an indicator of a potential hazard, requiring further research (R.J. Lee Group, 2011).
Water
Much of Louisville’s affordable housing is concentrated in west Louisville which lies along the curve of the Ohio River. This area was highly impacted by the 1937 fl ood (see map on page 6). Historically, stormwater control focused on moving water off of properties as quickly as possible. However, this created water control and quality issues at the larger watershed scale (U.S. Environmental Protection Agency [EPA], 2005). The management of stormwater fl ooding requires a comprehensive, community-wide approach. Due to the high percentage of impervious surfaces in most affordable housing areas, runoff during rain events is a common cause of fl ooding. Redevelopment of existing impervious surface sites prevents the addition of new impervious surfaces while bringing the associated benefi ts of development (EPA, 2004). In addition, brownfi elds can become sources of water mitigation with
as toxic releases in to the air, soil, and water, but also exposure to truck exhaust and road dust, emissions from stationary construction equipment, unwanted smells, and other quality-of-life and health concerns. When considering the disproportionate effects of these environmental factors on nearby residents, asthma hospitalization rates have been closely associated with the distribution of poverty, proportion of minority residents, and educational attainment (Jones et al., 2004). Nationally, rates for hospitalization for asthma are three times higher for African-Americans than for Caucasians. In Louisville Metro, of the 13 zip codes exceeding the average rate of hospital asthma discharges, 10 were adjacent and roughly corresponded to the zip codes with the highest concentrations of subsidized housing.
Air Pollution
Understanding the intersection between air pollution and housing location is complex. Many air contaminants are not considered “local,” meaning they disperse and do not concentrate in small geographic areas unevenly, while others are considered local and deposit on the ground in concentrated manners or linger in the air in “clouds.” The Louisville area must contend with both types of pollutants because of our geographic location in the Ohio Valley, the number of coal-fi red power plants in close proximity, and the number and types of chemical and other industry in our jurisdiction. We do, however, have a variety of mechanisms in place to monitor both localized and non-localized pollutants via the Louisville Metro Air Pollution Control District (APCD).
The connection between housing affordability and location to non-local pollutants can be seen when we examine particulate matter less than 2.5 μ (PM2.5). PM2.5 is a fi ne particulate that is inhaled and has extremely negative impacts on health, including: premature death, lung cancer, exacerbation of respiratory and cardiovascular disease, and increased risks for cardiovascular morbidity (Centers for Disease Control and Prevention [CDC], 2011). In 2005, Jefferson County was included in an area of non-attainment for PM2.5. In many instances, air contaminants such as PM2.5 are not concentrated by neighborhood in a community such as Louisville. The non-attainment designation means the level of PM2.5 is unacceptable for all residents. However, the residents who are in areas with already poor indoor air quality, or who have higher instances of lead exposure, poor access to health care services and poor access to clean outdoor green space, are more susceptible to the chronic negative health effects of being exposed to PM2.5. Their reactions to the exposure are more severe. The elderly and very young are at highest risk to the effects of air pollution. In addition, exposure to PM2.5 exacerbates asthma (CDC, 2011). Given that the asthma hospitalization rate in Louisville Metro is highest 7 Continued on next page
www.metropolitanhousing.org 4

Source: Center for Neighborhood Technology, Housing +Transportation Affordability Index, Greenhouse Gas Impacts: http://htaindex.cnt.org/
7 Continued from previous page
Carbon Dioxide Emissions and Housing Location in the Louisville RegionThe Center for Neighborhood Technology (CNT) has developed a series of interactive maps that examine the relationship between housing and transportation. Last year’s State of Metropolitan Housing Report showed maps that compared the cost of housing in the Louisville area with the cost of housing plus the cost when transportation was factored in. CNT’s interactive mapping system also allows for other comparisons related to transportation and housing cost, such as the environmental costs of automobile use. The two maps below compare the carbon dioxide (CO2) emissions per acre to CO2 emissions per household. This comparison is useful because it shows that homes in denser, urban areas are more “location effi cient” in that they produce far less CO2 per household than those located in outlying areas. The difference is striking, demonstrating how many more pollutants are released into the air in the Louisville area due to low-density auto-dependent development patterns in suburban and rural areas when compared to higher-density development in more urban areas.
the development of gardens which retain water and reduce runoff. These gardens can also be used to remediate contaminated soils by using plants that specifi cally retain and eliminate heavy metals and other contaminants (Langley-Turnbaugh, 2007).
The Metropolitan Sewer District (MSD) in Louisville submitted the Integrated Overfl ow Abatement Program (IOAP) to the EPA in 2008-2009 in order to comply with EPA-mandated consent decrees. This program was founded by the Wet Weather Team which was made up of community representatives, elected offi cials, and MSD personnel.
Before 2005, MSD had already reduced sewer overfl ow points by 300, separated 66,000 linear feet of combined sewers, eliminated 40,000 septic tanks, and expanded water quality treatment centers. The IOAP will continue this work with the goal of capturing 96 percent of overfl ow from combined sewer overfl ow, with a reduction of 290 million gallons of overfl ow from sanitary sewer overfl ows. In addition, MSD provides recommendations to customers that can help reduce fl ooding and water quality issues. For example, MSD encourages the removal of non-essential clean water connections such as gutters and down spouts. These can then be affi xed to a rain barrel, which reduces water runoff and provides water for lawns and plants.
Total Carbon Dioxide (CO2) Emissions are calculated for the Block Group and then divided by the total area of the Block Group, which shows that areas with higher Residential Density tend to produce more carbon dioxide per acre.
Total Carbon Dioxide (CO2) Emissions are calculated for the Block Group and then divided by the total number of households in the Block Group, which shows that areas with higher Residential Density have low average emissions per household. Comparing this fi gure with CO2 per Acre from Household Auto Use illustrates that location effi ciency reduces per household emissions.
CO2 per Acre from Household Auto Use CO2 per Household from Household Auto Use Data Not Available Less than 6 Metric Tons/Acre 6 to 14 Metric Tons/Acre
Data Not Available Less than 3.3 Metric Tons/HH 3.3 to 5.1 Metric Tons/HH
14 to 20 Metric Tons/Acre 20 to 30 Metric Tons/Acre 30 Metric Tons/Acre and Greater
5.1 to 6.5 Metric Tons/HH 6.5 to 8.6 Metric Tons/HH 8.6 Metric Tons/HH and Greater
5 2011 State of Metropolitan Housing Report

Other possible water mitigation techniques include maintaining and growing the tree canopy in neighborhoods. The EPA found that in South Miami, runoff was reduced by 15 percent by the existing tree canopy (EPA, 2005). The EPA’s Best Management Practices (2005) also suggests that residents refrain from using the dishwasher or washing machine during rain events as this clean water waste contributes to sewer overfl ow.
second, highlighting that although soil contamination is concentrated in certain areas, the problem is widespread (see Our Trees and Soils: Local Research, page 8). Heavy metal contamination in soils can lead to human health concerns such as neurological damage and anemia, particularly for children.
Inequities related to environmental issues have led to some powerful coalitions of residents, environmental groups, and local schools across the country (Arnold and Norton, 2010). In Louisville, Rubbertown Emergency Action (REACT), Kentuckians for the Commonwealth, Kentucky Resources Council, Kentucky Conservation Committee, the Sierra Club, among others, have all been involved in bringing attention to environmental protection in our region. There is ample opportunity for organizations to move Louisville forward in linking safe and affordable housing to environmental benefi ts and protections within the framework of sustainability that links social equity, environmental protection, and economic well-being.
Re-imagining a More Sustainable ClevelandRe-imagining a More Sustainable Cleveland is the product of a 30-member working group convened by Neighborhood Progress, Inc., the city of Cleveland and Kent State University’s Cleveland Urban Design Collaborative. This report examined ways in which Cleveland could utilize excess land to advance a more sustainable Cleveland, improve the quality of life of the residents and help address climate change, which includes changes in precipitation and fl ood regimes. The report suggested using vacant land to restore ecosystems that provide water retention. Using trees to reduce stormwater runoff can reduce infrastructure costs and improve water quality. In addition, the report encourages the city to continue the mow-to-own program, which allows residents who maintain adjacent vacant properties to be granted title to them. This increases the number of vacant lots providing water mitigation and also increases property values for the whole neighborhood. These maintained lots can then be used for bio- and phytoremediation (the use of plants and trees to remove or neutralize contaminants, as in polluted soil or water) which require reduced runoff to be effective. This report also included specifi c recommendations for watersheds in the Cleveland area, including instituting 1) Riparian Corridor Areas which buffer waterways from excess runoff as well as remediating contaminants and 2) Headwaters Area to provide wetland or other water collection facilities to reduce fl ooding events.
Floodplains and Floodingin Louisville Metro
Streams and Rivers Floodplains (subject to fl ooding) Area Outside Floodplains Approximate Area of 1937 Flood Ohio River Floodwall
AA Floodwall Pumping Stations
Soil
As the current and earlier State of Metropolitan Housing Reports have documented, the Louisville Metro population is concentrated geographically by race and poverty; in addition, those populations are more likely to live in older housing stock, be exposed to lead and asbestos due to the typical age of the residential units in those areas, have a higher risk of being exposed to the environmental effects of vacant properties, and be in areas with lower air quality (see the 2008, 2009, and 2010 State of Metropolitan Housing Reports). While all urban residential yards are likely to have a certain level of lead due to the use of leaded gasoline in recent history, as well as leaded paint and pipes in houses built prior to 1978, Scroggin’s (2009) research found that the Portland/Shawnee (Metro Council district 5) and Shively/Park DuValle/Algonquin (Metro Council district 3) neighborhoods were the fi rst and third highest for heavy metal soil contamination in the study, respectively. The Highlands (Metro Council district 8) came in
Data provided by LOJIC and U.S. Army Corps of Engineers.
www.metropolitanhousing.org 6

As far back as 1918, Louisville’s Rubbertown has been the site for petrochemical manufacturing with refi neries producing gasoline, kerosene, fuel, oil, naphtha and petroleum coke (West Jefferson County Community Task Force [WJCCTF], 2011). During World War II, the complex of manufacturing sites expanded to produce synthetic rubber for the war effort (Hanchette et al., 2011). Over the years, many of these sites have changed hands but the complex is still home to 11 large chemical plants and is the Louisville area’s largest source of industrial emissions (WJCCTF, 2011).
In 2002, the EPA ranked Louisville-Jefferson County fi rst among 736 counties in the Southeast for health risks associated with air pollution (Bruggers, 2003). Analysis of asthma rates found a well-defi ned cluster of high rates of childhood asthma centered in west Louisville, particularly the Rubbertown area (Hanchette et al., 2011). A report by the Department of Health and Human Services suggested that due to children’s lower body weight and higher rate of inhalation during play, children are at greater risk from exposure to certain types of pollution (Agency for Toxic Substances and Disease Registry, 2006). This report goes on to state that exposure to the pollutants present in Rubbertown may lead to an increased cancer risk.
Such issues have long concerned the residents of the neighborhoods adjacent to Rubbertown. As a result of these concerns, the grassroots organization REACT (Rubbertown Emergency Action) was founded in 2003 to address issues of environmental justice in the Rubbertown area. REACT seeks to enact strong laws to stop air pollution from chemical plants, protect residents in the event of an emergency, and encourage
the full disclosure of information on the impacts of Rubbertown plants on residents (Cochran, 2011). Eboni Neal Cochran has been involved with REACT since shortly after its inception in 2003. While working to hold companies accountable, her main goal is “increased quality of life” for the residents of the Rubbertown area. REACT seeks to encourage homeowner buy-out by local industries, the use of safer chemical alternatives, and the enforcement of current environmental policy.
The environmental justice movement has been traced back to at least 1978 in Warren County, North Carolina, where residents began protesting a polychlorinated biphenyl (PCB) dump (Brown, 1995). This movement grew due to the acknowledgement of the disproportionate presence of potentially harmful facilities in minority/low-income neighborhoods (Hanchette et al., 2011). A 1987 study by the Commission for Racial Justice of the United Church of Christ found that communities with the highest percentage of minorities also were the most likely to be located near toxic waste facilities. Robert D. Bullard began documenting the uneven distribution of solid waste disposal facilities in Houston, Texas, in 1979 and has continued to produce evidence that shows that minority and poor communities bear a disproportionate amount of environmental risks and actual harms and are less likely to have access to environmental benefi ts (Bullard 2000; Bullard, Johnson, and Torres, 2000; Bullard, 2007). As long as such inequities exist, grassroots community-based organizations such as REACT will work to get justice for disadvantaged residents. Strong community cohesion and a history of civil rights traditions (Brown, 1995) in such minority neighborhoods will be a driving force in the future of environmental justice.
Rubbertown Emergency Action (REACT): Working for Environmental Justice in Louisville
7 2011 State of Metropolitan Housing Report

TITLE LINE
Neighborhoods are not only composed of built structures, such as houses, streets, and sidewalks, but are also surrounded by a living, green environment – trees, lawns, and gardens. Trees in residential areas provide valuable services by decreasing the energy used to heat and cool homes, removing air pollutants, improving water quality, and decreasing stormwater runoff into streams (Ziegler, 1973; Rolfe, 1974; Heisler, 1986; Sanders, 1986; Akbari et al, 1992). Underlying the green environment are soils that nurture the plants that beautify our homes and streets. Unfortunately, the soil in people’s yards may contain dangerous heavy metals, such as lead, nickel, cadmium, and zinc. In small amounts, some of these metallic elements are needed to maintain human health, but in larger amounts, many of these heavy metals, particularly lead, can cause serious health problems like anemia and neurological damage, especially in young children (Miller, 2005). Sources of these materials in residential yards include the underlying rock and materials used in the home itself (e.g., lead-based paint, pesticides). Neighborhoods that are closer to interstates, busy streets, and power plants also receive deposits of airborne heavy metals from coal combustion (Pouyat and McDonnell, 1991; Manta et al, 2002) and in the past from leaded gasoline.
In the summer of 2008, as a member of Dr. Margaret Carreiro’s lab at the University of Louisville, I conducted research on trees and soils in the residential areas of 10 Louisville Metro Council districts in partial fulfi llment of a master’s of science degree. The tree study was funded by the Kentucky Division of Forestry and was done in partnership with Jefferson County Public Schools and Metro Parks. A grant from the Commission on Diversity and Racial Equality (CODRE) at the University of Louisville funded analysis of soil heavy metal concentrations. One purpose of the study was to determine how trees were distributed in neighborhoods and how much benefi t residents in these areas were receiving from these trees. Another objective of the study was to collect and analyze soil samples to discover heavy metal levels in individual yards as well as to compare these values in the different council districts. Two of the research council districts fell, at least in part, in west Louisville. Metro Council district 5 is completely within the boundaries of West Louisville and contains the Portland and Shawnee neighborhoods. The northern part of Metro Council district 3 includes the Park DuValle and Algonquin neighborhoods, although the bulk of the district encompasses Shively.
The collected tree data were submitted to the U.S. Forest Service and analyzed by their Urban Forest Effects (UFORE) model. The results revealed that the Portland/Shawnee area had the second lowest tree cover (20.2 percent), and Metro Council district 3 the fourth lowest (23.6 percent), of the 10 council districts studied. Portland/Shawnee also had the third lowest amount of area to plant trees (15.8 percent). This means that there is limited opportunity, at least in residential yards, to plant more trees and increase the valuable services that trees provide to the residents of this part of west Louisville.
Soil samples were submitted for analysis to the University of Kentucky, Division of Regulatory Services. Total heavy metal values and specifi cally lead levels in yard soils were highest in Portland/Shawnee and third highest in Metro Council district 3 (Shively, Park DuValle, Algonquin). Metro Council district 8 (the Highlands) had the second highest total heavy metal and lead values of the 10 council districts studied. Heavy metal contamination in soils is of concern due to the potential for these metals to harm human health. Plants can take up many of these heavy metals from soil and concentrate them in their leaves and stems and humans are exposed to these heavy metals when they consume contaminated fruits and vegetables (Chaney et al, 1984). Lead is a heavy metal of special concern because it can cause neurological damage and anemia, with young children being the most vulnerable to its effects (Miller, 2005). Lead exposure occurs primarily via contact with or inhalation/ingestion of contaminated soil (Finster et al, 2004; Clark et al, 2008). Exposure to these heavy metals is of great concern in light of the increased interest in urban agriculture and underlines the importance of testing soils for heavy metal concentrations before growing food for human consumption.
Our Trees and Soils: Local ResearchShannon A. Scroggins, University of Louisville
Th ll d d b i d h U S F S i
www.metropolitanhousing.org 8

TITLE LINECONCLUSIONS AND RECOMMENDATIONS
Louisville Metro has the opportunity to address the uneven distributions of environmental harms and benefi ts as the city begins to tackle the implementation of its climate action plan and develop a more sustainable city. Louisville faces vacant land problems that affect residential, commercial and industrial properties. Because Louisville is an urban area, all of our soil is suspect for heavy metals, especially lead. Louisville’s air quality does not meet safe health standards for PM2.5 and other pollutants. Local industries continue to emit toxic chemicals into the air. Our waterways are polluted and we have experienced a range of problems as a result of frequent fl ooding. Our utility costs continue to increase dramatically. CO2 emissions from all sectors are high. These environmental harms are of concern to our entire community, but the risks and negative impacts of these harms are unevenly distributed across Louisville Metro.
Recent examples of steps Louisville Metro Government has taken to improve the city’s environment and quality of life, include: creating Louisville’s climate action plan, appointing a new team leader for the city’s Vacant and Abandoned Property Initiative, obtaining several brownfi elds assessment grants and revolving loan programs for clean-up, maintaining the APCD’s STAR program and implementing an anti-idling policy, supporting MSD’s innovative use of green infrastructure and storm-water mitigation technology, increasing the number and acreage of parks and green spaces through the “City of Parks” and other programs, and the creation of an offi ce of sustainability. The community as a whole benefi ts from each of these actions, although there are pockets of the community that do not.
Sustainable development requires policies that address environmental protection, social equity, and economic well-being for all members of the community. This means policies that, through a combination of regulation, incentives, stiff penalties, and education, support the following:
• Adopting a land development plan and code that protects natural resources in concert with the creation of affordable housing.
• Holding local polluters accountable in a meaningful way.
• Cooperation with regional air quality improvement efforts to address pollutants such as PM2.5 .
• Adequate remedies for residents located in close proximity to high-risk polluting industry.
• A robust vacant property program in which residents are full participants.
• A city-wide heavy metal soil testing and education program for public and private properties.
• Grants and low-interest loans to retrofi t existing affordable housing for energy effi ciency.
• Investment in protecting and expanding the urban tree canopy.
• Incentives for truly green employers to locate in areas in need of economic development.
• Forums for brownfi eld assessments and cleanups to educate vacant and under-utilized land owners about opportunities to improve their property.
• Equitable planning and development of parks and greenspace.
• Making environmental justice part of the mission of all city agencies, mirroring the Presidential Executive Order 12898, by identifying and addressing the uneven distribution of environmental harms and access to environmental benefi ts across our community.
9 2011 State of Metropolitan Housing Report
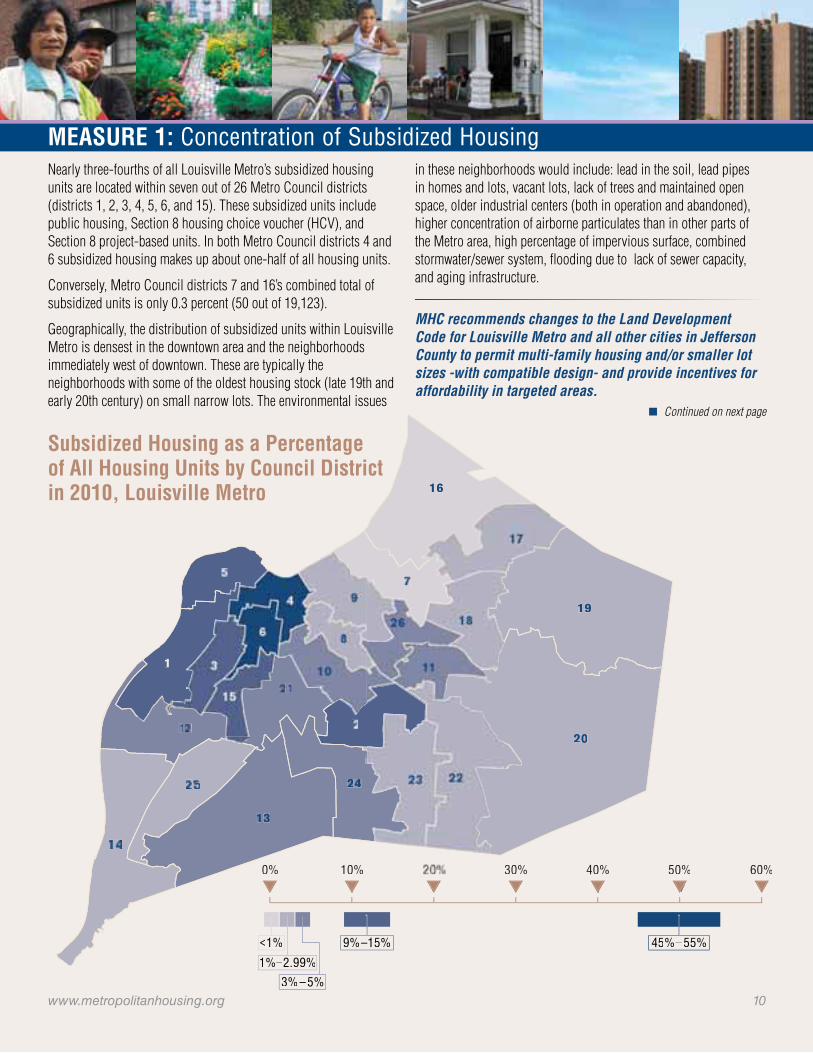
TITLE LINENearly three-fourths of all Louisville Metro’s subsidized housing units are located within seven out of 26 Metro Council districts (districts 1, 2, 3, 4, 5, 6, and 15). These subsidized units include public housing, Section 8 housing choice voucher (HCV), and Section 8 project-based units. In both Metro Council districts 4 and 6 subsidized housing makes up about one-half of all housing units.
Conversely, Metro Council districts 7 and 16’s combined total of subsidized units is only 0.3 percent (50 out of 19,123).
Geographically, the distribution of subsidized units within Louisville Metro is densest in the downtown area and the neighborhoods immediately west of downtown. These are typically the neighborhoods with some of the oldest housing stock (late 19th and early 20th century) on small narrow lots. The environmental issues
MEASURE 1: Concentration of Subsidized Housing
20
19
13
1
16
24
in these neighborhoods would include: lead in the soil, lead pipes in homes and lots, vacant lots, lack of trees and maintained open space, older industrial centers (both in operation and abandoned), higher concentration of airborne particulates than in other parts of the Metro area, high percentage of impervious surface, combined stormwater/sewer system, fl ooding due to lack of sewer capacity, and aging infrastructure.
MHC recommends changes to the Land Development Code for Louisville Metro and all other cities in Jefferson County to permit multi-family housing and/or smaller lot sizes -with compatible design- and provide incentives for affordability in targeted areas.
7 Continued on next page
0% 10% 30% 40% 50% 60%
<1% 9%–15% 45%–55%
1%–2.99%3%–5%
Subsidized Housing as a Percentage of All Housing Units by Council District in 2010, Louisville Metro
www.metropolitanhousing.org 10

MEASURE 1: Concentration of Subsidized Housing (continued)
2010 Subsidized Housing Units by Louisville Metro Council DistrictsLouisville MetroCouncil District
Total HousingUnits
Subsidized Housing UnitsTotal Subsidized Housing Units
Subsidized Housing aspercentage of Total Council
District HousingPublic Housing Section 8Voucher
Section 8Project Based
1 13,653 110 957 474 1,541 11%
2 13,248 25 904 475 1,404 11%
3 11,871 40 811 254 1,105 9%
4 9,175 2,267 821 1,309 4,397 48%
5 11,113 43 827 205 1,075 10%
6 5,429 876 644 1,407 2,927 54%
7 12,156 0 33 0 33 0%
8 13,435 0 67 103 170 1%
9 14,069 30 176 49 255 2%
10 12,542 153 233 28 414 3%
11 12,727 45 240 45 330 3%
12 13,243 0 333 0 333 3%
13 11,334 0 272 147 419 4%
14 11,747 0 191 10 201 2%
15 11,912 325 808 590 1,723 14%
16 14,682 0 17 0 17 0%
17 14,230 34 102 0 136 1%
18 12,967 6 15 184 205 2%
19 18,387 29 54 274 357 2%
20 16,243 0 64 24 88 1%
21 12,450 6 346 240 592 5%
22 17,541 21 149 12 182 1%
23 13,343 12 105 105 222 2%
24 13,403 46 417 0 463 3%
25 13,522 22 214 0 236 2%
26 11,739 22 122 154 298 3%
7 Continued from previous page
11 2011 State of Metropolitan Housing Report

TITLE LINEFor 2010, Louisville Metro continues to see high levels of segregation along economic, racial, and gender lines. Maps showing the concentration of poverty, black or African-American population, and single-parent female-headed households show not only high levels of segregation, but also that they all tend to be concentrated in the same areas of the county; areas that lack diversity and employment. The neighborhoods directly west of the downtown district have the highest concentrations of: poverty, single-parent female-headed households and black or African-American population. The southwestern areas of the county also have relatively high degrees of poverty and single-parent female-headed households.
Note: The Louisville MSA (Metropolitan Statistical Area) is defi ned as the 13-county area that makes up the Louisville region. The MSA includes 9 counties in Kentucky and 4 in southern Indiana. Louisville Metro refers only to Jefferson County.
ECONOMIC STATUS
In 2010, 15.3 percent of individuals in the Louisville MSA were below the poverty threshold (American Community Survey, 2010). Children were much more likely to be in poverty (22.4 percent of all children under age 18). Signifi cantly, 41.4 percent of female-headed families with related children under 18 were below the poverty threshold. In contrast, in married families with children under 18 only 6.7 percent were below the poverty threshold.
Of the little over one-half million households within the Louisville MSA, 38 percent of these households’ incomes were below the U.S. Department of Housing and Urban Development’s (HUD) low-income or poverty threshold. Within Louisville Metro, the greatest concentration of these households is west of an area roughly bounded by Interstate 65, with the highest concentration in neighborhoods directly west of the downtown district.
RACE/ETHNICITY
Black or African-Americans make up 20.6 percent of Louisville Metro’s population, compared to 15 percent in the Louisville MSA as a whole. In Louisville Metro, the black or African-American population is concentrated primarily in two areas of the county: directly west of the downtown district and in the center of the county just east of the airport. When examining the map showing the black or African-American population in Louisville Metro, the concentration is between roughly 50 and 98 percent of the population in these two areas of the county, which indicates high levels of racial segregation. Hispanics make up 4.4 percent of the population of Louisville Metro, compared to 3.9 percent of the population for the Louisville MSA.
In Louisville Metro, Hispanics are primarily concentrated in the south central portion of the county.
In Jefferson County, a comparison of race and population data from the 2010 and 2000 decennial Census fi nds the white alone population has decreased by one percent point (82.8 percent in 2000), while the black or African-American alone population decreased by two-tenths of a percent (13.9 percent in 2000). The numbers reported as being Hispanic or Latino however has more than tripled during the past decade (16,479 in 2000; 50,255 in 2010).
GENDER
Throughout the Louisville MSA, one-third of all family households with children under 18 are headed by females with no husband present. The median annual income for these families is $27,154, less than half of that for dual-parent families (at $56,788). In Louisville Metro, female-headed households make up 35 percent of all households. Their income is also less than half that of dual-parent families, at $26,947 and $57,028, respectively. The highest concentration of female-headed households in Louisville Metro is directly west of the downtown district, while they are moderately concentrated throughout the central and southwest portion of the county. For both the Louisville MSA and Jefferson County alone, only 8 percent of all family households with children under 18 are headed by a male with no wife present.
There is a dramatic difference in poverty between genders when comparing these same household types. Within the Louisville MSA, female heads of household, with no husband present, make up 56 percent of all families with children 18 and under, whose incomes are below the poverty level; in Louisville Metro, 59 percent are below the poverty level (this is a 2 percent drop since the 2000 Census). In contrast, 10 percent of all families with children under 18 are headed by males with no wife present in the Louisville MSA have incomes that are below the poverty level; for Louisville Metro it is 8 percent (a 2 percent increase since the 2000 Census).
MHC recommends:1. Make fair housing a priority in this city and metropolitan
region in the real estate, development and banking industries.
2. Enact Land Development Code changes focused on the development of design-compatible affordable housing, both rental and ownership in all areas of Louisville Metro.
3. Require fair housing education of all government offi cials reviewing development proposals.
MEASURE 2: Housing Segregation by Income, Race/Ethnicity, and Gender
7 Continued on next page
www.metropolitanhousing.org 12

TITLE LINE
2010 Black or African American Population as Percent of Total by Block GroupJefferson County 2010 Census Block Groups
2010 Hispanic Population as Percent of Total by Block GroupJefferson County 2010 Census Block Groups
2005-2009 Estimated Percent of Population at or Below Poverty LevelJefferson County 2000 Census Tracts
Female Householder, No Husband Present, with Related Children Under 18 As Percent of All Families with Children Under 18Jefferson County 2010 Census Tracts
Source: 2010 Census Summary File 1
Source: 2010 Census Summary File 1
Source: 2005–2009 American Community Survey 5-year Estimates
0%–5% 5.1%–10% 10.1%–25%
25.1%–50% 50.1%–98.2%
0%–2% 2.1%–5% 5.1%–10%
10.1%–15% 15.1%–49.4%
0.8%–5% 5.1%–15% 15.1%–30%
30.1%–50% 50.1%–83.2%
0.8%–5% 5.1%–15% 15.1%–30%
30.1%–50% 50.1%–83.2%
Source: 2010 Census Summary File 1, Table P-39
7 Continued from previous page
MEASURE 2: Housing Segregation by Income, Race/Ethnicity, and Gender (continued)
13 2011 State of Metropolitan Housing Report

TITLE LINEThe FY2011 Fair Market Rents (FMR) by Unit Bedrooms established by HUD for the Louisville metropolitan area dipped slightly when compared to the FY2010 rates, yet the FMR for a two-bedroom unit is 5.3 percent higher than the FY2000 rates (adjusted for infl ation).
Within the Louisville MSA, renters comprise a little over a third of the total number of households. To afford a two-bedroom unit at FMR, a household would need an annual income of $27,760. However the estimated median income for renter households is $27,323; it would take 102 percent of a renter household earning the median income to live in a FMR two-bedroom unit. As a result, nearly half (48 percent) of renter households cannot afford a two-bedroom unit at FMR.
Finding and keeping a job continues to be problematic for many. As of July 2011, the unemployment rate for the Louisville MSA was 9.5 percent. Of the 22 major industry sectors in the Louisville MSA, six of these (comprising 28 percent of the total employment) have median annual incomes that fall below the annual income needed for a household to afford a two-bedroom rental unit at FMR. Most of these low-wage jobs are in the service industry: sales and sales-related jobs; food preparation and jobs related to serving; building
and grounds cleaning, maintenance; and healthcare support and personal care.
The burden placed on low-income renter households goes beyond rent payments. The cost of goods and services has risen 3.6 percent since June 2010 (Isidore, 2011). Gasoline prices are up 36 percent over this time period, as are other essentials such as groceries, home utility costs, and fuel oil (U.S. Bureau of Labor Statistics, 2011). In addition, the burden of health care costs as a percentage of family income is greater for families in the lowest-income quintile (20 percent of family income) than for families in all other quintiles (no more than 16 percent of family income) (Ketschel, P. et al., 2011).
MHC recommends that all economic or housing development projects supported by Louisville Metro government by any fi nancial vehicle must contain the creation or rehabilitation of housing affordable to those at 60 percent of median income. MHC also recommends fully funding the Louisville Affordable Housing Trust Fund.
MEASURE 3: Renters with Excessive Cost Burden
Fair Market Rents (FMR) by Unit Bedrooms, 2000-2011FMR Year Effi ciency One-Bedroom Two-Bedroom Three-Bedroom Four-Bedroom
FY 2000 $318 $408 $501 $691 $729
FY 2001 $323 $415 $510 $703 $741
FY 2002 $358 $460 $565 $779 $821
FY 2003 $368 $473 $581 $801 $845
FY 2004 $369 $475 $583 $804 $848
FY 2005 $400 $466 $553 $789 $826
FY 2006 $411 $473 $563 $785 $834
FY 2007 $426 $492 $584 $816 $867
FY 2008 $483 $559 $663 $926 $984
FY 2009 $496 $573 $680 $950 $1,009
FY 2010 $499 $577 $684 $956 $1,015
FY 2011 $506 $585 $694 $970 $1,030
% Change from FY2010-FY2011* -2.4% -2.4% -2.3% -2.3% -2.3%
% Change from FY2000-FY2011* 20.9% 9.0% 5.3% 6.7% 7.4%
*adjusted for infl ation
7 Continued on next page
Source: U.S. Department of Housing and Urban Development
www.metropolitanhousing.org 14
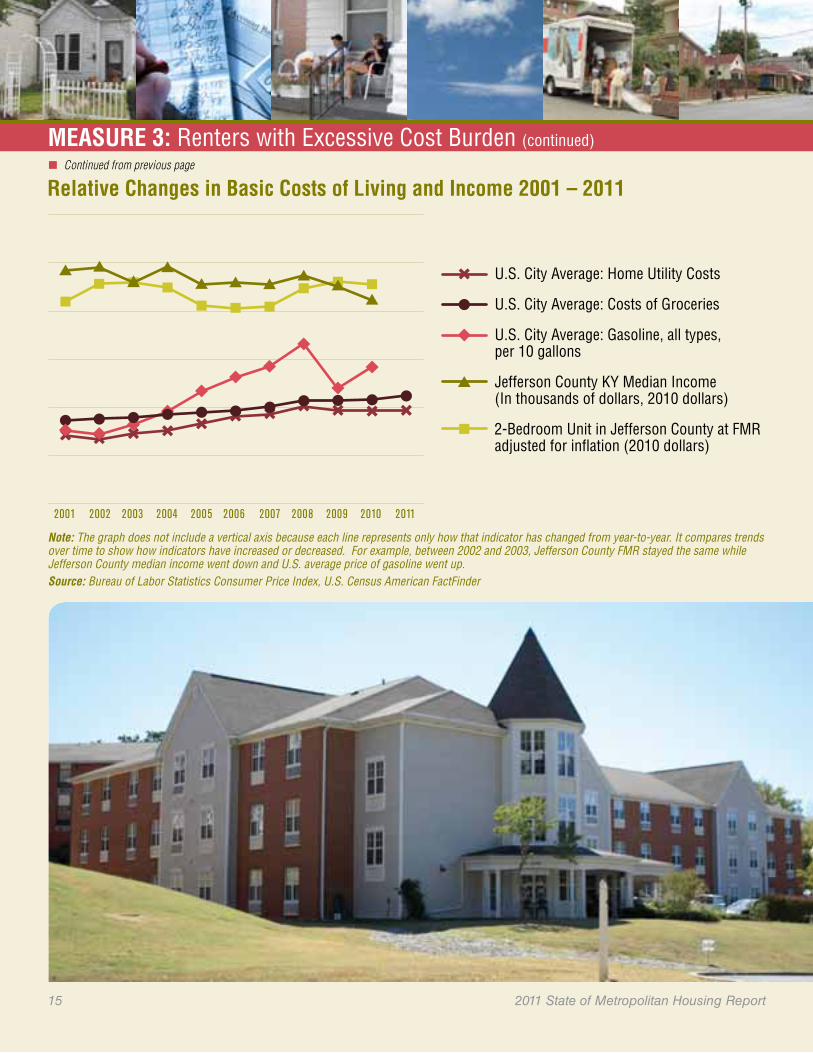
2001 2002 2003 2004 2005 2006 2007 2008 2009 2010 2011
U.S. City Average: Home Utility Costs
U.S. City Average: Costs of Groceries
U.S. City Average: Gasoline, all types, per 10 gallons
Jefferson County KY Median Income (In thousands of dollars, 2010 dollars)
2-Bedroom Unit in Jefferson County at FMR adjusted for inflation (2010 dollars)
Note: The graph does not include a vertical axis because each line represents only how that indicator has changed from year-to-year. It compares trends over time to show how indicators have increased or decreased. For example, between 2002 and 2003, Jefferson County FMR stayed the same while Jefferson County median income went down and U.S. average price of gasoline went up. Source: Bureau of Labor Statistics Consumer Price Index, U.S. Census American FactFinder
TITLE LINE
Relative Changes in Basic Costs of Living and Income 2001 – 2011
MEASURE 3: Renters with Excessive Cost Burden (continued)7 Continued from previous page
15 2011 State of Metropolitan Housing Report

TITLE LINEIn the last year, there has been a notable decrease (6 percent) in the number of affordable housing units in Louisville Metro. In the Indiana and Kentucky counties outside of Jefferson County that comprise the Louisville MSA, there has been an increase of subsidized units (5 percent and 6 percent respectively). However, when looking at the Louisville MSA as a whole, the number of affordable housing units has decreased overall by 3 percent.
In Louisville Metro, public housing units managed by the Louisville Metro Housing Authority (LMHA) dropped from 5,488 in 2010 to 4,825 in 2011; this loss of 663 units represents a 12 percent decrease in the total number of public housing units within the city. The razing of Iroquois Homes public housing units is a contributing factor. Tim Barry, LMHA’s Executive Director, asserts that the housing authority is committed to a one-for-one replacement of all razed public housing units, though it may take a while (Barry, 2011).
Within the Louisville MSA, but not including Jefferson County, the number of public housing units managed by the Eminence and Shelbyville housing authorities was unchanged (85 and 102 units respectively), yet the total number of units managed by the Bardstown Housing Authority fell from 199 to 192 (a 3.5 percent decrease). In the southern Indiana counties, there was no change from 2010 to 2011 in the number of public housing units in New Albany (1,085). In neighboring Clark County, the number of public housing units decreased from 631 in 2010, to 619 in 2011.
For Section 8, both housing choice vouchers and site-based units, the total number of units in Louisville Metro dropped from 16,083 in 2010 to 15,025 (a loss of 1,058 units). Yet for the other Kentucky and Indiana counties located within the Louisville MSA, there was an increase of 434 units reported (11 percent).
The number of families on both the public housing and Section 8 housing choice voucher (HCV) waiting lists illustrates the urgent need for more affordable housing options in the Louisville area. As of June 2011, there are 4,402 families on LMHA’s public housing waiting list and 15,785 families on the HCV waiting list (Louisville Metro Housing Authority [LMHA], 2011). This does not include the 4,257 families who are waiting for available units in Park DuValle and Liberty Green (the combined waiting list for Park DuValle Phases II, III, and VI has been closed since 2002) (LMHA, 2011). Together, these represent 24,394 families in Louisville Metro who are waiting (some for years) for either a public or HCV housing unit to become available. In other Kentucky counties within the MSA, there are 255 families on the Bardstown Housing Authority’s public housing waiting list and 50 families on the Section 8 HCV list in Eminence. In southern Indiana, New Albany’s housing authority has 100 families on the public housing waiting list while 188 families are waiting for Section 8 HCV. In Clark County, the housing authorities in Charlestown, Jeffersonville, and Sellersburg combined have 341 families on their public housing waiting list and 606 families on their Section 8 HCV waiting lists.
MHC recommends that the Louisville Metro Housing Authority review its policies to ensure that the trend over the last 10 years to decrease the number of family units and units for the disabled while increasing the units for those who are elderly does not violate fair housing laws protecting the households regardless of “familial status.” MHC recommends that the Louisville Metro Housing Authority restore the 5 percent of all Section 8 Voucher funds that have been diverted from serving households and put in the HOPE VI program for moderate-income housing.
MEASURE 4: Production and Rehabilitation of Affordable Housing
Number of Subsidized Rental Units, Louisville MSA by Program Type – Years 2010 and 2011
PUBLICHOUSING
SECTION 8:VOUCHERS AND
SITE-BASED
LOW INCOME HOUSING
TAX CREDITS
0 5,000 10,000 15,000 20,000 25,000
2011 1,704 389 4,825
2010 1,716 386 5,488
2011 2,488 1,943 15,025
2010 2,224 1,814 16,083
2011 1,271 1,483 5,742
2010 1,267 1,388 5,679
■ Indiana ■ Kentucky■ Louisville Metro
www.metropolitanhousing.org 16

Source: U.S. Census Bureau
TITLE LINEThe U.S. Census Bureau reported that in 2010 the homeownership rate in the Louisville MSA dropped to 63.4 percent, the lowest rate in fi ve years. This represents a decrease of 4.3 percent since 2009, and marks the second consecutive year the rate has decreased. The homeownership rate is now 6.9 percent lower than in 2003, when the State of Metropolitan Housing Report fi rst began tracking these numbers. While there may be a number of reasons for this decrease, tighter mortgage lending restrictions and persistently high rates of foreclosure (see Measures 6 and 7 in this report) may be contributing factors.
From 2009 to 2010, homeownership rates in the U.S. decreased to a greater degree for black or African-Americans and Hispanics than for whites. Homeownership rates declined 4.2 percent for African-Americans, 3.3 percent for Hispanics, and 0.8 percent for whites, with the overall homeownership rate for the U.S. decreasing 1.3 percent to 66.9 percent (U.S. Census Bureau, 2011).
HOMEOWNERSHIP AND WEALTH
While homeownership can be a means of wealth accumulation for households, renting a similar home and putting the savings into non-housing investments can just as often result in the same amount of wealth accumulation (Rappaport, 2010). However,
homeownership is a more important means of wealth accumulation for low-income and minority households. While higher-income households are often able to effectively build wealth through non-housing investments, non-housing wealth accumulation for low-income households is, at best, minor. In addition, many low-income and minority households do not move beyond fi rst-time homeownership, and minorities often return to renting after owning a home and do not “trade up” to higher-priced homes as often as non-minorities (Boehm and Schlottmann, 2008). The housing and foreclosure crisis has also had a disproportionate effect on minority homeowners, as both African-Americans and Hispanics are more likely to lose their home to foreclosure than whites, at 76 percent and 71 percent, respectively (Center for Responsible Lending, 2010).
MHC recommends advocacy to ensure that new provisions for homeownership require responsible lending but do not effectively create an absolute bar to minorities whose wealth has been decimated in the economic turndown. MHC also advocates for programs that focus on raising the value of homes in predominantly minority neighborhoods.
MEASURE 5: Homeownership Rate
60
65
70
75
70.3
2003 2004 2005 2006 2007 2008 2009 2010
67.5
62.9
66.467.2
67.9 67.7
63.4
Louisville MSA Homeownership Rate 2003-2010
17 2011 State of Metropolitan Housing Report
Mortgage Loan Scenario Comparison
Source: U.S. Census Bureau, Kentucky Association of Realtors
TITLE LINEBoth access to, and the affordability of, homeownership are diffi cult to defi ne and measure. In past years of the State of Metropolitan Housing Report, an index measuring the affordability of housing for fi rst-time homebuyers in the Louisville community has been included to illustrate both access and affordability. However, the housing landscape in Louisville, and across the country, has changed since the advent of the housing crisis. Homebuyers, fi rst-time or otherwise, face tighter lending restrictions in the form of higher credit score, income, and down payment requirements, which now prevent many households from obtaining mortgages they would have qualifi ed for before the housing market crash (Joint Center for Housing Studies of Harvard University, 2011). Thus, the First-Time Homebuyer Affordability Index no longer captures the whole picture when it comes to accessing and affording homeownership, and so we will not present it in this year’s report.
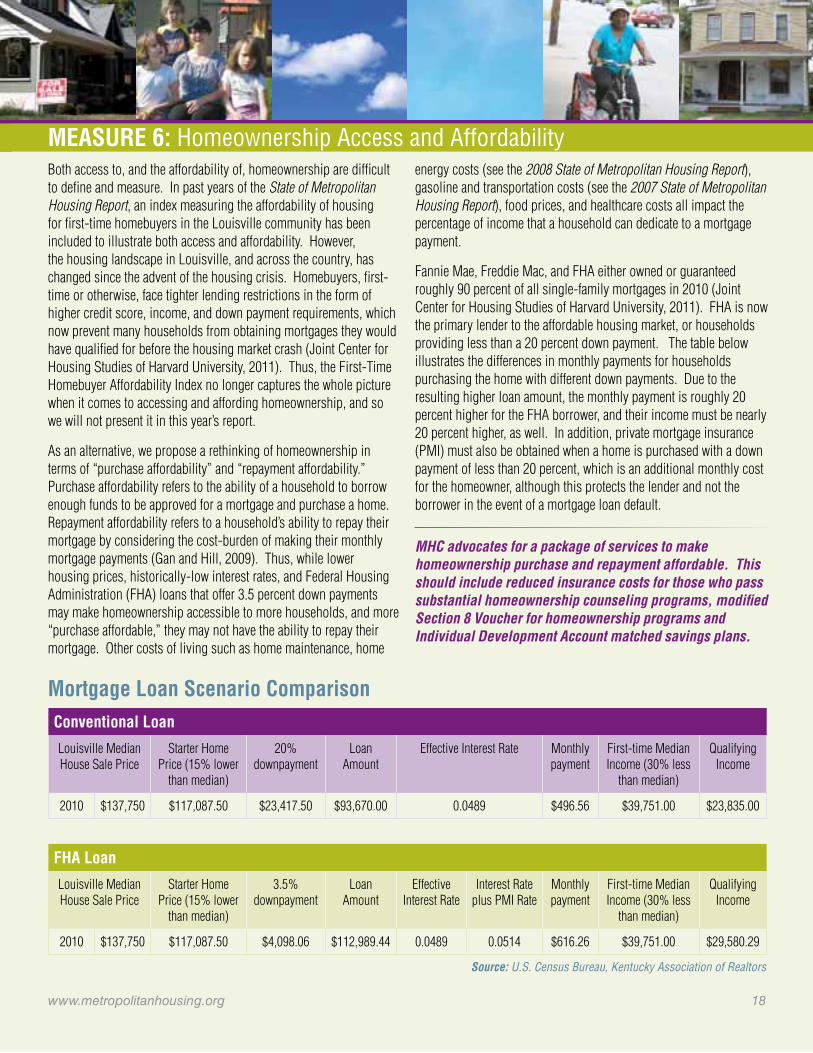
As an alternative, we propose a rethinking of homeownership in terms of “purchase affordability” and “repayment affordability.” Purchase affordability refers to the ability of a household to borrow enough funds to be approved for a mortgage and purchase a home. Repayment affordability refers to a household’s ability to repay their mortgage by considering the cost-burden of making their monthly mortgage payments (Gan and Hill, 2009). Thus, while lower housing prices, historically-low interest rates, and Federal Housing Administration (FHA) loans that offer 3.5 percent down payments may make homeownership accessible to more households, and more “purchase affordable,” they may not have the ability to repay their mortgage. Other costs of living such as home maintenance, home
energy costs (see the 2008 State of Metropolitan Housing Report), gasoline and transportation costs (see the 2007 State of Metropolitan Housing Report), food prices, and healthcare costs all impact the percentage of income that a household can dedicate to a mortgage payment.
Fannie Mae, Freddie Mac, and FHA either owned or guaranteed roughly 90 percent of all single-family mortgages in 2010 (Joint Center for Housing Studies of Harvard University, 2011). FHA is now the primary lender to the affordable housing market, or households providing less than a 20 percent down payment. The table below illustrates the differences in monthly payments for households purchasing the home with different down payments. Due to the resulting higher loan amount, the monthly payment is roughly 20 percent higher for the FHA borrower, and their income must be nearly 20 percent higher, as well. In addition, private mortgage insurance (PMI) must also be obtained when a home is purchased with a down payment of less than 20 percent, which is an additional monthly cost for the homeowner, although this protects the lender and not the borrower in the event of a mortgage loan default.
MHC advocates for a package of services to make homeownership purchase and repayment affordable. This should include reduced insurance costs for those who pass substantial homeownership counseling programs, modifi ed Section 8 Voucher for homeownership programs and Individual Development Account matched savings plans.
MEASURE 6: Homeownership Access and Affordability
Conventional Loan
Louisville Median House Sale Price
Starter Home Price (15% lower
than median)
20% downpayment
Loan Amount
Effective Interest Rate Monthly payment
First-time Median Income (30% less
than median)
Qualifying Income
2010 $137,750 $117,087.50 $23,417.50 $93,670.00 0.0489 $496.56 $39,751.00 $23,835.00
FHA Loan
Louisville Median House Sale Price
Starter Home Price (15% lower
than median)
3.5% downpayment
Loan Amount
Effective Interest Rate
Interest Rate plus PMI Rate
Monthly payment
First-time Median Income (30% less
than median)
Qualifying Income
2010 $137,750 $117,087.50 $4,098.06 $112,989.44 0.0489 0.0514 $616.26 $39,751.00 $29,580.29
www.metropolitanhousing.org 18

Homeowner Vacancy Rates 2005-20107 Louisville MSA 7 All MSAs in the U.S. 7 Louisville MSA 7 All MSAs in the U.S.Rental Unit Vacancy Rates 2005-2010
9.3 9.3 9.9 9.710.2 10.0
12.1
10.7
9.610.3
11.7
9.8
2005 2006 2007 2008 2009 2010
2.9
1.9
3.0
2.4 2.5
2.9
2.42.6
1.9
2.6
3.8
2.8
2005 2006 2007 2008 2009 2010Source: U.S. Census BureauSource: U.S. Census Bureau
TITLE LINEDuring 2010, the U.S. saw a total of 3,825,637 foreclosure fi lings on a record 2,871,891 properties. While this represents a decrease of 3 percent in the number of fi lings from 2009, it represents an increase of 2 percent in the number of properties receiving a foreclosure fi ling from the previous year. In 2010, 2.23 percent of all housing units (1 in 45) received at least one foreclosure fi ling, virtually unchanged from 2009 (RealtyTrac, 2011).
The Louisville MSA saw a total of 8,361 foreclosures in 2010, which represents an increase of 17 percent from 2009 and a 254 percent increase from 2002. In the Kentucky MSA counties (comprised of Louisville Metro and the adjacent counties in Kentucky) there were a total of 6,817 foreclosures ordered for sale, an increase of 15 percent from the previous year’s total. While foreclosure numbers were higher for every county in 2010 than in 2002 (except for Meade County), about half of the MSA Kentucky counties saw decreases in the number of foreclosures from the previous year. Jefferson and Nelson counties saw the greatest increases in 2010 at 21 percent and 22 percent, respectively. The greatest decreases were in Meade (19 percent) and Spencer (32 percent) counties, with Meade County’s numbers dropping to their lowest total since 2002, when the State of Metropolitan Housing Report began tracking foreclosures.
The Indiana counties in the Louisville MSA saw a total of 1,544 foreclosure fi lings in 2010, representing an increase of 29 percent from 2009, and 85 percent over 2002. Each of the four MSA counties in Indiana saw a decrease in the number of foreclosure fi lings for 2009, indicating that the rate of foreclosures is levelling off, but totals are still higher than they were earlier in the decade. Harrison, Clark, and Washington counties all saw increased fi lings
from 2009, while Floyd County saw a 5 percent decrease.
The Network Center for Community Change (2011) in Louisville investigated the impact of private collection of delinquent property taxes in Louisville Metro and found that in 2010 over 15,000 property owners did not pay taxes owed by April 15; about a third of those delinquencies were purchased by private parties for collection. This resulted in about 5,000 properties having a private lien complicating the title of the property. In addition, there were 187 foreclosures fi led due to delinquent property taxes.
HOUSING VACANCY RATES
In 2010, homeowner vacancy rates for the Louisville MSA dropped to 1.9 percent from 2.4 percent the previous year. When compared to the vacancy rate for all MSA’s as a whole, the rate for the Louisville area has remained below that of the rate of 2.6 percent for all MSA’s in the U.S. since 2008.
The Louisville MSA’s vacancy rate for rental units also decreased in 2010 to 9.6, a 2.5 percentage point drop from 12.1 percent in 2009. This represents a shift relative to the rental vacancy rates for all of the MSA’s in the U.S., as Louisville’s rate was above the U.S. MSA rate of 10.7 in 2009, but is now below the 2010 U.S. MSA rate of 10.3.
MHC recommends local control of collection of delinquent property taxes to ensure fair and equal treatment, community education of the “homestead exemption” for the elderly and disabled, allow work-outs and retain local tax income in local control.
MEASURE 7: Foreclosures
19 2011 State of Metropolitan Housing Report

County 2002 2003 2004 2005 2006 2007 2008 2009 2010
% Change from 2009 to 2010
% Change from 2002 to 2010
Bullitt 104 171 N/A 250 300 450 450 490 450 -8% 333%Jefferson 1,262 2,161 2,610 2,508 2,710 3,089 3,264 4,382 5,299 21% 320%Oldham 71 89 105 112 127 140 223 300 298 -1% 320%Henry/Trimble N/A N/A 116 81 108 120 158 114 128 12% 10%Nelson N/A N/A 125 125 156 178 162 194 236 22% 89%Shelby N/A 80 83 86 101 134 140 223 228 2% 185%Spencer N/A N/A N/A 30 46 76 78 115 93 -19% 210%Meade 90 72 92 102 89 134 120 125 85 -32% -6%Total 1,527 2,573 3,131 3,014 3,337 4,321 4,595 5,943 6,817 15% 346%
County 2002 2003 2004 2005 2006 2007 2008 2009 2010
% Change from 2009 to 2010
% Change from 2002 to 2010
Clark 369 385 429 455 621 655 642 509 750 47% 103%Floyd 253 212 323 304 379 341 424 395 375 -5% 48%Harrison 112 141 117 152 159 155 198 138 211 53% 88%Washington 102 123 119 90 166 186 174 157 208 32% 104%Total 836 861 988 1001 1,325 1,337 1,438 1,199 1,544 29% 85%
TITLE LINE
Source: U.S. Census Bureau
0
1,000
2,000
3,000
4,000
5,000
6,000
7,000
8,000
1,5271 527
838 861 988 1,0011,3251 325 1,3371 337 1,4381 438 1,199 1,5441 544
2,5732 5733,131 3,014 3,337
4,3214 321 4,5954 595
5,943
6,817
2002 2003 2004 2005 2006 2007 2008 2009 2010
Kentucky Counties
Indiana Counties
Number of Foreclosures 2002-2010Louisville MSA Counties
Kentucky Counties in the Louisville MSA
Indiana Counties in the Louisville MSA
*The terms fi led and ordered represent different stages of the foreclosure process. Filed refers to the fi ling of a property with the local County Recorder’s offi ce to say that a loan is delinquent, while ordered refers to the order to sell a property that is delinquent on a loan.
MEASURE 7: Foreclosures (continued)
www.metropolitanhousing.org 20
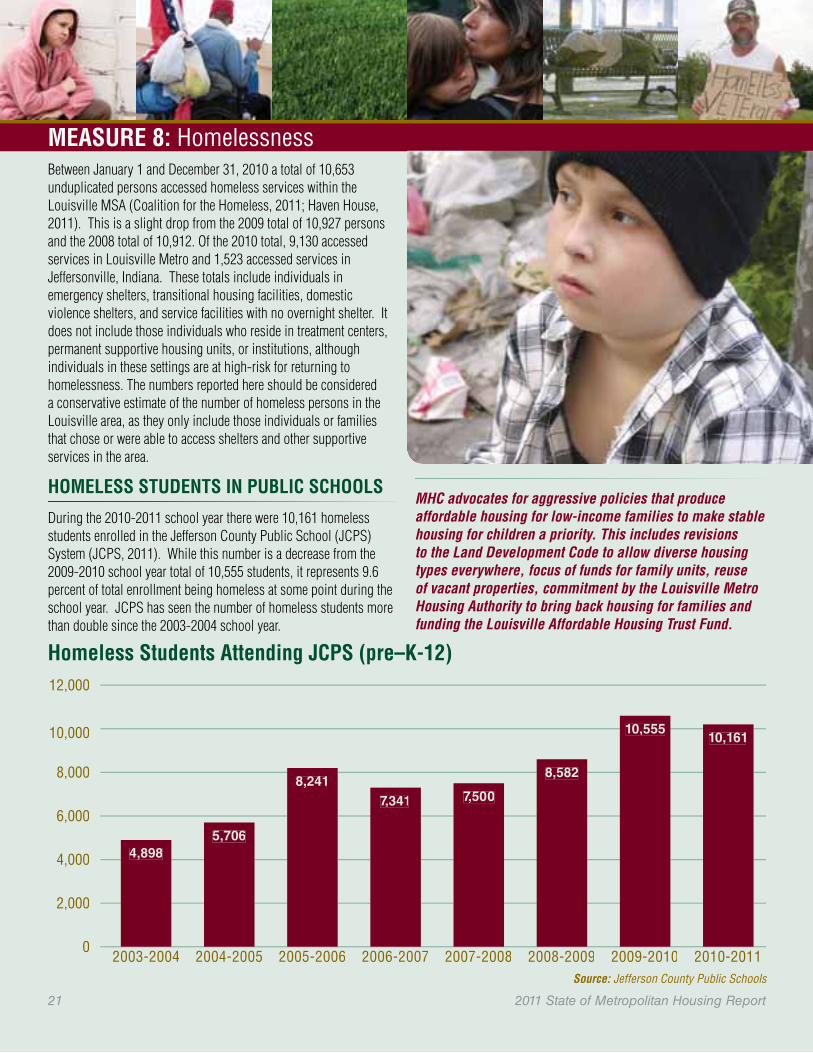
TITLE LINE
MHC advocates for aggressive policies that produce affordable housing for low-income families to make stable housing for children a priority. This includes revisions to the Land Development Code to allow diverse housing types everywhere, focus of funds for family units, reuse of vacant properties, commitment by the Louisville Metro Housing Authority to bring back housing for families and funding the Louisville Affordable Housing Trust Fund.
Between January 1 and December 31, 2010 a total of 10,653 unduplicated persons accessed homeless services within the Louisville MSA (Coalition for the Homeless, 2011; Haven House, 2011). This is a slight drop from the 2009 total of 10,927 persons and the 2008 total of 10,912. Of the 2010 total, 9,130 accessed services in Louisville Metro and 1,523 accessed services in Jeffersonville, Indiana. These totals include individuals in emergency shelters, transitional housing facilities, domestic violence shelters, and service facilities with no overnight shelter. It does not include those individuals who reside in treatment centers, permanent supportive housing units, or institutions, although individuals in these settings are at high-risk for returning to homelessness. The numbers reported here should be considered a conservative estimate of the number of homeless persons in the Louisville area, as they only include those individuals or families that chose or were able to access shelters and other supportive services in the area.
HOMELESS STUDENTS IN PUBLIC SCHOOLS
During the 2010-2011 school year there were 10,161 homeless students enrolled in the Jefferson County Public School (JCPS) System (JCPS, 2011). While this number is a decrease from the 2009-2010 school year total of 10,555 students, it represents 9.6 percent of total enrollment being homeless at some point during the school year. JCPS has seen the number of homeless students more than double since the 2003-2004 school year.
MEASURE 8: Homelessness
Source: Jefferson County Public Schools
0
2,000
4,000
6,000
8,000
10,000
12,000
4,8985,706
8,2417,341 7,500
8,582
10,55510,161
2003-2004 2004-2005 2005-2006 2006-2007 2007-2008 2008-2009 2009-2010 2010-2011
Homeless Students Attending JCPS (pre–K-12)
21 2011 State of Metropolitan Housing Report

TITLE LINECOMMUNITY DEVELOPMENT BLOCK GRANTS (CDBG)
The Community Development Block Grant (CDBG) program is administered by the U.S. Department of Housing and Urban Development (HUD) to provide funding to state and local governments to target a variety of community development initiatives, including the rehabilitation of affordable housing, improvement of public facilities, job growth, and economic development. The amount of funding each local or state government receives is calculated based on the area’s poverty, population, housing overcrowding, age of housing, and population growth lag in relationship to other metropolitan areas. Louisville Metro and New Albany, Indiana are “entitlement” communities, receiving CDBG funding annually. States also receive CDBG funds, which they distribute among entitlement and non-entitlement communities at their discretion.
For program year 2010, Louisville Metro spent a total of $14,289,260 on CDBG programs, slightly less than the total in 2009 of $14,657,811. Nearly a third of these funds (31 percent) were dedicated to housing programs such as residential repairs, emergency repairs, and weatherization. Eighteen percent was spent on public services, including improvements to streets, sidewalks, libraries, and parks. Other resources were dedicated to addressing vacant properties and maintenance, including the vacant lot program (9 percent), code enforcement (5 percent), and property demolition (4 percent). In addition, 4 percent was spent on economic development activities and 18 percent on administration and planning (Louisville Metro Department of Community Services and Revitalization, 2011).
The program year 2010 CDBG expenditures for New Albany, Indiana, totaled $394,204. Of this, 81 percent was allocated to housing programs such as rehabilitation, homeownership assistance, code enforcement, optional relocation, and property demolition and acquisition. The remaining 19 percent was allocated to public service programs.
HOME FUNDS
Louisville Metro receives federal funding annually from HUD’s HOME Investment Partnerships Program, which exclusively funds the purchase, construction, or rehabilitation of affordable housing for either rental or homeownership for low-income individuals and families. For program year 2010, Louisville spent $5,244,002
in HOME funds, which funded homebuyer assistance and rental programs, as well as new affordable housing construction. This total amount spent is substantially less than the total spent in 2009 of $9,732,765, although this number represents money spent that was carried over from previous funding years. Although New Albany, Indiana receives federal CDBG funding as an entitlement community, it does not receive HOME program funding.
CDBG-funded programs in Louisville Metro resulted in the rehabilitation of 644 homes and 7 rental developments, as well as 7,490 persons receiving education and counseling services and 79 persons receiving down payment assistance. In addition, HOME funds produced 32 new housing units in Louisville. Overall, about 23 percent of expected CDBG funds and 73 percent of HOME funds received were allocated toward programs focused on housing affordability during program year 2010 (Louisville Metro Department of Community Services and Revitalization, 2011).
MHC advocates that funds not be used for rental payments, but for creating affordable housing or for energy effi cient rehabilitation of existing rental or home owner units in low-income neighborhoods.
MEASURE 9: CDBG and HOME Funds
Public Services
11%Disposition(Vacant Lot Program)
9%
Code Enforcement
5% Housing31%
Administrativeand Planning
18%Public Improvements
18%
Economic Development
4%
Clearance(Property
Demolition)4%
Source: Louisville Metro Department of Community Services and Revitalization
Louisville Metro CDBG Expeditures 2010
www.metropolitanhousing.org 22

TITLE LINEMeasure 1: Concentration of
Subsidized Housing pg. 10Statistics on subsidized housing by Metro Council district were obtained by geocoding administrative data by street address and then capturing the data for each district. Subsidized housing units data were provided by the Louisville Metro Housing Authority and the Kentucky Housing Corporation. The Metro Council Districts layer and the Address Sites layer were provided by LOJIC (Louisville/Jefferson County Information Consortium).
Measure 2: Housing Segregation pg. 12The percentages of Black or African-American Alone, Hispanics, and Female Headed Households with Children Under 18 are calculated from 2010 Census Summary File 1 data. The poverty data were drawn from the 2005-2009 American Community Survey 5-year estimates.
Measure 3: Renters with Excessive Cost Burdens pg. 14Annual income data were obtained from the Bureau of Labor Statistics Occupational Employment Survey and dollars were adjusted for infl ation using the Bureau’s infl ation calculator. Fair Market Rent data were gathered from the U.S. Department of Housing and Urban Development (HUD), and household population data was retrieved from the 2010 American Community Survey 1-Year Estimates.
Measure 4: Production and Rehabilitation of Affordable Housing pg. 16
Subsidy data were obtained from the Louisville Metro Housing Authority; Kentucky Housing Corporation; from Kentucky housing authorities in Bardstown, Eminence, and Shelbyville; from Indiana housing authorities in New Albany, Jeffersonville, Charlestown, and Sellersburg; Community Action of Southern Indiana (CASI ); Hoosier Uplands, and HUD. Section 8 and public housing numbers refer to units allocated by HUD; LIHTC numbers refer to units in service.
Measure 5: Homeownership Rate pg. 17Owner and renter occupant status data were obtained from the 2010 Census Summary File 3 and the U.S. Census Bureau’s Annual Statistics on Housing Vacancies and Homeownership. The defi nition of the Louisville Metropolitan Statistical Area (MSA) changed between 2000 and 2007; however, we report 2000 data for the same counties as those included in the 2003 defi nition of the Louisville MSA.
Measure 6: Homeownership Access and Affordability pg. 18
House price data for the Louisville region were obtained from the National Association of Realtors, Kentucky Association of Realtors, and the Greater Louisville Association of Realtors. Median family income data were from the U.S. Census Bureau 2010 American Community Survey. The mortgage comparison chart for the Louisville MSA was calculated based on the following assumptions: median purchase prices for fi rst-time home buyers are about 15 percent lower than the median for all houses sold; fi rst-time home buyers make a 20 percent down payment for a conventional mortgage loan; fi rst-time home buyers make a 3.5 percent down payment for a FHA mortgage loan and consequently must pay for mortgage insurance, which increases the cost of fi nancing; and fi rst-time home-buyer incomes are about 30 percent lower than median household incomes.
Measure 7: Foreclosures pg. 19Court records regarding foreclosure data are maintained differently in the two jurisdictions of the Louisville MSA. Therefore, for all Kentucky counties in the Louisville MSA, we have defi ned the rate to be the number of actual foreclosures (or orders of sale) as a percentage of the number of owner-occupied homes with mortgages. The foreclosure rates for Indiana counties in the MSA refl ect the number of foreclosures fi led as a percentage of the number of owner-occupied homes with mortgages for all Indiana counties in the MSA. The number of foreclosures were obtained from the relevant court clerks in each county. Housing vacancy data was retrieved from HUD.
Measure 8: Homelessness pg. 21Shelter usage data were provided by the Coalition for the Homeless for the Kentucky counties and Haven House for the Indiana counties. Homeless student statistics were provided by Anne Malone and Dena Dossett at Jefferson County Public Schools.
Measure 9: CDBG and HOME Funds pg. 22Data were obtained from Louisville Metro Housing Authority and the New Albany Economic and Redevelopment Department.
DATA SOURCES
23 2011 State of Metropolitan Housing Report

Affordable HousingAs defi ned by HUD, housing is affordable when a low-income family pays no more than 30 percent of its income for housing and utilities combined.
Black or African-AmericanBlack or African-American, as defi ned by the U.S. Census Bureau, is“… a person having origins in any of the Black racial groups of Africa. It includes people who indicate their race as “Black, African Am., or Negro,” or provide written entries such as African American, Afro American, Kenyan, Nigerian, or Haitian.”
CDBGThe Community Development Block Grant program (CDBG) is a federal program aimed at creating prosperous communities by providing funds to improve housing, the living environment, and economic opportunities, principally for persons with low- to moderate-incomes. The CDBG program was established in 1974. At least 70 percent of the CDBG funds received by a jurisdiction must be spent to benefi t people with low- and moderate-incomes. The remaining 30 percent can be used to aid in the prevention or elimination of slums and blight—often used by local government offi cials to justify downtown beautifi cation—or to meet an urgent need such as earthquake, fl ood, or hurricane relief. Both Louisville Metro and the City of New Albany are entitlement cities eligible for CDBG funds.
Emergency ShelterEmergency shelter is basic, overnight accommodation provided for persons and families. The shelter is generally for one night only, and provides a cot for sleeping and perhaps a meal. Shelters typically provide service referrals to clients.
Fair Market Rent (FMR) FMR sets limits on Section 8 rents for qualifying families and households that either receive assistance through vouchers or through site-based units to rents below 40 percent of all rents in a housing market. Voucher program households receive a subsidy equal to the difference between the FMR and 30 percent of their monthly incomes. For site-based units, gross rents cannot exceed the FMR and the qualifying families or households receive a subsidy equal to the difference between the gross rent and 30 percent of their incomes. Utility allowances are included with a rent subsidy when factoring a program participant’s 30 percent of income (U.S. Department of Housing and Urban Development, 2009).
Family Household (Family)For statistical purposes, a family consists of a householder and one or more people living in the same household who is related by birth, marriage, or adoption. Each person living in the same house that is related is considered to be part of the same family. If there is a person (or persons) living in a family household that is not related to the householder, that person (or persons) is not included in the family household census tabulations.
Gross Rent Gross rent, as defi ned by the U.S. Census Bureau, is “… the sum of contract rent, utilities (electricity, gas, and water), and fuels, (oil, coal, kerosene, wood, etc.) [and] as a percentage of household income, is a computed ratio of monthly gross rent to monthly household income.” Excluded in these totals are units for which no cash rent is paid and units occupied by households that report no income or net loss.
HOME ProgramThe largest federal block grant to state and local governments, the HOME Program is designed exclusively to create affordable housing for low-income households. Fifteen percent of HOME funds must be used for projects sponsored, owned, or developed by Community Housing Development Organizations (CHDOs). Participating jurisdictions may allocate more funds for CHDOs, but 15 percent is the minimum amount.
Participating jurisdictions may use HOME funds to provide home purchase or rehabilitation fi nancing assistance to eligible homeowners and new homebuyers; build or rehabilitate housing for rent or ownership; acquire or improve housing sites; demolish dilapidated housing to make way for HOME-assisted development; and pay relocation expenses. HOME funds can also support tenant-based rental assistance for up to two years.
HouseholderAs defi ned by the U.S. Census Bureau, a householder is “the person, or one of the people, in whose name the home is owned, being bought, or rented.” If that person is not present, than any household member, age 15 and over, is considered the householder for census purposes.
HUDThe United States Department of Housing and Urban Development is the cabinet-level department of federal government whose mission
DEFINITIONS
7 Continued on next page
www.metropolitanhousing.org 24

TITLE LINEMedian IncomeMedian income is the midpoint of the income distribution; 50 percent of families are above the median and 50 percent are below the median.
Moderate IncomeHUD defi nes those of moderate income as having income greater than 80 percent up to 120 percent of area median income.
Poverty Threshold The U.S. Department of Health and Human Services defi nes the poverty threshold and, except for adjustments for household composition, it is the same across the 48 contiguous states. The original poverty thresholds were developed in the early 1960s and they have been revised annually by the Consumer Price Index since then. Poverty thresholds are signifi cantly lower than the low-income thresholds defi ned by HUD.
Public Housing The public housing program is the nation’s oldest effort to provide decent and affordable housing for families, elderly persons, and people with disabilities who have very low incomes. Public housing was created in the 1937 Housing Act, and is owned and operated by public housing agencies (PHAs) that are chartered by the states in which they operate and governed by locally appointed or elected Boards of Commissioners.
Section 8 Also called Housing Choice Vouchers, Section 8 is federal tenant-based rental assistance. It works two ways. One is by providing certifi cates and vouchers, each with different rental payment formulas. Housing vouchers are one of the major federal programs intended to bridge the gap between the cost of housing and the incomes of low-wage earners and people on limited fi xed-incomes. The Housing Choice Voucher program provides fl exibility and options by issuing vouchers to eligible households to help them pay the rent on privately-owned units. Project-based Section 8 provides a housing subsidy directly to the leasing agent of buildings that are designated as Section 8 properties.
Subsidized Housing The term subsidized housing refers to houses and multi-family dwellings (generally apartments) that receive some federal funding either in their construction, or in the form of assistance to families renting the units.
is to ensure “a decent, safe, and sanitary home and suitable living environment for every American.” HUD allocates federal funds for housing to states and local governments and public housing authorities.
Low IncomeHUD defi nes low income as those families whose annual incomes do not exceed 80 percent of metropolitan area median family income. This fi gure is adjusted for the size of the family.
Low Income Housing Tax CreditCreated by the Tax Reform Act of 1986, the Low Income Housing Tax Credit (LIHTC) has assisted in the production of more than one million affordable homes for low-income renters, by providing investors in eligible affordable housing developments with a dollar-for-dollar reduction in their federal tax liability. Developers, including nonprofi t community-based organizations, typically do not have suffi cient tax liability to use the tax credits, so they sell the credits to corporations. Corporations purchase 98 percent of all housing credits, as tax code rules effectively prevent individuals from investing. Developers then use the cash they receive from the corporations to fi nance the affordable housing. The Credit accounts for most new affordable apartment production and drives up to 40 percent of all multi-family apartment development. There is some overlap between LIHTC and Section 8. For this reason, LIHTC units are presented separately from units subsidized by the other programs.
DEFINITIONS (continued)7 Continued from previous page
25 2011 State of Metropolitan Housing Report

Agency for Toxic Substances and Disease Registry (2006). Rubbertown Health Consultation, Department of Health and Human Services, Atlanta, Georgia.
Akbari, H, Davis, S., Huang, J. and Winnett, S. (1992). Cooling our communities: a Guidebook on tree planting and light-colored surfacing. U.S. Environmental Protection Agency, Washington, D.C.
Air Pollution Control District. (2011). Strategic Toxic Air Reduction Program. Retrieved on October 5, 2011 from: http://www.louisvilleky.gov/apcd/star/.
Anderson, B. (2011). Haven House Services. Personal communication, September 12, 2011.
Arnold, C. and Norton, C. (2010). A Voice is a Terrible Thing to Waste. Planning, 76(7):38-42.
Axel-Lute, M. (1999). A Meeting of Movements. Shelterforce Magazine. January/February. http://www.nhi.org/online/issues/103/axellute.html
Barry, T. (2011). Executive Director, Louisville Metro Housing Authority. Personal communication, September 27, 2011.
Boehm, T.P and Schlottmann, A. (2008). Wealth Accumulation and Homeownership: Evidence for Low-Income Households. Cityscape: A Journal of Policy Development and Research. 10(2): 225-256.
Brothers, K. J. (2001). Water leakage and sustainable supply—truth or consequences? Journal of the American Water Works Association. 93(4):150-152.
Brown, P. (1995). Race, Class and Environmental Health: A Review and Systematization of the Literature. Environmental Research 69:15-30.
Bruggers, J. (2011). Nine schools to get larger share of settlement. The Louisville Courier-Journal, September 24, 2011 edition.
Bruggers, J. (2003). Chemicals exceed levels seen as safe: Pollutants could raise resident’s health risks. The Louisville Courier-Journal, May 12, 2003 edition.
Bullard, R.D. (2000). Dumping in Dixie: Race, Class and Environmental Quality. 3rd ed., Boulder: Westview Press.
Bullard, R.D., Johnson, G.S. and Torres, A.O. eds. (2000). Sprawl City: Race, Politics and Planning in Atlanta, Washington, DC: Island Press.
Bullard, R.D. (2007). Growing Smarter: Achieving Livable Communities, Environmental Justice, and Regional Equity. Cambridge: MIT Press.
Center for Responsible Lending. (2010, June). Foreclosures by Race and Ethnicity: The Demographics of a Crisis.
Centers for Disease Control and Prevention. (2011). CDC Health Disparities and Inequalities Report-United States, 2011. Morbidity and Mortality Weekly Report. Supplement/Vol. 60. January 14, 2011. http://www.cdc.gov/mmwr/pdf/other/su6001.pdf
Chaney, R.L., Sterrett, S.B., and Mielke, H.W. (1984). The potential for heavy metal exposure from urban gardens and soils. In J.R. Preer (ed.) Proc. Symp. Heavy Metals in Urban Gardens. Univ. Dist. Columbia Extension Service, Washington, DC.
Clark, H.F., Hausladen, D.M., and Brabander, D.J. (2008). Urban gardens: lead exposure, recontamination mechanisms, and implications for remediation design. Environmental Research 107: 312-319.
Cleveland Land Lab at the Cleveland Urban Design Collaborative (2008). Re-imagining a More Sustainable Cleveland. www.cudc.kent.edu
Coalition for the Homeless (2010). Reducing Homelessness: A Blueprint for the Future, 2010/2011 Annual Report.
Cochran, E. (2011). KentuckianaGreen.com. The Louisville Courier-Journal.
Commission for Racial Justice United Church of Christ. (1987). “Toxic Wastes and Race In the United States: A National Report on the Racial and Socio-Economic Characteristics of Communities with Hazardous Waste Sites”
Crompton, J.L. (2001). The Impact of Parks on Property Values: A Review of the Empirical Evidence. Journal of Leisure Research. 33(1): 1-31.
Executive Order 12898 of February 11, 1994. Federal Actions To Address Environmental Justice in Minority and Low-Income Populations. Federal Register Vol. 59, No. 32, Wednesday, February 16, 1994. http://www.archives.gov/federal-register/executive-orders/pdf/12898.pdf
Farfel, M.R., Orlova, A.O., Lees, P.S.J., Rohde, C., Ashley, P.J. and Chisolm, Jr., J.J. (2003). A Study of Urban Housing Demolitions as Sources of Lead in Ambient Dust: Demolition Practices and Exterior Dust Fall. Environmental Health Perspectives. 111(9): 1228-1234.
Finster, M.E., Gray, K.A., and H.J. Binns. (2004). Lead levels of edibles grown in contaminated residential soils: a fi eld survey. Science of the Total Environment 320: 245-257.
Frey, S. (2011) Deep Energy Retrofi t. Metropolismag.com. http://www.metropolismag.com/pov/20110526/deep-energy-retrofi t
Gan, Q and Hill, R.J. (2009). Measuring housing affordability: Looking beyond the median, Journal of Housing Economics, 18, 115-125.
Gies, E. (2006). The Health Benefi ts of Parks, San Francisco: The Trust for Public Lands.
Hanchette, C., Lee, J. and Aldrich, T. (2011). Asthma, Air Quality and Environmental Justice in Louisville, Kentucky. Chapter 11 in Geospatial Analysis of Environmental Health. Geotechnologies and the Environment, 4:223-242.
Heisler, G.M. (1986). Energy savings with trees, Journal of Arboriculture, 12(5):113-125.
Hernandez,D., Lister, M. and Suarez, C. (2011) Location Effi ciency and Housing Type—Boiling it Down to BTUs. Reconnecting America. http://www.reconnectingamerica.org/resource-center/browse-research/2011/location-effi ciency-and-housing-type-boiling-it-down-to-btus/
Isidore, C. (2011). Monthly Infl ation Retreats on Lower Gas Prices. CNN Money. http://money.cnn.com/2011/07/15/news/economy/infl ation_cpi/index.htm
REFERENCES
7 Continued on next pagewww.metropolitanhousing.org 26

Joint Center for Housing Studies of Harvard University (2011). State of the Nation’s Housing 2011, Harvard University Graduate School of Design and John F. Kennedy School of Government.
Jones, V. F., Lawson, P., Robson, G., Buchanan, B. and Aldrich, T. (2004). The Use of Spatial Statistics to Identify Asthma Risk Factors in an Urban Community. Pediatric Asthma, Allergy & Immunology, 17:3-13.
Ketschel, P., Adams, E. K., Wallace, S., Kannan, V.D. and Kannan, H. (2011). Lower-Income Families Pay a Higher Share of Income Toward National Healthcare Spending Than Higher-Income Families Do. http://content.healthaffairs.org/content/30/9/1637.full
Langley-Turnbaugh, S. (2007). Urban Soils and Backyard Gardens: Potential Contaminants and Remediation Techniques. http://www.cityfarmer.org/urbansoils.html
Lasley, Carrie Beth (2008). Creating an Environmentally Just Park System in Louisville, Kentucky. MIT Journal of Planning. 8:135-154.
Lester, J.P., Allen, D.W., and Hill, K.M. (2001). Environmental Injustice in the United States: Myths and Realities. Boulder Co.: Westview Press.
Louisville Metro Department of Housing and Family Services (2011). Draft Consolidated Annual Performance and Evaluation Report.
Malone, A. (2011). Jefferson County Public Schools. Personal communication.
Louisville Metro Housing Authority. (2011). Moving to Work Demonstration Program, FY 2012 Annual Plan.
Manta, D.S., Angelone, M., Bellanca, A., Neri, R. and Sprovieri, M. (2002). Heavy metals in urban soils: a case study from the city of Palermo (Sicily), Italy. The Science of the Total Environment 300: 229-243.
Metropolitan Housing Coalition (2010). 2010 State of Metropolitan Housing Report.
Metropolitan Housing Coalition (2008). 2008 State of Metropolitan Housing Report.
Metropolitan Housing Coalition (2006). 2006 State of Metropolitan Housing Report.
Metropolitan Housing Coalition (2005). Out of Breath: Childhood Asthma, Poverty, and Housing.
Miller, G.T. (2005). Living in the Environment. Brooks/Cole-Thompson Learning, Pacifi c Grove, CA USA.
Network Center for Community Change (2011). Local Options for Kentucky’s Liens: Ensuring Neighborhood Stability by Retaining Local Control. Presentation, July 20, 2011.
Norton, C. (2005). Developing New Uses for Low-to-No-MarketBrownfi elds: The Affordable Housing Solution, EPA Region 4 Environmental Finance Center, Practice Guide #13, Winter 2005, http://cepm.louisville.edu/Pubs_WPapers/practiceguides/PG13.pdf
Pike, B. (2003). Diversifi ed housing proposed for Portland, The Louisville Courier-Journal, May 7, 2003 edition
Pouyat, R. V., and M.J. McDonnell. (1991). Heavy metal accumulations in forest soils along an urban-rural gradient in southeastern New York, USA. Water, Air, and Soil Pollution 57-58: 797-807.
R.J. Lee Group (2011). Surface Dust Study. http://www.wfpl.org/wp-content/uploads/2011/07/TLH104154-Nuisance-dust-report-7-8-11-FINAL.pdf
Rappaport, J. (2010). The effectiveness of homeownership in building household wealth. Federal Reserve Bank of Kansas City, Economic Review, Fourth Quarter 2010.
RealtyTrac (2011). Record 29 million U.S. properties receive foreclosure fi lings in 2010 despite 30-month low in December. Retrieved on September 26, 2011 from: http://www.realtytrac.com/content/press-releases/record-29-million-us-properties-receive-foreclosure-fi lings-in-2010-despite-30-month-low-in-december-6309
Reavy, Amanda (2011). Leaky pipes to cost Rochester more than expected. The State-Journal Register, July 11, 2011. http://www.sj-r.com/top-stories/x910598754/Leaky-pipes-to-cost-Rochester-more-than-expected
Rolfe, G.L. (1974). Lead distribution in tree rings. Forestry Science 20(3):283-286.
Sanders, R.A. (1986). Urban vegetation impacts on urban hydrology of Dayton, Ohio. Urban Ecology, 9:361-376.
Scroggins, S.A. (2011). Species composition, demographics, and ecosystem services of residential trees in Louisville, Kentucky. Unpublished thesis.
Scroggins, S.A. and Carreiro, M.M. (2009). Comparing soil heavy metal concentrations across Louisville’s Residential Yards: report to CODRE and the Offi ce of the EVPR.
U.S Census Bureau. (2011). Retreived from: http://www.census.gov/hhes/www/housing/hvs/annual10/ann10ind.html
U.S. Census Bureau. (2011). Housing Vacancies and Homeownership, http://www.census.gov/hhes/www/housing/hvs/annual10/ann10ind.html , retrieved on April 14, 2011.
U.S. Environmental Protection Agency. (2005). Using Smart Growth Techniques as Stormwater Best Management Practices.
U.S. Environmental Protection Agency. (2004). Protecting Water Resources with Smart Growth.
U.S. Environmental Protection Agency. (1986). The Safe Water Drinking Act as Amended by the Safe Water Drinking Act Amendments of 1986. Public Law 99-339, June 19, 1986.
West Jefferson County Community Task Force. (2011). Rubbertown: The Louisville Area’s Largest Source of Industrial Emissions, http://www.wjcctf.org/rubbertown/
Ziegler, I. (1973). The effect of air-polluting gases on plant metabolism. Environmental Quality and Safety, 2nd ed. New York: Academic Press, p. 182-208.
REFERENCES (continued)
7 Continued from previous page
27 2011 State of Metropolitan Housing Report

2011 ANNUAL MEETING SPONSORSKeystone Sponsors
7 Fifth Third Bank
7 PNC Bank
Groundbreaking Sponsors
7 American Founders Bank
7 Janet Dakan
7 Kentucky Housing Corporation
7 Stites & Harbison
Table Sponsors
7 Beacon Property Management
7 Carpenters Local 64
7 Habitat for Humanity of Metro Louisville
7 Johanna Bos
7 LDG Development, LLC
7 Louisville Metro Housing Authority
7 Louisville Urban League
7 Network Center for Community Change
7 New Directions Housing Corporation
7 Oracle Design Group
7 Project Warm
7 River City Housing
7 Volunteers of America
STATE OF METROPOLITAN HOUSING REPORT SPONSORS
JANET DAKAN
www.metropolitanhousing.org 28

BOARD OF DIRECTORSMHC Board PresidentChristie McCravyLouisville Urban League
MHC Board Vice PresidentRick VanceStites & Harbison
MHC Board TreasurerFaith WeeklyFederal Reserve Bank of St. Louis
John BajandasSHED Design Group
Deborah Benberry WilliamsPNC Bank
Dr. Renee CampbellPresident/CEO, Wesley House
Barbara CarterSpalding University School of Social Work
Janet DakanCommunity Representative
Dan ForbisLabor & Community Representative
Ted FulmoreNew Directions Housing Corporation
Michael GardnerNew Directions Housing Corporation
Adam HallFifth Third Bank
Ron JacksonSpalding University School of Social Work
Carolyn Miller-CooperLouisville Metro Human Relations Commission
Candice PaytonRealtor
David RitchayThe Housing Partnership Inc.
Tammy ThomasCitizens Union Bank
Peter H. Wayne IVForge Consulting, LLC
Lawrence WilbonPresbyterian Community Center
Pat Yense-WoosleyNew Hope Services
29 2011 State of Metropolitan Housing Report
FOUNDATIONS AND GRANT-MAKING INSTITUTIONS
METROPOLITAN HOUSING COALITION STAFF AND INTERNS
ACKNOWLEDGEMENTS
Arthur K. Smith Family Foundation
Catholic Charities of Louisville
Fifth Third Bank Foundation
Gannett Foundation
Kentucky Housing Corporation
Louisville Metro Department of Community Services & Revitalization
Louisville Metro Neighborhood Development Fund
Network Center for Community Change
Metro United Way
Presbyterian Church, USA
Unitarian Universalist Fund for a Just Society
U.S. Department of Housing & Urban Development, Offi ce of Policy Development & Research
Executive DirectorCathy Hinko
Nonprofi t Housing Alliance (NHA) Program DirectorDoug Magee
Development Director & Advocacy Project CoordinatorCurtis Stauffer
Administrative AssistantTheresa Boyd
The 2011 State of Metropolitan Housing Report is a product of the Center for Environmental Policy and Management (CEPM) at the University of Louisville. John Vick, Carol Norton, Allison Smith, and Lauren Heberle authored this report with assistance from Shannon Scroggins and Daniel Weinstein. The maps in this report were produced by Sarin Adhikari and Eric Schneider at the Kentucky State Data Center.
MHC wishes to thank our 2011 interns for their dedication and hard work in support of affordable housing in greater Louisville:
Chelsea Adams, University of LouisvilleHumza Deshmukh, Emory UniversityConnor Riley, University of IndianaAmy Causey, for editorial advice on this report
Graphic DesignRob Gorstein Graphic Design, Inc.
Printing byFarley Printing Company, Inc.
www.metropolitanhousing.org 30

INDIVIDUAL MEMBERSSPONSORING MEMBERS ($1,000 and above)Emily Bingham & Stephen ReilyJanet DakanBob & Felice SachsSUSTAINING MEMBERS ($500-$999)Aukram & Nefertiti BurtonJoanna BosMary Bryan & Marty RosenStacy DeckCathy HinkoSusan Hinko & Carl BatlinEverett Hoffman & Cathy FordRick VancePat WalshANCHORING MEMBERS ($200-499)Tim & Melissa BarryBuddy & Carol CutlerJohn Bugbee & Huyett HurleyLisa OsankaKen & Angela Stallings HaganPhil & Jen TomCarla WallaceSUPPORTING MEMBERS ($75-$199)Ann AllenBarbara BanaszynskiStephen BourassaBethany Breetz & Robert LoughryJean EdwardsMr. & Mrs. Alan EngelEllen Friedman & Jim BirminghamMichael GardnerGordon & Joyce GarnerJoe Graffi sMaria & John HamptonAdam HallNatalie & John HarrisJames HaswellLauren HeberleMr. & Mrs. Joseph HelmKathy KremerForrest KuhnJonathan LoweLynn & Crit LuallenDoug Magee & Anne Marie ReganBeverly Marmion
Toni MartinCatherine McBride & David MorseMark McKinleyBeverly MooreMary Margaret MulvihillRobert OwensRobin PenickSuzy PostDeborah RattleStephanie ReesePat & Phil ReinhartBen RichmondSusan RostovRon SchneiderDiane ShottBarbara & John SinaiSue SpeedCurtis Stauffer & Rachel CutlerSusan StokesJanel TempleTammy ThomasBillie WadePeter WayneRepresentative Jim WayneEllen WeissJohn & Janet WilbornDeborah Benberry WilliamsLavon WilliamsPat Yense-WoosleyASSISTING MEMBERS ($1-$74)Alexandria AbellGarrett AdamsRamon BeasonVeronica BenberryFloyd & Estelle BennerNick BradenHarriet BrownShelly BrownRenee CampbellBarbara CarterJan CieremansKalilah CollinsLydia ComerElizabeth CooperMiriam Corcoran
David CoyteCassandra CulinJohn & Judith CumblerKate CunninghamSarah Lynn CunninghamKate Davidson & Courtney HoekstraDelores DelahantyNancy DemartraGary DrehmelJulie DriscollAmber DukeJeremy DyerJane EmkeGreg FischerDan ForbisSarah FrederickWilliam FriedlanderGabe & Jill FritzNancy Gall-ClaytonJessica George & Heather PostenAlane GoldsteinRob & Tiffanie GorsteinKathy & Jon GundersenLisa HammondsRoz HeinzColette HendersonMuriel HandmakerKate HawbakerFred HicksChris HillGeoffrey Hobin & Jennifer HubbardJane HopeDavid & Mary HorvathTawana HughesAlicia HurleRon JacksonKaren KarthollLauren KehrLisa KilkellyKenny & Anne LanhamLucinda LairdNancy LeachEdie MahaffeyMary MayroseChristie McCravyCarolyn Miller-Cooper
Krista MillsGregory MooreKathleen O’NeilEileen OrdoverPhyllis Passafi umeCandice PaytonNate PedersonJan PhillipsMorgan RansdellNancy Reinhart & David MitchellLynn RippyKhris RomaineAngela RonFanny Rose RosenbaumSiddy RosenbergDavid Ruccio & Lisa MarkowitzMartin SchindlerMary “Bo” SchindlerKesha ShahidErwin ShermanAmy ShirDavid SimcoxNancy & Terry SingerAl Spotts & Maggie SteptoeDiana StephenJoe & Karen StevensonGary & Geneva StraubElwood SturtevantJudy TiellJack TrawickIke ThackerLisa Thompson & Tom JohnsonCarmen TisdaleDrew TuckerBill WalshMorgan WardSally WaxLee WelshFaith WeeklyJane WhiteLawrence WilbonThomas WilliamsVirginia WoodwardAnna WooldridgeCouncilwoman Mary WoolridgeBarry Zalph
SUPPORTING MEMBERS ($75-$199)
ASSISTING MEMBERS ($1-$74)
ASSISTING MEMBERS ($1-$74)
31 2011 State of Metropolitan Housing Report

ORGANIZATIONAL MEMBERSINSTITUTIONAL MEMBERS($1,000 and above)
Arthur K. Smith Family Foundation
BB&T
Catholic Charities of Louisville
Commonwealth Bank & Trust
Fifth Third Bank
Kentucky Housing Corporation
Louisville Metro Housing Authority
Network Center for Community Change
New Directions Housing Corporation
Norton Healthcare
PNC Bank
Presbyterian Church, USA
Republic Bank
River City Housing
Stites & Harbison
TARC
Volunteers of America
SPONSORING MEMBERS ($500-$999)
ELCA- South Central Conference of Lutherans
First Capital Bank of Kentucky
Habitat for Humanity of Metro Louisville
Home of the Innocents
Housing Partnership, Inc.
Jewish Community of Louisville
LDG Development LLC
PrimeLending
Seven Counties Services
Sisters of Charity of Nazareth
US Bank
Your Community Bank
SUPPORTING MEMBERS ($200-499)
Beacon Property Management
Borders & Borders Attorneys at Law
Carpenters Local 64
Center for Accessible Living
Center for Neighborhoods
Center for Nonprofi t Excellence
Center for Women & Families
Citizens Union Bank
Coalition for the Homeless
Community Action of Southern Indiana
Day Spring, Inc.
Dreams With Wings, Inc.
Family Scholar House
Farris Mediation Services
Gold Key Realty
Hughes Architecture
Jefferson County Teachers Association
Kentucky Habitat for Humanity
Kentucky State AFL-CIO
KIPDA Area Agency on Aging
Lexington Fair Housing Council
Louisville Metro Human Relations Commission
Louisville Urban League
Metro United Way
New Albany Housing Authority
New Albany Redevelopment Commission
St. Boniface Catholic Church
University of Louisville School of Public Health
Vision Homes LLC
SUSTAINING MEMBERS ($75-$199)
AARP Kentucky State Offi ce
Allgeier Company
AU Associates
Cedar Lake Residences, Inc.
Dare to Care Food Bank
Downtown Development Corporation
Homeless & Housing Coalition of Kentucky
House of Ruth
Highland Presbyterian Church
Kentucky Equal Justice Center
Kentucky Resources Council
Legal Aid Society
Louisville Central Community Center
Metro Bank
National Council of Jewish Women Louisville Section
New Hope Services
River Fields, Inc.
Rodman Agency
Shelby Park Neighborhood Association
Society of St. Vincent de Paul
St. John Center, Inc.
St. William Church
Thomas Jefferson Unitarian Church
Tyler Park Neighborhood Association
West Jefferson County Task Force
Women 4 Women
Zion Community Development Corporation
NEIGHBORHOOD MEMBERS ($1-$74)
Americana Community Center
Black Dog Construction
Coalition for the People’s Agenda
Elderserve, Inc.
Fitzio, Inc.
Fuller Center for Housing
Greater Louisville Central Labor Council
GuardiaCare Services
Harbor House
Hinton McGraw
Jewish Family & Career Services
LAMP
Lanham and Associates
League of Women Voters- Louisville
Louisville Apartment Association
Multi-County Clients Council
New Zion Community Development Foundation
Phoenix Hill Neighborhood Association
Project Warm
Shelly’s LLC
Watrous Associates Architects
Wesley House Community Services
United Crescent Hill Ministries
Youthbuild Louisville
SPONSORING MEMBERS ($500-$999)
SUPPORTING MEMBERS ($200-499)
SUSTAINING MEMBERS ($75-$199)
www.metropolitanhousing.org 32

Metropolitan Housing CoalitionP.O. Box 4533Louisville, KY 40204
(502) 584-6858 www.metropolitanhousing.org
NON-PROFIT ORG.US POSTAGE
PAIDLOUISVILLE, KYPERMIT #1878
MISSION The Metropolitan Housing Coalition exists to bring together this community’s private and public resources to provide equitable, accessible housing opportunities for all people though advocacy, public education and support for affordable housing providers.