leukaemogenic effects of ptpn11 activating mutations · pdf fileleukaemogenic effects of...
TRANSCRIPT

3 0 4 | N A T U R E | V O L 5 3 9 | 1 0 N O V E m b E R 2 0 1 6
LETTERdoi:10.1038/nature20131
Leukaemogenic effects of Ptpn11 activating mutations in the stem cell microenvironmentLei Dong1*, Wen-mei Yu1*, Hong Zheng1*, mignon L. Loh2, Silvia T. bunting3, melinda Pauly1, Gang Huang4, muxiang Zhou1, Hal E. broxmeyer5, David T. Scadden6 & Cheng-Kui Qu1
Germline activating mutations of the protein tyrosine phosphatase SHP2 (encoded by PTPN11), a positive regulator of the RAS signalling pathway1, are found in 50% of patients with Noonan syndrome2. These patients have an increased risk of developing leukaemia3, especially juvenile myelomonocytic leukaemia (JMML), a childhood myeloproliferative neoplasm (MPN). Previous studies have demonstrated that mutations in Ptpn11 induce a JMML-like MPN through cell-autonomous mechanisms that are dependent on Shp2 catalytic activity4–7. However, the effect of these mutations in the bone marrow microenvironment remains unclear. Here we report that Ptpn11 activating mutations in the mouse bone marrow microenvironment promote the development and progression of MPN through profound detrimental effects on haematopoietic stem cells (HSCs). Ptpn11 mutations in mesenchymal stem/progenitor cells and osteoprogenitors, but not in differentiated osteoblasts or endothelial cells, cause excessive production of the CC chemokine CCL3 (also known as MIP-1α), which recruits monocytes to the area in which HSCs also reside. Consequently, HSCs are hyperactivated by interleukin-1β and possibly other proinflammatory cytokines produced by monocytes, leading to exacerbated MPN and to donor-cell-derived MPN following stem cell transplantation. Remarkably, administration of CCL3 receptor antagonists effectively reverses MPN development induced by the Ptpn11-mutated bone marrow microenvironment. This study reveals the critical contribution of Ptpn11 mutations in the bone marrow microenvironment to leukaemogenesis and identifies CCL3 as a potential therapeutic target for controlling leukaemic progression in Noonan syndrome and for improving stem cell transplantation therapy in Noonan-syndrome-associated leukaemias.
In our recent study investigating the potential effects of Ptpn11 acti-vating mutations in neural cells, we used the Ptpn11E76K mutation as a model and generated Ptpn11E76K/+Nestin-Cre+ mice with Ptpn11E76K mutation conditional knock-in mice (Ptpn11E76K-neo/+)5 and Nestin-Cre+ mice. We inadvertently found that Ptpn11E76K/+Nestin-Cre+ mice developed a myeloid malignancy resembling MPN at the age of 7 months or older as evidenced by splenomegaly, and significantly increased numbers of myeloid cells in the peripheral blood and myeloid progenitors in the bone marrow (BM) (Fig. 1a, Extended Data Fig. 1a, b). Histopathological examination revealed hyperprolif-eration of myeloid cells in the BM and spleen (Extended Data Fig. 1c). Myeloid cells (Mac-1+Gr-1+) (Fig. 1b) and inflammatory monocytes (CD115+Gr-1+) (Extended Data Fig. 1d) were significantly increased in these tissues. Moreover, extensive myeloid cell infiltration in the liver and lung was detected (Fig. 1b, Extended Data Fig. 1c). The loxP-flanked neo cassette with a stop codon, which inactivated the targeted Ptpn11E76K-neo allele5, was intact in the MPN cells of these
mice (Fig. 1c), indicating that the myeloid malignancy was not caused by the Ptpn11 mutation in haematopoietic cells. Previous studies have shown that Nestin is also expressed in BM mesenchymal stem/ progenitor cells (MSPCs) in addition to neural cells, and that perivas-cular Nestin+ MSPCs constitute unique sinusoidal vascular and arte-riolar HSC niches8,9. We therefore examined targeted Ptpn11 alleles in BM-derived MSPCs and found that the inhibitory neo cassette was deleted in approximately 95% of these cells (Fig. 1c). Interestingly, the frequency and absolute numbers of primitive haematopoietic progenitors and stem cells in the BM were markedly decreased in
1Department of Pediatrics, Division of Hematology/Oncology, Aflac Cancer and Blood Disorders Center, Children’s Healthcare of Atlanta, Emory University School of Medicine, Atlanta, Georgia 30322, USA. 2Department of Pediatrics, Division of Pediatric Hematology-Oncology, University of California at San Francisco, San Francisco, California 94122, USA. 3Department of Pathology, Children’s Healthcare of Atlanta, Emory University, Atlanta, Georgia 30322, USA. 4Division of Experimental Hematology and Cancer Biology, Cincinnati Children's Hospital, University of Cincinnati, Cincinnati, Ohio 45229, USA. 5Department of Microbiology and Immunology, Indiana University School of Medicine, Indianapolis, Indiana 46202, USA. 6Center for Regenerative Medicine and MGH Cancer Center, Massachusetts General Hospital, Department of Stem Cell and Regenerative Biology and Harvard Stem Cell Institute, Harvard University, Boston, Massachusetts 02114, USA.* These authors contributed equally to this work.
Ptpn11E76K/+
Nestin-Cre+ Ptpn11+/+
Nestin-Cre+
0
0.1
0.2
0.3
0.4
Sp
leen
wei
ght
(g)
Ptpn11+/+ Ptpn11E76K/+
Nestin-Cre+ Nestin-Cre+
a ***
Ptpn11+/+ Nestin-Cre+
Ptpn11E76K/+ Nestin-Cre+
b
0
20
40
60
80
100
BM Spleen Liver Lung
Mac
-1+G
r-1+
cel
ls (%
)
c
0
0.004
0.008
0.012
0.016
0.020 d
Ptpn11+/+
Nestin-Cre+Ptpn11E76K/+
Nestin-Cre+
*** HS
Cs
in B
M (%
)
G0 G1 S/G2/M
Ptpn11+/+ Nestin-Cre+
Ptpn11E76K/+ Nestin-Cre+
e
0
20
40
60
80
100
***
***
***
HS
Cs
(%)
Neo
ab
und
ance
in
geno
mic
DN
A (%
)
Haematopoietic cells MSPCs
Ptpn11E76K Neo/+ Nestin-Cre–
Ptpn11E76K/+ Nestin-Cre+
0
20
40
60
80
100
120
***
f
Fold
cha
nges
in M
FI
in H
SC
s
pErk pAkt pNF-κB
Ptpn11+/+ Nestin-Cre+
Ptpn11E76K/+ Nestin-Cre+
** **
**
***
***
*** ***
0
20
40
60
80
Inci
den
ce o
f MP
N
in r
ecip
ient
s (%
)
** *
1 2 3
0/12
3/6
8/12
Ptpn11E76K /+ Nestin-Cre+
(8 months old with MPN) WT
WT Ptpn11E76K /+ Nestin-Cre+
1.
Ptpn11E76K /+ Nestin-Cre+
(moribund with severe MPN) WT2.
3.
g
0
2
4
6
8
Figure 1 | Ptpn11E76K/+ mutation in Nestin+ MSPCs aberrantly activates neighbouring wild-type HSCs, inducing MPN in Ptpn11E76K/+Nestin-Cre+ mice. 7–12-month-old Ptpn11E76K/+Nestin-Cre+ and Ptpn11+/+Nestin-Cre+ mice were analysed. a, Spleen weights were determined (n = 17 mice per group). b, Cells isolated from BM, spleens, livers and lungs were assayed for Mac-1+Gr-1+ myeloid cells by FACS (n = 12 mice per group). c, Genomic DNA isolated from BM haematopoietic cells and BM-derived MSPCs was assayed for the abundance of the neo cassette by qPCR (n = 5 mice per group). d–f, BM cells were assayed by multiparameter FACS to determine the pool size (n = 8 mice per group) (d), cell cycle distribution (n = 6 mice per group) (e), and intracellular signalling activities (n = 3 mice per group) (f) of HSCs (Lin-Sca-1+c-Kit+CD150+CD48-Flk2-). g, BM cells collected from 8-month old Ptpn11E76K/+Nestin-Cre+ mice (CD45.2+) with MPN or moribund Ptpn11E76K/+Nestin-Cre+ mice (12 months old) with severe MPN were transplanted into lethally irradiated wild-type mice (WT) BoyJ mice (CD45.1+). In addition, BM cells collected from BoyJ mice were transplanted into 6-month-old Ptpn11E76K/+Nestin-Cre+ mice. Recipients were monitored for MPN development for 6–8 months. Data shown in a–f are mean ± s.d. of all mice examined; *P < 0.05; **P < 0.01; ***P < 0.001. Source Data for this figure are available online.
© 2016 Macmillan Publishers Limited, part of Springer Nature. All rights reserved.

letter reSeArCH
1 0 N O V E m b E R 2 0 1 6 | V O L 5 3 9 | N A T U R E | 3 0 5
Ptpn11E76K/+Nestin-Cre+ mice, whereas these cells in the spleen were increased (Fig. 1d, Extended Data Fig. 1e–g). The fact that the numbers of mature myeloid cells and myeloid progenitors increased whereas stem cells decreased implied aberrant activation and accelerated dif-ferentiation of HSCs in the BM. Indeed, the number of quiescent HSCs in the G0 phase in Ptpn11E76K/+Nestin-Cre+ mice decreased by twofold, whereas that of HSCs in the G1 or S/G2/M phases doubled (Fig. 1e). HSCs in these mice had reduced apoptosis (Extended Data Fig. 1h). Assessment of intracellular signalling activities demonstrated that Erk, Akt and NF-κ B pathways were highly activated in the HSCs of Ptpn11E76K/+Nestin-Cre+ mice (Fig. 1f). The MPN developed in chronic- phase Ptpn11E76K/+Nestin-Cre+ mice was not transferable to wild-type transplants, but MPN cells from terminally ill mice reproduced the same disease in 50% of the recipients (Fig. 1g), possibly owing to the acquisition of unknown genetic mutations that conferred self-renewal capability to MPN cells. At a 6–8-month follow up, 8 of 12 lethally irradiated Ptpn11E76K/+Nestin-Cre+ mice that were transplanted with wild-type BM cells developed donor-cell-derived MPN (Fig. 1g, Extended Data Fig. 1i), verifying the robust pathogenic effects of the Ptpn11E76K/+ mutation in Nestin+ BM stromal cells. These results suggested that the Ptpn11-mutated BM microenvironment drove MPN development by hyperactivation of resident wild-type HSCs. This notion was further supported by the observation that aber-rant HSC activation occurred before full development of MPN in Ptpn11E76K/+Nestin-Cre+ mice (Extended Data Fig. 1j).
As PTPN11 mutations in Noonan syndrome are present ubiqui-tously, we next determined the effect of the Ptpn11-mutated micro-environment on HSCs that also carried Ptpn11 mutations. We compared Ptpn11E76K/+Mx1-Cre+ mice, in which Cre was expressed in haematopoietic cells as well as BM stromal cells10,11 following administration of polyinosinic–polycytidylic acid (pI–pC), with Ptpn11E76K/+Vav1-Cre+ mice, in which constitutive Cre expression
was restricted to haematopoietic cells and part of endothelial cells (see below). The disease phenotypes of Ptpn11E76K/+Vav1-Cre+ mice were much less severe (Fig. 2a, b, Extended Data Fig. 2a). Furthermore, at a 12-month follow-up check, MPN in 19% of Ptpn11E76K/+Vav1-Cre+ mice deve loped into acute leukaemia, as opposed to 63% of Ptpn11E76K/+Mx1-Cre+ mice (Fig. 2c). The inhibitory neo cassette in the mutated Ptpn11 allele was deleted from haematopoietic cells to the same extent in both lines of mice. However, neo deletion from MSPCs, osteoblasts and endothelial cells was detected in Ptpn11E76K/+Mx1-Cre+ but not Ptpn11E76K/+Vav1-Cre+ mice (except for partial deletion from endo thelial cells) (Fig. 2d). The differences in the severity and prognosis of MPN between these two lines of mice do not appear to be associated with pI–pC administration or the times/stages when the dis-ease mutations were induced (Extended Data Fig. 2b–e). Furthermore, no donor-cell-derived MPN developed in Ptpn11E76K/+Vav1-Cre+ mice transplanted with wild-type BM cells, in contrast to the 75% incidence of donor-cell-derived MPN in Ptpn11E76K/+Mx1-Cre+ recipients (Fig. 2e, f, Extended Data Fig. 3a, b). Wild-type donor HSCs were also highly activated in Ptpn11E76K/+Mx1-Cre+, but not Ptpn11E76K/+Vav1-Cre+ recipients owing to aberrantly enhanced cell signalling activities (Fig. 2g, h). Similar results were obtained from the Noonan syndrome mutation Ptpn11D61G global knock-in mice, which were born with a developmental disorder resembling Noonan syndrome and devel-oped JMML-like MPN4. Transplantation of wild-type BM cells into lethally-irradiated Ptpn11D61G/+ mice initially reversed MPN. The mice appeared to be cured during the first 3 months after transplantation, but 8 out of 14 then developed donor-cell-derived MPN in the next 5 months (Extended Data Fig. 3c).
To further define the cell types in the Ptpn11-mutated BM micro-environment that have an important role in driving/enhancing MPN development, we generated cell-type-specific Ptpn11E76K/+ knock-in mice and monitored them for one and a half years. The Ptpn11E76K/+
Sp
leen
wei
ght
(g)
a
0
0.1
0.2
0.3
0.4
0.5
0.6
b
0
20
40
60
80
100
BM Spleen Liver
Ptpn11+/+ Mx1-Cre+
Ptpn11E76K/+ Mx1-Cre+
Ptpn11E76K/+ Vav1-Cre+
Mac
-1+G
r-1+
cel
ls (%
)
*** ***
*** ***
c
Neo
ab
und
ance
in
geno
mic
DN
A (%
)
Ptpn11E76K Neo/+ Mx1-Cre–
Ptpn11E76K/+ Mx1-Cre+
Ptpn11E76K/+ Vav1-Cre+
d
***
***
e
Mac
-1+G
r-1+
cel
ls (%
)
f g
0
20
40
60
80
100
WT Ptpn11+/+ Mx1-Cre+
WT Ptpn11E76K/+ Mx1-Cre+
WT Ptpn11E76K/+ Vav1-Cre+
BM Spleen Liver
***
*** ***
HS
Cs
in B
M (%
)
h
Fold
cha
nges
in M
FI
in H
SC
s
WT Ptpn11+/+ Mx1-Cre+
WT Ptpn11E76K/+ Vav1-Cre+
WT Ptpn11E76K/+ Mx1-Cre+
1. WT Ptpn11+/+ Mx1-Cre+
2. WT Ptpn11E76K/+ Mx1-Cre+
3. WT Ptpn11E76K/+ Vav1-Cre+
1 2 3
1 2 3
1. Ptpn11+/+ Mx1-Cre+
2. Ptpn11E76K/+ Mx1-Cre+
3. Ptpn11E76K/+ Vav1-Cre+
0
20
40
60
80
Inci
den
ce o
f acu
te le
ukae
mia
pro
gres
sion
(%)
Ptpn11E76K/+
Mx1-Cre+Ptpn11E76K/+
Vav1-Cre+
17/27
4/21
**
0
20
40
60
80 ***
Inci
den
ce o
f MP
N
in r
ecip
ient
s (%
)
1 2 3
1. WT Ptpn11+/+ Mx1-Cre+
2. WT Ptpn11E76K/+ Mx1-Cre+
3. WT Ptpn11E76K/+ Vav1-Cre+
9/12
0/12 0/12
0
20
40
60
80
100
120
0
0.005
0.010
0.015 ***
0
2
4
6
**
***
**
***
p Erk p Akt p NF-κB
Osteob
lasts
Endot
helia
l cell
s
MSPCs
Haem
atop
oietic
cells
Ptpn1
1+/+
Mx1
-Cre+
Ptpn1
1E76
K/+
Mx1
-Cre+
Ptpn1
1E76
K/+
Vav1-
Cre+
Ptpn1
1+/+
Vav1-
Cre+
Figure 2 | MPN that developed in Ptpn11E76K/+Vav1-Cre+ mice is less severe and less progressive than MPN developed in Ptpn11E76K/+Mx1-Cre+ mice. Ptpn11E76K/+Mx1-Cre+ and Ptpn11+/+Mx1-Cre+ mice (8 weeks after pI–pC administration), along with 16-week-old Ptpn11E76K/+Vav1-Cre+ and Ptpn11+/+Vav1-Cre+ mice were killed. a, Spleen weights were determined (n = 8 mice per group). b, Cells isolated from BM, spleens and livers were assayed for Mac-1+Gr-1+ myeloid cells (n = 8 mice per group). c, Ptpn11E76K/+Mx1-Cre+ and Ptpn11E76K/+Vav1-Cre+ mice administered with pI–pC were monitored for 12 months for acute leukaemia progression. d, Haematopoietic cells (CD45+), MSPCs (Sca-l+CD140α +CD45-Ter-119-CD31-), endothelial cells (CD45-Ter-119-CD31+), and osteoblasts (Sca-l-CD140α +CD45-Ter-119-CD31-) were sorted from the BM.
The abundance of the neo cassette in genomic DNA was determined by qPCR (n = 3 mice per group). e–h, BM cells collected from wild-type BoyJ mice were transplanted into Ptpn11E76K/+Mx1-Cre+, Ptpn11+/+Mx1-Cre+ (8 weeks following pI–pC treatment), and Ptpn11E76K/+Vav1-Cre+ (16 weeks old) mice. Recipients were monitored for MPN development for 6–8 months (e). Mac-1+Gr-1+ myeloid cells in the BM, spleen and liver were examined (n = 5 mice per group) (f). The pool size (n = 4 mice per group) (g) and intracellular signalling activities (n = 3 mice per group) (h) of donor HSCs were determined 25 weeks following transplantation. Data shown in a, b, d, f–h are mean ± s.d. of all mice examined. Statistical significance was determined between Ptpn11E76K/+Mx1-Cre+ and Ptpn11E76K/+Vav1-Cre+ groups; **P < 0.01; ***P < 0.001. Source Data for this figure are available online.
© 2016 Macmillan Publishers Limited, part of Springer Nature. All rights reserved.
letterreSeArCH
3 0 6 | N A T U R E | V O L 5 3 9 | 1 0 N O V E m b E R 2 0 1 6
mutation in Prx1-expressing broad mesenchymal cells, Lepr+ mes-enchymal cells, Osterix (Osx1)-expressing osteoprogenitors (all of which contain/overlap with Nestin+ MSPCs12–15), but not Osteocalcin (Oc)-expressing differentiated osteoblasts or VE-cadherin-expressing endothelial cells, induced MPN (Table 1, Extended Data Fig. 4a, b). The deletion efficiency of neo from mutated Ptpn11 alleles in MSPCs generally correlated with the latency and severity of MPN that deve-loped in these lines of cell-type-specific mutant mice (Extended Data Fig. 4c), suggesting that MSPCs and/or osteoprogenitors were respon-sible for the leukaemogenic effects of the Ptpn11-mutated BM micro-environment. HSCs were hyperactivated only in the lines of mice that developed MPN (Table 1), further underscoring the effect of HSC hyperactivation on the myeloid malignancy induced/enhanced by the Ptpn11 mutation in MSPCs and osteoprogenitors.
We next sought to identify the mechanisms by which Ptpn11-mutated MSPCs and osteoprogenitors activate HSCs (wild type or
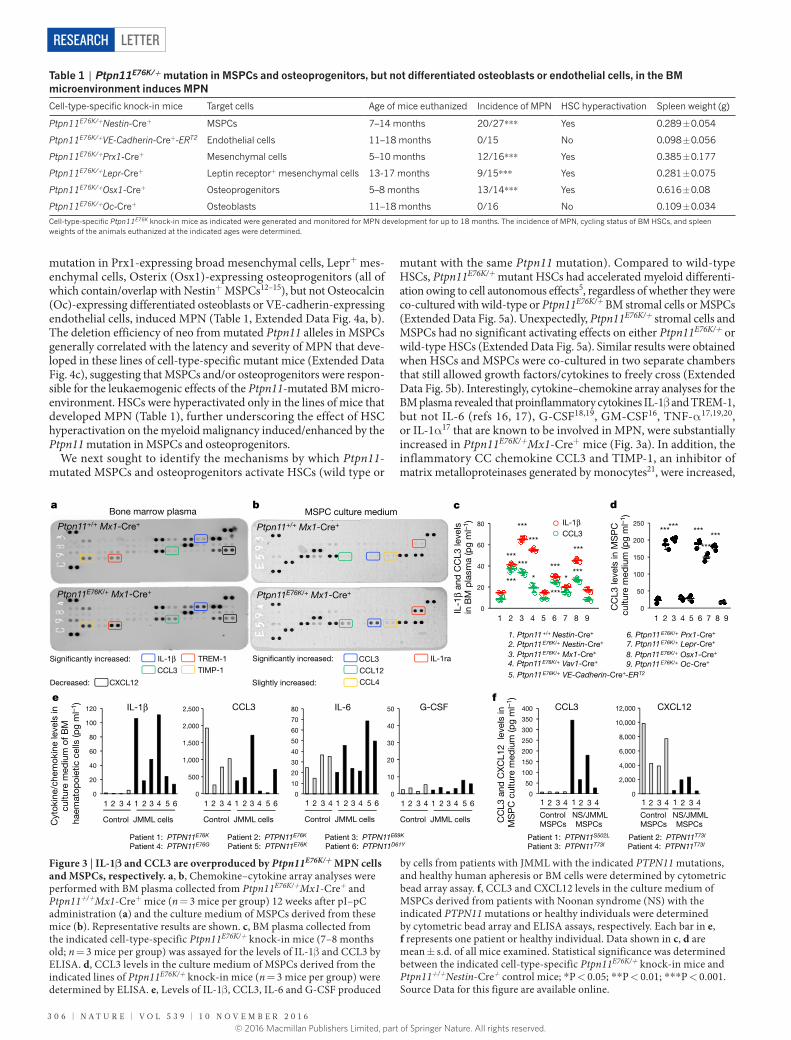
mutant with the same Ptpn11 mutation). Compared to wild-type HSCs, Ptpn11E76K/+ mutant HSCs had accelerated myeloid differenti-ation owing to cell autonomous effects5, regardless of whether they were co-cultured with wild-type or Ptpn11E76K/+ BM stromal cells or MSPCs (Extended Data Fig. 5a). Unexpectedly, Ptpn11E76K/+ stromal cells and MSPCs had no significant activating effects on either Ptpn11E76K/+ or wild-type HSCs (Extended Data Fig. 5a). Similar results were obtained when HSCs and MSPCs were co-cultured in two separate chambers that still allowed growth factors/cytokines to freely cross (Extended Data Fig. 5b). Interestingly, cytokine–chemokine array analyses for the BM plasma revealed that proinflammatory cytokines IL-1β and TREM-1, but not IL-6 (refs 16, 17), G-CSF18,19, GM-CSF16, TNF-α 17,19,20, or IL-1α 17 that are known to be involved in MPN, were substantially increased in Ptpn11E76K/+Mx1-Cre+ mice (Fig. 3a). In addition, the inflammatory CC chemokine CCL3 and TIMP-1, an inhibitor of matrix metalloproteinases generated by monocytes21, were increased,
Table 1 | Ptpn11E76K/+ mutation in MSPCs and osteoprogenitors, but not differentiated osteoblasts or endothelial cells, in the BM microenvironment induces MPN
Cell-type-specific knock-in mice Target cells Age of mice euthanized Incidence of MPN HSC hyperactivation Spleen weight (g)
Ptpn11E76K/+Nestin-Cre+ MSPCs 7–14 months 20/27* * * Yes 0.289 ± 0.054
Ptpn11E76K/+VE-Cadherin-Cre+-ERT2 Endothelial cells 11–18 months 0/15 No 0.098 ± 0.056
Ptpn11E76K/+Prx1-Cre+ Mesenchymal cells 5–10 months 12/16* * * Yes 0.385 ± 0.177
Ptpn11E76K/+Lepr-Cre+ Leptin receptor+ mesenchymal cells 13-17 months 9/15* * * Yes 0.281 ± 0.075
Ptpn11E76K/+Osx1-Cre+ Osteoprogenitors 5–8 months 13/14* * * Yes 0.616 ± 0.08
Ptpn11E76K/+Oc-Cre+ Osteoblasts 11–18 months 0/16 No 0.109 ± 0.034
Cell-type-specific Ptpn11E76K knock-in mice as indicated were generated and monitored for MPN development for up to 18 months. The incidence of MPN, cycling status of BM HSCs, and spleen weights of the animals euthanized at the indicated ages were determined.
TREM-1
TIMP-1
IL-1β
Decreased: CXCL12
CCL3
Signi�cantly increased:
Ptpn11E76K/+ Mx1-Cre+
a
Ptpn11+/+ Mx1-Cre+
CCL12
IL-1ra CCL3 Signi�cantly increased:
b
Ptpn11E76K/+ Mx1-Cre+
Ptpn11+/+ Mx1-Cre+
CCL4Slightly increased:
c
6. Ptpn11E76K/+ Prx1-Cre+
8. Ptpn11E76K/+ Osx1-Cre+
1. Ptpn11+/+ Nestin-Cre+
2. Ptpn11E76K/+ Nestin-Cre+
3. Ptpn11E76K/+ Mx1-Cre+
4. Ptpn11E76K/+ Vav1-Cre+
7. Ptpn11E76K/+ Lepr-Cre+
9. Ptpn11E76K/+ Oc-Cre+
IL-1βCCL3
5. Ptpn11E76K/+ VE-Cadherin-Cre+-ERT2
IL-1β
and
CC
L3 le
vels
in
BM
pla
sma
(pg
ml–1
)
d
e f
Patient 1: PTPN11S502L Patient 2: PTPN11T73I
Patient 3: PTPN11T73I Patient 4: PTPN11T73I
CCL3 CXCL12
CC
L3 a
nd C
XC
L12
leve
ls in
M
SP
C c
ultu
re m
ediu
m (p
g m
l–1)
Control NS/JMML MSPCs MSPCs C
ytok
ine/
chem
okin
e le
vels
in
cultu
re m
ediu
m o
f BM
ha
emat
opoi
etic
cel
ls (p
g m
l–1)
Control NS/JMML MSPCs MSPCs
Bone marrow plasma MSPC culture medium
1 2 3 4 5 6 7 8 9 C
CL3
leve
ls in
MS
PC
cu
lture
med
ium
(pg
ml–1
)1 2 3 4 5 6 7 8 9
0
20
40
60
80
***
***
***
***
***
***
***
*
***
***
0
50
100
150
200
250 *** *** ***
*** ***
*
0
20
40
60
80
100
120
0
10
20
30
40
50
60
70
80
0
10
20
30
40
50
0
500
1,000
1,500
2,000
2,500
Patient 1: PTPN11E76K Patient 2: PTPN11E76K Patient 3: PTPN11E69K
Patient 4: PTPN11E76G Patient 5: PTPN11E76K Patient 6: PTPN11D61Y
Control JMML cells
IL-1β CCL3 IL-6 G-CSF
1 3 5 4 6 2 1 3 4 2
Control JMML cells
1 3 5 4 6 2 1 3 4 2
Control JMML cells
1 3 5 4 6 2 1 3 4 2
Control JMML cells
1 3 5 4 6 2 1 3 4 2 1 3 4 2 1 3 4 2 1 3 4 2 1 3 4 2 0
2,000
4,000
6,000
8,000
10,000
12,000
0
50
100
150
200
250
300
350
400
Figure 3 | IL-1β and CCL3 are overproduced by Ptpn11E76K/+ MPN cells and MSPCs, respectively. a, b, Chemokine–cytokine array analyses were performed with BM plasma collected from Ptpn11E76K/+Mx1-Cre+ and Ptpn11+/+Mx1-Cre+ mice (n = 3 mice per group) 12 weeks after pI–pC administration (a) and the culture medium of MSPCs derived from these mice (b). Representative results are shown. c, BM plasma collected from the indicated cell-type-specific Ptpn11E76K/+ knock-in mice (7–8 months old; n = 3 mice per group) was assayed for the levels of IL-1β and CCL3 by ELISA. d, CCL3 levels in the culture medium of MSPCs derived from the indicated lines of Ptpn11E76K/+ knock-in mice (n = 3 mice per group) were determined by ELISA. e, Levels of IL-1β , CCL3, IL-6 and G-CSF produced
by cells from patients with JMML with the indicated PTPN11 mutations, and healthy human apheresis or BM cells were determined by cytometric bead array assay. f, CCL3 and CXCL12 levels in the culture medium of MSPCs derived from patients with Noonan syndrome (NS) with the indicated PTPN11 mutations or healthy individuals were determined by cytometric bead array and ELISA assays, respectively. Each bar in e, f represents one patient or healthy individual. Data shown in c, d are mean ± s.d. of all mice examined. Statistical significance was determined between the indicated cell-type-specific Ptpn11E76K/+ knock-in mice and Ptpn11+/+Nestin-Cre+ control mice; *P < 0.05; **P < 0.01; ***P < 0.001. Source Data for this figure are available online.
© 2016 Macmillan Publishers Limited, part of Springer Nature. All rights reserved.

letter reSeArCH
1 0 N O V E m b E R 2 0 1 6 | V O L 5 3 9 | N A T U R E | 3 0 7
whereas CXCL12 (SDF-1), a chemokine important for HSC retention in the niche22,23, was decreased (Fig. 3a). The spleen plasma from Ptpn11E76K/+Mx1-Cre+ mice also showed markedly increased levels of CCL3, CCL12 and CCL4 (Extended Data Fig. 6a).
To comprehensively identify the protein factors that were aber-rantly produced by MSPCs with Ptpn11 mutations, we performed RNA-sequencing gene expression profiling analyses (GEO number GSE81311). mRNA levels of Ccl3, Ccl12, and Ccl4 were increased by 6.5-, 3.7-, and 1.7-fold (log2 scale), respectively, whereas expression of Cxcl12 was decreased by 1.8-fold in Ptpn11E76K/+ MSPCs (Extended Data Fig. 6b). In addition, the anti-inflammatory cytokine IL-1 receptor antagonist (Il1ra), was also increased by 4.6-fold. Cytokine–chemokine array analyses with MSPC culture medium confirmed that the amount of CCL3, CCL12, and IL-1ra proteins secreted by Ptpn11E76K/+ MSPCs was indeed greatly increased (Fig. 3b). Levels of IL-1β and CCL3 in the BM plasma (Fig. 3c) and CCL3 in the culture medium of MSPCs (Fig. 3d) isolated from microenvironmental cell-type-specific Ptpn11E76K/+ mice correlated closely with the latency and incidence of MPN in these lines of mice. Remarkably, IL-1β production from PTPN11-mutated leukaemic cells from patients with JMML also increased by 7.9-fold to 65.7-fold over that of healthy donor cells (Fig. 3e). The amount of CCL3 produced by MSPCs derived from PTPN11-mutation-positive Noonan syndrome patients with JMML complications increased by 3.3-fold to 43.0-fold, whereas CXCL12 was decreased compared to those secreted by normal human MSPCs (Fig. 3f). The direct effects of these aberrantly produced cytokines/chemokines on HSCs were then
determined. Interestingly, although IL-1β robustly activated HSCs to differentiate towards myeloid cells and monocytes, CCL3, CCL4, and CCL12—which were over-produced by Ptpn11-mutated MSPCs—did not show any activating effects on HSCs (Extended Data Fig. 6c).
We next investigated the in vivo consequences of the excessive CC chemokines produced by Ptpn11-mutated MSPCs. Nestin+ MSPCs and Osteopontin+ osteoblasts were increased in Ptpn11E76K/+Nestin-Cre+ mice (Extended Data Fig. 7a). Frequencies of colony-forming unit fibroblasts (CFU-F) in the BM, indicative of MSPCs, were increased to various extents (Extended Data Fig. 7b) that were commensu-rate with the induction efficiencies of the Ptpn11E76K/+ mutation in MSPCs in various lines of microenvironmental cell-type-specific knock-in mice (Extended Data Fig. 4c). Indeed, MSPCs isolated from Ptpn11E76K/+Nestin-Cre+ mice grew much faster with significantly enhanced cycling due to elevated cell signalling activities caused by the activating mutation of Shp2 (Extended Data Fig. 7c–e). In addi-tion, osteogenesis was enhanced in Ptpn11E76K/+Nestin-Cre+ mice as evidenced by markedly increased thickness of the calvarium (Fig. 4a). Most notably, Nestin+ MSPCs in Ptpn11E76K/+Nestin-Cre+ (Fig. 4b) and Ptpn11E76K/+Prx1-Cre+ mice (Extended Data Fig. 8a) were frequently surrounded by CD115+Gr-1+ inflammatory monocytes, but not F4/80+ macrophages (Extended Data Fig. 8b). This was probably attributable to the excessive CCL3 and possibly other CC chemokines secreted from Ptpn11E76K/+ MSPCs, because these chemokines strongly induce chemotaxis of monocytes24,25. Consequently, the percentage of HSCs surrounded by CD115+Gr-1+ monocytes greatly increased (Fig. 4c)
Figure 4 | Ptpn11E76K/+ MSPCs recruit monocytes to the vicinity by excessive production of CCL3, leading to the hyperactivation and displacement of neighbouring HSCs from the niche. 7–10-month-old Ptpn11E76K/+Nestin-Cre+ mice and Ptpn11+/+Nestin-Cre+ littermates were analysed. a, Calvariums were processed for histopathological examination (haematoxylin and eosin (H&E) staining) and immunofluorescence staining with the indicated antibody. Slides were counterstained with the DNA dye DAPI (4',6-diamidino-2-phenylindole; n = 3 mice per group). b–d, Bone sections (one section per femur or tibia) were immunostained with the indicated antibodies (n = 5 mice per group). The spatial relationship between monocytes (CD115+Gr-1+) and MSPCs (Nestin+) (b), and between HSCs (Lin-CD48-CD41-CD150+) and monocytes (c) or MSPCs (d), were examined. HSCs within < 8 μ m of monocytes or MSPCs were considered as close to these cells. e–h, Six–seven-month-
old Ptpn11E76K/+Osx1-Cre+ mice were treated with the CCR1 antagonist BX471 and the CCR5 antagonist Maraviroc or vehicle control for 23 days. Mice were killed, and spleens were weighted (n = 5 and 10 mice for the antagonist and vehicle groups, respectively) (e). White blood cell counts in the peripheral blood were determined at the indicated time points (n = 5 mice per group, each line represents one mouse) (f). Myeloid cells (Mac-1+Gr-1+) in the BM, spleen, and peripheral blood (PB) (n = 5 and 10 mice for the antagonist and vehicle groups, respectively) (g), and the cell cycle distribution of HSCs in the BM (n = 5 and 6 mice for the antagonist and vehicle groups, respectively) (h) were determined at the end of the experiments. Representative images are shown in a–d. Data shown in e, g, and h are mean ± s.d. of all mice examined; **P < 0.01; ***P < 0.001. Source Data for this figure are available online.
100 μm
Ptpn11+/+ Nestin-Cre+ Ptpn11E76K/+ Nestin-Cre+
Ost
eop
ontin
DA
PI
H&
E
a
Nes
tin C
D11
5 G
r-1
DA
PI
b
Nes
tin C
D11
5 D
AP
I
20 μm
Ptpn11+/+ Nestin-Cre+ Ptpn11E76K/+ Nestin-Cre+
c d
Nes
tin C
D15
0 Li
nCD
48C
D41
DA
PI
Ptpn11+/+ Nestin-Cre+ Ptpn11E76K/+ Nestin-Cre+
HSC
HSC
10 μm
74.8 ± 7.8% HSCs close to MSPCs (67 HSCs examined)
53.3 ± 9.0% HSCs close to MSPC (59 HSCs examined) *
e Ptpn11+/+
Osx1-Cre+ Vehicle Antagonists
Sp
leen
wei
ght
(g)
***
0
0.2
0.4
0.6
0.8
Antagonists Vehicle
f g
h
Whi
te b
lood
cel
ls in
PB
(×
103
per
μl)
0 10 24 Days
Killed owing tounrelated condition
0
10
20
30
40
50
60 Vehicle Antagonists
*** ***
***
VehicleAntagonists
0
20
40
60
80
100
BM Spleen PB
Mac
-1+G
r-1+
cel
ls (%
)
Ptp
n11E
76K
/+ N
estin
-Cre
+P
tpn1
1+/+
Nes
tin-C
re+
CD150 CD115 Gr1LinCD41CD48
HSC
HSC
Monocytes
CD150 CD115 Gr1 CD150 CD115 Gr1
24.9 ± 3.3% HSCs close to monocytes (72 HSCs examined) ***
3.8 ± 2.2% HSCs close to monocytes (98 HSCs examined)
Monocytes
HSC
Monocytes
HSC
MSPC
Monocyte
MSPC
MSPC
Monocyte
MSPC
0
20
40
60
80 ***
***
G0 G1 S/G2/M
HS
Cs
(%)
**
VehicleAntagonistsPtpn11E76K/+ Osx1-Cre+
20 μm
Ptpn11E76K/+ Osx1-Cre+
Ptpn11E76K/+ Osx1-Cre+ Ptpn11E76K/+ Osx1-Cre+
Ptpn11E76K/+ Osx1-Cre+
500 μm
© 2016 Macmillan Publishers Limited, part of Springer Nature. All rights reserved.

letterreSeArCH
3 0 8 | N A T U R E | V O L 5 3 9 | 1 0 N O V E m b E R 2 0 1 6
and the percentage of HSCs close to Nestin+ MSPCs decreased (Fig. 4d). Furthermore, the distance of HSCs from CD31+CD144+ endothelial cells doubled (Extended Data Fig. 8c) and the percentage of HSCs residing in the megakaryocyte niches significantly decreased (Extended Data Fig. 8d) in Ptpn11E76K/+Nestin-Cre+ mice. Thus, it appears that persistent high levels of proinflammatory cytokines produced by the monocytes (with or without the Ptpn11 mutation) recruited by Ptpn11-mutated MSPCs/osteoprogenitors hyperactivated neighbouring HSCs with the same mutation or wild-type donor HSCs and displaced them from MSPC, endothelial cell, and megakaryocyte niches that are essen-tial for maintaining HSC dormancy8,9,26–29, resulting in exacerbated MPN or donor-cell-derived MPN.
To validate the role of excessive CCL3 in mediating the pathogenic effects of the Ptpn11-mutated BM microenvironment, we treated Ptpn11E76K/+Osx1-Cre+ mice with the CCL3 receptor (CCR1 and CCR5) antagonists. As shown in Figure 4e–g and Extended Data Figure 9a, b, treatment with CCR1 and CCR5 antagonists for 3 weeks effectively reversed MPN phenotypes, as determined by spleen weights, total white blood cell counts in the peripheral blood, and myeloid cells in the BM, spleen, and peripheral blood. The therapeutic effects correlated with the restoration of the quiescence and the size of the HSC pool (Fig. 4h, Extended Data Fig. 9c). We also treated Ptpn11E76K/+Mx1-Cre+ mice with CCL3 receptor antagonists. Similar effects, but to a lesser extent, were observed (Extended Data Fig. 10a–e).
In summary, our mouse genetics studies have demonstrated that Ptpn11 mutations in the BM microenvironment have pathogenic effects on resident HSCs, promoting/inducing leukaemogenesis. Nevertheless, as Noonan syndrome involves various mutations in PTPN11 and other genes (such as RAS, CBL, B-RAF, SOS1, and SHOC2), it remains to be determined whether the leukaemogenic effects of microenvironmental PTPN11 mutations depend on the potencies of these mutations, and whether Noonan-syndrome-associated mutations in other genes in the BM microenvironment also have detrimental effects. Clinical phenotype– genotype correlative studies in a large cohort of Noonan syndrome patients are required to address these questions.
Online Content Methods, along with any additional Extended Data display items and Source Data, are available in the online version of the paper; references unique to these sections appear only in the online paper.
received 27 October 2015; accepted 29 September 2016.
Published online 26 October 2016.
1. Mohi, M. G. & Neel, B. G. The role of Shp2 (PTPN11) in cancer. Curr. Opin. Genet. Dev. 17, 23–30 (2007).
2. Tartaglia, M. et al. Mutations in PTPN11, encoding the protein tyrosine phosphatase SHP-2, cause Noonan syndrome. Nat. Genet. 29, 465–468 (2001).
3. Roberts, A. E., Allanson, J. E., Tartaglia, M. & Gelb, B. D. Noonan syndrome. Lancet 381, 333–342 (2013).
4. Araki, T. et al. Mouse model of Noonan syndrome reveals cell type- and gene dosage-dependent effects of Ptpn11 mutation. Nat. Med. 10, 849–857 (2004).
5. Xu, D. et al. Non-lineage/stage-restricted effects of a gain-of-function mutation in tyrosine phosphatase Ptpn11 (Shp2) on malignant transformation of hematopoietic cells. J. Exp. Med. 208, 1977–1988 (2011).
6. Chan, G. et al. Leukemogenic Ptpn11 causes fatal myeloproliferative disorder via cell-autonomous effects on multiple stages of hematopoiesis. Blood 113, 4414–4424 (2009).
7. Mohi, M. G. et al. Prognostic, therapeutic, and mechanistic implications of a mouse model of leukemia evoked by Shp2 (PTPN11) mutations. Cancer Cell 7, 179–191 (2005).
8. Méndez-Ferrer, S. et al. Mesenchymal and haematopoietic stem cells form a unique bone marrow niche. Nature 466, 829–834 (2010).
9. Kunisaki, Y. et al. Arteriolar niches maintain haematopoietic stem cell quiescence. Nature 502, 637–643 (2013).
10. Park, D. et al. Endogenous bone marrow MSCs are dynamic, fate-restricted participants in bone maintenance and regeneration. Cell Stem Cell 10, 259–272 (2012).
11. Walkley, C. R., Shea, J. M., Sims, N. A., Purton, L. E. & Orkin, S. H. Rb regulates interactions between hematopoietic stem cells and their bone marrow microenvironment. Cell 129, 1081–1095 (2007).
12. Kfoury, Y. & Scadden, D. T. Mesenchymal cell contributions to the stem cell niche. Cell Stem Cell 16, 239–253 (2015).
13. Mendelson, A. & Frenette, P. S. Hematopoietic stem cell niche maintenance during homeostasis and regeneration. Nat. Med. 20, 833–846 (2014).
14. Morrison, S. J. & Scadden, D. T. The bone marrow niche for haematopoietic stem cells. Nature 505, 327–334 (2014).
15. Mizoguchi, T. et al. Osterix marks distinct waves of primitive and definitive stromal progenitors during bone marrow development. Dev. Cell 29, 340–349 (2014).
16. Reynaud, D. et al. IL-6 controls leukemic multipotent progenitor cell fate and contributes to chronic myelogenous leukemia development. Cancer Cell 20, 661–673 (2011).
17. Zhang, B. et al. Altered microenvironmental regulation of leukemic and normal stem cells in chronic myelogenous leukemia. Cancer Cell 21, 577–592 (2012).
18. Schepers, K. et al. Myeloproliferative neoplasia remodels the endosteal bone marrow niche into a self-reinforcing leukemic niche. Cell Stem Cell 13, 285–299 (2013).
19. Wang, L. et al. Notch-dependent repression of miR-155 in the bone marrow niche regulates hematopoiesis in an NF-κ B-dependent manner. Cell Stem Cell 15, 51–65 (2014).
20. Walkley, C. R. et al. A microenvironment-induced myeloproliferative syndrome caused by retinoic acid receptor gamma deficiency. Cell 129, 1097–1110 (2007).
21. Khokha, R., Murthy, A. & Weiss, A. Metalloproteinases and their natural inhibitors in inflammation and immunity. Nat. Rev. Immunol. 13, 649–665 (2013).
22. Ding, L. & Morrison, S. J. Haematopoietic stem cells and early lymphoid progenitors occupy distinct bone marrow niches. Nature 495, 231–235 (2013).
23. Greenbaum, A. et al. CXCL12 in early mesenchymal progenitors is required for haematopoietic stem-cell maintenance. Nature 495, 227–230 (2013).
24. Shi, C. & Pamer, E. G. Monocyte recruitment during infection and inflammation. Nat. Rev. Immunol. 11, 762–774 (2011).
25. Youn, B. S., Mantel, C. & Broxmeyer, H. E. Chemokines, chemokine receptors and hematopoiesis. Immunol. Rev. 177, 150–174 (2000).
26. Bruns, I. et al. Megakaryocytes regulate hematopoietic stem cell quiescence through CXCL4 secretion. Nat. Med. 20, 1315–1320 (2014).
27. Zhao, M. et al. Megakaryocytes maintain homeostatic quiescence and promote post-injury regeneration of hematopoietic stem cells. Nat. Med. 20, 1321–1326 (2014).
28. Kiel, M. J. et al. SLAM family receptors distinguish hematopoietic stem and progenitor cells and reveal endothelial niches for stem cells. Cell 121, 1109–1121 (2005).
29. Ding, L., Saunders, T. L., Enikolopov, G. & Morrison, S. J. Endothelial and perivascular cells maintain haematopoietic stem cells. Nature 481, 457–462 (2012).
Supplementary Information is available in the online version of the paper.
Acknowledgements This work was supported by The National Institutes of Health grants HL130995 and DK092722 (to C.K.Q.).
Author Contributions L.D. generated microenvironmental cell-type-specific knock-in mice, analysed MPN development and progression, performed HSC imaging and MSPC signalling analyses, and tested the therapeutic effects of CCL3 receptor antagonists. W.-M.Y. trained L.D. and H.Z. in techniques, performed cytokine array analyses, and analysed patient specimens. H.Z. generated MSPC-specific knock-in mice, characterized MPN development and progression, and analysed HSC phenotypes. S.T.B. and M.P. identified and collected patient specimens. M.L.L. provided patient specimens and thoroughly discussed the work. M.Z., G.H., H.E.B., and D.T.S. provided critical advice on experimental designs and interpretation of the data, and edited the manuscript. C.-K.Q. designed the experiments and directed the entire project. L.D. and C.K.Q. wrote the manuscript with input from all authors.
Author Information Reprints and permissions information is available at www.nature.com/reprints. The authors declare no competing financial interests. Readers are welcome to comment on the online version of the paper. Correspondence and requests for materials should be addressed to C.-K. Qu ([email protected]).
reviewer Information Nature thanks I. Ghobrial, B. Neel and the other anonymous reviewer(s) for their contribution to the peer review of this work.
© 2016 Macmillan Publishers Limited, part of Springer Nature. All rights reserved.
letter reSeArCH
MeThOdSMice. Generation of Ptpn11E76K-neo/+mice have previously been reported5. A neo cassette with a stop codon flanked by loxP sites was inserted in the second intron of the Ptpn11 allele followed by the mutation GAA (E) to AAA (K) at the amino acid 76 encoding position in the third exon. The mice were backcrossed to C57BL/6 mice for more than 10 generations. Ptpn11D61G/+ mice4 were originally imported from Beth Israel Deaconess Medical Center. Nestin-Cre+30, Mx1-Cre+31, Vav1-Cre+32, Prx1-Cre+33, Lepr-Cre+34, Osx1-Cre+35, Oc-Cre+36, and VE-Cadherin-Cre+-ERT2 (ref. 37) transgenic mice used in this study were purchased from the Jackson Laboratory or obtained from the investigators who originally developed the mouse lines. Mice of the same age, sex, and genotype were mixed and then randomly grouped for subsequent analyses (investigators were not blinded dur-ing allocation, during experiments and outcome assessment). All mice were kept under specific-pathogen-free conditions in the Animal Resources Center at Case Western Reserve University and subsequently Emory University Division of Animal Resources. All animal procedures complied with the NIH Guidelines for the Care and Use of Laboratory Animals and were approved by the Institutional Animal Care and Use Committee.
Ptpn11E76K/+Mx1-Cre+ mice and Ptpn11+/+Mx1-Cre+ littermates (8 weeks old) were administered with i.p. injection of 3 doses of pI–pC (1.0 μ g per g body weight) every other day over 5 days. Ptpn11E76K/+VE-Cadherin-Cre+-ERT2 mice and Ptpn11+/+VE-Cadherin-Cre+-ERT2 littermates (4–6 weeks old) were admini-stered with i.p. injection of 3 doses of tamoxifen (9.0 mg per 40 g body weight) every other day over 5 days. Mice were analysed at the indicated time points after pI–pC or tamoxifen administration. Acute leukaemia progression in pI–pC administered Ptpn11E76K/+Mx1-Cre+ and Ptpn11E76K/+Vav1-Cre+ mice was determined as we previously described5. No statistical methods were used to predetermine sample size.Patient specimens. De-identified BM biopsies from PTPN11-mutation-positive Noonan syndrome patients with JMML or non-syndromic PTPN11 mutation- positive patients with JMML were obtained from the University of California, San Francisco Tissue Cancer Cell Bank and Children’s Healthcare of Atlanta, Emory University. Informed consent was obtained from all subjects. The experiments involving human subjects were reviewed and approved (Exemption IV) by the Institutional Review Board of Emory University.BM cell transplantation. BM cells (2 × 10⁶) collected from indicated donor mice were transplanted into lethally irradiated (1,100 cGy) recipient mice with the indi-cated genotypes through tail vein injection. Recipients were monitored for MPN development for 6–8 months.Quantitative real-time PCR (qPCR). To determine the abundance of the neo cas-sette in the targeted Ptpn11 allele, genomic DNA of haematopoietic cells, MSPCs, or other indicated cells was extracted with a ZR-Duet DNA/RNA MiniPrep extraction kit (Zymo Research). The abundance of the neo cassette was then quantified by qPCR using the Applied Biosystems 7500 Fast Real-Time PCR System. The PCR primers used were: 5′ -TGGGAAGACAATAGCAGGCA-3′ and 5′ -CCCACTCA CCTTGTCATGTA-3′ .Fluorescence-activated cell sorting (FACS). The pool size, cell cycle status, apoptosis, and cell signalling activities of HSCs were analysed by multiparameter FACS analyses, as previously described38. In brief, for the HSC-pool-size analysis, fresh BM cells were stained with the following antibodies (eBiosciences, San Diego, unless otherwise noted): lineage antibodies (B220 (RA3-6B2), CD3 (145-2C11), Gr-1 (RB6-8C5), Mac-1 (M1/70), and Ter-119 (TER-119)), anti-Sca-1 (D7, BD Biosciences), anti-c-Kit (2B8), anti-CD150 (TC15-12F12.2, BD Biosciences), anti-CD48 (HM48-1), and anti-Flk2 (A2F10.1). Lin-Sca-1+c-Kit+CD150+CD48-Flk2- cells were quantified as HSCs. For the cell cycle analysis, freshly collected BM cells were stained for HSCs as above. Cells were then fixed and permeabilized using a Cytofix/Cytoperm kit (BD Biosciences), stained with Ki-67 antibody, and further incubated with Hoechest 33342 (20 μ g ml-1). For the apoptosis analysis, BM cells were stained for HSCs, and then incubated with Annexin V and 7-amino-actinomycin D (BD Biosciences). For cell signalling analyses, BM cells were stained for HSCs, fixed and permeabilized using a Cytofix/Cytoperm kit, and then stained with anti-phospho-Erk (mouse IgG) (E-4, Santa Cruz Biotechnology), anti-phospho-Akt (rabbit IgG) (C31E5E, Cell Signaling), or anti-phospho-NF-κ B (rabbit IgG) (93H1, Cell Signaling) antibodies, washed and further incubated with AlexaFluor488-conjugated secondary antibodies (goat anti-mouse IgG or goat anti-rabbit IgG) (Life technologies). Phosphorylation levels of these signalling proteins were determined by mean fluorescence intensities (MFI) of gated cells. Data were collected on BD LSR II Flow Cytometer (BD Biosciences) and analysed with FlowJo (Treestar).In vitro HSC culture. HSCs (Lin-Sca-1+c-Kit+CD150+CD48-Flk2-) sorted from wild-type C57BL/6 mice were cultured in StemSpan medium supplemented with SCF (50 ng ml-1), Flt3 ligand (50 ng ml-1), TPO (50 ng ml-1), IL-3 (20 ng ml-1),
and IL-6 (20 ng ml-1) in the presence of IL-1β (10 ng ml-1), CCL3 (20 ng ml-1), CCL4 (20 ng ml-1), or CCL12 (20 ng ml-1). Six days later, cells were collected and analysed for Mac-1+ myeloid cells, F4/80+ macrophages, and CD115+ monocytes.MSPC isolation and enrichment. Mouse MSPCs were enriched following a standard protocol39. In brief, BM was collected from long bones. The bones were then crushed and digested with collagenase type II (2.5 mg ml-1) (Worthington Biochemical Corporation). BM cells and digested bone fragments were combined and cultured in DMEM supplemented with 15% fetal bovine serum (FBS). For human MSPC derivation, only BM cells were used. Suspension haematopoietic cells were removed after 24 h. Medium was replenished every 72 h. Colonies of MSPCs appeared 6–8 days after initial plating. To further purify MSPCs, cells were collected and stained with biotin-conjugated CD45 antibody and anti-biotin microbeads. CD45+ haematopoietic cells were depleted using MACS separation columns (Miltenyi Biotec Inc.). The purity of MSPCs (> 95%) was further con-firmed according to the (CD45-CD140α +Sca-1+) phenotypes39 by multiparameter FACS analyses.Fibroblast colony-forming unit (CFU-F) and colony forming unit-granulocyte/macrophage (CFU-GM) assays. For the CFU-F assay, 2 × 10⁶ unfractionated BM cells were plated and cultured for 10–14 days as described above. Cells were stained with 0.5% crystal violet (Sigma-Aldrich) in 10% methanol for 20 min. Colonies formed by more than 50 fibroblast-like cells were counted under a light micro-scope. For the CFU-GM assay, freshly collected BM cells (2 × 10⁴ cells ml-1) were seeded in 0.9% methylcellulose IMDM medium containing 30% FBS, glutamine (10-4 M), β -mercaptoethanol (3.3 × 10⁻⁵ M), and IL-3 (1 ng ml-1) or GM-CSF (1 ng ml-1). After 7 days of culture at 37 °C in a humidified 5% CO2 incubator, colonies (primarily CFU-GM) formed by more than 50 haematopoietic cells were counted under an inverted microscope.RNA-sequencing analysis. MSPCs (CD45-Ter-119-CD31-CD140α +Sca-1+)39 were freshly isolated from the BM of Ptpn11E76K/+Nestin-Cre+ and Ptpn11+/+ Nestin-Cre+ mice. RNA was extracted using the RNeasy Midi kit (Qiagen). Total RNA samples were enriched for polyadenylated transcripts using the Oligotex mRNA Mini kit (Qiagen), and strand-specific RNA-seq libraries were generated using PrepX RNA library preparation kits (IntegenX), following the manufac-turer’s protocol. After cleanup with AMPure XP beads (Beckman Coulter) and amplification with Phusion High-Fidelity polymerase (New England BioLabs), RNA libraries were sequenced on a HiSeq 4000 instrument to a depth of at least 20 million reads. The correlation coefficient between the two groups is 0.954, which verifies that the method is accurate (Extended Data Fig. 6b). Before differential gene expression analysis, for each sequenced library, the read counts were adjusted by edgeR program package through one scaling normalized factor. Differential expression analysis of two conditions was performed using the DEGSeq R package (1.12.0). The P values were adjusted using the Benjamini–Hochberg method. Corrected P value of 0.005 and log2(fold change) of 1 were set as the threshold for significantly different expression.Chemokine–cytokine array analyses. Femurs were dissected from Ptpn11E76K/+Mx1-Cre+ mice and Ptpn11+/+Mx1-Cre+ littermates 12 weeks after pI–pC administration. BM plasma was collected by flushing one femur with 1.0 ml of phosphate buffered saline (PBS). MSPCs derived from pI–pC-administered Ptpn11E76K/+Mx1-Cre+ and Ptpn11+/+Mx1-Cre+ mice were cultured (4 × 10⁶ cells in 2.0 ml medium) in serum-free DMEM for 48 h. The culture medium was then collected. BM plasma or MSPC culture medium were analysed with Mouse Cytokine Antibody Array blots (R&D Systems) following the instructions provided by the manufacturer.ELISA and cytometric bead array assay. BM plasma collected from one femur and one tibia in 500 μ l PBS. Culture medium was collected from mouse MSPCs (4 × 10⁶ cells per 2.0 ml) at second or third passages cultured in serum-free DMEM for 48 h. These samples were assayed for levels of IL-1β and CCL3 using enzyme-linked immunosorbent assay (ELISA) kits (IL-1β : eBioscience; CCL3: R&D Systems) following the instructions provided by the manufacturers. To determine multiple cytokines/chemokines produced by human MSPCs, MSPCs (2 × 10⁴ cells ml-1) were cultured in serum-free StemSpan medium for 72–96 h. To determine multiple protein factors produced by cells from patients with JMML, JMML cells (2 × 10⁵ cells ml-1) were cultured in StemSpan medium supplemented with human SCF (50 ng ml-1), human Flt3 ligand (50 ng ml-1), and human TPO (50 ng ml-1) for 72 h. The culture medium was then collected and cytokine/chemokine levels were determined by the BD Cytometric Bead Array Flex Sets (BD Biosciences) following the manufacturer’s instructions. Human CXCL12 levels in MSPC culture medium were measured using a Human CXCL12/SDF-1 alpha Quantikine ELISA Kit (R&D systems).Immunofluorescence staining. Frozen tissue sections prepared from 4% para-formaldehyde-fixed and decalcified bones were thawed at room temperature and then rehydrated with PBS. The slides were stained with the following antibodies
© 2016 Macmillan Publishers Limited, part of Springer Nature. All rights reserved.

letterreSeArCH
(eBiosciences, San Diego, unless otherwise noted) following standard proce-dures: anti-Osteopontin (Abcam), anti-Nestin (MAB353, Millipore), anti-Gr-1 (RB6-8C5), anti-Mac-1 (M1/70), anti-B220 (RA3-6B2), anti-Ter-119 (TER-119), anti-CD3 (145-2C11, BD Biosciences), anti-CD115 (AFS98), anti-CD150 (TC15-12F12.2, BD Biosciences), anti-CD31 (MEC13.3, Biolegend), anti-CD48 (HM48-1), and anti-CD41 (eBioMWReg30) antibodies. Images were acquired using Olympus Confocal Laser Scanning Biological Microscope FV1000 equipped with four lasers ranging from 405 to 635 nm. Images were processed with ImageJ software.Administration of CCR1 and CCR5 antagonists. Ptpn11E76K/+Osx1-Cre+ mice (6–7 month old) and Ptpn11E76K/+Mx1-Cre+ mice (4 weeks after pI–pC administration) were treated daily via subcutaneous injection with the CCR1 antagonist BX471 ((2R)-1-((2-((aminocarbonyl)amino)-4-chlorophenoxy)acetyl)- 4-((4-fluorophenyl)methyl)-2-methylpiperazine) purchased from Tocris Bioscience (50 mg kg-1 of body weight). These animals also received the CCR5 antagonist Maraviroc (4,4-difluoro-N-((S)-3-(3-(3-isopropyl-5-methyl-4H-1,2, 4-triazol-4-yl)-8-azabicyclo(3.2.1)octan-8-yl)-1-phenylpropyl)cyclohexanecarbox-amide) obtained from Selleck Chemicals (0.3 mg ml-1 in the drinking water). Control Ptpn11E76K/+Osx1-Cre+ mice and Ptpn11E76K/+Mx1-Cre+ mice were given vehicle (70% ethanol and 0.5% DMSO for subcutaneous injections, and 1% DMSO in drinking water). Mice were treated for 23 days and then killed for subsequent analyses.Statistics. Data are presented as mean ± s.d. of all mice analysed in multiple experi-ments (that is, biological replicates). Statistical significance was determined using unpaired two-tailed Student’s t test. For HSC imaging analyses, two-tier tests were used to first combine technical replicates and then evaluate biological replicates.
30. Tronche, F. et al. Disruption of the glucocorticoid receptor gene in the nervous system results in reduced anxiety. Nat. Genet. 23, 99–103 (1999).
31. Kühn, R., Schwenk, F., Aguet, M. & Rajewsky, K. Inducible gene targeting in mice. Science 269, 1427–1429 (1995).
32. Stadtfeld, M. & Graf, T. Assessing the role of hematopoietic plasticity for endothelial and hepatocyte development by non-invasive lineage tracing. Development 132, 203–213 (2005).
33. Logan, M. et al. Expression of Cre Recombinase in the developing mouse limb bud driven by a Prxl enhancer. Genesis 33, 77–80 (2002).
34. DeFalco, J. et al. Virus-assisted mapping of neural inputs to a feeding center in the hypothalamus. Science 291, 2608–2613 (2001).
35. Rodda, S. J. & McMahon, A. P. Distinct roles for Hedgehog and canonical Wnt signaling in specification, differentiation and maintenance of osteoblast progenitors. Development 133, 3231–3244 (2006).
36. Zhang, M. et al. Osteoblast-specific knockout of the insulin-like growth factor (IGF) receptor gene reveals an essential role of IGF signaling in bone matrix mineralization. J. Biol. Chem. 277, 44005–44012 (2002).
37. Monvoisin, A. et al. VE-cadherin-CreERT2 transgenic mouse: a model for inducible recombination in the endothelium. Dev. Dyn. 235, 3413–3422 (2006).
38. Yu, W. M. et al. Metabolic regulation by the mitochondrial phosphatase PTPMT1 is required for hematopoietic stem cell differentiation. Cell Stem Cell 12, 62–74 (2013).
39. Morikawa, S. et al. Prospective identification, isolation, and systemic transplantation of multipotent mesenchymal stem cells in murine bone marrow. J. Exp. Med. 206, 2483–2496 (2009).
To determine statistical significance in the incidences of MPN development and malignant progression, Fisher’s exact tests were performed. *P < 0.05; **P < 0.01; *** P < 0.001; N.S., not significant in Extended Data Figs 2, 5.
© 2016 Macmillan Publishers Limited, part of Springer Nature. All rights reserved.

letter reSeArCH
Extended Data Figure 1 | Ptpn11E76K/+ mutation in MSPCs induces MPN by aberrant activation of neighbouring wild-type HSCs in Ptpn11E76K/+Nestin-Cre+ mice. a, Peripheral blood collected from 7–12-month-old Ptpn11E76K/+Nestin-Cre+ mice with MPN and Ptpn11+/+Nestin-Cre+ littermates were analysed for percentages of neutrophils and lymphocytes (n = 15 mice per group). b, BM cells (2 × 10⁴ cells) freshly collected from Ptpn11E76K/+Nestin-Cre+ mice with MPN and Ptpn11+/+Nestin-Cre+ littermates (n = 4 mice per group) were assayed for haematopoietic colony-forming units in 0.9% methylcellulose IMDM medium containing 30% FBS, glutamine (10-4 M), β -mercaptoethanol (3.3 × 10⁻⁵ M), and IL-3 (1.0 ng ml-1) or GM-CSF (1.0 ng ml–1). After 7 days of culture at 37 °C in a humidified 5% CO2 incubator, haematopoietic cell colonies (primarily CFU-GM) derived from myeloid progenitors were counted under an inverted microscope. c, Femurs, spleens, livers and lungs were processed for histopathological examination (haematoxylin and eosin staining) (n = 4 mice per group). Representative pictures are shown. d–h, BM cells and splenocytes were collected from Ptpn11E76K/+Nestin-Cre+
mice with MPN and Ptpn11+/+Nestin-Cre+ littermates. CD115+Gr-1+ monocytes in the BM (n = 4 mice per group) (d), frequencies of LSKs (Lin-Sca-1+c-Kit+) in the BM (n = 8 mice per group) (e), absolute number of HSCs in two femurs and two tibias (n = 10 mice per group) (f), frequencies of LSKs in the spleen (n = 8 mice per group) (g), and apoptotic cells in the HSC population in the BM (n = 6 mice per group) (h) were assayed by multiparameter FACS analyses. i, BM cells collected from wild-type BoyJ mice were transplanted into 6-month-old Ptpn11E76K/+Nestin-Cre+ and Ptpn11+/+Nestin-Cre+ mice. Recipients were monitored for MPN development for 6–8 months. Percentages of donor cell (CD45.1+)-derived Mac-1+ myeloid cells in the peripheral blood (n = 5 mice per group) and BM (n = 8 mice per group) of recipients were determined. j, Frequencies of HSCs in the BM from Ptpn11E76K/+Nestin-Cre+ mice that had not yet manifested MPN and Ptpn11+/+Nestin-Cre+ littermates (n = 4 mice per group) were assayed as above. Data shown in a, b, d–j are mean ± s.d. of all mice examined; *P < 0.05; **P < 0.01; ***P < 0.001. Source Data for this figure are available online.
© 2016 Macmillan Publishers Limited, part of Springer Nature. All rights reserved.
letterreSeArCH
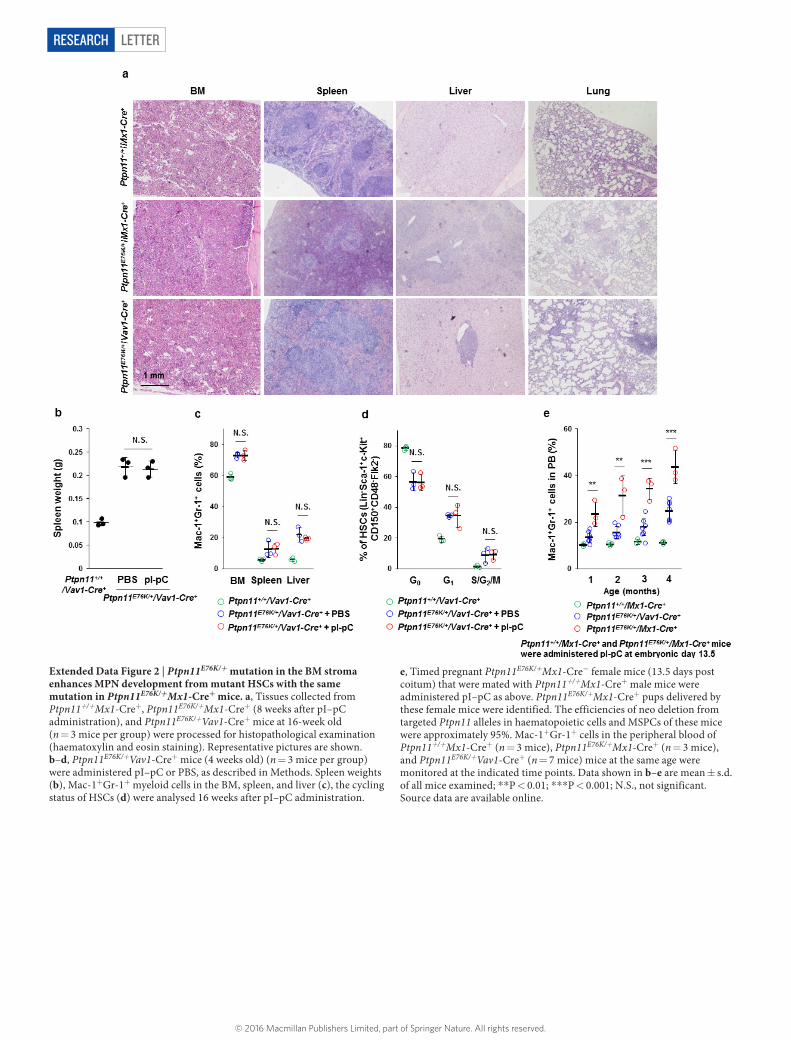
Extended Data Figure 2 | Ptpn11E76K/+ mutation in the BM stroma enhances MPN development from mutant HSCs with the same mutation in Ptpn11E76K/+Mx1-Cre+ mice. a, Tissues collected from Ptpn11+/+Mx1-Cre+, Ptpn11E76K/+Mx1-Cre+ (8 weeks after pI–pC administration), and Ptpn11E76K/+Vav1-Cre+ mice at 16-week old (n = 3 mice per group) were processed for histopathological examination (haematoxylin and eosin staining). Representative pictures are shown. b–d, Ptpn11E76K/+Vav1-Cre+ mice (4 weeks old) (n = 3 mice per group) were administered pI–pC or PBS, as described in Methods. Spleen weights (b), Mac-1+Gr-1+ myeloid cells in the BM, spleen, and liver (c), the cycling status of HSCs (d) were analysed 16 weeks after pI–pC administration.
e, Timed pregnant Ptpn11E76K/+Mx1-Cre- female mice (13.5 days post coitum) that were mated with Ptpn11+/+Mx1-Cre+ male mice were administered pI–pC as above. Ptpn11E76K/+Mx1-Cre+ pups delivered by these female mice were identified. The efficiencies of neo deletion from targeted Ptpn11 alleles in haematopoietic cells and MSPCs of these mice were approximately 95%. Mac-1+Gr-1+ cells in the peripheral blood of Ptpn11+/+Mx1-Cre+ (n = 3 mice), Ptpn11E76K/+Mx1-Cre+ (n = 3 mice), and Ptpn11E76K/+Vav1-Cre+ (n = 7 mice) mice at the same age were monitored at the indicated time points. Data shown in b–e are mean ± s.d. of all mice examined; **P < 0.01; ***P < 0.001; N.S., not significant. Source data are available online.
© 2016 Macmillan Publishers Limited, part of Springer Nature. All rights reserved.

letter reSeArCH
Extended Data Figure 3 | Donor-cell-derived MPN is developed in Ptpn11E76K/+Mx1-Cre+ broad knock-in mice and Ptpn11D61G/+ global knock-in mice, but not Ptpn11E76K/+Vav1-Cre+ haematopoietic cell-specific knock-in mice transplanted with wild-type BM cells. BM cells (2 × 10⁶) freshly collected from wild-type BoyJ mice (CD45.1+) were transplanted into lethally irradiated (1,100 cGy) Ptpn11E76K/+Mx1-Cre+, Ptpn11+/+Mx1-Cre+ (8 weeks after pI–pC administration), and Ptpn11E76K/+Vav1-Cre+ mice at 16-week old (CD45.2+). Spleen weights (n = 5 mice per group) (a), percentages of donor cell (CD45.1+) reconstitution (n = 8 mice per group) and percentages of donor cell-derived myeloid (Mac-1+Gr-1+) cells (n = 8 mice per group) in the
peripheral blood of the recipients (b) were determined at the indicated time points following the transplantation. c, BM cells (1 × 10⁶) freshly collected from wild-type BoyJ mice (CD45.1+) were transplanted into lethally irradiated 3–4-month old Ptpn11D61G/+ and Ptpn11+/+ (CD45.2+) mice (n = 14 and 17 mice, respectively). Recipients were monitored for MPN development for 8 months. Percentages of donor cell (CD45.1+)-derived Mac-1+ myeloid cells in the peripheral blood of recipients were determined. Representative results are shown. Data shown in a, b are mean ± s.d. of all mice examined; **P < 0.01; ***P < 0.001. Source Data for this figure are available online.
© 2016 Macmillan Publishers Limited, part of Springer Nature. All rights reserved.

letterreSeArCH
Extended Data Figure 4 | Ptpn11E76K/+ mutation in MSPCs and osteoprogenitors, but not differentiated osteoblasts or endothelial cells, in the BM microenvironment induces MPN. Cell-type-specific Ptpn11E76K knock-in mice as indicated were generated and monitored for MPN development. a, The ages of the microenvironmental cell-type-specific Ptpn11E76K/+ knock-in mice when they were euthanized for MPN diagnosis. b, Peripheral blood haematology was determined using the HemaTrue veterinary hematology analyzer. Mac-1+Gr-1+/- myeloid cells, B220+ B lymphoid, and CD3+ T-lymphoid cells in the BM were analysed by FACS. Karyotypes of MPN cells were examined by standard karyotyping analyses. HSCs in the peripheral blood were determined by multiparameter FACS. SSC/CD45 profiles were also determined by FACS.
CD115+Gr-1+ monocytes were highlighted in red. Cytokine sensitivity of BM myeloid progenitors was determined by CFU assays with a range of GM-CSF concentrations. Transplantability of MPN cells was determined by transplantation of BM cells into lethally-irradiated BoyJ mice. Recipient mice were monitored for 6 months. All methods are described in Methods and/or related figure legends. c, BM-derived MSPCs were generated from the indicated mouse lines. The abundance of the neo cassette in genomic DNA was determined by qPCR (n = 3 mice per group). Data shown in c are mean ± s.d. of all mice examined. Statistical significance (***P < 0.001) was determined between the indicated cell-type-specific Ptpn11E76K/+ knock-in mice and Ptpn11E76K-neo/+Nestin-Cre- control mice. Source Data for this figure are available online.
© 2016 Macmillan Publishers Limited, part of Springer Nature. All rights reserved.

letter reSeArCH
Extended Data Figure 5 | Ptpn11E76K/+ MSPCs do not directly activate HSCs. BM-derived MSPCs were enriched from Ptpn11E76K/+Nestin-Cre+ and Ptpn11+/+Nestin-Cre+ mice, as described in Methods. MSPCs at the 2nd or 3rd passages were plated in regular 24-well plates (a) or lower chambers of transwells (b). Forty-eight hours later when the cells were confluent, HSCs (75–200) (Lin-Sca-1+c-Kit+CD150+CD48-Flk2-) sorted from Ptpn11E76K/+Mx1-Cre+ and Ptpn11+/+Mx1-Cre+ mice (8 weeks after pI–pC administration) were seeded in the same wells (a) or in upper chambers with the 0.4 μ m pore size (b). The cells were
co-cultured in StemSpan medium supplemented with cytokines TPO (50 ng ml-1), Flt3 ligand (50 ng ml-1), SCF (50 ng ml-1), IL-3 (20 ng ml-1), and IL-6 (20 ng ml-1). Frequencies of myeloid (Mac-1+Gr-1+) cells that differentiated from HSCs were assayed by FACS analyses after 7–10 days of co-culture. Experiments were performed three times and similar results were obtained in each (see Supplementary Information). Results shown are mean ± s.d. of triplicates from one experiment; N.S., not significant. Source data are available online.
© 2016 Macmillan Publishers Limited, part of Springer Nature. All rights reserved.

letterreSeArCH
Extended Data Figure 6 | Cytokines/chemokines are aberrantly produced by Ptpn11E76K/+ MSPCs. a, Spleen tissues freshly dissected from Ptpn11E76K/+Mx1-Cre+ and Ptpn11+/+Mx1-Cre+ mice (n = 3 mice per group) 12 weeks after pI–pC administration were gently smashed in PBS (0.1 g tissue per 1.0 ml). Supernatant collected was processed for cytokine–chemokine array analyses with the Mouse Cytokine Antibody Array Kit following the instructions provided by the manufacturer. Representative results from one pair of the mice are shown. b, MSPCs (CD45-Ter-119-CD31-CD140α +Sca-1+) were freshly isolated from paired Ptpn11E76K/+Nestin-Cre+ and Ptpn11+/+Nestin-Cre+ mice at 7–8 months old by FACS. Total RNA was extracted and processed for
RNA-sequencing analyses as described in Methods. The correlation coefficient between the two groups was 0.954, verifying that the method was accurate (left). Genes with more than 2.0 fold increased (in red) or decreased (in green) mRNA levels are shown on the right. Secreted protein factors are indicated. c, HSCs sorted from wild-type C57BL/6 mice were cultured in the presence of IL-1β (10 ng ml-1), CCL3 (20 ng ml-1), CCL4 (20 ng ml-1), or CCL12 (20 ng ml-1). Six days later, cells were collected and analysed for Mac-1+ myeloid cells, F4/80+ macrophages, and CD115+ monocytes by FACS. Data presented are mean ± s.d. of four independent experiments; ***P < 0.001. Source Data for this figure are available online.
© 2016 Macmillan Publishers Limited, part of Springer Nature. All rights reserved.
letter reSeArCH
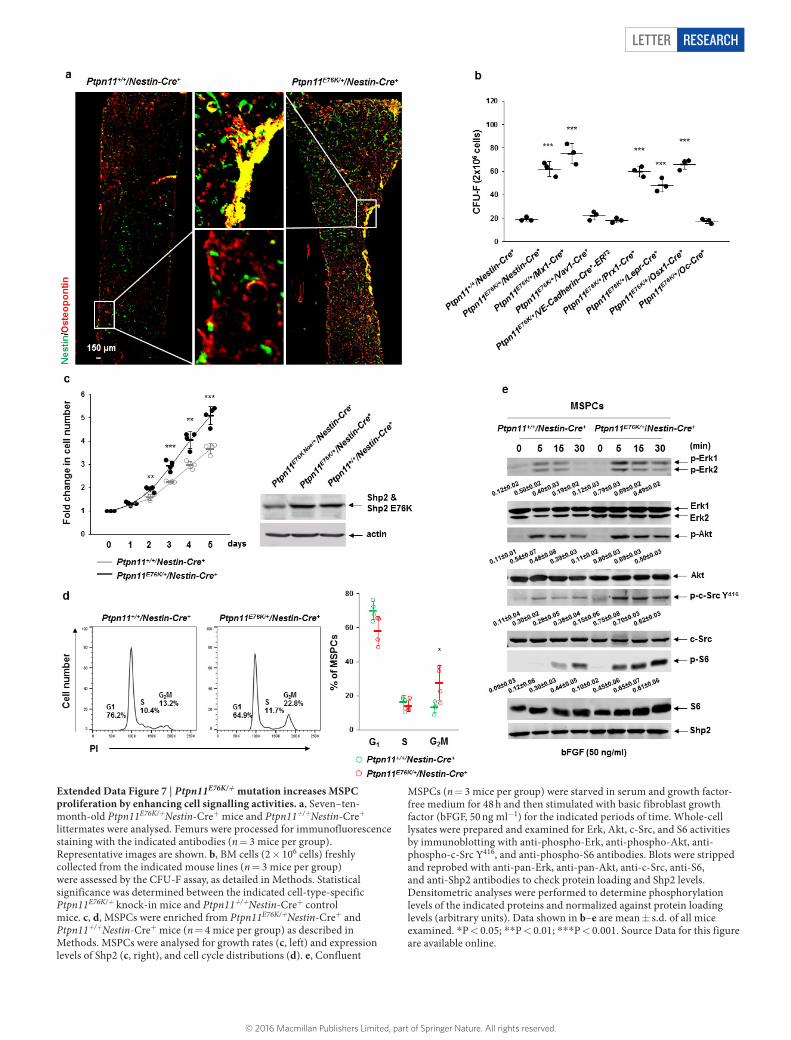
Extended Data Figure 7 | Ptpn11E76K/+ mutation increases MSPC proliferation by enhancing cell signalling activities. a, Seven–ten-month-old Ptpn11E76K/+Nestin-Cre+ mice and Ptpn11+/+Nestin-Cre+ littermates were analysed. Femurs were processed for immunofluorescence staining with the indicated antibodies (n = 3 mice per group). Representative images are shown. b, BM cells (2 × 10⁶ cells) freshly collected from the indicated mouse lines (n = 3 mice per group) were assessed by the CFU-F assay, as detailed in Methods. Statistical significance was determined between the indicated cell-type-specific Ptpn11E76K/+ knock-in mice and Ptpn11+/+Nestin-Cre+ control mice. c, d, MSPCs were enriched from Ptpn11E76K/+Nestin-Cre+ and Ptpn11+/+Nestin-Cre+ mice (n = 4 mice per group) as described in Methods. MSPCs were analysed for growth rates (c, left) and expression levels of Shp2 (c, right), and cell cycle distributions (d). e, Confluent
MSPCs (n = 3 mice per group) were starved in serum and growth factor-free medium for 48 h and then stimulated with basic fibroblast growth factor (bFGF, 50 ng ml-1) for the indicated periods of time. Whole-cell lysates were prepared and examined for Erk, Akt, c-Src, and S6 activities by immunoblotting with anti-phospho-Erk, anti-phospho-Akt, anti-phospho-c-Src Y416, and anti-phospho-S6 antibodies. Blots were stripped and reprobed with anti-pan-Erk, anti-pan-Akt, anti-c-Src, anti-S6, and anti-Shp2 antibodies to check protein loading and Shp2 levels. Densitometric analyses were performed to determine phosphorylation levels of the indicated proteins and normalized against protein loading levels (arbitrary units). Data shown in b–e are mean ± s.d. of all mice examined. *P < 0.05; **P < 0.01; ***P < 0.001. Source Data for this figure are available online.
© 2016 Macmillan Publishers Limited, part of Springer Nature. All rights reserved.

letterreSeArCH
Extended Data Figure 8 | Ptpn11E76K/+ MSPCs recruit monocytes, but not macrophages, to the vicinity. a, Bone sections (one section per femur or tibia) prepared from Ptpn11E76K/+Prx1-Cre+ (n = 4 mice) and Ptpn11+/+Prx1-Cre+ mice (n = 3 mice) at 6–7 months old were immunostained with the indicated antibodies and counterstained with DAPI. b–d, Bone sections (one section per femur or tibia) prepared from Ptpn11E76K/+Nestin-Cre+ and Ptpn11+/+Nestin-Cre+ mice at 7–10 months old were immunostained with the indicated antibodies and
counterstained with DAPI (n = 5 mice per group) (b). The distance of HSCs (Lin–CD48–CD41–CD150+) from closest CD31+CD144+ endothelial cells was determined (n = 8 mice per group) (c). The spatial relationship between HSCs (Lin-CD41-CD150+) and megakaryocytes (CD41+) was examined. HSCs within < 8 μ m of megakaryocytes were considered as close to megakaryocytes (n = 5 mice per group) (d). Representative images are shown in all panels.
© 2016 Macmillan Publishers Limited, part of Springer Nature. All rights reserved.
letter reSeArCH
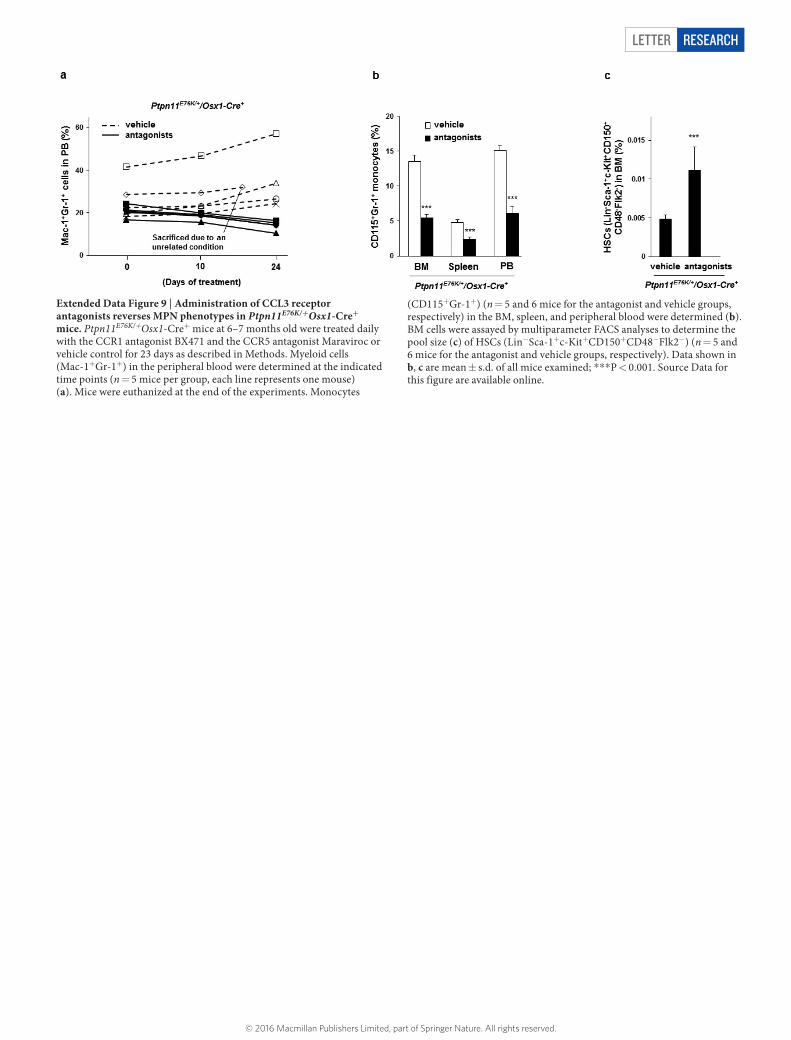
Extended Data Figure 9 | Administration of CCL3 receptor antagonists reverses MPN phenotypes in Ptpn11E76K/+Osx1-Cre+ mice. Ptpn11E76K/+Osx1-Cre+ mice at 6–7 months old were treated daily with the CCR1 antagonist BX471 and the CCR5 antagonist Maraviroc or vehicle control for 23 days as described in Methods. Myeloid cells (Mac-1+Gr-1+) in the peripheral blood were determined at the indicated time points (n = 5 mice per group, each line represents one mouse) (a). Mice were euthanized at the end of the experiments. Monocytes
(CD115+Gr-1+) (n = 5 and 6 mice for the antagonist and vehicle groups, respectively) in the BM, spleen, and peripheral blood were determined (b). BM cells were assayed by multiparameter FACS analyses to determine the pool size (c) of HSCs (Lin-Sca-1+c-Kit+CD150+CD48-Flk2-) (n = 5 and 6 mice for the antagonist and vehicle groups, respectively). Data shown in b, c are mean ± s.d. of all mice examined; ***P < 0.001. Source Data for this figure are available online.
© 2016 Macmillan Publishers Limited, part of Springer Nature. All rights reserved.
letterreSeArCH
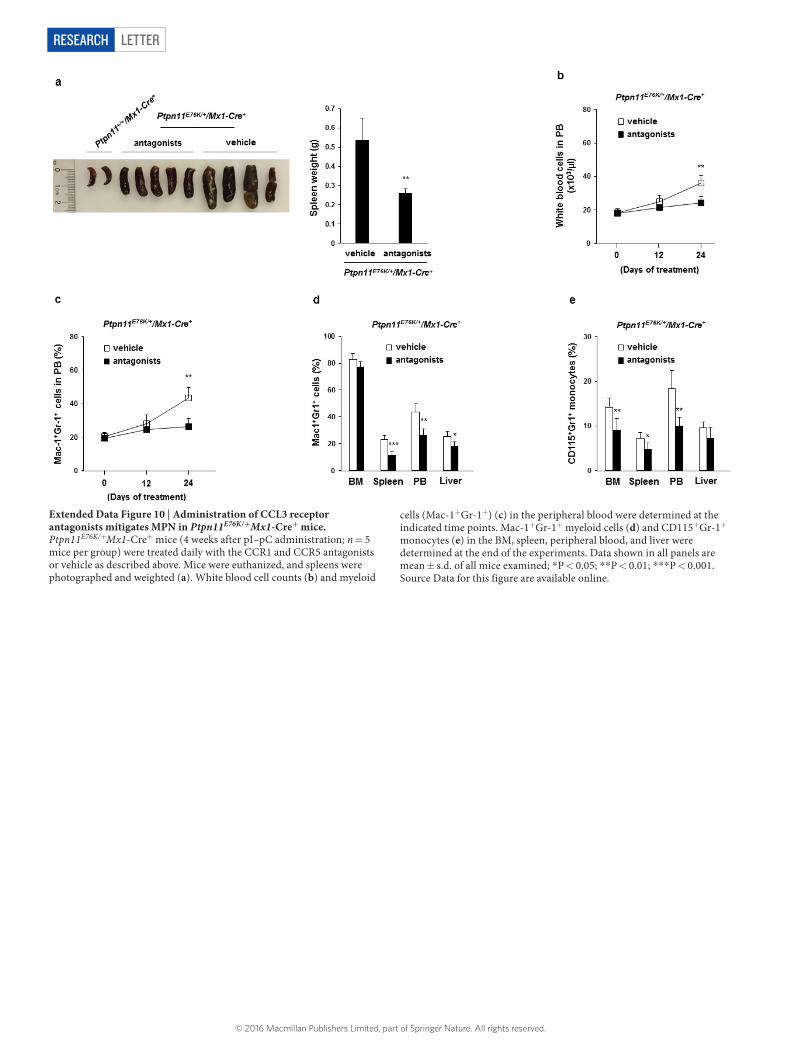
Extended Data Figure 10 | Administration of CCL3 receptor antagonists mitigates MPN in Ptpn11E76K/+Mx1-Cre+ mice. Ptpn11E76K/+Mx1-Cre+ mice (4 weeks after pI–pC administration; n = 5 mice per group) were treated daily with the CCR1 and CCR5 antagonists or vehicle as described above. Mice were euthanized, and spleens were photographed and weighted (a). White blood cell counts (b) and myeloid
cells (Mac-1+Gr-1+) (c) in the peripheral blood were determined at the indicated time points. Mac-1+Gr-1+ myeloid cells (d) and CD115+Gr-1+ monocytes (e) in the BM, spleen, peripheral blood, and liver were determined at the end of the experiments. Data shown in all panels are mean ± s.d. of all mice examined; *P < 0.05; **P < 0.01; ***P < 0.001. Source Data for this figure are available online.
© 2016 Macmillan Publishers Limited, part of Springer Nature. All rights reserved.