leveraging data, tech and analytics to improve collections
TRANSCRIPT

Leveraging data, technology and next best action analytics to improve your collections

Speakers
Andy Beddoes
Consultant
Experian
Christine Pratt
Sr. Analyst
Aite Group
Paul Desaulniers
Sr. Director
Experian

3 © Experian
Christine Pratt
Sr. Credit Industry Analyst
Leveraging Data, Technology and Next Best Action Analytics to Improve Your Collections

4 © Experian
What we will discuss
1. Consumer credit portfolio trends
2. Sea change in debt collections
3. Is there appetite and funding?
4. Final thoughts

5 © Experian
Responses of 20 executives to an Aite Group 2016
survey of the top 50 U.S. retail lending institutions
with the largest consumer portfolio balances
Analysis based on a 2017 Aite Group online and
in-person survey of 41 executives at U.S.
community banks, credit unions, and finance
companies
Executives have extensive business or IT
responsibilities and titles that include president,
CEO, Director, CIO,CRO, and COO
Other information sources include estimates based
on government reports, industry knowledge,
discussions with and solution demonstrations from
vendors, company 10-Ks, and client references
Methodology
Source: Aite Group Survey of 20 credit executives from top 50 U.S. lenders, October 2015 to March 2016
Top 1 to 20 banks with largest
consumer and small-to-midsize
business portfolios
45%Top 21 to 40
banks with largest consumer and
small-to-midsize business portfolios
30%
Top 10 finance companies with
largest consumer credit portfolios
15%
Top 10 credit unions10%
Number of Executive Participants by U.S. Institution Type and Size of Credit Portfolio Balance (N=20)

6 © Experian
• Economy
• Consumer sentiment
• Regulations
• Interest rates
• Risk
• Returns
U.S. consumer credit market on the road to recovery

7 © Experian
No shortage of challenges for consumer lenders

8 © Experian
First signs of real consumer finance portfolio growth appear
Home mortgages70%
Helocs4.5%
Small business4.7%
Auto finance8.5%
Credit cards7.6%
Student loans2.7% Other
1.9%
U.S. Retail Loan Balances by Loan Type, January 2017(N=US$13.0 trillion)
Source: Aite Group analysis of data from Federal Reserve, Small Business Administration, and other industry sources

9 © Experian
Challenges in the numbers: too much work and not enough return
2016 portfolio’s composition very different from and much less profitable than 2005’s
Products 2016 2015 2013 2005
Credit cards 636 640 600 685Auto
finance 82 77 69 66
Mortgage 52 50 60 64
Student 26 28 52 55Home equity 15 16 33 37
Other 73 54 64 9
Total 885 865 878 915
Credit cards72%
Auto finance9%
Mortgage6%
Student3%
Home equity2%
Other8%
Total Number of Accounts in U.S. Retail Loan Portfolio, Year-End 2016 (N=e885 million accounts)
Source: Aite Group estimates

10 © Experian
Consumer loans see increasing delinquency levels
Source: Aite Group analysis of American Bankers Association and U.S. Federal Reserve data
2.9% 2.6% 1.8% 1.4% 1.2% 1.2%
6.3%
3.3%
2.4% 2.3% 2.4% 2.5%
3.3% 3.2%
1.7%1.6%
1.5%
1.8%
2009 2011 2013 2015 2016 2017*
Numbers of Delinquent U.S. Indirect Auto, Credit Card, and Heloc Accounts Shown as a Percentage of Accounts Managed by Regulated
Lenders in 2009, 2011, 2013, 2015, 2016, 2017(Q2)
Helocs Credit cards Indirect auto

11 © Experian
Charge-offs also continue to trend higher
0.120.47
1.79
3.06
2.14
1.461.13
0.50.25 0.2 0.07
3.734.33
6.44
10.5
7.97
4.72
3.913.39
3.03 2.913.46
2006 2007 2008 2009 2010 2011 2012 2013 2014 2015 2016
U.S. Retail Loan Charge-Off Rates as of Q4 in Each Year, 2006 to 2016
Home mortgages All consumer Credit cards
Source: Aite Group depiction of U.S. Federal Reserve Data

12 © Experian
• Digitalization
• Personalization
• Self-serve
• Process revamps
• Cash flow
• Compliance
• Profits
Sea change in collections: Focus on customers, paring back costs

13 © Experian
Lenders turn to alternative data and analytics
33%
13%
40%
53%
53%
93%
8%
15%
15%
15%
58%
50%
Collections
Other
Fraud
Underwriting emergingconsumer segments
Underwriting
Marketing
Q. For which purpose are you using or would you use non-traditional data?
2017 Community Lenders(n=40)
2016 Top Lenders (n=15)
Sources: Aite Group survey of 41 executives from U.S. community FI’s, June 2017 to August 2017, and Aite Group survey of 20 credit executives from top 50 U.S. lenders, October 2015 to March 2016

14 © Experian
10%
5%
25%
35%
17%
38%
40%
33%
15%
15%
28%
13%
5%
22%
2017 CL(N=41)
2016 TL(N=20)
2013 TL(n=18)
Approved or in the budget Very likely Likely Unlikely Very unlikely
Q. Please rate the likelihood that the following technologies would be approved by your institution: a new lending solution delivered in a hosted, SaaS, or hybrid environment.
Key driver: Growing acceptance of new IT delivery options
Sources: Aite Group survey of 41 executives from U.S. community FI’s, June 2017 to August 2017, Aite Group survey of 20 credit executives from top 50 U.S. lenders, October 2015 to March 2016, and Aite Group survey of 20 credit executives from top 50 U.S. lenders, February to June 2013

15 © Experian
IT budgets increasing for collections and for servicing
Sources: Aite Group survey of 20 credit executives from top 50 U.S. lenders, October 2015 to March 2016; Aite
Group survey of 20 credit executives from top 50 U.S. lenders, February to June 2013
10%
11%
15%
40%
28%
20%
37%
2016 (N=20)
2013 (n=18)
2016 (N=20)
2013 (n=19)
Colle
ctions
Se
rvic
ing
Q. What best describes your [2013 or 2016] consumer credit IT budget for each segment below?
Substantive increase from prior year(10% or more in enhancementsor new technology additions)
Modest increase from prior year(less than 10% in enhancementsor new technology additions)

16 © Experian
IT budget increases for data and analytics sought/received
17%
35%
22%
35%
24%
30%
27%
30%
2017 CL (N=41)
2016 TL (N=20)
2017 CL (N=41)
2016 TL (N=20)
Analy
tics
Data
managem
ent
Q. What best describes your [2016 or 2017] consumer credit IT budget for each segment below?
Substantive increase from prior year(10% or more in enhancementsor new technology additions)
Modest increase from prior year(less than 10% in enhancementsor new technology additions)
Sources: Aite Group survey of 41 executives from U.S. community FI’s, June 2017 to August 2017, and Aite Group survey of 20 credit executives from top 50 U.S. lenders, October 2015 to March 2016

17 © Experian
Final thoughts
New borrowers are scarce (and may stay that way),
improved communications’ support for collectors can
contribute to retention
Self-service whether for modifications or payments is a key
enabler of borrower satisfaction, lenders’ cost efficiencies,
and improved recoveries
Regulatory concerns need not overshadow profitability goals,
don’t let the true challenge—lack of demand for loans—get
lost in compliance fine print
Consider using credit risk and rising delinquency for IT budget
justifications: Vendor support is available for new platforms,
for overlays, for data and analytics

18 © Experian
Christine PrattSr. Analyst
[email protected]+1.617.338.6011www.aitegroup.com
Aite (pronounced “eye-tay”) Group is an independent research and advisory firm focused on business, technology, and regulatory issues and their impact on the financial services industry.
Visit us on the web and connect with us on Twitter and LinkedIn.

Improve Collection Performance

20 © Experian
Market ConditionsGreater Payment Stress across all products
• The top 20 card issuers grew portfolio
receivables YOY Q12017 by 6.6% while
growing delinquent receivables (60 days
past due) by 25.4%
• The cost effective management of
delinquent receivables is one of the top
challenges facing CRO’s
• New legislation (CECL, IFRS9) placing
further focus on collections

21 © Experian
Market ConditionsUS Auto Portfolio Dynamics are shifting: Delinquencies are rising
• Chart shows relative growth rates of
portfolios versus 60 DPD balances, YOY
• Combined Q12017 YOY portfolio growth
for top 20 lenders was 7.2%
• 60 day delinquencies grew by 25.4% in
the same period
• 10 of the top 20 US auto lenders 60DPD
receivables have grown at more than
twice the rate of their overall portfolios
• The challenge facing CRO’s is portfolio
growth without credit quality degradation
• Time to take a different approach? Source: Experian File One
Balanced Growth
EquilibriumAverage Top 20 Lenders
Lender’s Relative Portfolio
Size
Credit Quality
deterioration

22 © Experian
Collections professionals globally are concerned These external changes are driving a consistent set of challenges across the globe
Poor quality
contact
information
No effective
way to manage
restrictions on
customer
interactions
Lack of digital
capabilities to
enable
consumer self-
service
Painful
integration
makes it
difficult to
move past
legacy
constraints
Manual
processes
reduce
collector
efficiency
Limited ability
to execute
automated,
individualized
treatments
Experian Voice of Customer Research, March 2017

23 © Experian
Collections: Essential Premise
The essential premise of
collections is that if I can
contact my customer, I can
work with them to provide
debt resolution.

24 © Experian
Right Party Contact Rates in Decline
The essential premise of collections is that if I can
contact my customer, I can work with them to
provide debt resolution.
– Regulatory challenges
– 50% + no landline phone
– Single channel approach to collections
• Collections is overly dependent on single
channel outbound call strategy, with dated
analytics driving customer treatments.
CLIENT X, RIGHT PARTY CONTACT RATE
*Analytical project researching causes of delinquency increase at client X

25 © Experian
How do I improve collection performance in the age of declining RPC rates?
Drive the consumer
to the channel of
communication and
interaction that they
prefer
Consumers demand a frictionless and seamless customer experience

26 © Experian
Elevate Collections into the Digital Age
Gives your clients
a digital communication channel
Manual
Collections Practices
Consumer in the
Digital World
#
No Caller ID
Frictionless Consumer Experience
eResolve™
• Digital (mobile and web)
• Non-threatening
• Resolution-driven
• At convenience of consumer’s place and
time
• Self serve / cost effective
3

27 © Experian11/1/2017 Experian Confidential
999
2017$75.00$300.00
4111111111111111
May
2020
Adam K Fellow

28 © Experian
To truly transform your collections
results you have to build your
strategies around the consumers
preferences.
But Digital is only the last mile ....

29 © Experian
Traditional (25 year old) approach to segmentation
1 Immediate high intensity outbound calling
2 Call day 1; medium / high intensity
3 Call day 1; medium intensity
4 Call day 1; low intensity
5 Leave to self-cure; call day 5, low intensity
6 Leave to self-cure; letter day 5, call day 10
7Leave to self-cure; letter day 10; call day
20
8 Leave to self-cure; letter day 20
Bala
nce
Risk score

30 © Experian
Collections is a complex process in transition
Consumers are conditioned to
expect easy, frictionless
experiences.
Traditional contact centre
tactics are less effective.
Offering great customer
experiences, at scale, is a
tremendous challenge.
Regulatory oversight for
collections has increased and
continues to unfold.
Regulations are complex,
particularly regulations around
customer interactions.
Penalties for violations are
increasing in severity.
Profitability is critical for all
firms so there is a sharp focus
on costs and efficiency.
Collections is a high touch
process and firms look to cut
staff and increase automation.
More regulatory oversight has
resulted in higher costs.
Consumer preferences Regulatory compliance Cost pressure
Mobile (US Adult Population)
87% have a mobile phone.
71% of Mobile phones are
smart phones
52% of Smart Phone owners
with a bank account have used
mobile banking
22% of mobile phone owners
have made a mobile payment
in last 12 months
Market Dynamics

31 © Experian
…by addressing key challenges facing collections teams we can make personalized collections a reality
Data
Analytics
Decisions
Execution
Blending customer information with credit,
behavioural, demographic and emerging data sets
enable a detailed customer view
Predictive models that inform decision making on the
basis of risk, behaviour, propensity, and overall
customer experience
Automated systems that use enriched data, analytics,
and collections policy rules to make decisions that
drive customer interactions or treatments
Systems and tools that support the collections
process by facilitating customer contact, negotiate,
and settlement

32 © Experian
Gain insights
Risk
Propensity
Behavior
Regulatory
..then build an effective, customer-centric process focused on an enhanced analytically driven experience
Collector
Enrich customer data
Contact
Credit
Demographic
Emerging
Collection agency Automated
workflow
Self-service
Decide
What’s the next
best action?

33 © Experian
..by using both batch and real-time decision management
11/1/2017 Experian Public
Expanding the scope of analytics through
the collections process
• Eligibility criteria for financial difficulties
programs
– Hardship
– Loan extensions
– Temporary reduced payments
• Settlement offers
• Agency placement optimization
34 © Experian
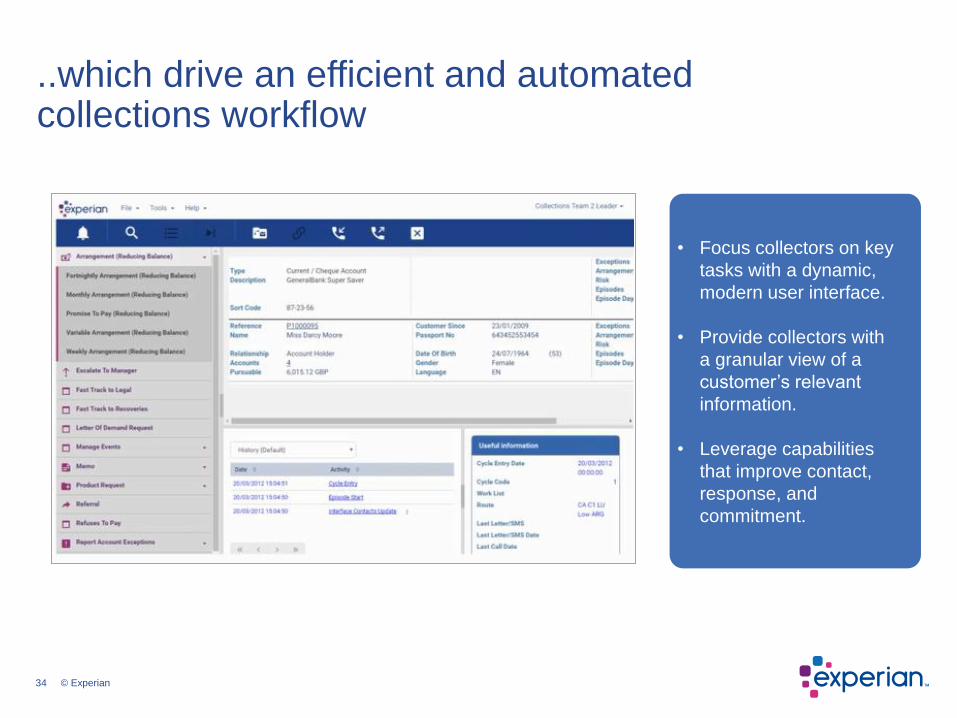
..which drive an efficient and automated collections workflow
• Focus collectors on key
tasks with a dynamic,
modern user interface.
• Provide collectors with
a granular view of a
customer’s relevant
information.
• Leverage capabilities
that improve contact,
response, and
commitment.

35 © Experian
Smarter CollectionsIntegrated ecosystem for collections and customer management
PowerCurve ® Collections
Batch Data• Triggers
• Premier Attributes
• Collections suite
Connectivity
eResolve™
PowerCurve ® Strategy
Management (batch and real
time analytics)
Behavior
history file
Real Time Data • Consumer credit
• Premier Attributes
On us
Off us
Systems
of record
Client
Machine Learning

36 © Experian
Model inputs Model outputsModel intermediary calculations
Conditional / Bayesian
modelling
Paramet
er filters
– e.g.
minimum
# days
since
last
action
Exception identification e.g.
bankruptcy, mortality
Base
Model
Batch
based
scores and
segmentatio
n
ExceptionsExclusion Scores / Reasons Exclusion Reasons
Customer Contact Channel
Preference
Days to Entry / Self Cure /
Holding QueueHolding Queue
Collections Treatment
History
Risk Models (PD, BH
Scores, Roll Rate etc)
Socio – Demographic
Segmentation
Ability to Pay (calculated or
derived)
Outbound Call –
Script / Intensity
SMS / Text
Message
Letter
Self Serve Portal
Probability of Right
Party Contact
Cost of Action
Probability of
Payment
Optimized Next
Best Action
Treatment PossibilitiesData Groups
Next Best ActionAnalytical Framework – Early Stage

37 © Experian
Customer FocusedOptimization in collections mathematically yields the highest value combination of actions
Data and Analytical
InsightCustomers
Thousands/Millions
Lifestyle needs
contact rules
competition
Customer-centric
marketing
ChannelsPreference
Offer/Treatment Timing(Any day/time)
Cross-channel strategy Product profitability
management
Resource efficiency
Maximum mail volume
Inbound capacity
contact history
Product portfolio
ROI hurdles
sales targets
Resource capacity
budgets events
Typical Constraints
Action A
Action B
Action C
Action D
Action E
Action F
1. Mon 5/5
2. Wed 5/7
3. Tue 5/13
4. Mon 6/2
5. Fri 6/6
Optimization Solutions
Data Lake
Customer contact
Channel preference
Collections
treatment history
Risk models (PD,
BH scores, roll rate
etc)
Socio –
demographic
segmentation
Ability to pay
(calculated or
derived)

Recommendations
• To enhance performance, a digital
strategy must be employed
• Better data, advanced analytics, and
automated decisions can now come
together to drive personalized
collections processes
• The customer experience will drive
improved results
