li k d d f t ilinked data for tourism · li k d d f t ilinked data for tourism irem Önder, marta...
TRANSCRIPT
Li k d D f T iLinked Data for Tourism
Irem Önder, Marta Sabou, Adrian M.P. BrasoveanuIrem Önder, Marta Sabou, Adrian M.P. Brasoveanu

How many tourists arrive to the top 3 largest cities of Austria in 2012?g Information needs:
Whi h th t 3 l t iti i A t i ? Which are the top 3 largest cities in Austria? Hard coded: Vienna (population), Graz (population), Salzburg
(population)…. (Wikipedia)(p p ) ( p )
Total arrivals for Austrian cities in 2012 (Vienna, Graz, Salzburg… ) (TourMIS)
2© 2011 MODUL University Vienna

Two data sources
T MISTourMISWikipedia as Linked Data
Vienna: city in Austria Vienna: city in Austria

Top 3 Austrian Cities’ Total Arrivals in 2012
5000000
6000000
4000000
5000000
2000000
3000000
0
1000000
Vienna Salzburg Innsbruck
4© 2011 MODUL University Vienna

Do the arrivals have similar trend with GDP ofDo the arrivals have similar trend with GDP of source markets?
TourMIS World Bank
© 2011 MODUL University Vienna
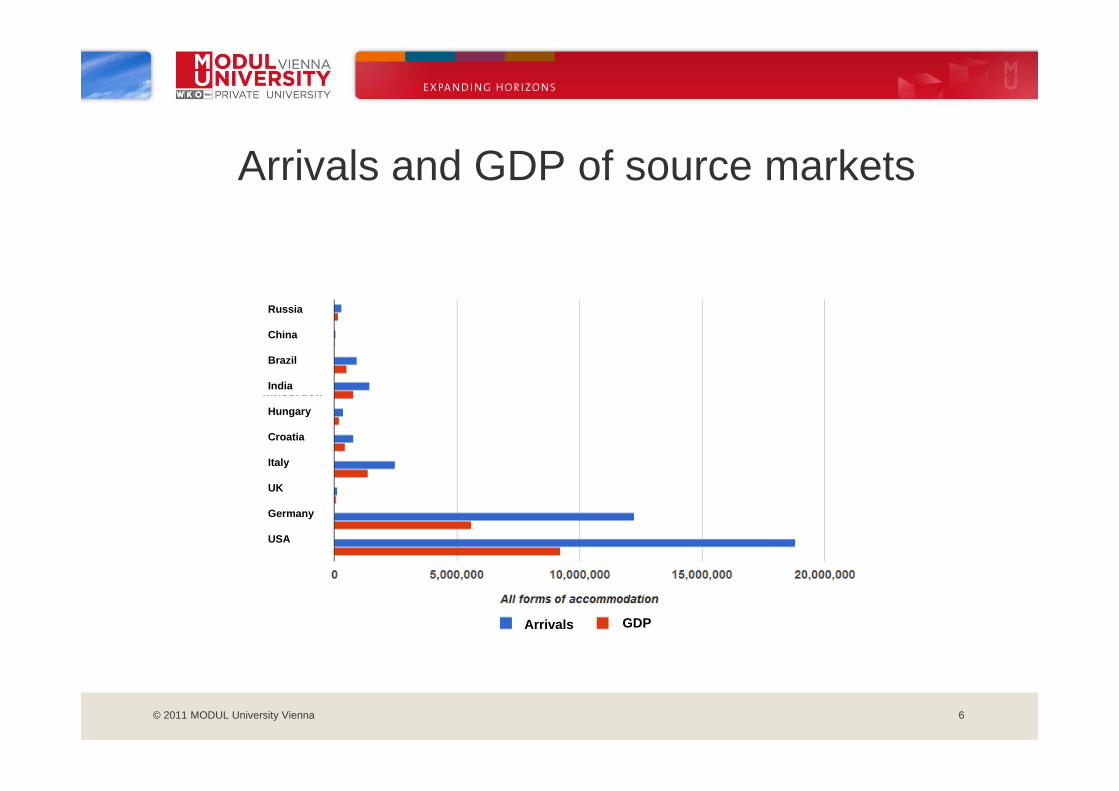
Arrivals and GDP of source markets
R iRussia
China
Brazil
India
Hungary
Croatia
Italy
UKUK
Germany
USA
Arrivals GDP
6© 2011 MODUL University Vienna

Linked Data
A set of technologies to say that:
Entity in Database 1 TourMIS#Wieny
“IS THE SAME AS”IS THE SAME AS
Entity in Database 2 DBPedia#Vienna
so that machined can perform more
Entity in Database 2
… so that machined can perform more intelligent tasks by THEMSELVES.
7© 2011 MODUL University Vienna

8© 2011 MODUL University Vienna

Sept ‘11Linked Data: May ‘07Web 2.0
Sept. ‘11
Media
Publications
eGovernment
C D iCross-Domain
GeographicLife
Sciences
< 31 Billion Triples Source: http://lod-cloud.net

Li k d D t t MODULLinked Data at MODUL(2012)(2012)
10© 2011 MODUL University Vienna

Use Case - Tourism Decision Making
Types of decisions Predict future demand for tourism services Benchmarking cities, regions, countries Predicting new markets
Planning ne infrastr ct re etc Planning new infrastructure etc
Decisions involve: Combining tourism statistics from different sources
thus benefiting form extended coverage
Combining tourism statistics with other types of indicators (e.g., sustainability indicators)

Tourism Indicators
Source Markets
Capacity
Arrivals
Destination
Bednights
Destination

Tourism indicator providers
UNWTO Eurostat WorldBank TourMIS
Country Y Y Y N
Destination N N N Y
Year Y Y Y Y
Month N Y N Y
Access xls/pdf Xls/csv/pdf/ Xml/xls/API APIAccess xls/pdf Xls/csv/pdf/ spss
Xml/xls/API API
Open (but not yet Linked) Data

Difficult Data Integration
Critical for supporting decision makers BUT hampered both at syntactic and semantic level
Syntactic: mostly open data, BUT offered using different syntactic formats that require offered using different syntactic formats that require
substantial effort for integration (e.g., especially when extracted from pdf files ..)
Semantic: Semantic: Different geographic granularity Measurements at different time intervals Different ways to measure the same indicator None of these differences are explicit in a machine format =>
need an analyst to understand and combine the dataneed an analyst to understand and combine the data
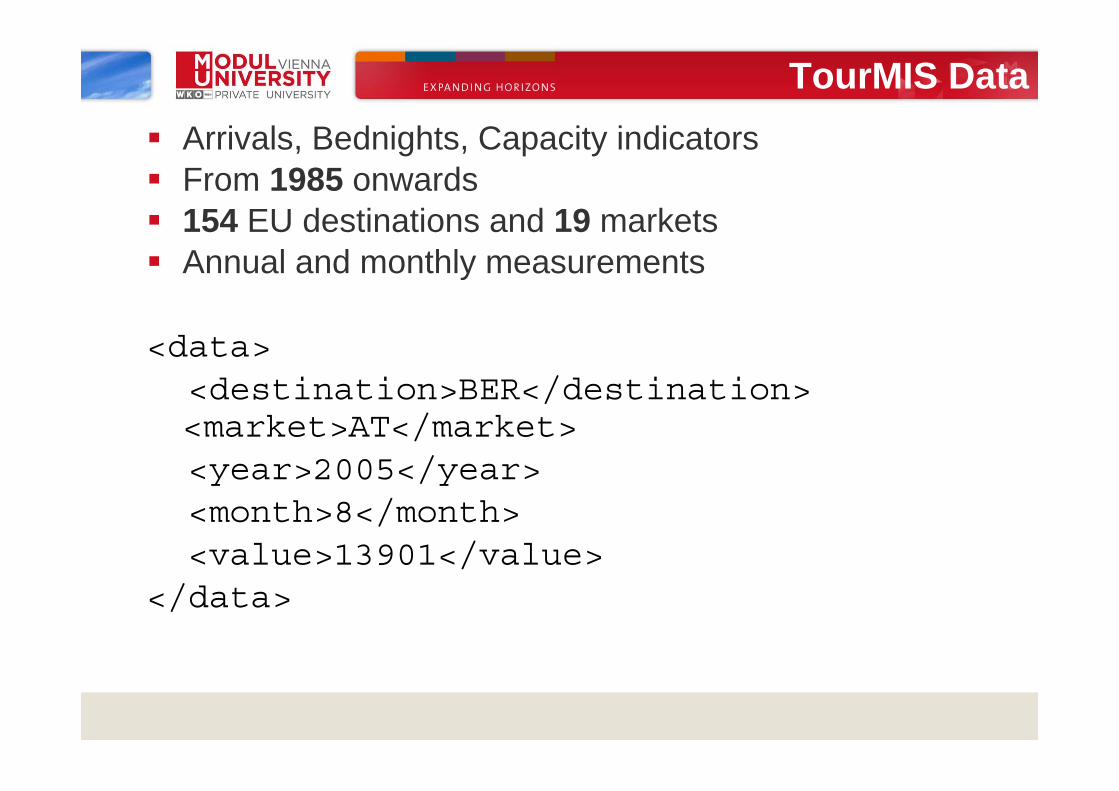
TourMIS DataA i l B d i ht C it i di t Arrivals, Bednights, Capacity indicators
From 1985 onwards 154 EU destinations and 19 markets 154 EU destinations and 19 markets Annual and monthly measurements
<data><destination>BER</destination><destination>BER</destination> <market>AT</market><year>2005</year> y y<month>8</month> <value>13901</value>
</data>

Ontology


~1 million triples Data subset contains:
1586 Arrivals measurements, 1985-2012, all destinations, annual values,1586 Arrivals measurements, 1985 2012, all destinations, annual values, total market
9989 Bednights measurements, in 2005, all destinations, all markets, monthly values
107 Capacity measurements, 2007, all destinations, annual


So what?
A data access infrastructure to solve syntactic differences and foster data integration (done)differences and foster data integration (done) Links allow easy integration of data from DBpedia
Links allow harvesting new (missing data) g ( g ) e.g., get destination‘s country from Dbpedia (done) Harvest additional details
S i ll f f l ifi i f Semantics allow for a formal specification of measurement details and therefore help solve semantics differences (work in progress)semantics differences (work in progress)

Next Steps
Exposing Tourism Indicators as High Quality Linked Data (ETIHQ)
Ontology
• More sophisticated ontology • Simplified publishing
HTML
gy
• Simplified publishing• More Data• More Links
I d d hb d
TourMIS D2RApplication
• Improved dashboard
DBpedia GeoNames


Linked Tourism Data ProjectCities
Markets
Year:
Data source:•TourMIS•World Bank•UNWTO•UNWTO
Indicators:•Bednightsg•Arrivals•Capacity•Occupancy•GDP•Unemployment rateUnemployment rate•Inflation

Take Home Message
Linked Data: Interlinked (intelligent) data
TourMISLOD - first tourism L(O)DTourMISLOD first tourism L(O)D
24© 2011 MODUL University Vienna

Thank you for your attention!
Questions????
25© 2011 MODUL University Vienna