libqual+™ origins, design, interpretation la calidad en las bibliotecas conferencia palma de...
TRANSCRIPT

LibQUAL+™Origins, Design, InterpretationLa Calidad en las Bibliotecas
ConferenciaPalma de Mallorca13-14 January 2005
Fred HeathVice Provost and Director, University of Texas
Libraries

Why Assessment?Why Assessment?
““In an In an age of accountabilityage of accountability, there is a , there is a pressing need for an effective…process to pressing need for an effective…process to evaluate and compare research libraries.” evaluate and compare research libraries.”
124 Association of Research Libraries 124 Association of Research Libraries (ARL) alone, over (ARL) alone, over $3.2 billion dollars$3.2 billion dollars were expended in 2000/2001were expended in 2000/2001
500 LibQUAL+ participants in Lib500 LibQUAL+ participants in Lib QUAL+QUAL+
Note. M. Kyrillidou and M. Young. (2002).ARL Statistics 2000-01. Washington, D.C.: ARL, p.5.

The Challenge of Assessmentin Libraries1. Traditional statistics emphasize inputs,
expenditures, acquisitions, holdings, etc.2. Help funding agencies understand success of
their investments3. No demonstrable relationship between
expenditures and service quality—spending money is not enough….
4. Lack of metrics describing outcomes: how can we measure success from the user’s point of view
5. Need to redesign library services to better meet changing patterns of use

Libraries Remain a Libraries Remain a Credible Resource in Credible Resource in
2121stst Century Century
Note. Digital Library Federation and Council on Library and InformationResources. (2002). Dimensions and Use of the Scholarly Information Environment.
98% agree with statement98% agree with statement, “My … library , “My … library contains information from credible and contains information from credible and known sources.”known sources.”

Changing BehaviorsChanging Behaviors
Note. Digital Library Federation and Council on Library and InformationResources. (2002). Dimensions and Use of the Scholarly Information Environment.
Recent Survey:Recent Survey:Only Only 15.7% agreed with the statement15.7% agreed with the statement “The “The Internet has not changed the way I use the Internet has not changed the way I use the library.”library.”

Library Use SummaryLibrary Use SummaryLibQUAL+ Spring 2003 Survey – UT Austin AggregateLibQUAL+ Spring 2003 Survey – UT Austin Aggregate

Library Use SummaryLibrary Use SummaryLibQUAL+ Spring 2003 Survey – UT Austin AggregateLibQUAL+ Spring 2003 Survey – UT Austin Aggregate
“Googleization”Users and funders alike canbegin to wonder about therelevance of libraries

“…everyone in class tried to get those articles on line and some people didn’t even bother to to to the stacks when theycouldn’t Google them.” Graduate Student NYT Online 6/21/04 (Katie Hafner, “Old search engine in the
the library tries to fit into a Google world”)

Facilities Usage: University of TexasFacilities Usage: University of TexasEntrance Statistics - UT Austin Libraries 1991-2003Entrance Statistics - UT Austin Libraries 1991-2003
0
1,000,000
2,000,000
3,000,000
4,000,000
5,000,000
6,000,000

Printed Book Circulation: All ARL Printed Book Circulation: All ARL LibrariesLibraries
Note. M. Kyrillidou and M. Young. (2002).ARL Statistics 2000-01. Washington, D.C.: ARL, p.7.

Research Behavior: Research Behavior: Personal ControlPersonal Control
When searching for When searching for printprint journals for journals for research:research:
Note. Digital Library Federation and Council on Library and InformationResources. (2002). Dimensions and Use of the Scholarly Information Environment.
• Only 13.9% ask a librarian for assistanceOnly 13.9% ask a librarian for assistance• Only 3.2% consider consulting a librarian a preferred Only 3.2% consider consulting a librarian a preferred way of identifying information way of identifying information

Reference Decrease: All ARL LibrariesReference Decrease: All ARL Libraries
Note. M. Kyrillidou and M. Young. (2002).ARL Statistics 2000-01. Washington, D.C.: ARL, p.7.
Web-savvy users wish to be able to negotiateWeb-savvy users wish to be able to negotiate the information labyrinth on their own termsthe information labyrinth on their own terms

Searches for Online Journals: University of Searches for Online Journals: University of TexasTexasUT Austin Libraries 2002-2004 MonthlyUT Austin Libraries 2002-2004 Monthly
0
10,000
20,000
30,000
40,000
50,000
60,000

Web Usage: University of TexasWeb Usage: University of TexasTotal File Requests - UT Austin Libraries 2000-2003Total File Requests - UT Austin Libraries 2000-2003
0
100,000,000
200,000,000
300,000,000
400,000,000
500,000,000
600,000,000
700,000,000
800,000,000
900,000,000
2000 2001 2002 2003
Total Hits

Enter LibQUAL+: A response to
1.The necessity of assessment2.Rapid shifts in information-seeking
behavior3.The reallocation of resources from
traditional services into technology-enabled inquiry

LibQUAL+™ Goals
1.Improve mechanisms and protocols for evaluating libraries
2.Develop web-based tools for assessing library service quality
3.Identify best practices in providing library service
4.Support libraries seeking to understand changes in user behavior
5.Assist libraries seeking to re-position library services in the new environment

LibQUAL+™ Outcomes
1.Securing information that contributes meaningfully to planning and improvement efforts at a local level
2.Providing analytical frameworks that institutional staff can apply without extensive training or assistance
3.Helping decision-makers understand success of investments
4.Finding useful inter-institutional comparisons

PERCEPTIONS SERVICE
“….only customers judge quality;
all other judgments are essentially
irrelevant”
Note. Zeithaml, Parasuraman, Berry. (1999). Delivering quality service. NY: The Free Press.
The LibQUAL+™ Premise
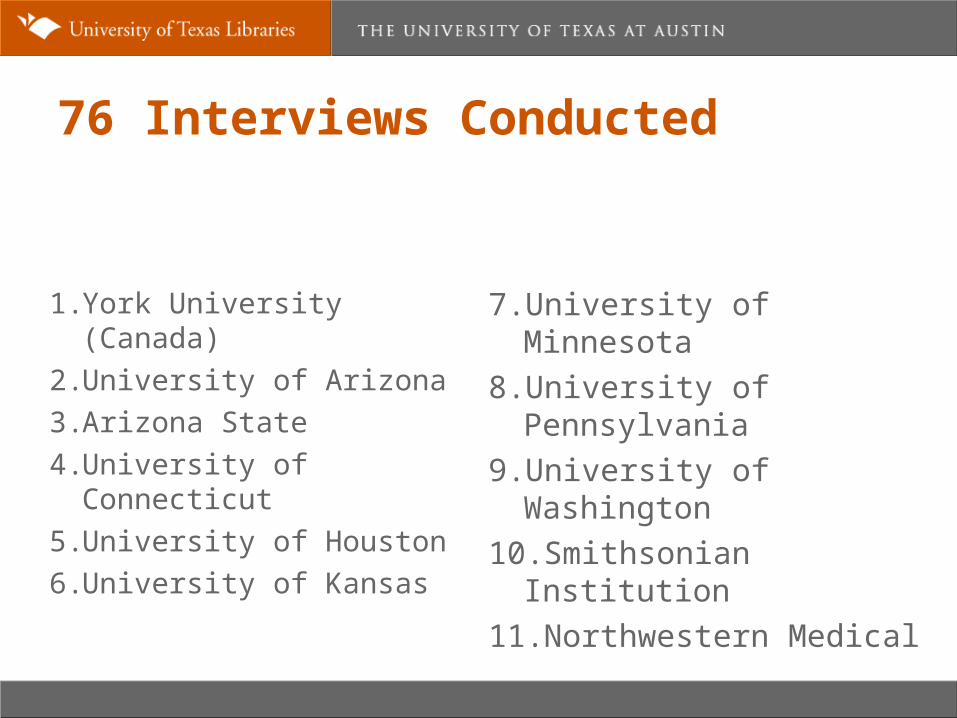
76 Interviews Conducted
1. York University (Canada)2. University of Arizona3. Arizona State4. University of
Connecticut5. University of Houston6. University of Kansas
7. University of Minnesota8. University of
Pennsylvania9. University of
Washington10.Smithsonian Institution11.Northwestern Medical

LoadedPT:P1:01xxxxxxxxxxxxxx.txt,S:\Admin\Colleen\ServQual Interviews\TEXT Only\01xxxxxxxxx.txt (redirected: c:\zz\atlasti\fred
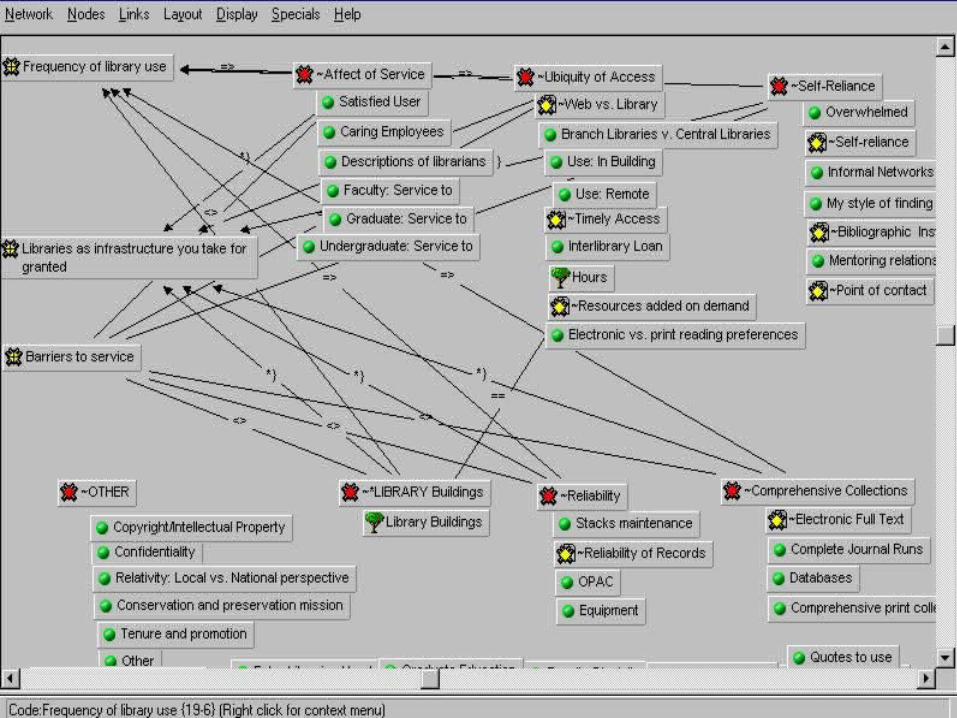
Atlas Ti

13 LibrariesEnglish LibQUAL+™ Version
4000 Respondents
QUAL
QUAN
QUAL
QUAL
QUAN
QUAL
PURPOSE DATA ANALYSIS PRODUCT/RESULTDescribe library environment;build theory of library service quality from user perspective
Test LibQUAL+™instrument
Refine theoryof service quality
Refine LibQUAL+™instrument
Test LibQUAL+™instrument
Refine theory
Unstructured interviewsat 8 ARL institutions
Web-delivered survey
Unstructured interviews at Health Sciences and the Smithsonian libraries
E-mail to surveyadministrators
Web-delivered survey
Focus groups
Content analysis:(cards & Atlas TI)
Reliability/validityanalyses: CronbachsAlpha, factor analysis,SEM, descriptive statistics
Content analysis
Content analysis
Reliability/validity analyses including Cronbachs Alpha,factor analysis, SEM, descriptive statistics
Content analysis
VignetteRe-tooling
Iterative
Emergent2000
2004315 Libraries English, Dutch, Swedish,
German LibQUAL+™ Versions160,000 anticipated respondents
LibQUAL+LibQUAL+™™ ProjectProject
Case studies1
Valid LibQUAL+™ protocol
Scalable process
Enhanced understanding of user-centered views of service quality in the library environment2
Cultural perspective3
Refined survey delivery process and theory of service quality4
Refined LibQUAL+™instrument5
Local contextual understanding of LibQUAL+™ survey responses6

LibQUAL+™ Participants
12
43
164
316
204
0
50
100
150
200
250
300
350
2000 2001 2002 2003 2004

“22 items”
Access to Information
Access to Information
Information Access
Self-RelianceProvision of Physical Collections
Information Control
Personal ControlReliabilityLibrary as Place
Library as PlaceLibrary as PlaceLibrary as PlaceReliability
Service AffectService AffectAffect of Service Affect of Service
22-items25-items56-items41-items
2003200220012000

Validity Correlations
Validity Correlations Serv_Aff Info_Con LibPlace TOTALperServ_Aff 1.0000 .7113 .5913 .9061 Info_Con .7113 1.0000 .6495 .9029 LibPlace .5913 .6495 1.0000 .8053 TOTALper .9061 .9029 .8053 1.0000ESAT_TOT .7286 .6761 .5521 .7587 EOUT_TOT .5315 .6155 .4917 .6250
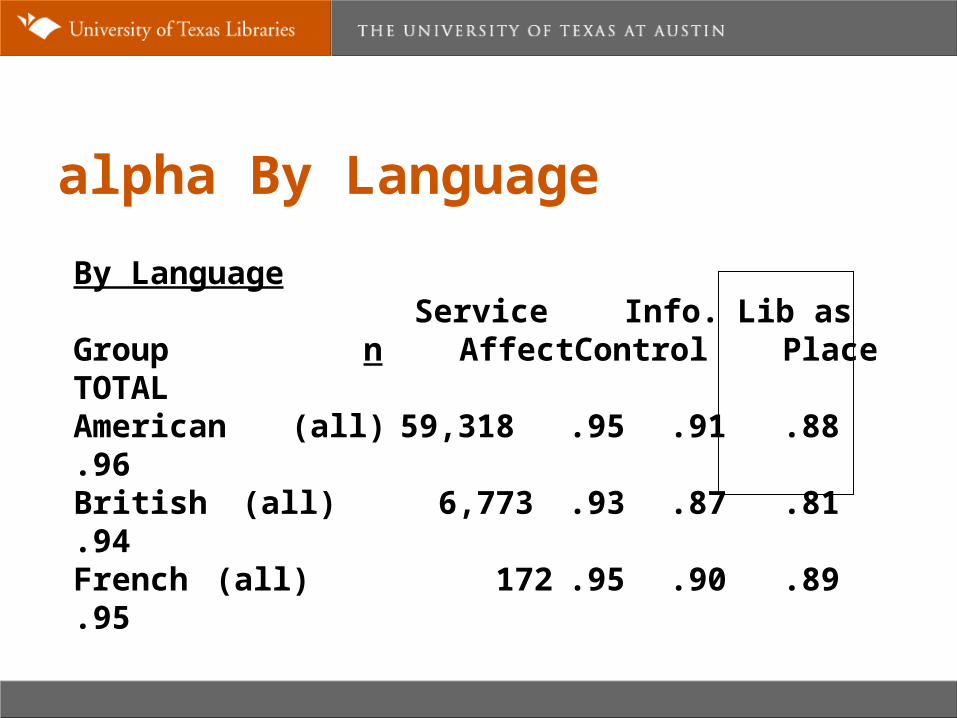
alpha By Language
By LanguageService Info. Lib as
Group n AffectControl PlaceTOTALAmerican (all) 59,318 .95 .91 .88.96British (all) 6,773 .93 .87 .81 .94French (all) 172 .95 .90 .89 .95
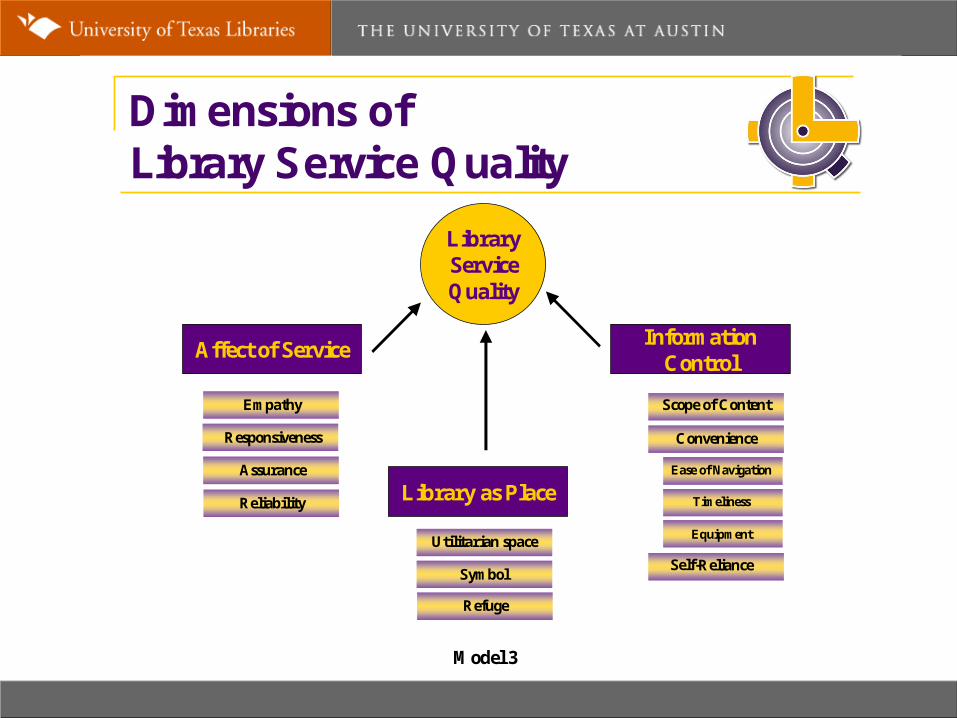
Dimensions ofLibrary Service Quality
Empathy
InformationControl
Responsiveness
Symbol
Utilitarian space
Assurance
Scope of Content
Ease of Navigation
Self-Reliance
Library as Place
LibraryServiceQuality
Model 3
Refuge
Affect of Service
Reliability
Convenience
Timeliness
Equipment

Survey Structure – Page 2

“And a Box”
Why the Box is so Important
– About 40% of participants provide open-ended comments, and these are linked to demographics and quantitative data.
– Users elaborate the details of their concerns.
– Users feel the need to be constructive in their criticisms, and offer specific suggestions for action.

1. Languages
– American English– British English– French– Dutch– Swedish
2. Consortia
– Each may create 5 local questions to add to their survey
3. Types of Institutions– Academic Health
Sciences– Academic Law– Academic Military– College or University– Community College– European Business– Hospital– Public– State
4. CountriesCanada, the
Netherlands, South Africa, Sweden, France, Australia, New Zealand, Malaysia, U.K., U.S.
Rapid Growth in Other Areas

Understanding LibQUAL+ Understanding LibQUAL+ ResultsResults
• Measures the distance between minimally Measures the distance between minimally acceptableacceptable and and desireddesired service quality service quality ratingsratings
• Perception ratings ideally fall within the Perception ratings ideally fall within the Zone of ToleranceZone of Tolerance

LibQUAL+ Survey ToolLibQUAL+ Survey Tool
• Conducted at UT Austin in 2001, 2002 Conducted at UT Austin in 2001, 2002 and 2003, 2004and 2003, 2004
• Web-based survey sent to 1200 faculty, Web-based survey sent to 1200 faculty, 1200 graduate students and 1800 1200 graduate students and 1800 undergraduatesundergraduates
• Participants selected randomly from Participants selected randomly from University email databasesUniversity email databases• 22 questions measuring 22 questions measuring users’ users’
perceptionsperceptions of library service quality of library service quality

LibQUAL+™ 2004 Summary Colleges or Universities –Faculty - American English
(n = 11,755)
Question view Dimension view

Key to Radar Charts

Key to Bar Charts

LibQUAL+™ 2004 Summary Colleges or Universities –Faculty - American English
(n = 11,755)
Negative gap
Positive gap

Institutional Norms for PerceivedMeans on 22 Core Questions
Note: Thompson, B. LibQUAL+ Spring 2002 Selected Norms, (2002).

Access to InformationAccess to Information by Status by StatusLibQUAL+ Spring 2003 Survey – UT AustinLibQUAL+ Spring 2003 Survey – UT Austin
Faculty at Texasless approving of collection quality than students

Library as PlaceLibrary as Place by Status by StatusLibQUAL+ Spring 2003 Survey – UT AustinLibQUAL+ Spring 2003 Survey – UT Austin
Students rate “Libraryas Place” more disapprovingly thanFaculty (size of gap)

Four Dimensions – Four Dimensions – Social Science & PsychologySocial Science & PsychologyLibQUAL+ Spring 2003 Survey – UT AustinLibQUAL+ Spring 2003 Survey – UT Austin
Our Psychology facultydo not rate theiraccess to needed collections approvingly

Trends: Trends: Access to InformationAccess to Information by Status by Status
Faculty
DesMinPer
AI
5.0
5.5
6.0
6.5
7.0
7.5
8.0
8.5
9.0
Year
2001 2002 2003
Graduate
DesMinPer
AI
5.0
5.5
6.0
6.5
7.0
7.5
8.0
8.5
9.0
Year
2001 2002 2003
Undergrad
DesMinPer
AI
5.0
5.5
6.0
6.5
7.0
7.5
8.0
8.5
9.0
Year
2001 2002 2003
Total
DesMinPer
AI
5.0
5.5
6.0
6.5
7.0
7.5
8.0
8.5
9.0
Year
2001 2002 2003
Look forsteadilyimprovingtrajectories

YEAR (REQ.) – defaults to current year of the survey; controls the Master List (dynamic)
Master List of Institutions
All
Clear
• OVERALL – defaults to OVERALL
• Dimension (3)
mindesperadeq sup
SUBMIT
VARIABLES - Default to perceived
Results Page: This page generates a graph, Summary Statistics, Your Statistics, and Norms (including users’ norm values); restates information entered into the form
4 items included in this
drop-down menu
Your List
INSTITUTION TYPE
SAVED LISTS
CONSORTIA
LANGUAGE ADD
ADD
ADD
ADDLanguage (s) will be determined based on
selection (s) from the Master List of Institutions; dynamic
User selects an institution from the Master List, the selection is then added to “Your List”. To avoid duplicate choices, the selection from the Master List will disappear once added to “Your List”.
Other parameters can be added below (institution type, language, consortia, and/or SAVED LISTS).
Consortia, based on
current year; dynamic
1)
2)
SAVEText here stating that this section is optional and may be added to “Your List” to narrow down results.
Text box for user to name and save search parameters
for future searches.
LibQUAL™ Interactive Institutional Statistics
MasterList
Your peer list of institutions

Mean Perceived Scores2001/ 2002 Trend (n=34)
6.0000
6.2000
6.4000
6.6000
6.8000
7.0000
7.2000
6.0000 6.2000 6.4000 6.6000 6.8000 7.0000 7.2000
2001 Da ta
20
02
Da
ta
The very act of administering LibQUAL+™ is beneficial
In Closing
LibQUAL+™ methodology focuses on success from the users point of view (outcomes)
Demonstrates that a web-based survey can handle large numbers; users are willing to fill it out; and survey can be executed quickly with minimal expense
LibQUAL+™ requires limited local survey expertise and resources
Analysis available at local and inter-institutional levels
Many opportunities for using demographics to discern user behaviors

LibQUAL+™ Resources
1.LibQUAL+™ Website:http://www.libqual.org
2.Publications: http://www.libqual.org/publications
3.Events and Training: http://www.libqual.org/events
4.LibQUAL+™ Bibliography:
http://www.coe.tamu.edu/~bthompson/servqbib
5.LibQUAL+™ Procedures Manual: http://www.libqual.org/Information/Manual/index.cfm

LibQUAL+™ Contact Information1. Martha Kyrillidou
Senior Program for Office of Statistics and Measurement
[email protected]. Consuella Askew
LibQUAL+™ Program Specialist [email protected]
3. Amy Hoseth LibQUAL+™ Project Assistant [email protected]
4. Jonathan D. Sousa Technical Applications Development Manager [email protected]

This presentation available at:http://webspace.utexas.edu/fh355/www

Core Questions SummaryCore Questions SummaryLibQUAL+ Spring 2003 Survey – ARL FacultyLibQUAL+ Spring 2003 Survey – ARL Faculty

UT Austin vs. PeersUT Austin vs. PeersLibQUAL+ Spring 2003 Survey – UT AustinLibQUAL+ Spring 2003 Survey – UT Austin