licensed centers and family child care homes
TRANSCRIPT

Rhode Island
Early Learning Council
RHODE ISLAND EARLY LEARNING
WORKFORCE STUDY
January 2014
LICENSED CENTERS AND
FAMILY CHILD CARE HOMES
Erin Oldham and Susy Hawes
Oldham Innovative Research

Oldham Innovative Research 1
The contents of this report were developed under a Race to the Top – Early Learning Challenge grant
from the U.S. Departments of Education and Health and Human Services. However, those contents do not
necessarily represent the policy of the U.S. Departments of Education and Health and Human Services,
and you should not assume endorsement by the Federal Government.
Oldham Innovative Research 2
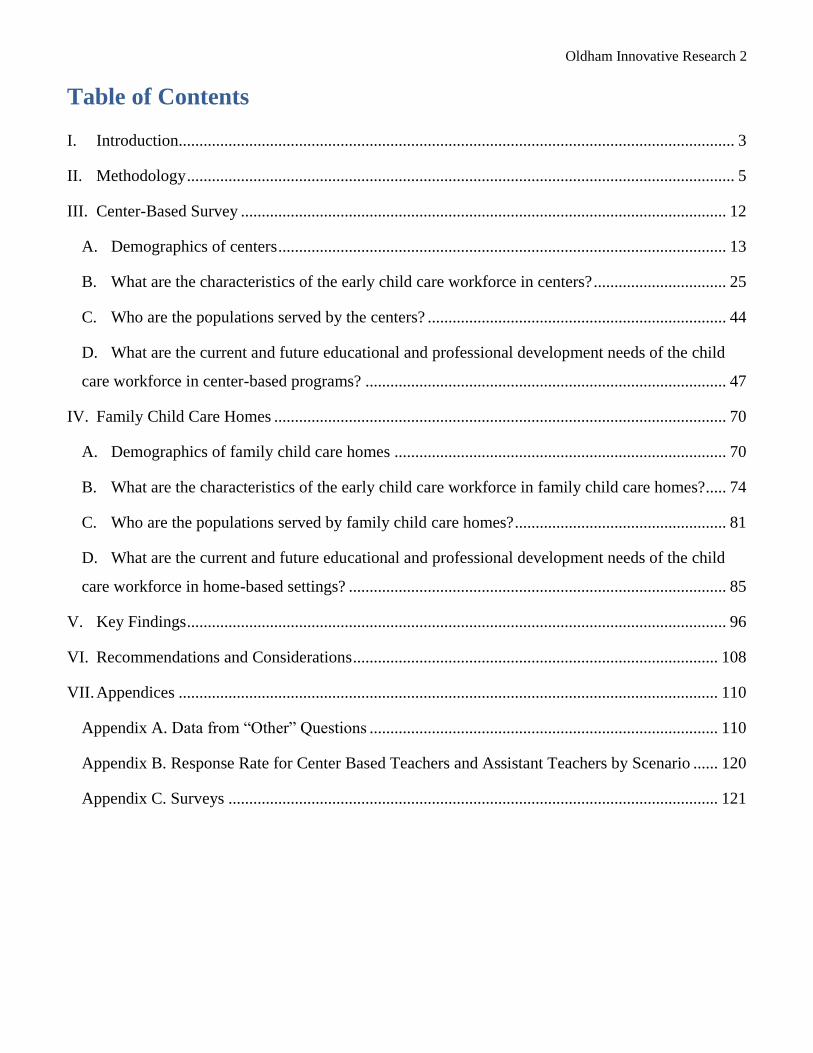
Table of Contents
I. Introduction...................................................................................................................................... 3
II. Methodology .................................................................................................................................... 5
III. Center-Based Survey ..................................................................................................................... 12
A. Demographics of centers ............................................................................................................ 13
B. What are the characteristics of the early child care workforce in centers? ................................ 25
C. Who are the populations served by the centers? ........................................................................ 44
D. What are the current and future educational and professional development needs of the child
care workforce in center-based programs? ....................................................................................... 47
IV. Family Child Care Homes ............................................................................................................. 70
A. Demographics of family child care homes ................................................................................ 70
B. What are the characteristics of the early child care workforce in family child care homes?..... 74
C. Who are the populations served by family child care homes? ................................................... 81
D. What are the current and future educational and professional development needs of the child
care workforce in home-based settings? ........................................................................................... 85
V. Key Findings .................................................................................................................................. 96
VI. Recommendations and Considerations ........................................................................................ 108
VII. Appendices .................................................................................................................................. 110
Appendix A. Data from “Other” Questions .................................................................................... 110
Appendix B. Response Rate for Center Based Teachers and Assistant Teachers by Scenario ...... 120
Appendix C. Surveys ...................................................................................................................... 121

Oldham Innovative Research 3
I. Introduction
The Early Learning Workforce Study was commissioned by the Rhode Island Department of
Human Services (DHS) in context of the larger effort of the Race to the Top-Early Learning Challenge
(RTT-ELC). RTT-ELC aims to improve the quality of early learning programs and to close the
achievement gaps for all Rhode Island children, especially for children with high needs. Rhode Island’s
RTT-ELC grant focuses on improving early learning and development outcomes for young children by
supporting efforts to increase the number and percentage of children enrolled in high-quality early
learning programs. In alignment with the goals of the RTT-ELC, DHS recognizes the importance of an
early learning workforce that is knowledgeable, competent and appropriately credentialed. The charge of
the Early Learning Workforce Study was to conduct an assessment of the individuals employed in the
existing early learning workforce1 in Rhode Island by surveying directors and center staff in child care
centers and family child care educators. Specifically, the study focused on:
1. Child care workforce characteristics of center directors and center staff educators,
2. Child care workforce characteristics of family child care educators,
3. Information about the populations served by centers and family child care educators, and;
4. Current child care workforce education and professional development as well as future needs.
Examining the characteristics of the current early childhood workforce allows Rhode Island’s
DHS to effectively invest state and federal resources and strategies to address the future educational needs
of the workforce based on baseline data. While the State of Rhode Island has conducted surveys in the
past, the Early Learning Workforce Study specifically focuses on the workforce serving children aged
birth to five years to assess and inform the development of effective statewide policies, programs and
initiatives to support individuals working in early learning programs. Such policies, programs and
1 This study focused on licensed centers and family child care homes, including full-day and part-day child care, preschools
and Head Start and Early Head Start programs. This study did not include programs that only work with young children in
public schools, Early Intervention programs or home visiting programs.

Oldham Innovative Research 4
initiatives include, but are not limited to, the provision of TEACH scholarships, the development of the
professional development/technical assistance center (PD/TA) and the BrightStars Quality Improvement
System which works to improve the quality of early learning programs throughout the state. The data
collected for this study provides a “point in time” look at the demographics, credentials, and
compensation of the early care and education workforce. Ongoing data on credentials, compensation and
needed supports will be collected by the Early Care and Education Data System/Workforce Registry and
the Rhode Island Professional Development/Technical Assistant Center’s annual needs assessment.
Findings and recommendations from this report will be shared with the Rhode Island Early Learning
Council and State Agency Representatives to inform policy decisions and professional development
opportunities for the Rhode Island early childhood workforce.

Oldham Innovative Research 5
II. Methodology
Oldham Innovative Research (OIR), an independent research and evaluation company based in
Portland, Maine, was hired to design, conduct and analyze the results of the study. Utilizing a
participatory and utilization-focused approach, OIR worked in close collaboration with Rhode Island’s
Department of Human Services, Department of Education and the Race to the Top-Early Learning
Challenge Workforce Core Team2, with additional input from the Early Learning Council Subcommittee
3,
on the design and development of the Early Learning Workforce Study surveys. In addition, the Core
Team contributed significantly to the process for gathering survey information, including ideas related to
marketing and pilot testing. To address the charge of the study, three distinct surveys were developed: one
survey for center directors, one survey for center staff and one survey for family child care (FCC)
educators. Surveys were developed over a two-month period with multiple rounds of reviews and were
designed to gather detailed information about child care programs, professional development, education,
compensation and supports.
Survey Administration
Once designed, the surveys were piloted with staff at three centers and three family child care
educators. BrightStars staff assisted in identifying pilot participants. After completing the survey, pilot
participants were asked about their understanding of each question. The information gathered through
this semi-structured interview format was used to reword survey questions, as needed, to clarify and
facilitate ease of reading.
2 The Race to the Top- Early Learning Challenge Workforce Core Team (“The Core Team”) is comprised of members from the
core state agencies: Rhode Island Department of Human Services (DHS), Department of Children, Youth and Families
(DCYF), Department of Health (DOH), Executive Office of Health and Human Services (OHHS) and the Rhode Island
Department of Education (RIDE). The Core Team is charged with overseeing the work associated with the RTT-ELC grant. 3 The Early Learning Council Subcommittee is charged with using a data driven approach to understand gaps and barriers and
make policy recommendations to the Early Learning Council around their focus area of the Early Learning Council's Strategic
Plan. The Subcommittee is also responsible for gathering and providing stakeholder input to key related initiatives.

Oldham Innovative Research 6
Administration of the surveys began in August of 2013. Online surveys were first launched with
directors and center staff. Paper surveys were mailed by a survey company. Each center director was
mailed a packet containing one center director survey and 5-30 center staff surveys4. The number of
surveys sent to each director was based on estimates from licensing. Center directors were asked to fill out
the center director survey on paper or online and to distribute the center staff surveys to their staff. The
center staff could return the survey in the envelopes provided or complete the survey online. Some center
directors collected paper surveys from their staff and returned them to the research team. Other center
staff individually mailed the surveys to the research company. Since it was not possible to determine
which centers had Spanish speaking staff that wanted to complete the survey in Spanish, a telephone
number was provided for Spanish speaking staff to complete the center staff survey over the telephone in
Spanish. Since the primary language of licensed family child care educators was available to the research
team, surveys were sent, either via email or in paper format, in either English or Spanish to FCC
educators. In addition, FCC educators were given the option of completing the survey over the telephone
with an English or Spanish speaker.
Throughout the survey administration period, ongoing marketing and outreach efforts were
conducted by the research team and the Core Team. Participants were offered a chance, through a lottery,
to win 1 of 10 gift certificates valued at $250. Routine efforts to increase response rates included: (1)
reminder postcards, (2) multiple email reminders to family child care educators and center directors, (3)
multiple follow-up phone call reminders to directors and center staff, and (4) site visits and reminders
through face-to-face meetings. In addition, center staff surveys were widely distributed at the annual
Rhode Island Early Childhood Conference held in October 2013. Because the initial response rate was
low, it was decided to extend the survey completion deadline twice in order to obtain a higher response
rate. Ultimately, providers were given two full months to complete the surveys. 4 While many center directors who completed the director survey asked their staff to fill out the center staff survey, additional
center staff surveys were completed by other means; for example, center staff were asked to complete the survey at a state
training conference. As a result, it cannot be assumed that the center staff responses included in this analysis all came from
individuals who work at the centers.

Oldham Innovative Research 7
Response Rate
The Rhode Island Department of Children, Youth and Families provided the research team with
the most up-to-date list of all licensed child care centers and family child care educators in the state. This
list formed the basis for the population of programs to be surveyed and was updated and revised
throughout the survey administration process, including while sending paper surveys and making phone
calls. There were 1,147 licensed providers in the original list provided to the research team in July 2013.
Since the focus of the study was on providers who serve children birth to 5 years of age, those providers
who only offer school-age care were removed from the list. In addition, it was discovered that some
programs had closed and that while others were a part of the Rhode Island Comprehensive Community
Action Program (CCAP) they were located outside of the state. These programs were removed from the
list and not included in the response rate calculations. After removing all ineligible providers and
programs, the total sample size for the Early Learning Workforce Study was 959 programs. 295 of these
programs were child care centers and 664 were family child care homes. Of the 295 child care centers,
178 center directors completed the survey5. This is a 60.3% response rate.
Of the 295 child care centers, the survey was administered to between 2,059 and 2,380 center staff
(based on data from the 2013 Kids Count Factbook). 1,042 center staff completed the survey. 78 survey
respondents identified themselves as assistant directors, 138 as education coordinators, 418 as teachers
and 377 as assistant teachers. 31 respondents did not list their position. Of the 964 teachers6 that
completed the survey, the response rate is estimated at between 40.5% and 46.8%.
5 Although 178 center directors completed the survey, 11 surveys did not have enough data to consider them in the analysis.
Analysis of center director surveys was completed with 167 surveys. 6 Teachers in this context includes education coordinators, teachers and assistant teachers but does not include assistant
directors. There is not an estimate of how many assistant directors or directors there are in the state of Rhode Island. Thus, a
precise response rate for this population cannot be determined and is based only on the range of population published in the
2013 Kids Count Factbook.
Oldham Innovative Research 8
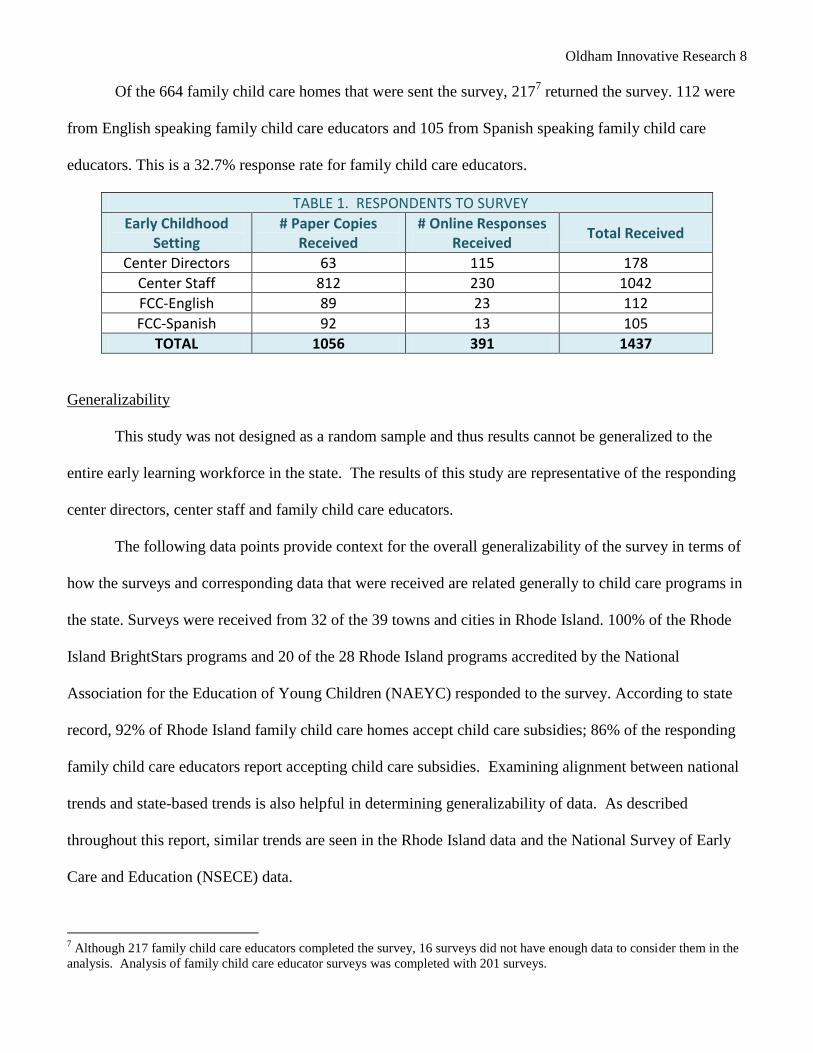
Of the 664 family child care homes that were sent the survey, 2177 returned the survey. 112 were
from English speaking family child care educators and 105 from Spanish speaking family child care
educators. This is a 32.7% response rate for family child care educators.
TABLE 1. RESPONDENTS TO SURVEY
Early Childhood Setting
# Paper Copies Received
# Online Responses Received
Total Received
Center Directors 63 115 178
Center Staff 812 230 1042
FCC-English 89 23 112
FCC-Spanish 92 13 105
TOTAL 1056 391 1437
Generalizability
This study was not designed as a random sample and thus results cannot be generalized to the
entire early learning workforce in the state. The results of this study are representative of the responding
center directors, center staff and family child care educators.
The following data points provide context for the overall generalizability of the survey in terms of
how the surveys and corresponding data that were received are related generally to child care programs in
the state. Surveys were received from 32 of the 39 towns and cities in Rhode Island. 100% of the Rhode
Island BrightStars programs and 20 of the 28 Rhode Island programs accredited by the National
Association for the Education of Young Children (NAEYC) responded to the survey. According to state
record, 92% of Rhode Island family child care homes accept child care subsidies; 86% of the responding
family child care educators report accepting child care subsidies. Examining alignment between national
trends and state-based trends is also helpful in determining generalizability of data. As described
throughout this report, similar trends are seen in the Rhode Island data and the National Survey of Early
Care and Education (NSECE) data.
7 Although 217 family child care educators completed the survey, 16 surveys did not have enough data to consider them in the
analysis. Analysis of family child care educator surveys was completed with 201 surveys.

Oldham Innovative Research 9
Confidence intervals are an additional method to help determine how confident one can be in the
data. For centers, 178 surveys out of 295 were received, for a confidence interval of +/-4.63. This
indicates that the percentages throughout the report are accurate within +/- 4.63 percentage points. For
family child care homes, 217 out of 664 were received, for a confidence interval of +/-5.46. For teaching
staff, 964 out of a conservative estimate of 2,380 were received, for a confidence interval of +/-2.44.
Subgroup Analyses
In key places throughout the report, variables are examined by subgroup. Four key center
subgroups are defined in table 2. The subgroups are: program enrollment, engaged programs, core city
and Head Start.
TABLE 2. DEFINITIONS OF CENTER SUBGROUPS FOR SUBGROUP ANALYSES SUBGROUPS DEFINITIONS OF CATEGORIES AND SAMPLE SIZE (n=sample size)
Program Enrollment Small
1 to 59 children n = 78
Medium 60 to 100 children
n = 36
Large More than 100 children
n = 28
Engaged Programs
Engaged Involved in national
accreditation, BrightStars or the RIDE Program
Approval n = 91
Not Engaged Not involved in national
accreditation, BrightStars or the RIDE Program
Approval n = 75
Core City
Core City Located in Central Falls,
Pawtucket, Providence or Woonsocket
n = 47
Not Core City Not located in Central
Falls, Pawtucket, Providence or Woonsocket
n = 116
Head Start
Head Start Receives Head Start or
Early Head Start funding n = 16
Not Head Start Does not receive Head
Start or Early Head Start funding n = 151

Oldham Innovative Research 10
National Comparisons
In key places throughout the report, comparisons are made between the Rhode Island data
analyzed for this study and data from the National Survey of Early Care and Education (NSECE), a
survey that provides the first nationally representative portrait of early care and education teachers and
caregivers working directly with young children. The NSECE gathered information through four
integrated surveys from individuals and programs providing early care and education in center-based and
home-based settings to children birth through five years, not yet in Kindergarten, and from households
with children birth through less than 13 years. Data were collected for the study in the first half of 2012.
At the time this report was written, the NSECE had yet to analyze the data by region of the country. Even
with the knowledge that it lacked a regional data comparison, the NSECE was determined to be the most
appropriate comparison point for the purposes of this study at the time of analysis. Once the full NSECE
is released, it may include variations by region that may provide valuable information to advance this
study.
Methodological Limitations
Although directors were asked to hand out the survey to their staff, some may not have followed
through with this request. In addition to asking directors to hand out the survey to their staff,
center staff completed the survey at a state training conference. Because of the methodology used
to increase the response rate, it cannot be assumed that all center staff responses can be directly
linked to director responses.
Surveys created for this study were complex and lengthy8. In addition to reporting the overall
response rate, individual sample sizes are included for each question. This is because not every
question was answered by every respondent and some respondents did not complete the surveys.
8 Surveys are included in Appendix C

Oldham Innovative Research 11
Sample size by question varies. Data for each question is based on the total number of
respondents to that question.
Due to space limitations, some survey questions did not include a Not applicable (N/A), or No
responses. This limited some analyses.
The original list of centers to be included in the study contained some centers located out of state
and some that only served school-age. These centers were removed once the databases were
cleaned.

Oldham Innovative Research 12
III. Center-Based Survey
Two surveys were created to gather information from staff at center-based programs: the center
director survey and the center staff survey. The center director survey9 was completed by 178
10 directors
of child care centers. 115 surveys were completed online through Survey Monkey and 63 were completed
on paper. The center staff survey was completed by 1,042 staff; 230 surveys were completed online and
812 were completed on paper. Surveys were received from 78 assistant directors, 138 education
coordinators, 418 teachers and 377 assistant teachers and aides. 31 respondents did not list their position.
Directors were asked to report the number of staff to whom they distributed the center staff
survey. This provided an indication of program sizes and encouraged directors to distribute the survey.
Almost half (47%11
) of the respondents indicated they distributed surveys to 1 to 5 staff members. 23%
distributed surveys to between 6 and 10 staff members; 11% distributed surveys to 11 to 15 staff
members. 19% distributed more than 15 surveys to staff. A range of 1 to 60 surveys was distributed to
staff, with a median of 6 surveys.
9 Once the director had filled out the director survey, they were instructed to give the rest of their staff the center staff survey.
Some organizations with larger infrastructures (e.g. with a CEO) may have had their “directors” fill out the center staff survey. 10 Although 178 center directors completed the survey, 11 surveys did not have enough data to consider them in the analysis.
Analysis of center director surveys was complete with 167 surveys. 11
For ease of reading, data labels have been rounded to the nearest whole number.
78 138
418 377
31
A S S I S T A N T D I R E C T O R
E D U C A T I O N C O O R D I N A T O R
T E A C H E R A S S I S T A N T T E A C H E R
N O R E S P O N S E
CHART 1. RESPONDENTS TO SURVEY

Oldham Innovative Research 13
A. Demographics of centers
Location of Centers
Directors were asked in what town their program is located. The largest number of respondents
work at centers in Providence, Warwick, Johnston, and Pawtucket. In the remainder of the report,
analyses were conducted to determine whether there are differences between the four “core cities” where
child poverty is concentrated (Providence, Pawtucket, Central Falls, and Woonsocket) and the rest of the
state. 47 programs were located in the core cities while the remainder of programs that reported their
location (n=122) were located in other parts of the state.
TABLE 3. CENTER LOCATIONS Location Number of Centers Location Number of Centers
Barrington 2 Lincoln 3
Bristol 1 Middletown 6
Burrillville 1 Newport 3
Central Falls 3 North Kingstown 4
Charlestown 3 North Providence 3
Coventry 5 Pawtucket 11
Cranston 9 Portsmouth 1
Cumberland 3 Providence 28
22% 30%
17% 13%
1 T O 5 6 T O 1 0 1 1 T O 1 5 1 6 T O 2 0
CHART 2. SURVEY DISTRIBUTION TO CENTER STAFF
In charts and graphs… o Head Teachers and Education Coordinators are referred to as Education
Coordinators o Assistant Teachers and Teacher’s Aides are referred to as Assistant Teachers
Oldham Innovative Research 14
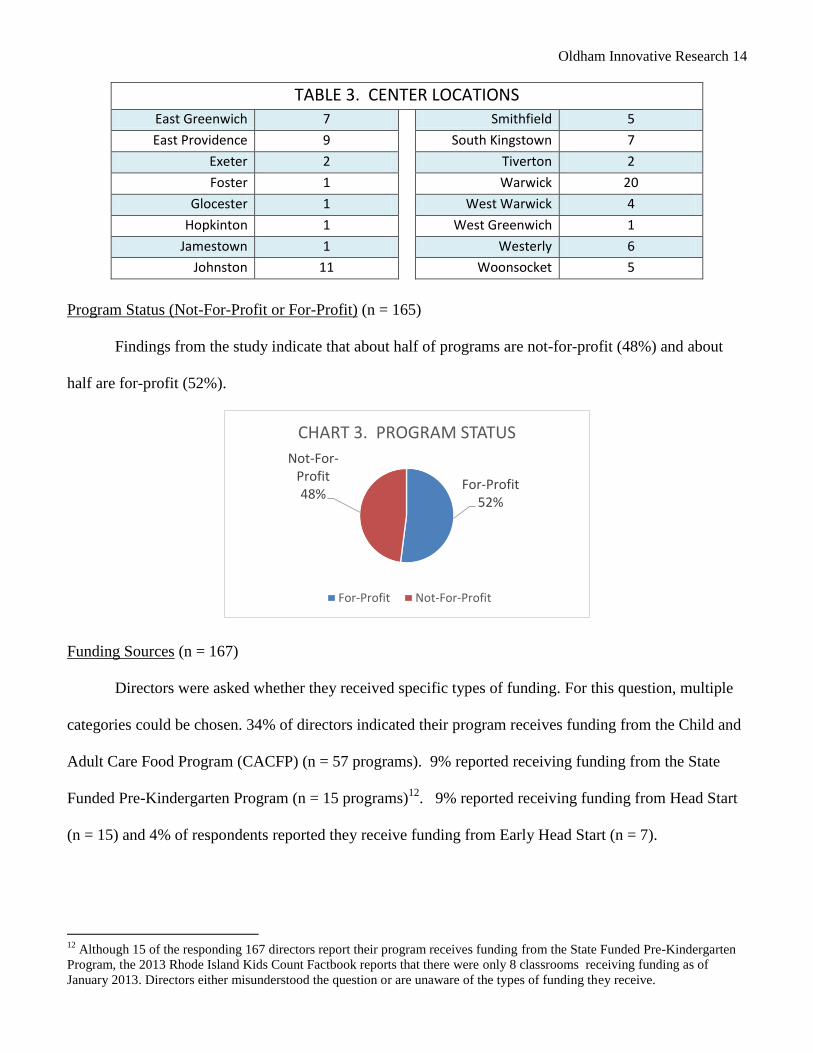
TABLE 3. CENTER LOCATIONS East Greenwich 7 Smithfield 5
East Providence 9 South Kingstown 7
Exeter 2 Tiverton 2
Foster 1 Warwick 20
Glocester 1 West Warwick 4
Hopkinton 1 West Greenwich 1
Jamestown 1 Westerly 6
Johnston 11 Woonsocket 5
Program Status (Not-For-Profit or For-Profit) (n = 165)
Findings from the study indicate that about half of programs are not-for-profit (48%) and about
half are for-profit (52%).
Funding Sources (n = 167)
Directors were asked whether they received specific types of funding. For this question, multiple
categories could be chosen. 34% of directors indicated their program receives funding from the Child and
Adult Care Food Program (CACFP) (n = 57 programs). 9% reported receiving funding from the State
Funded Pre-Kindergarten Program (n = 15 programs)12
. 9% reported receiving funding from Head Start
(n = 15) and 4% of respondents reported they receive funding from Early Head Start (n = 7).
12
Although 15 of the responding 167 directors report their program receives funding from the State Funded Pre-Kindergarten
Program, the 2013 Rhode Island Kids Count Factbook reports that there were only 8 classrooms receiving funding as of
January 2013. Directors either misunderstood the question or are unaware of the types of funding they receive.
For-Profit 52%
Not-For-Profit 48%
CHART 3. PROGRAM STATUS
For-Profit Not-For-Profit

Oldham Innovative Research 15
16 programs reported that they receive Head Start or Early Head Start funding, meaning that six of the
Early Head Start programs also receive Head Start funding. In later analyses, these programs were
compared to those programs that do not receive Head Start funding.
Accreditation Status (n = 167)
Directors were asked if their program is currently NAEYC accredited or seeking accreditation.
16% of respondents (n = 26) indicated their program is seeking NAEYC accreditation. 12% are NAEYC
accredited (n = 20). According to the 2013 Rhode Island Kids Count Factbook, there were 28 licensed
centers that were accredited as of January 2013.
BrightStars (n = 167)
52 programs (31% of programs) reported participating in BrightStars. Of those that participate, 6
out of 10 (62%) programs are at a star level 4 or above. In addition to the star levels reported below, 7
programs are in the process of receiving a star level. The 2013 Rhode Island Kids Count Factbook
indicates that as of January 2013, there were 48 centers participating in BrightStars.
34%
9% 9% 4%
C A C F P S T A T E P R E - K H E A D S T A R T E A R L Y H E A D S T A R T
CHART 4. FUNDING SOURCES

Oldham Innovative Research 16
RIDE Comprehensive Early Childhood Education Program Approval (n = 166)
The data show that 34 programs (21% of programs) participate the Rhode Island Department of
Education (RIDE) Comprehensive Early Childhood Education (CECE) Program Approval.
Engaged Programs (n = 166)
In the report, programs that are engaged in state funded quality initiatives are compared to
programs that are not engaged. Engagement is defined as being a part of either BrightStars, the NAEYC
accreditation process or the RIDE Program Approval. The data show that 91 programs are engaged
according to this definition13
.
Type of Child Care Offered (n = 167)
Directors were asked what type of care their program offers. For this question, multiple categories
could be chosen. The largest number of respondents indicated they provide full-day care (81%) and/or
full-week care (79%). Fewer reported they offer part-day care (72%), full-year care (70%) and/or partial
week care (65%). Fewer offer after school care (49%), before school care (48%), school age care (41%)
13
All Head Start programs except for 2 are included in the “engaged” programs.
9
14
7
5
2
5 Star
4 Star
3 Star
2 Star
1 Star
CHART 5 . B RIG HTSTARS LEVEL
# of respondents at star level

Oldham Innovative Research 17
and/or academic year only care (29%). Few programs offer night/evening care (2%) and/or weekend care
(1%).
From combining key categories, that 64% of programs offer full day, full week, full year care,
55% offer part day, full week, full year care and 55% offer part week, part year care.
81% 79% 72% 70%
65%
F U L L D A Y F U L L W E E K P A R T D A Y F U L L Y E A R P A R T W E E K
CHART 6. TYPE OF CARE OFFERED BY PROGRAMS
49% 48% 41%
29%
2% 1%
A F T E R S C H O O L B E F O R E S C H O O L S C H O O L A G E A C A D E M I C Y E A R O N L Y
N I G H T / E V E N I N G W E E K E N D S
CHART 6A. TYPE OF CARE OFFERED BY PROGRAMS
64%
55% 55%
F U L L D A Y , F U L L W E E K , F U L L Y E A R
P A R T D A Y , F U L L W E E K , F U L L Y E A R
P A R T W E E K , P A R T Y E A R
CHART 7. TYPE OF CARE OFFERED BY PROGRAMS

Oldham Innovative Research 18
15 respondents commented on other types of care they offer; these include:
School vacations and professional development days (3)
Summer Programs (3)
Preschool only (2)
Kindergarten after school (2)
Head Start
Partnership with Family Providers to provide before/after school care
Pre-K State Funded
Backup care
School Calendar
Number of Full-Time and Part-Time Staff14
(n = 144)
Directors were asked how many full and part time15
staff their center employs. Based on the
responses, programs range in size from one staff member to 119. Over 50% of the programs employ 10
or fewer staff. 1 in 3 (30%) employ between 11 and 20 staff members. 19% of responding programs
employ more than 20 staff.
When looking across all programs, what percentage of staff are full time and what percentage is
part time?16
As programs grow in the number of staff they employ, the percentage of full time staff
14
19 respondents did not report the total number of staff in their program. 15 Full time was defined in the survey as 30 hours or more per week and part time was defined as 29 hours or less per week. 16
Paired sample t-test was used to conduct statistical analysis. Sample: Extra Small (n=24), Small (n=37), Medium (n=35),
Large (n=24)
22%
30% 30%
19%
E X T R A S M A L L , 1 T O 5 S T A F F
S M A L L , 6 T O 1 0 S T A F F M E D I U M , 1 1 T O 2 0 S T A F F L A R G E , M O R E T H A N 2 0 S T A F F
CHART 8. TOTAL NUMBER OF STAFF, FULL AND PART TIME

Oldham Innovative Research 19
increases. The smallest programs have more part time than full time staff (57% part time versus 44% full
time) while the larger programs have more full time staff (23% versus 78%).
Hardships Affecting Centers (n = 160)
Survey respondents were asked to select from a list of hardships that affected their center in the
past 12 months. Respondents were most likely to report families being behind on paying their child care
fees (62%) and low enrollment (47%). 4 out of 10 directors said they had to limit or stop purchasing
equipment or materials. Additional hardships that were listed by programs were “sequestration” and
“limited funding”.
TABLE 4. HARDSHIPS AFFECTING PROGRAMS Affected by families behind on paying their child care fees 62%
Affected by low enrollment 47%
Affected by limits or no purchasing of equipment and/or materials
41%
Affected by stagnant salaries 37%
Affected by limits or no support for attending professional development opportunities
31%
Affected by difficulty finding qualified staff 30%
Affected by cutting staff salaries and/or hours 22%
Affected by layoffs 16%
Affected by cutting staff benefits 11%
57% 49% 34%
23%
44
%
51
%
66
%
78
%
E X T R A S M A L L S M A L L M E D I U M L A R G E
CHART 9. FULL T IME VS. PART TIME STAFF BY SIZE OF PROGRAMS
% part time staff % full time staff

Oldham Innovative Research 20
Classroom Closures (n = 147)
When asked if their center had to close any classrooms in the last year, 8 out of 10 directors (82%)
said no. Of the 18% of directors who report their center did close classrooms, the majority (78%) closed 1
classroom. 3 centers closed 2 classrooms. Preschool classrooms were most affected by the classroom
closures; of the 33 classrooms that were reportedly closed, 64% were preschool classrooms.
Subgroup Analyses
The study examined key variables by specific subgroups: (1) Head Start as compared to Non-Head
Start programs, (2) Engaged programs as compared to non-engaged programs (“engaged programs” are
defined as having or pursuing NAEYC accreditation and/or having a BrightStars rating or rating in
process, and/or being engaged in the RIDE Comprehensive Early Childhood Education Program
Approval), (3) Core City (Central Falls, Providence, Pawtucket, and Woonsocket) as compared to Non-
Core City locations and (4) Small (1-59 children), Medium (60-100 children) and large (101+ children)
programs.
Regardless of program size, the most often reported problem was families being delinquent paying
child care fees. The other most commonly reported problems across all programs include: low
enrollment, limits on or an inability to purchase equipment/materials, stagnant salaries, and limited or no
support to attend professional development opportunities.
The following findings detail the most commonly reported hardships by program size.
64%
18% 9% 9%
P R E S C H O O L T O D D L E R S C H O O L A G E I N F A N T
CHART 10. CLASSROOMS AFFECTED BY CLOSURES
Oldham Innovative Research 21
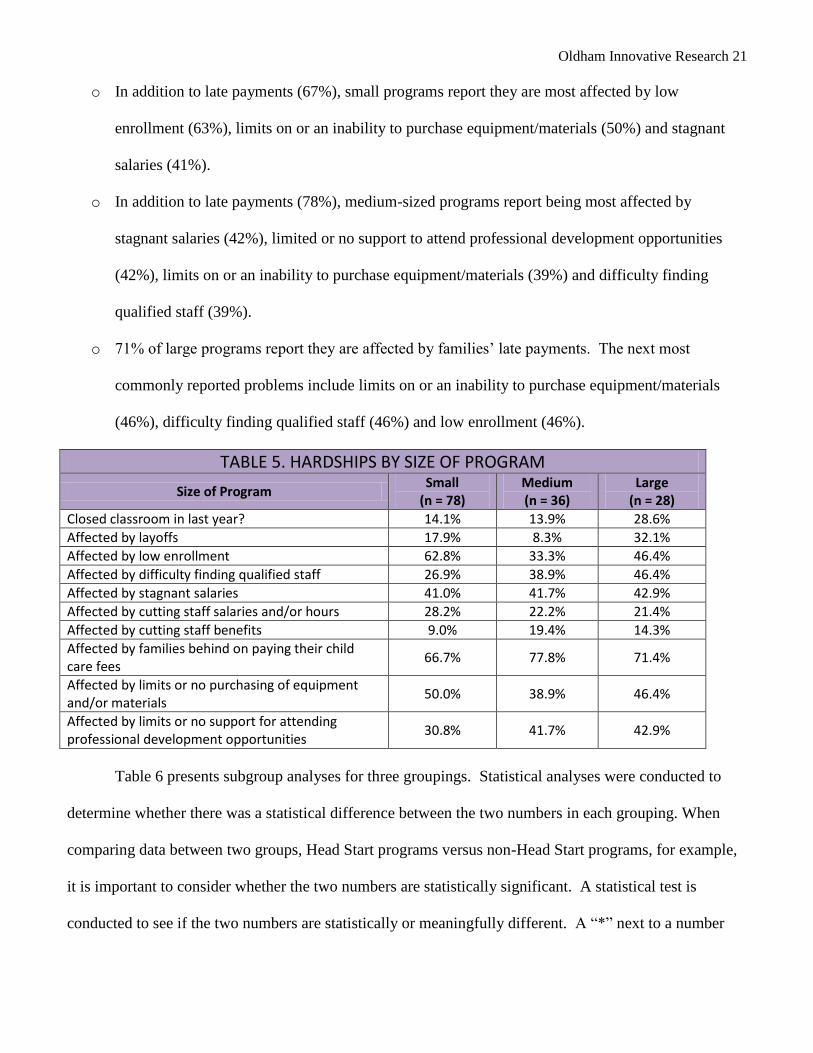
o In addition to late payments (67%), small programs report they are most affected by low
enrollment (63%), limits on or an inability to purchase equipment/materials (50%) and stagnant
salaries (41%).
o In addition to late payments (78%), medium-sized programs report being most affected by
stagnant salaries (42%), limited or no support to attend professional development opportunities
(42%), limits on or an inability to purchase equipment/materials (39%) and difficulty finding
qualified staff (39%).
o 71% of large programs report they are affected by families’ late payments. The next most
commonly reported problems include limits on or an inability to purchase equipment/materials
(46%), difficulty finding qualified staff (46%) and low enrollment (46%).
TABLE 5. HARDSHIPS BY SIZE OF PROGRAM
Size of Program Small
(n = 78) Medium (n = 36)
Large (n = 28)
Closed classroom in last year? 14.1% 13.9% 28.6%
Affected by layoffs 17.9% 8.3% 32.1%
Affected by low enrollment 62.8% 33.3% 46.4%
Affected by difficulty finding qualified staff 26.9% 38.9% 46.4%
Affected by stagnant salaries 41.0% 41.7% 42.9%
Affected by cutting staff salaries and/or hours 28.2% 22.2% 21.4%
Affected by cutting staff benefits 9.0% 19.4% 14.3%
Affected by families behind on paying their child care fees
66.7% 77.8% 71.4%
Affected by limits or no purchasing of equipment and/or materials
50.0% 38.9% 46.4%
Affected by limits or no support for attending professional development opportunities
30.8% 41.7% 42.9%
Table 6 presents subgroup analyses for three groupings. Statistical analyses were conducted to
determine whether there was a statistical difference between the two numbers in each grouping. When
comparing data between two groups, Head Start programs versus non-Head Start programs, for example,
it is important to consider whether the two numbers are statistically significant. A statistical test is
conducted to see if the two numbers are statistically or meaningfully different. A “*” next to a number

Oldham Innovative Research 22
indicates that there is a statistical difference at the p < .05 level17
and “+” indicates there is a statistical
difference at the p < .10 level. If there is no indicator, the difference between the two numbers is not
statistically significant and the numbers should be considered equivalent.
Comparing non-Head Start to Head Start programs, there were two statistically distinct results.
Head Start programs are less likely to have closed classrooms and were not as affected by low enrollment,
reduction of staff salaries and/or hours or by families being delinquent in paying their child care fees.
Please note that while statistical differences were found the number of Head Start programs in the sample
is small.
Engaged programs have been more affected by layoffs than non-engaged programs and less
affected by cutting staff salaries and/or hours. It is possible that engaged programs have chosen to layoff
staff rather than cut salaries or hours.
With one exception, programs in the core cities experience hardships similar to programs in the
remainder of the state. The exception is that programs in the core cities report less difficulty finding
qualified staff.
TABLE 6. HARDSHIPS BY THREE SUBGROUPS Not Head
Start (n =144)
Head Start
(n = 13)
Not Engaged (n = 74)
Engaged (n = 86)
Not Core City
(n=112)
Core City (n = 45)
Classrooms closed 1.8618 1.22* 1.84 1.80 1.83 1.81
Affected by layoffs 15% 31% 9% 22%* 17% 16%
Affected by low enrollment 52% 15%* 55% 43% 49% 51%
Affected by difficulty finding quality staff
32% 23% 28% 34% 35% 22%+
Affected by stagnant salaries 37% 54% 38% 40% 38% 40%
Affected by cutting staff salaries and/or hours
25% 0%* 30% 17%* 25% 20%
Affected by cutting staff benefits
12% 8% 11% 12% 13% 9%
17
P levels help to determine if two numbers are statistically different. When P equals .05 that means there is only a 5% chance
that the two numbers are not statistically different (or a 95% chance that the two numbers are statistically different.) 18
A higher number indicates a higher rate of classrooms closing.

Oldham Innovative Research 23
TABLE 6. HARDSHIPS BY THREE SUBGROUPS Not Head
Start (n =144)
Head Start
(n = 13)
Not Engaged (n = 74)
Engaged (n = 86)
Not Core City
(n=112)
Core City (n = 45)
Affected by families behind on paying their child care fees
68% 31%* 59% 70% 69% 58%
Affected by limits or no purchasing of equipment and/or materials
41% 54% 38% 47% 39% 53%
Affected by limits or no support for attending professional development opportunities
33% 23% 31% 34% 34% 29%
+/* = statistically significant difference
Staff Turnover (n = 67)
Directors were asked if there had been staff turnover at their center in the past year. It was most
common for teachers’ assistants/teachers’ aides to leave centers; 47% of responding directors reported
turnover in teachers’ assistants or aides. It is least common for directors to leave their position; 11% of
directors say there was been turnover in directors in the last year.
As reported by directors, the overall turnover rate for responding centers is 27%. Turnover was
examined by calculating the total number of staff who had left the center in the last 12 months as
11% 13%
41% 47%
30%
89% 87%
59% 53%
70%
Directors Education Coordinators Teachers Teachers Assistants Floaters Substitutes
C H A R T 1 1 . S TA F F T U R N OV E R W I T H I N C E N T E R S
Yes No

Oldham Innovative Research 24
compared to the total number of staff present in the programs that reported turnover. Calculations
included turnover in education coordinators, teachers and assistant teachers combined19
.
Subgroup Analyses
Subgroup analyses indicate that small programs have a statistically significant higher turnover rate
than medium or large programs. However, there are not statistically significant differences between the
turnover rate in the core cities and outside of the core cities or in engaged and not engaged programs20
.
TABLE 7. TURNOVER BY SIZE OF PROGRAM
Small (n = 29) Medium (n = 19)
Large (n = 16)
Turnover Rate 44.0%* 21.4% 16.1%
+/* = statistically significant difference
TABLE 8. TURNOVER BY THREE SUBGROUPS Not Head
Start (n = 65)
Head Start (n = 3)21
Not Core City
(n = 52)
Core City (n = 16)
Not Engaged (n = 32)
Engaged (n = 36)
Turnover Rate NA NA 31.8% 22.1% 31.9% 27.4%
19
Only 67 programs reported on their turnover rates. There were too few programs reporting on each position to reliably
determine turnover rates for each type of teacher. 20
Even though the turnover rates appear different, statistically the two numbers are considered the same. 21
An insufficient number of Head Start programs reported their turnover numbers, thus this data is not reported.
Oldham Innovative Research 25
B. What are the characteristics of the early child care workforce in centers?
The first research question in the early childhood workforce study was “What are the characteristics of
the child care workforce?”. This question examined individual characteristics, employment characteristics
and compensation and benefits.
Demographics of Center Staff
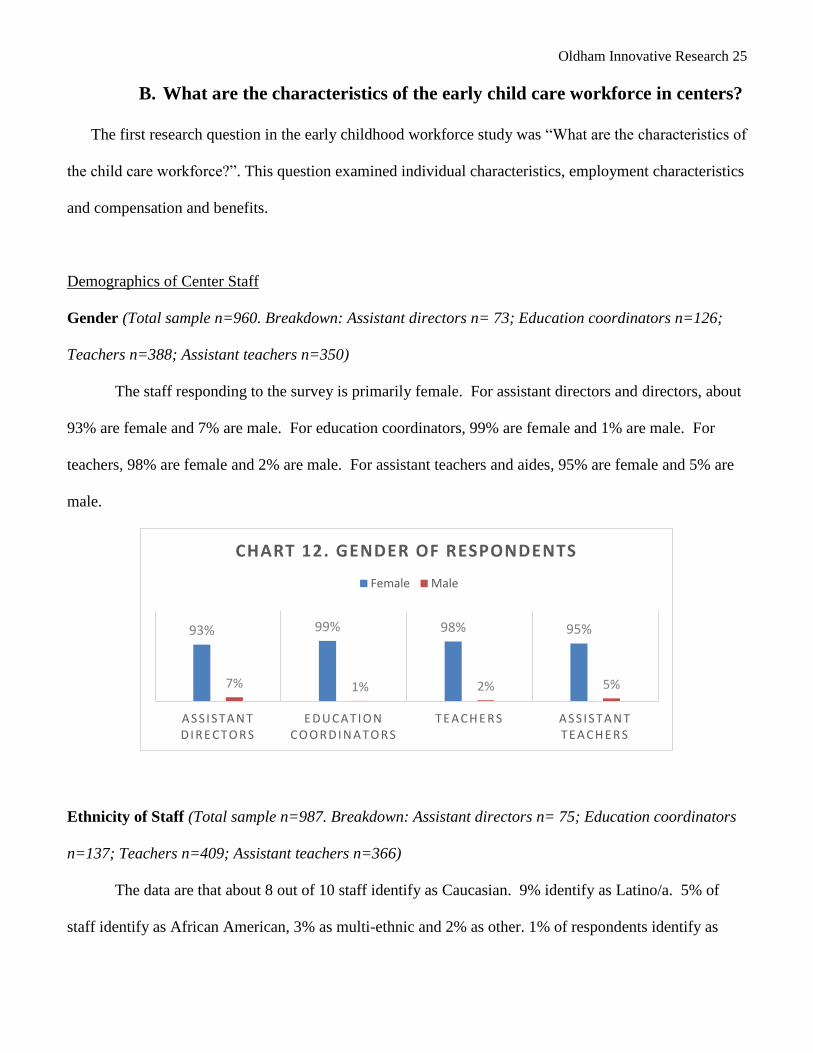
Gender (Total sample n=960. Breakdown: Assistant directors n= 73; Education coordinators n=126;
Teachers n=388; Assistant teachers n=350)
The staff responding to the survey is primarily female. For assistant directors and directors, about
93% are female and 7% are male. For education coordinators, 99% are female and 1% are male. For
teachers, 98% are female and 2% are male. For assistant teachers and aides, 95% are female and 5% are
male.
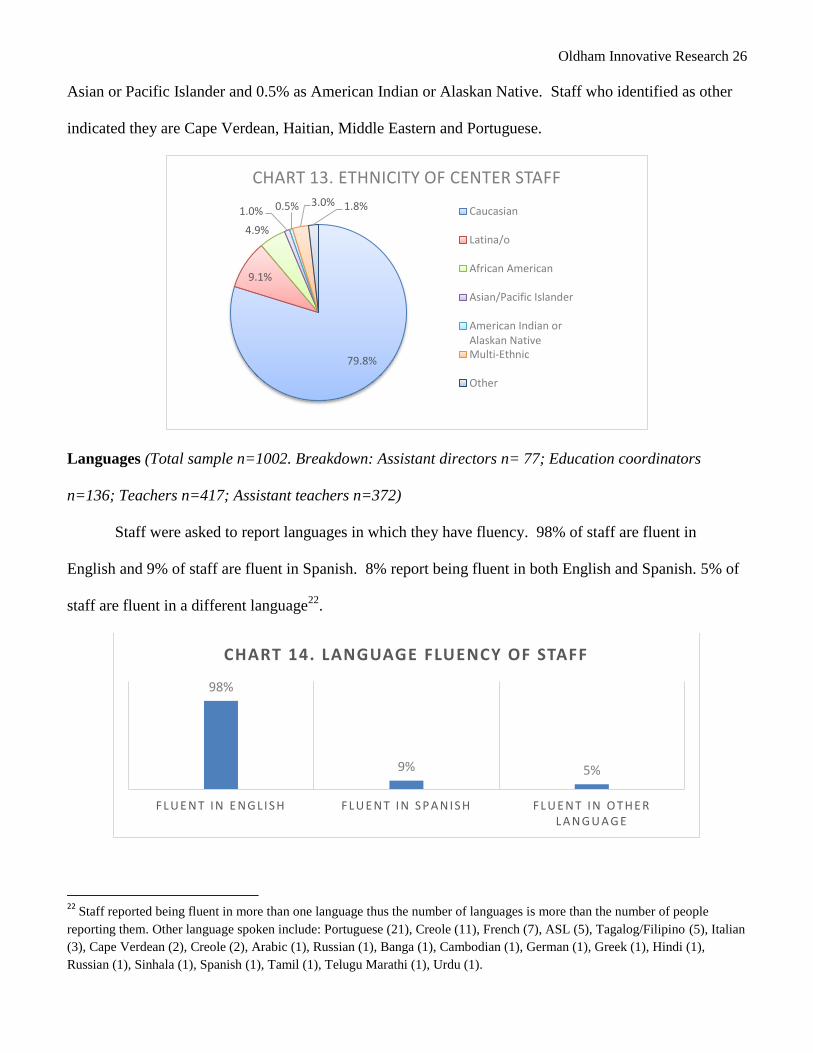
Ethnicity of Staff (Total sample n=987. Breakdown: Assistant directors n= 75; Education coordinators
n=137; Teachers n=409; Assistant teachers n=366)
The data are that about 8 out of 10 staff identify as Caucasian. 9% identify as Latino/a. 5% of
staff identify as African American, 3% as multi-ethnic and 2% as other. 1% of respondents identify as
93% 99% 98% 95%
7% 1% 2% 5%
A S S I S T A N T D I R E C T O R S
E D U C A T I O N C O O R D I N A T O R S
T E A C H E R S A S S I S T A N T T E A C H E R S
CHART 12. GENDER OF RESPONDENTS
Female Male
Oldham Innovative Research 26
Asian or Pacific Islander and 0.5% as American Indian or Alaskan Native. Staff who identified as other
indicated they are Cape Verdean, Haitian, Middle Eastern and Portuguese.
Languages (Total sample n=1002. Breakdown: Assistant directors n= 77; Education coordinators
n=136; Teachers n=417; Assistant teachers n=372)
Staff were asked to report languages in which they have fluency. 98% of staff are fluent in
English and 9% of staff are fluent in Spanish. 8% report being fluent in both English and Spanish. 5% of
staff are fluent in a different language22
.
22
Staff reported being fluent in more than one language thus the number of languages is more than the number of people
reporting them. Other language spoken include: Portuguese (21), Creole (11), French (7), ASL (5), Tagalog/Filipino (5), Italian
(3), Cape Verdean (2), Creole (2), Arabic (1), Russian (1), Banga (1), Cambodian (1), German (1), Greek (1), Hindi (1),
Russian (1), Sinhala (1), Spanish (1), Tamil (1), Telugu Marathi (1), Urdu (1).
79.8%
9.1%
4.9%
1.0% 0.5% 3.0% 1.8%
CHART 13. ETHNICITY OF CENTER STAFF
Caucasian
Latina/o
African American
Asian/Pacific Islander
American Indian orAlaskan NativeMulti-Ethnic
Other
98%
9% 5%
F L U E N T I N E N G L I S H F L U E N T I N S P A N I S H F L U E N T I N O T H E R L A N G U A G E
CHART 14. LANGUAGE FLUENCY OF STAFF

Oldham Innovative Research 27
Age group (Total sample n=1006. Breakdown: Assistant directors n= 74; Education coordinators
n=137; Teachers n=418; Assistant teachers n=377
Staff were asked with which age group they work at their center: infants (birth to 18 months),
toddlers (18 to 36 months), preschoolers (3-5 years) and/or school age children (age 5 and up, including
kindergarteners). The study found that assistant directors and directors work with all ages. 8 out of 10
report working with preschoolers, which likely reflects the population of children served by the center at
which they are employed.
Education coordinators report working with all age groups; the highest percentage of those
reporting (almost 8 out of 10) work with preschool age children. Teachers report working with all ages
with about 6 out of 10 working with preschool age children, a third working with toddlers, a quarter
working with infants and 12% working with school age children. Assistant teachers also report working
42% 57%
84%
51%
A S S I S T A N T D I R E C T O R
CHART 15. AGES WITH WHICH ASSISTANT DIRECTORS ARE WORKING
Infants Toddlers Preschoolers School Age
23
%
23
%
28
%
28
%
33
%
43
%
77
%
59
%
65
%
24
%
12
%
21
%
E D U C A T I O N C O O R D I N A T O R T E A C H E R A S S I S T A N T T E A C H E R
CHART 16. AGES WITH WHICH TEACHING STAFF ARE WORKING
Infants Toddlers Preschoolers School Age

Oldham Innovative Research 28
across all ages with two-thirds working with preschool age children, 43% working with toddlers, 28%
with infants and 21% with school age children.
Employment Characteristics
Hours Worked (Total sample n=988. Breakdown: Assistant directors n= 76; Education coordinators
n=136; Teachers n=410; Assistant teachers n=366)
Staff were asked the number of hours they worked during an average week. Based on guidelines
provided by the Core Team, part time work was defined in the survey as working between 1 and 29 hours.
Those working 30 or more hours were defined as full time. Respondents reported that 91% of assistant
directors and directors, 87% of education coordinators and 92% of teacher are working full time. Fewer
assistant teachers, at 77%, are working full time. Staff working more than 40 hours a week include 17%
of assistant directors, 9% of education coordinators, 6% of teachers and 3% of assistant teachers.
The study examined full year and part year employment. Full year employment was defined
between 48 and 52 weeks, accommodating for vacations. Part year employment was defined between 1
and 47 weeks. Almost 8 out of 10 staff worked full year. The 20% of respondents who report working
part year may be employees of Head Start or similar programs that are only open part year. More than
91% 87% 92% 77%
9% 13% 8%
23%
A S S I S T A N T D I R E C T O R E D U C A T I O N C O O R D I N A T O R
T E A C H E R A S S I S T A N T T E A C H E R
CHART I7. HOURS WORKED IN AVERAGE WEEK
Working Full Time Working Part Time

Oldham Innovative Research 29
other teaching positions, assistant teachers are more likely to work part year; 25% of assistant teachers
work part year as compared to 19% of assistant directors/directors.
National Comparison
The National Survey of Early Care and Education (NSECE) provides comparisons from a national
sample of early care and education teachers. The NSECE study defines full time work as 35 or more
hours. Using this metric, 64% of Rhode Island early care and education staff work full time as compared
to 74% of staff at the national level. Thus, there are more teachers working part time in Rhode Island than
teachers working part time nationally.
81% 77% 78% 75%
19% 23% 22% 25%
A S S I S T A N T D I R E C T O R
E D U C A T I O N C O O R D I N A T O R
T E A C H E R S A S S I S T A N T T E A C H E R
CHART 18. FULL AND PART YEAR WORK
Working Full Year Working Part Year
36%
26%
64%
74%
RI TEACHING STAFF
NATIONAL TEACHING STAFF
CHART 19. FULL AND PART TIME WORK: NATIONAL COMPARISON
Full Time Work Part Time Work

Oldham Innovative Research 30
Length of Employment (Total sample n=1002. Breakdown: Directors n= 165; Assistant directors n=
76; Education coordinators n=138; Teachers n=414; Assistant teachers n=374)
The study examined how long staff had been working at their current employer. Directors were
asked the length of time they have been the director of their program. Half of directors (54%) have
worked as the director of their program for 5 or more years. 12% of directors have worked in their job for
less than a year, a third of directors have worked for 1 to 5 years, 20% from 5 to 10 years, 24% from 10 to
20 years and 10% for more than 20 years.
The study results indicate that assistant teachers are more likely to be newer to their job and have
worked in it for less time than staff in the other positions. Staff in the more senior positions have worked
in their job for longer periods of time. For example, 34% of directors and 46% of assistant directors have
worked in their jobs for 10 or more years, and 15% of assistant teachers have worked in their positions for
10 or more years.
National Comparison
Years of experience for teaching staff, including education coordinators, teachers and assistant
teachers, was compared to results from the NSECE. Teaching staff in Rhode Island have fewer years of
experience as compared to a national sample of teachers. For example, while 23% of national teaching
D I R E C T O R
A S S I S T A N T D I R E C T O R
E D U C A T I O N C O O R D I N A T O R
T E A C H E R
A S S I S T A N T T E A C H E R
12%
9%
13%
16%
24%
35%
18%
33%
38%
44%
20%
26%
21%
19%
17%
24%
24%
25%
21%
12%
10%
22%
8%
6%
3%
CHART 20. LENGTH OF EMPLOYMENT
Less than 1 year 1 to 5 years 5 to 10 years 10 to 20 years More than 20 years
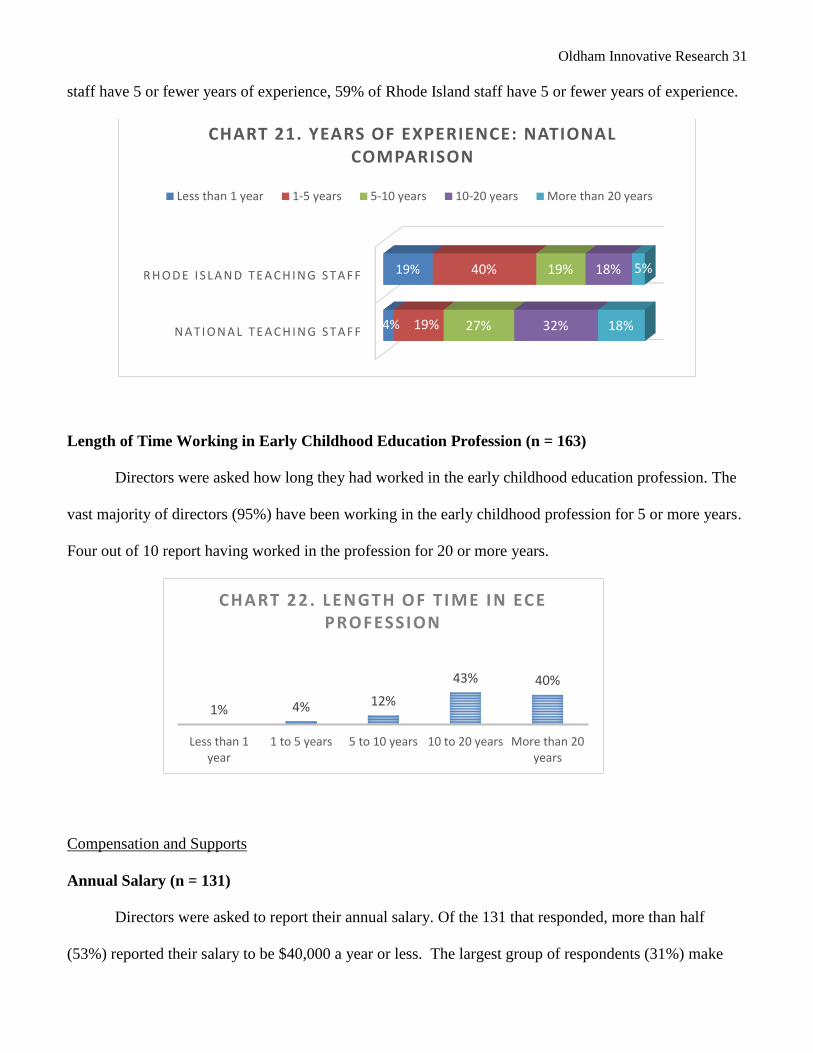
Oldham Innovative Research 31
staff have 5 or fewer years of experience, 59% of Rhode Island staff have 5 or fewer years of experience.
Length of Time Working in Early Childhood Education Profession (n = 163)
Directors were asked how long they had worked in the early childhood education profession. The
vast majority of directors (95%) have been working in the early childhood profession for 5 or more years.
Four out of 10 report having worked in the profession for 20 or more years.
Compensation and Supports
Annual Salary (n = 131)
Directors were asked to report their annual salary. Of the 131 that responded, more than half
(53%) reported their salary to be $40,000 a year or less. The largest group of respondents (31%) make
N A T I O N A L T E A C H I N G S T A F F
R H O D E I S L A N D T E A C H I N G S T A F F
4%
19%
19%
40%
27%
19%
32%
18%
18%
5%
CHART 21. YEARS OF EXPERIENCE: NATIONAL COMPARISON
Less than 1 year 1-5 years 5-10 years 10-20 years More than 20 years
1% 4% 12%
43% 40%
Less than 1year
1 to 5 years 5 to 10 years 10 to 20 years More than 20years
CHART 22 . LENGTH OF T IME IN ECE P ROFESSION

Oldham Innovative Research 32
between $30,001 and $40,000. Fewer respondents reported having an annual salary between $50,001 and
$60,000 (14%) and $60,000 or greater (13%).
Center staff were asked to report their annual salary. 920 staff23
responded to the question.
Salaries are first presented for full time24
staff followed by part time staff. Salaries are in alignment with
the position of staff; assistant directors earn more than teachers and assistant teachers.
For part time staff, annual salaries skew lower25
. For example, 96% of part time assistant teachers
are making $20,000 or less versus 77% of full time assistant teachers. 87% of part-time teachers, 61% of
part-time education coordinators and 57% of part-time assistant directors make $20,000 or less.
23Assistant directors n= 72; Education coordinators n=125; Teachers n=387; Assistant teachers n=366 24
Full time is defined as 30 or more hours. 25
Note that averages for assistant directors are only based on 7 respondents. There were 18 education coordinators, 29 teachers
and 78 assistant teachers reporting annual salaries.
8%
15
% 3
1%
20
%
14
%
13
%
L E S S T H A N $ 2 0 , 0 0 0
$ 2 0 , 0 0 1 T O $ 3 0 , 0 0 0
$ 3 0 , 0 0 1 T O $ 4 0 , 0 0 0
$ 4 0 , 0 0 1 T O $ 5 0 , 0 0 0
$ 5 0 , 0 0 1 T O $ 6 0 , 0 0 0
$ 6 0 , 0 0 1 O R G R E A T E R
CHART 23. ANNUAL DIRECTOR SALARY
6% 8%
13%
38%
16% 12%
24%
39%
23%
34%
46%
22%
27%
19%
10%
2%
11% 15%
2% 0%
8% 9%
2% 0%
9%
3% 3% 0%
A S S I S T A N T D I R E C T O R E D U C A T I O N C O O R D I N A T O R T E A C H E R A S S I S T A N T T E A C H E R
CHART 24. SALARY OF FULL TIME STAFF
Less than $15,000 $15-20,000 $20-30,000 $30-40,000 $40-50,000 $50-60,000 $60,000+

Oldham Innovative Research 33
Hourly Rate (n = 90)
Directors were asked to report the lowest and highest hourly rate of pay for teaching staff at their
center. Of the 90 directors who responded, the lowest average hourly wage for directors was $10.00 and
the highest was $55.17; the lowest for education coordinators was $10.00 and the highest was $33.00; the
lowest for teachers was $8.00 and the highest was $38.00; and for assistant teachers the lowest was $7.50
and the highest was $20.00.
Teaching staff were also asked to report their hourly rate (n = 853). Hourly wages increase as
position responsibilities increase. Mean hourly wages for full time staff ranged from $10.19 for assistant
teachers to $17.40 for assistant directors. Mean hourly wages for part time staff were lower than full time
staff and ranged from $10.03 for assistant teachers to $15.78 for education coordinators.
57%
22%
66%
81%
0%
39%
21% 15% 29%
22% 14%
4% 0% 6%
0% 0%
14%
0% 0% 0% 0% 11%
0% 0% 0% 0% 0% 0%
A S S I S T A N T D I R E C T O R E D U C A T I O N C O O R D I N A T O R
T E A C H E R A S S I S T A N T T E A C H E R
CHART 25. SALARY OF PART TIME STAFF
Less than $15,000 $15-20,000 $20-30,000 $30-40,000 $40-50,000 $50-60,000 $60,000+
$10.00 $10.00 $8.00 $7.50
$55.17
$33.00 $38.00
$20.00
Director Education Coordinator Teacher Assistant Teacher
CHART 26. STAFF HOURLY RATE, RANGE
Lowest Hourly Rate Highest Hourly Rate

Oldham Innovative Research 34
TABLE 9. HOURLY WAGE FOR FULL AND PART TIME CENTER STAFF Mean Hourly
Wage Full time Staff
Sample size (n) for Full time
Staff
Mean Hourly Wage
Part time Staff
Sample size (n)for Part time Staff
Assistant Director (n = 55)
$17.40 48 NA26 7
Education Coordinator (n = 110)
$17.16 92 $15.78 18
Teacher (n = 355) $13.46 324 $11.96 30
Assistant Teacher (n = 333)
$10.19 248 $10.03 81
Subgroup Analyses
Programs reported the highest hourly wage paid to each position within their program. Large
programs report paying the highest wages to directors, education coordinators and teachers.
TABLE 10. MEAN HIGHEST HOURLY WAGE BY SIZE OF PROGRAM Small
(n = 40)27 Medium (n = 22)
Large (n = 15)
Highest director pay rate $21.29 $18.95 $27.30
Highest education coordinator pay rate $18.29 $15.61 $20.93
Highest teacher pay rate $15.06 $14.03 $15.37
Highest assistant teacher pay rate $11.60 $10.77 $11.32
Comparing means of the highest hourly wages between the three subgroups, there are statistically
higher wages being paid by the engaged programs. Programs in the core cities also pay their assistant
teachers a higher pay rate as compared to programs not in the core cities. Otherwise, there are no
statistical differences in the highest paid wage.
Table 11. Mean Highest Hourly Wage of Director by Three Subgroups
Not Head Start
(n = 71)
Head Start (n = 4-6)28
Not Engaged Program (n=35)
Engaged Program (n = 43)
Not core city
(n = 61)
Core city (n = 18)
Highest director pay rate
$21.63 $28.88 $18.44 $24.74* $21.63 $23.50
Highest education coordinator pay rate
$17.65 $24.58 $16.33 $19.60* $17.52 $19.60
26
Estimate is unreliable due to low sample size. 27
The number of programs reporting on each position varied. This is an indication of the average sample size. 28
The sample size for Head Start programs is too small to determine statistical differences between the Head Start and non-
Head Start programs. However, data shows that Head Start pay is higher than non-Head Start programs.

Oldham Innovative Research 35
Table 11. Mean Highest Hourly Wage of Director by Three Subgroups Highest teacher pay rate
$14.53 $19.22 $12.86 $16.36* $14.41 $16.26
Highest assistant teacher pay rate
$11.20 $13.29 $10.69 $11.82* $10.90 $12.57*
+/* = statistically significant difference
National Comparison
Hourly wages in Rhode Island are higher than hourly wages for a national sample of teachers. The
median hourly wage for a full time teaching staff in Rhode Island is $11.92 while the median hourly wage
for the national sample of teachers is $10.60. In addition, hourly wages for preschool teachers are higher
than for infant/toddler teachers. A preschool teacher working full time in Rhode Island makes $13.00 an
hour while an infant/toddler teacher makes $10.50 an hour.
Hourly wages increase with increasing education levels across each category of teacher. Even
when an infant/toddler teacher has a comparable level of education (e.g. a Bachelor’s degree), the teacher
is still paid less than a preschool teacher. Teaching staff across all education levels, except for those with
a Bachelor’s degree, make more than a national sample of teachers with comparable education. A teacher
with a Bachelor’s degree in Rhode Island makes $14.25; a teacher with a Bachelor’s degree in the
national sample makes $14.70.
$1
0.5
0
$1
3.0
0
$1
1.9
2
$9
.30
$1
1.9
0
$1
0.6
0
I N F A N T / T O D D L E R T E A C H I N G S T A F F
P R E S C H O O L T E A C H I N G S T A F F A L L T E A C H I N G S T A F F
CHART 27. HOURLY WAGE FOR INFANT/TODDLER AND PRESCHOOL TEACHERS: NATIONAL COMPARISON
Rhode Island National

Oldham Innovative Research 36
Insurance and Retirement Plans: Program Perspective (n = 166)
Directors were asked what benefits their center provides to full and part time staff. Full time staff
are most likely to be offered paid vacations and holidays (68%), reduced rates for their children to attend
the center (58%), and paid sick leave (55%). Part time staff are most likely to be offered reduced rates for
their children to attend the center (33%), paid holidays (29%), and paid vacations (27%). Comments on
other benefits for staff include: birthday off with pay, extended sick time, and part-time staff can pay into
benefits and vision plans available to full time staff.
$9
.70
$9
.00
$9
.50
$9
.00
$1
0.2
5
$1
0.2
5
$1
0.0
0
$9
.30
$1
0.5
2
$1
2.9
9
$1
2.0
0
$1
1.0
0
$1
3.0
0
$1
5.2
5
$1
4.2
5
$1
4.7
0
I N F A N T / T O D D L E R T E A C H I N G S T A F F
P R E S C H O O L T E A C H I N G S T A F F
A L L T E A C H I N G S T A F F N A T I O N A L T E A C H I N G S T A F F
CHART 28. MEDIAN HOURLY WAGE BY EDUCATION LEVEL FOR FULL TIME INFANT/TODDLER AND PRESCHOOL STAFF:
NATIONAL COMPARISON High School or Less College Credits Associates Degree Bachelors Degree
27
%
29
%
33
%
25
%
8%
68
%
68
%
58
%
55
%
50
%
P A I D V A C A T I O N P A I D H O L I D A Y S R E D U C E D R A T E S F O R C H I L D R E N O F
S T A F F
P A I D S I C K L E A V E H E A L T H I N S U R A N C E
CHART 29. BENEFITS PROVIDED TO STAFF
Part-time staff Full-time staff

Oldham Innovative Research 37
Funding Health Insurance: 93% of programs that offer health insurance to their employees
partially fund the plan such that employees have to pay a portion of the cost. 7% of programs fully fund
the health insurance plan. Employees have to pay anywhere from 10% to 85% of the plan. While
programs most commonly pay 50%29
of the plan, the average percentage paid by the program is 42%.
Funding Dental Insurance: 87% of programs that offer dental insurance to their full time
employees partially fund the dental plan. 13% fully fund the dental plan offered. Employees have to pay
anywhere from 10% to 85% of the plan. Similar to health insurance, programs commonly pay 50% of the
plan’s costs. The average percentage paid by programs is 41%.
Funding the Retirement Plan: 14% of programs fully fund the offered retirement plan.
29
50% was the most commonly report percentage, representing the mode within this set of numbers. The median, 42%, is the
average of all.
10
% 24
%
10
%
14
%
43
%
42
%
40
%
31
%
D E N T A L I N S U R A N C E F I N A N C I A L A S S I S T A N C E F O R
C O L L E G E / P D
R E T I R E M E N T P L A N D I S A B I L I T Y I N S U R A N C E
CHART 29A. BENEFITS PROVIDED TO STAFF
Part-time staff Full-time staff
50%
7%
43%
13% 10% 14%
CHART 30. INSURANCE AND RETIREMENT OFFERED AND FULLY FUNDED
Offered Health Insurance Health Insurance Fully Funded by Program
Offered Dental Insurance Dental Insurance Fully Funded by Program
Offered Retirement Plan Retirement Plan Fully Funded

Oldham Innovative Research 38
Insurance and Retirement Plans: Staff Perspective (n = 986)
Health Insurance: Including all full time center staff responses, three-quarters (76%) report being
offered health insurance. 91% of all staff report having to pay for a part of their health insurance plans.
Assistant directors are less likely to have to pay for a portion of their health insurance plan; 77% of
assistant directors have to pay for some of their plan. Examining part time center staff, 36% are offered
health insurance. Most of those staff (89%) do not use the offered health insurance.
Dental Insurance: As compared to health insurance, fewer full time staff are offered dental
insurance. 65% of all full time staff are offered dental insurance. 84% of full time staff have to pay for
part of the dental insurance and 36% choose not to use the dental insurance offered. 20% of part time
staff is offered dental insurance. The majority of part time staff (86%) do not use the offered dental
insurance.
TABLE 12. INSURANCE OFFERED TO FULL TIME EMPLOYEES
Offered Health
Insurance
Have to Pay for Part of
Health Insurance
Don’t use Health
Insurance Offered
Offered Dental
Insurance
Have to Pay for Part of
Dental Insurance
Don’t use Dental
Insurance Offered
Assistant Directors (n =67)
68.7% 77.4% 31.1% 46.9% 66.7% 32.3%
Education Coordinators (n=117)
76.3% 90.9% 23.3% 65.7% 87.7% 21.9%
Teachers (n=377)
81.1% 93.1% 40.5% 70.2% 86.8% 37.3%
Assistant Teachers (n = 276)
71.1% 91.0% 49.7% 62.8% 81.0% 42.1%
All Staff (n = 837)
76.2% 90.8% 40.1% 65.2% 84.0% 36.1%
TABLE 13. INSURANCE OFFERED TO PART TIME EMPLOYEES
Offered Health
Insurance
Have to Pay for Part of
Health Insurance
Don’t use Health
Insurance Offered
Offered Dental
Insurance
Have to Pay for Part of
Dental Insurance
Don’t use Dental
Insurance Offered
Assistant Directors (n =7)
(28.6%)30 n/a31 (100.0%) (16.7%) n/a (100.0%)
30
Estimates from very small sample sizes are presented in parentheses and are for illustrative purposes only. They are not
accurate estimates. 31
Sample size is too small to present valid estimates

Oldham Innovative Research 39
TABLE 13. INSURANCE OFFERED TO PART TIME EMPLOYEES Education Coordinators (n=18)
(33.3%) n/a (40.0%) (22.2%) n/a (50.0%)
Teachers (n=32)
29.6% n/a (85.7%) 12.5% n/a (60.0%)
Assistant Teachers (n = 83)
40.6% n/a 96.8% 22.9% n/a 100.0%
All Staff (n = 140)
36.2% n/a 88.9% 19.8% n/a 85.7%
Disability and Retirement Plans: 65% of all full time center staff report being offered disability
insurance32
and 91% report being offered a retirement plan. While retirement plans are reported to be
offered equitably across type of staff, disability insurance is reported to offered less to assistant teachers
than to teachers or education coordinators. Many staff reported they do not know if their program offers
disability insurance. 27% of full time center staff report their employer fully funds their retirement plans,
although many staff do not know whether their employer fully funds their retirement plan. Fewer part
time staff are offered disability or retirement plans.
TABLE 14. INSURANCE AND RETIREMENT BY POSITION FOR FULL TIME STAFF
Offered
Disability Insurance
Don’t know if
Program Offers
Disability
Offered Retirement
Plan
Don’t know if
Program Offers
Retirement
Employer Fully Funds Retirement
Plan
Don’t know if
Program Fully
Funds
Assistant Directors (n = 64)
58.9% 8 staff 77.4% 3 staff 10.7% 6 staff
Education Coordinators (n = 114)
70.2% 30 staff 90.9% 12 staff 26.9% 21 staff
Teachers (n = 367) 69.4% 151 staff 93.1% 61 staff 27.2% 98 staff
Assistant Teachers (n = 65)
57.3% 122 staff 91.0% 73 staff 32.6% 81 staff
All Staff (n = 810) 64.9% 311 staff 90.8% 148 staff 27.1% 206 staff
32 Rhode Island has a state-run short-term disability insurance program managed by the Department of Labor and Training. The
majority of private employers/employees are required to participate in this program. In responding to this question, center staff
may have been unaware of this program or misunderstood the question since disability insurance is offered through the state
and not directly by the center.

Oldham Innovative Research 40
TABLE 15. INSURANCE AND RETIREMENT BY POSITION FOR PART TIME STAFF
Offered
Disability Insurance
Don’t know if
Program Offers
Disability
Offered Retirement
Plan
Don’t know if
Program Offers
Retirement
Employer Fully Funds Retirement
Plan
Don’t know if
Program Fully
Funds
Assistant Directors (n = 7) (60.0%)33 2 staff (33.3%) 1 staff 0% 0 staff
Education Coordinators (n = 18)
(50.0%) 4 staff (43.8%) 2 staff 0% 3 staff
Teachers (n = 31) 27.8% 13 staff 23.1% 5 staff 0% 5 staff
Assistant Teachers (n = 81)
29.5% 37 staff 25.0% 30 staff (9.1%) 30 staff
All Staff (n = 137) 34.6% 56 staff 28.0% 38 staff 27.1% 38 staff
Vacation Days, Sick Days and Holiday
14% of all full time staff report having no days of vacation. This includes 22% of assistant
teachers, 9% of teachers, and 6% of education coordinators. About a third of full time staff (36%) have
more than 10 days of vacation while 19% have 6-10 days and 31% have 1-5 days. Staff have fewer sick
days. 88% of full time staff report being paid for holidays.
TABLE 16. VACATION DAYS BY POSITION FOR FULL TIME STAFF
0 days 1-5 Days 6-10 Days
More than 10 Days
Assistant Directors (n = 66) 16.7% 19.7% 19.7% 43.9%
Education Coordinators (n = 110) 6.1% 25.4% 14.9% 53.5%
Teachers (n = 346) 9.3% 32.9% 23.4% 34.3%
Assistant Teachers (n = 252) 21.7% 34.6% 14.4% 29.3%
All Staff (n = 769) 13.5% 31.4% 19.0% 36.2%
TABLE 17. SICK DAYS BY POSITION FOR FULL TIME STAFF
0 days 1-5 Days 6-10 Days More than
10 Days
Assistant Directors (n =61) 31.1% 36.1% 23.0% 9.8%
Education Coordinators (n=110) 16.4% 37.3% 21.8% 24.5%
Teachers (n=346) 21.4% 40.1% 19.1% 19.4%
33 Estimates from very small sample sizes are presented in parentheses. Numbers are presented for illustrative purposes but
should not be considered accurate estimates.

Oldham Innovative Research 41
TABLE 17. SICK DAYS BY POSITION FOR FULL TIME STAFF
Assistant Teachers (n = 252) 32.5% 35.3% 14.3% 17.9%
All Staff (n = 769) 25.1% 37.8% 18.2% 18.9%
TABLE 18. HOLIDAYS BY POSITION FOR FULL TIME STAFF
Paid for Holidays
Assistant Directors (n =61) 87.3%
Education Coordinators (n=110) 96.4%
Teachers (n=346) 91.7%
Assistant Teachers (n = 252) 79.5%
All Staff (n = 769) 88.0%
62% of all part time center staff have no vacation days compared to 14% of full time staff. 60% of
part time center staff have no sick days compared to 25% of full time staff. 43% of part time center staff
are offered paid holidays.
TABLE 19. VACATION DAYS BY POSITION FOR PART TIME STAFF
0 days 1-5 Days 6-10 Days
More than
10 Days
Assistant Directors (n = 7) 57.1% 28.6% 14.3% 0.0%
Education Coordinators (n = 17) 52.9% 11.8% 5.9% 29.4%
Teachers (n = 29) 62.1% 27.6% 3.4% 6.9%
Assistant Teachers (n = 77) 63.6% 27.3% 5.2% 3.9%
All Staff (n = 130) 61.5% 25.3% 5.4% 7.7%
TABLE 20. SICK DAYS BY POSITION FOR PART TIME STAFF
0 days 1-5 Days 6-10 Days
More than
10 Days
Assistant Directors (n = 7) 57.1% 28.6% 0.0% 14.3%
Education Coordinators (n = 17) 35.3% 47.1% 5.9% 11.8%
Teachers (n = 28) 67.9% 28.6% 3.6% 0.0%
Assistant Teachers (n = 76) 63.3% 31.7% 5.1% 0.0%
All Staff (n = 128) 60.3% 32.8% 4.6% 2.3%

Oldham Innovative Research 42
TABLE 21. HOLIDAYS BY POSITION FOR
PART TIME STAFF
Paid for
Holidays
Assistant Directors (n = 7) 57.1%
Education Coordinators (n = 17) 76.5%
Teachers (n = 28) 42.9%
Assistant Teachers (n = 76) 34.2%
All Staff (n = 128) 43.0%
Additional Employment
Survey respondents were asked if they work another job in addition to their job at a child care
center. 17% of directors report they work another job (139 directors responded to this question). Of those
who do work another job, the hours worked range from 1 hour/week to 40 hours/week, with an average
of 14.4 hours/week.
Hourly Wage at Other Job: Of the 20 directors who reported their hourly wage at their second job,
pay per hour ranged from $7.75 to $50.00/hour, with an average hourly wage of $15.66.
14% to 19% of full time staff, across all types of positions, report working another job. Of part
time staff, 26% to 47% of part time staff work another job.
14% 19% 19% 18% 18%
29%
47%
27% 26% 29%
A S S I S T A N T D I R E C T O R
E D U C A T I O N C O O R D I N A T O R
T E A C H E R A S S I S T A N T T E A C H E R
A L L S T A F F
CHART 31. CENTER STAFF WORKING ANOTHER JOB
Full Time Staff Part Time Staff

Oldham Innovative Research 43
TABLE 22. STAFF WORKING ANOTHER JOB BY POSITION
Full Time
Staff with
another job
Sample Size
Part Time
Staff with
another job
Sample Size
Assistant Directors 13.6% 66 28.6% 7
Education Coordinators 18.6% 113 47.1% 17
Teachers 19.0% 363 26.7% 30
Assistant Teachers 17.9% 268 26.2% 80
All Staff 18.1% 810 29.1% 134
Of those working full time within the center setting, 17% are working another job. The median
number of hours at the second job is 14.5 hours. The median hourly wage is $10.55. For those working
part time, 32% have another job. The median number of hours at the second job is 16 hours; the median
hourly wage is $13.00.
TABLE 23. SECOND JOB FOR FULL AND PART TIME WORKERS
Full Time Workers (n = 825) Part Time Workers (n = 142)
Number working a second job 151 (17.2% of all staff) 46 (32.4% of part time staff)
Range of hours worked 1 to 75 hours 2 to 52 hours
Mean number of hours 16.5 hours 19.8 hours
Median number of hours 14.5 hours 16 hours
Range of hourly wage $2.49 to $72.00/hour $7.45 to $55.00
Mean hourly wage $12.42 $15.24
Median hourly wage $10.55 $13.00
Oldham Innovative Research 44
C. Who are the populations served by the centers?
The second research question in the early childhood workforce study was “Who are the
populations served by the centers?”. This question examined age groups served as well as low income
children and Dual Language Learners within center based programs.
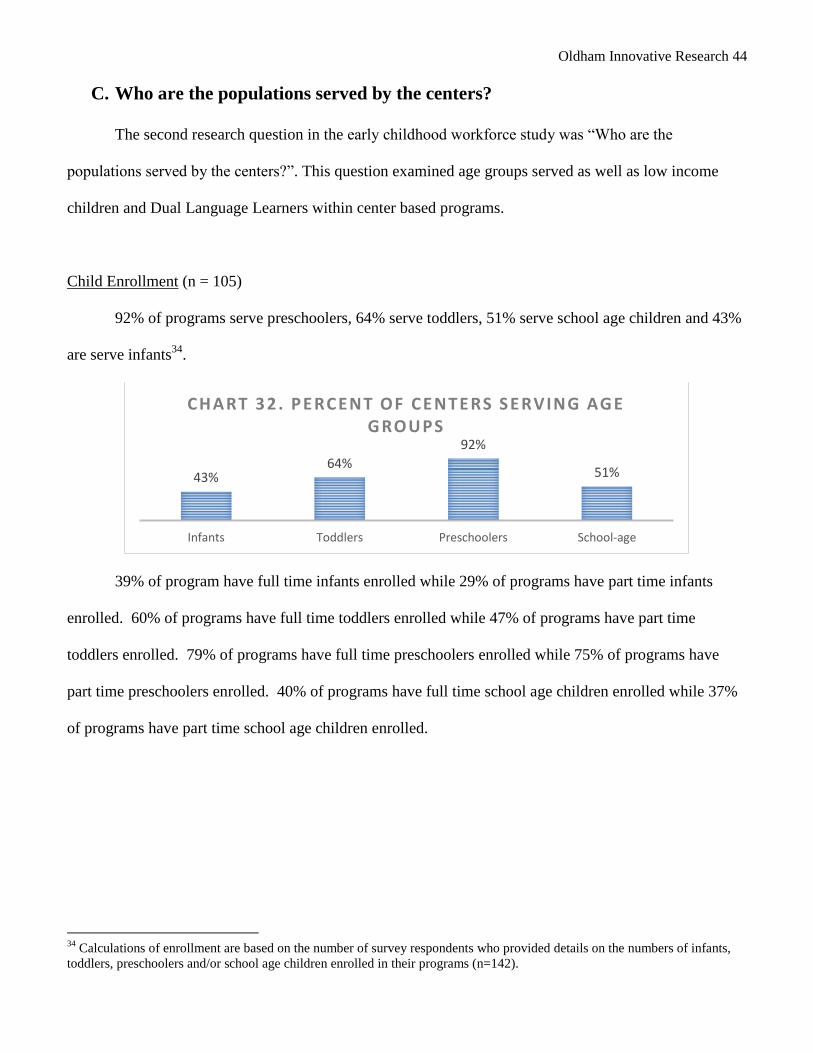
Child Enrollment (n = 105)
92% of programs serve preschoolers, 64% serve toddlers, 51% serve school age children and 43%
are serve infants34
.
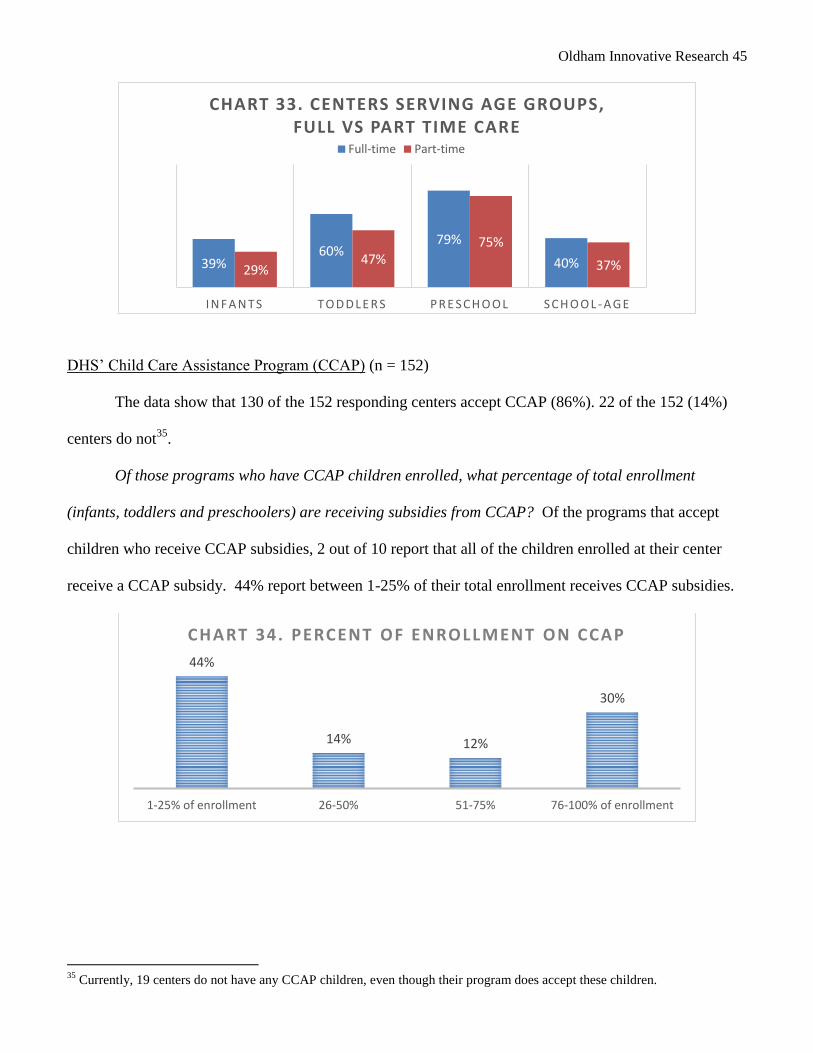
39% of program have full time infants enrolled while 29% of programs have part time infants
enrolled. 60% of programs have full time toddlers enrolled while 47% of programs have part time
toddlers enrolled. 79% of programs have full time preschoolers enrolled while 75% of programs have
part time preschoolers enrolled. 40% of programs have full time school age children enrolled while 37%
of programs have part time school age children enrolled.
34
Calculations of enrollment are based on the number of survey respondents who provided details on the numbers of infants,
toddlers, preschoolers and/or school age children enrolled in their programs (n=142).
43% 64%
92%
51%
Infants Toddlers Preschoolers School-age
CHART 32 . P E RCENT OF CE NTE RS SE RVING AGE GROUPS
Oldham Innovative Research 45
DHS’ Child Care Assistance Program (CCAP) (n = 152)
The data show that 130 of the 152 responding centers accept CCAP (86%). 22 of the 152 (14%)
centers do not35
.
Of those programs who have CCAP children enrolled, what percentage of total enrollment
(infants, toddlers and preschoolers) are receiving subsidies from CCAP? Of the programs that accept
children who receive CCAP subsidies, 2 out of 10 report that all of the children enrolled at their center
receive a CCAP subsidy. 44% report between 1-25% of their total enrollment receives CCAP subsidies.
35
Currently, 19 centers do not have any CCAP children, even though their program does accept these children.
39% 60%
79%
40% 29% 47%
75%
37%
I N F A N T S T O D D L E R S P R E S C H O O L S C H O O L - A G E
CHART 33. CENTERS SERVING AGE GROUPS, FULL VS PART TIME CARE
Full-time Part-time
44%
14% 12%
30%
1-25% of enrollment 26-50% 51-75% 76-100% of enrollment
CHART 34. PERCENT OF ENROLLMENT ON CCAP

Oldham Innovative Research 46
Children Who Speak a Language Other Than English in Their Homes (n = 147)
The data are that 76% of centers have children who speak a language other than English when at
home. 24% of programs have English-only speaking children.
Of the centers that have children who speak a language other than English at home, what
percentage of total enrollment (infants, toddlers, preschoolers and school-age) are these children? The
following graph details the percentage of total enrollment of children who are Dual Language Learners
(DLL). 80% of providers report DLL children make up 25% or less of their total enrollment. 2 in 10 say
25% or more of their children are DLL.
31%
22% 16%
9% 2%
20%
1-5% 6-10% 11-15% 16-20% 21-25% More than25%
CHART 35. PERCENT OF ENROLLED CHILDREN WHO ARE DLL
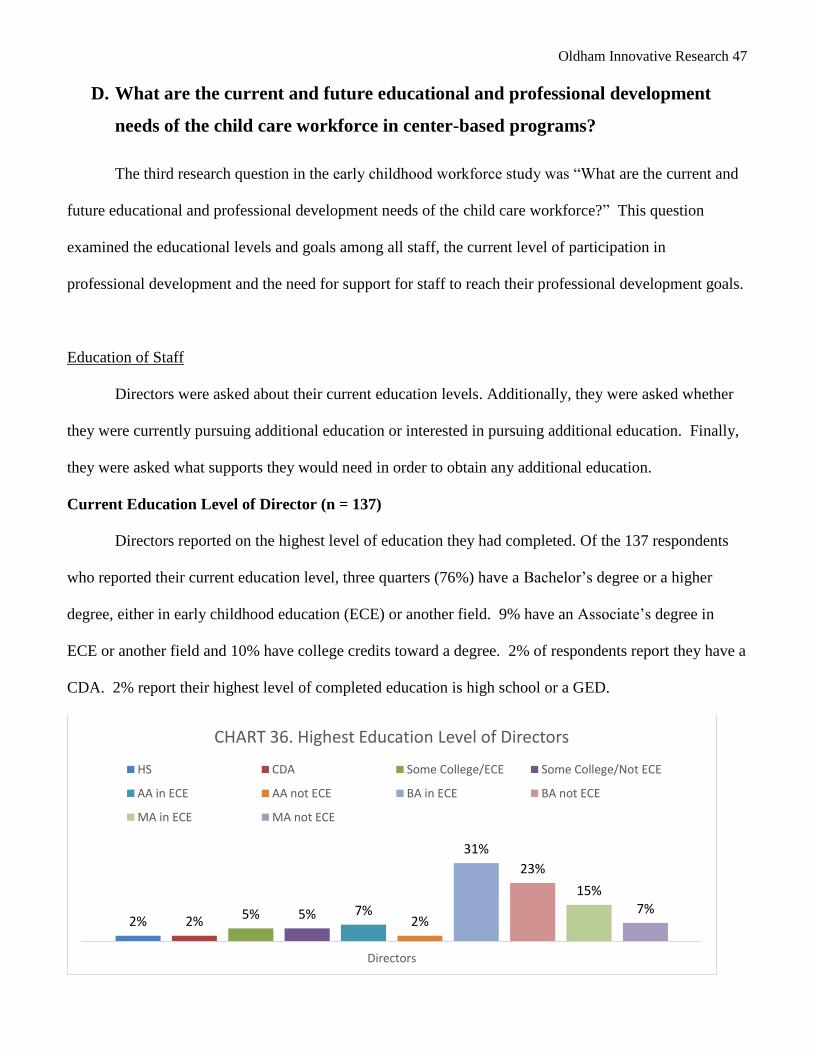
Oldham Innovative Research 47
D. What are the current and future educational and professional development
needs of the child care workforce in center-based programs?
The third research question in the early childhood workforce study was “What are the current and
future educational and professional development needs of the child care workforce?” This question
examined the educational levels and goals among all staff, the current level of participation in
professional development and the need for support for staff to reach their professional development goals.
Education of Staff
Directors were asked about their current education levels. Additionally, they were asked whether
they were currently pursuing additional education or interested in pursuing additional education. Finally,
they were asked what supports they would need in order to obtain any additional education.
Current Education Level of Director (n = 137)
Directors reported on the highest level of education they had completed. Of the 137 respondents
who reported their current education level, three quarters (76%) have a Bachelor’s degree or a higher
degree, either in early childhood education (ECE) or another field. 9% have an Associate’s degree in
ECE or another field and 10% have college credits toward a degree. 2% of respondents report they have a
CDA. 2% report their highest level of completed education is high school or a GED.
2% 2% 5% 5% 7% 2%
31%
23%
15% 7%
Directors
CHART 36. Highest Education Level of Directors
HS CDA Some College/ECE Some College/Not ECE
AA in ECE AA not ECE BA in ECE BA not ECE
MA in ECE MA not ECE

Oldham Innovative Research 48
Subgroup Analyses
Examining the education level of the Director by the three subgroups, the finding indicate that
Head Start programs are more likely to have a director with at least a Bachelor’s degree than non-Head
Start programs. Engaged programs are more likely to have a director with at least a Master’s degree than
non-engaged programs. Programs in the core cities are more likely to have a director with a Master’s
degree. There is no difference in the type of degree held by directors in small, medium and large
programs.
TABLE 24. EDUCATION LEVEL OF DIRECTOR BY THREE SUBGROUPS
Not Head
Start (n = 129)
Head Start (n = 8)
Not Engaged Program (n = 65)
Engaged Program (n = 71)
Not core city
(n = 98)
Core city (n = 38)
At least Bachelor’s degree 75.2% 100%* 78.5% 74.6% 74.5% 81.6%
At least Master’s degree 20.2% 50.0% 15.4% 28.2%+ 17.3 34.2+
*Indicates a statistically significant difference at the p < .05 level; + indicates a statistically significant difference at the p < .10 level.
TABLE 25. EDUCATION LEVEL OF DIRECTOR BY SIZE OF PROGRAM
Small (n = 71) Medium (n = 34) Large (n = 25)
At least Bachelor’s degree 74.6% 73.5% 80.0%
At least Master’s degree 23.9% 17.6% 24.0%
Current Education Level of Center Staff (Total sample n=1002. Breakdown: Assistant directors n=
77; Education coordinators n=136; Teachers n=416; Assistant teachers n=373)
Chart 37 gives a sense of the relative levels of education in each group of staff. Charts 38 to 41
are useful to ascertain the levels of education within each group of staff. Chart 41 indicates that having a
high school diploma as the highest level of education is prevalent among the assistant teachers. Assistant
teachers are more likely to have “some college credits” and less likely to have a Bachelor’s or Master’s
degree.

Oldham Innovative Research 49
There are a substantial percentage of education coordinators and assistant directors who have
Bachelor’s and Master’s degree, more so than teachers or assistant teachers. Looking at the relative
percentages, education coordinators as a group have a higher level of education than assistant directors
and directors; there are higher percentages of Bachelor’s and Master’s degrees among the education
coordinators and a higher percentage of “some college credits” and Associate’s degrees among the
assistant directors and directors.
Assistant directors and directors were asked to report their highest level of education achieved. A
quarter (25%) have achieved a Master’s degree. Another 42% have achieved a Bachelor’s degree – 16%
in early childhood36
. 7% have an Associate’s degree in early childhood and 7% have an Associate’s
degree in another field. One out of 10 (10%) report having some college credits in early childhood while
7% report having some college credits in another field. Very small numbers of the assistant directors or
directors have only a high school diploma or CDA degree.
36
A degree in early childhood education could have been in early childhood or child development.
A S S I S T A N T D I R E C T O R S
E D U C A T I O N C O O R D I N A T O R
T E A C H E R
A S S I S T A N T T E A C H E R
CHART 37. CURRENT EDUCATION LEVEL OF STAFF
less than HS High School CDA Some College AA BA MA+

Oldham Innovative Research 50
Six of 10 education coordinators have a Bachelor’s degree, four of those in early childhood. A
quarter of education coordinators have a Master’s degree, 17% of whom have a Master’s in early
childhood. Small numbers of education coordinators have a credential below a Bachelor’s degree.
A quarter of teachers have some college credits; another quarter have an Associate’s degree.
Almost a third (31%) have a Bachelor’s degree while 8% have a Master’s degree. 8% have a high school
diploma and 3% have a CDA.
0%
3% 1%
10% 7% 7% 7%
16%
26%
12% 13%
A S S I S T A N T D I R E C T O R S
CHART 38. CURRENT EDUCATION LEVEL OF ASSISTANT DIRECTORS
Less than HS HS CDA
Some College/ECE Some College/Not ECE AA in ECE
AA not ECE BA in ECE BA not ECE
MA in ECE MA not ECE
0%
1% 4% 4% 2% 2% 2%
40%
21% 18% 7%
E D U C A T I O N C O O R D I N A T O R
CHART 39. CURRENT EDUCATION LEVEL OF EDUCATION COORDINATORS
Less than HS HS CDA
Some College/ECE Some College/Not ECE AA/ECE
AA/not ECE BA/ECE BA/not ECE
MA/ECE MA/not ECE

Oldham Innovative Research 51
A quarter of assistant teachers and aides have a high school diploma as their highest earned level
of education. Four out of 10 have some college credits. 12% have an Associate’s degree, 14% have a
Bachelor’s degree and 2% have a Master’s degree. 63% have a CDA and 1% have less than a high school
diploma.
Pursuit of Education
Directors were asked whether they are currently pursuing or interested in pursuing any additional
education. Due to low percentages, data are shown using actual numbers of directors who want to pursue
0%
8% 3%
16% 8%
21%
4% 14% 17%
5% 3%
T E A C H E R S
CHART 40. CURRENT EDUCATION LEVEL OF TEACHERS
Less than HS HS CDA
Some College/ECE Some College/Not ECE AA/ECE
AA/not ECE BA/ECE BA/not ECE
MA/ECE MA/not ECE
1%
25%
6%
24%
16%
6% 5% 4% 11%
2% 0%
A S S I S T A N T T E A C H E R
CHART 41. CURRENT EDUCATION LEVEL OF ASSISTANT TEACHERS
Less than HS HS CDA
Some College/ECE Some College/Not ECE AA/ECE
AA/not ECE BA/ECE BA/not ECE
MA/ECE MA/not ECE

Oldham Innovative Research 52
each degree rather than percentages. These numbers, within the context of the response rate, can be used
to estimate demand for certain programs.
11 respondents, the largest number in any one category, report they are currently pursuing college
credits in early childhood education. 6 are currently pursuing an advanced degree in early childhood
education and 19 are interested in such a degree. Additional interest in shown in pursuing a Bachelor’s
degree in ECE (10 respondents) or an advanced degree in a field besides ECE (10 respondents).
Center staff were asked whether they are currently pursuing or interested in pursuing any
additional education. Due to low percentages, data are shown in both actual numbers (chart 43) and
percentages (chart 44) of staff who want to pursue each degree. These numbers, within the context of the
response rate, can be used to estimate demand for certain programs. Small numbers of assistant directors
and directors are pursuing Associate’s, Bachelor’s and Master’s degrees. For assistant directors and
directors, many of whom have already achieved the educational levels they desire, there is the greatest
demand for Master’s degrees both in early childhood and in other fields.
0
0
11
6
1
6
4
2
0
0 3
10
2
2
6
19
2
10
C U R R E N T L Y P U R S U I N G I N T E R E S T I N P U R S U I N G
CHART 42. PURSUIT OF EDUCATION CENTER DIRECTORS
CDA Credential College credits in ECE College credits not in ECE
AA in ECE AA not in ECE BA in ECE
BA not in ECE MA in ECE MA not in ECE

Oldham Innovative Research 53
Education coordinators report an interest in pursuing a Master’s degree, both in early childhood
and other fields; 1 in 10 education coordinators are working on their Master’s degree and 4% are working
on their Bachelor’s degrees. Four out of 10 education coordinators report wanting to work on a Master’s
degree. There is less demand for Associate’s and Bachelor’s degrees.
0
0 1
5 2
5 1 3 1 3 3 1 2 3 1 2 3
8 3
11
C U R R E N T L Y P U R S U I N G W A N T T O P U R S U E
CHART 43. PURSUIT OF EDUCATION BY ASSISTANT DIRECTORS, ACTUAL NUMBERS
HS CDA College credits in ECE College credit not in ECE
AA/ECE AA/Not in ECE BA/ECE BA/Not in ECE
MA/ECE MA/Not in ECE
0%
0%
1% 6%
3% 7%
1% 4% 1% 4% 4% 1% 3% 4% 1% 3% 4% 10%
4%
14%
C U R R E N T L Y P U R S U I N G W A N T T O P U R S U E
CHART 44. PURSUIT OF EDUCATION BY ASSISTANT DIRECTORS, PERCENTAGES
HS CDA College credits in ECE College credit not in ECE
AA/ECE AA/Not in ECE BA/ECE BA/Not in ECE
MA/ECE MA/Not in ECE
0 0 1 0 4 4 3 2 0 7
0 2 4 3 1 4 10
34
4
20
C U R R E N T L Y P U R S U I N G W A N T T O P U R S U E
CHART 45. PURSUIT OF EDUCATION BY EDUCATION COORDINATORS, ACTUAL NUMBERS
HS CDA College credits in ECE College credit not in ECE
AA/ECE AA/Not in ECE BA/ECE BA/Not in ECE
MA/ECE MA/Not in ECE
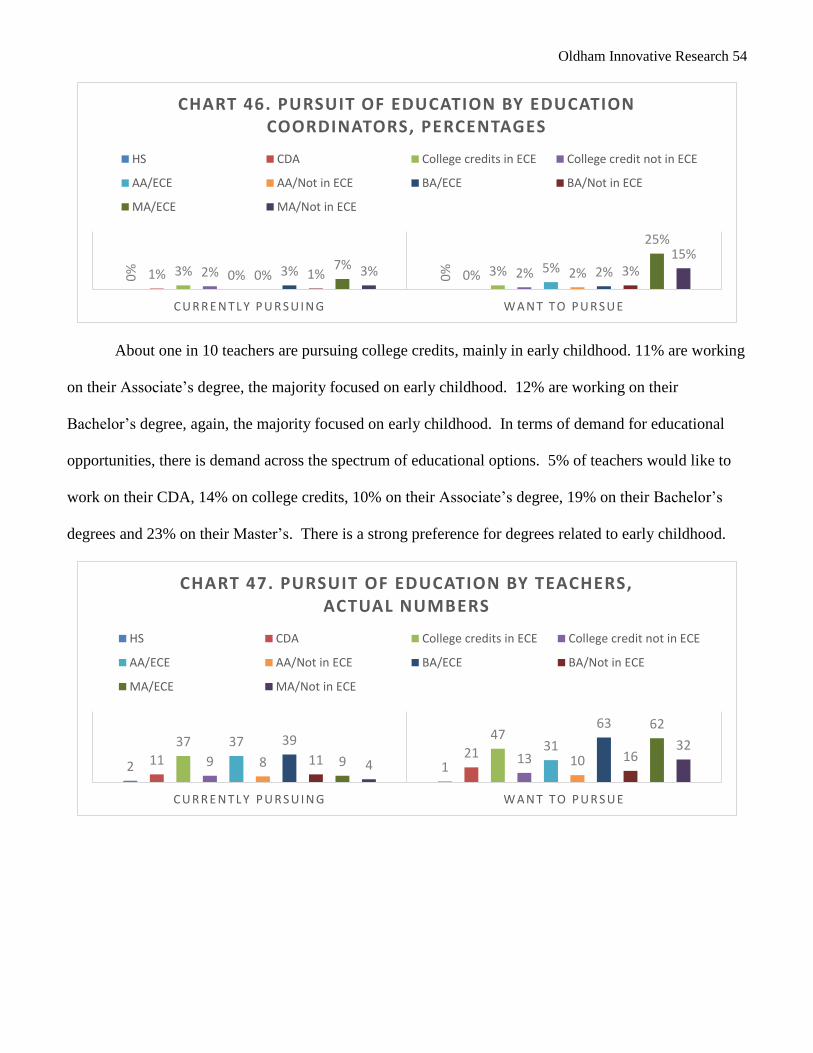
Oldham Innovative Research 54
About one in 10 teachers are pursuing college credits, mainly in early childhood. 11% are working
on their Associate’s degree, the majority focused on early childhood. 12% are working on their
Bachelor’s degree, again, the majority focused on early childhood. In terms of demand for educational
opportunities, there is demand across the spectrum of educational options. 5% of teachers would like to
work on their CDA, 14% on college credits, 10% on their Associate’s degree, 19% on their Bachelor’s
degrees and 23% on their Master’s. There is a strong preference for degrees related to early childhood.
0%
0%
1% 0% 3% 3% 2% 2% 0% 5%
0% 2% 3% 2% 1% 3% 7%
25%
3% 15%
C U R R E N T L Y P U R S U I N G W A N T T O P U R S U E
CHART 46. PURSUIT OF EDUCATION BY EDUCATION COORDINATORS, PERCENTAGES
HS CDA College credits in ECE College credit not in ECE
AA/ECE AA/Not in ECE BA/ECE BA/Not in ECE
MA/ECE MA/Not in ECE
2 1 11 21 37 47
9 13 37 31
8 10
39 63
11 16 9
62
4
32
C U R R E N T L Y P U R S U I N G W A N T T O P U R S U E
CHART 47. PURSUIT OF EDUCATION BY TEACHERS, ACTUAL NUMBERS
HS CDA College credits in ECE College credit not in ECE
AA/ECE AA/Not in ECE BA/ECE BA/Not in ECE
MA/ECE MA/Not in ECE

Oldham Innovative Research 55
Among assistant teachers and aides, many are pursuing higher education. 2% are pursuing their
high school diploma, 3% their CDA, 23% some college credits, 19% an Associate’s degree, 12% a
Bachelor’s degree and 3% a Master’s degree. Among assistant teachers and aides, there is also a broad
range of demand for a variety of higher education options. 9% want to work on their CDA, 18% on
college credits, 20% on an Associate’s degree, 15% on a Bachelor’s degree and 13% on a Master’s
degree. There is a preference for degrees in early childhood.
1% 0% 3%
5% 9%
11%
2% 3% 9% 8%
2% 2%
9%
15%
3% 4% 2%
15%
1%
8%
C U R R E N T L Y P U R S U I N G W A N T T O P U R S U E
CHART 48. PURSUIT OF EDUCATION BY TEACHERS, PERCENTAGES
HS CDA College credits in ECE College credit not in ECE
AA/ECE AA/Not in ECE BA/ECE BA/Not in ECE
MA/ECE MA/Not in ECE
9 3 18
34 58
46 27 20
52 58
18 16 23 38
23 20 3
28 9 18
C U R R E N T L Y P U R S U I N G W A N T T O P U R S U E
CHART 49. PURSUIT OF EDUCATION BY ASSISTANT TEACHERS, ACTUAL NUMBERS
HS CDA College credits in ECE College credit not in ECE
AA/ECE AA/Not in ECE BA/ECE BA/Not in ECE
MA/ECE MA/Not in ECE

Oldham Innovative Research 56
National Comparison
There are more teaching staff in Rhode Island with Bachelor’s degree than in a national sample of
teachers. 31% of Rhode Island teaching staff have a Bachelor’s degree compared to 26% of a national
teaching sample. 9% of Rhode Island teaching staff have a Master’s degree compared to 9% of a national
teaching sample.
Fewer infant/toddler teaching staff in Rhode Island have a Bachelor’s degree but more have some
college than a national sample. 15% of the Rhode Island infant/toddler teaching staff have a Bachelor’s
degree compared to 19% of a national sample; however, 44% of the Rhode Island infant/toddler teaching
staff have some college (with no degree) compared to 36% of a national sample.
2% 1% 3%
9%
16% 13%
7% 5%
14% 16%
5% 4% 6% 10%
6% 5% 1%
8% 2%
5%
C U R R E N T L Y P U R S U I N G W A N T T O P U R S U E
CHART 50. PURSUIT OF EDUCATION BY ASSISTANT TEACHERS, PERCENTAGES
HS CDA College credits in ECE College credit not in ECE
AA/ECE AA/Not in ECE BA/ECE BA/Not in ECE
MA/ECE MA/Not in ECE
64
%
31
%
8%
53
%
26
%
9%
S O M E L E V E L O F C O L L E G E D E G R E E
F O U R - Y E A R D E G R E E G R A D U A T E D E G R E E
CHART 51. LEVELS OF EDUCATION: NATIONAL COMPARISON
RI Teacher National Teacher

Oldham Innovative Research 57
Rhode Island infant/toddler teaching staff have less education than preschool teaching staff. This
is similar to national trends. 24% of the infant/toddler teaching staff have a high school diploma or less
compared to 8% of the preschool teaching staff. 15% of the infant/toddler teaching staff have a
Bachelor’s degree compared to 47% of the preschool teaching staff. These trends are similar to national
data. 47% of the Rhode Island preschool teaching staff has a Bachelor’s compared to 45% of the national
preschool teaching sample. 15% of the Rhode Island infant/toddler teaching staff has a Bachelor’s
compared to 19% of the national infant/toddler teaching sample.
Teacher Certification
Table 26 presents the number and percentage of staff, by position, who have Rhode Island teacher
certification. Of the 137 directors responding, 45% report they have a RI Teacher Certification; 55% of
directors do not. 67% of education coordinators, 34% of assistant directors, 25% of teachers and 6% of
assistant teachers have Rhode Island teacher certification. Certification in early childhood PK-2 is the
most common, followed by certification in elementary education, grades 1-6. However, assistant teachers
are more likely to have certification in elementary education or another area than early childhood.
0% 20% 40% 60% 80% 100% 120%
Infant/toddler Rhode Island
Infant/toddler National
Preschool Rhode Island
Preschool National
24%
28%
8%
13%
44%
36%
27%
24%
17%
17%
18%
17%
15%
19%
47%
45%
Chart 52. Level of Education for Infant/Toddler and Preschool Teachers: National Comparison
HS or Less Some College, No Degree Associates Degree Bachelors Degree or Higher

Oldham Innovative Research 58
TABLE 26. ATTAINMENT OF RHODE ISLAND TEACHING CERTIFICATE BY POSITION
Have RI teacher
certificate
Early childhood
PK-2
Early childhood
special education
Elementary education Grades 1-6
Certificate in other
area 37
What areas?
Directors (n = 137)
61 or 44.5%
50 / 61 82.0%
4 / 61 6.6%
18 / 61 29.5%
4 / 61 6.6%
Certification in Early Childhood Administration, RIELS and Special Education Administration.
Assistant Director (n = 73)
25 or 34.2%
23 / 25 92.0%
1 / 25 0.4%
9 / 25 36.0%
1 / 25 4.0%
Teacher Assistant certificate
Education Coordinator (n=130)
87 or 66.9%
79 / 87 90.8%
5 / 87 5.7%
12 / 87 13.8%
5 / 87 5.7%
Art: PK-12th; Lit coach K-12; PK-5 life certificate; substitute teacher PK-12
Teachers (n=363)
92 or 25.3%
65 / 92 70.7%
16 / 92 17.4%
40 / 92 43.5%
16 / 92 17.4%
Admin in spec ed; elem special ed (9); ELL (2); K-12 health and physical educe; library media; music PK-12; Praxis I & II; assistant teacher certificate (1)
Assistant Teachers (n = 310)
20 or 6.5% 6 / 20 30% 1 / 20
5% 8 / 20 40%
8 / 20 40%
Paraprofessional assistant teacher certification; reading specialist; ELL; elementary spec education (1); Assistant teacher certificate (4)
Table 27 presents the percentage of staff, by position, who are currently certified, pursuing
certification, or interested in pursuing certification. Table 28 presents the number of staff who currently
hold each type of certification, are pursuing each type of certification and are interested in pursuing each
type of certification. There is substantial interest in pursuing the early childhood PK-2 certification,
across all positions.
37
Staff also reported on what “other” teaching certificates they have. This data is reported in Appendix A.

Oldham Innovative Research 59
TABLE 27. TEACHER CERTIFICATION BY POSITION
Currently Have Teaching Certification
Pursuing Teacher Certification38
Want to Pursue Teacher Certification
Center Directors 61 / 137 44.5%
5 / 76 6.6%
9 / 76 11.8%
Assistant Directors 25 / 73
34.2% 6 / 68 8.8%
19 / 52 36.5%
Education Coordinators 87 / 130
66.9% 18 / 116 15.5%
32 / 59 35.2%
Teachers 92 / 363
25.3% 66 / 376 17.6%
179 / 291 61.5%
Assistant Teachers 20 / 310
6.5% 43 / 343 12.5%
185 / 296 62.5%
TABLE 28. TYPE OF TEACHER CERTIFICATION BY POSITION
Early Childhood PK-2 Early Childhood Special
Education Elementary Education
Grades 1-6
Current Pursue Interest Current Pursue Interest Current Pursue Interest
Center Directors
50 9 5 4 1 1 18 0 0
Assistant Directors
23 4 10 1 0 2 9 1 7
Education Coordinators
79 14 19 5 1 3 12 4 9
Teachers 65 63 147 16 6 26 40 6 38
Assistant Teachers
6 30 118 1 7 44 8 12 57
Chart 53 visually presents the number of staff who are currently pursuing each type of teaching
certification and chart 54 present the number of staff who are interested in pursuing each certificate.
38
Respondents answered each of the questions about teaching certificates separately. The “n” or sample size differed for each
question.
4 14
63
30
0 1 6 7 1 4 6 12
A S S I S T A N T D I R E C T O R S
E D U C A T I O N C O O R D I N A T O R S
T E A C H E R S A S S I S T A N T T E A C H E R S
CHART 53. CURRENTLY PURSUING TEACHING CERTIFICATE BY POSITION
Early Childhood PK-2 Early Childhood Special Education Elementary Education 1-6
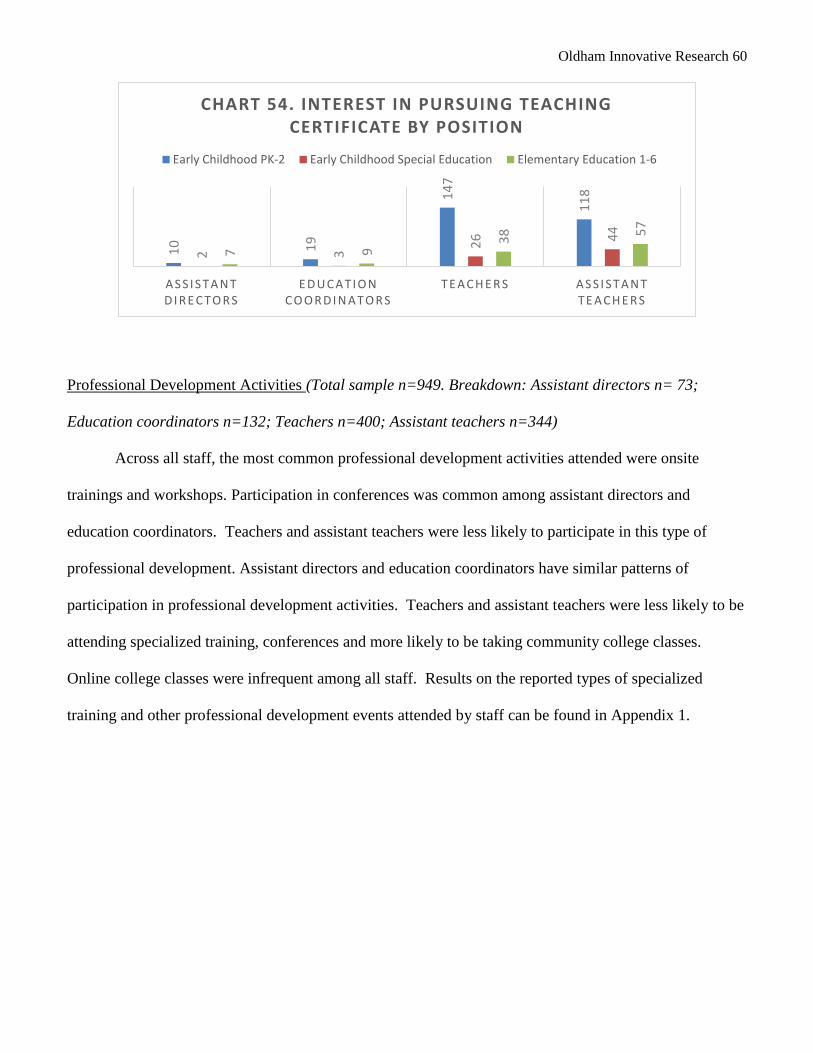
Oldham Innovative Research 60
Professional Development Activities (Total sample n=949. Breakdown: Assistant directors n= 73;
Education coordinators n=132; Teachers n=400; Assistant teachers n=344)
Across all staff, the most common professional development activities attended were onsite
trainings and workshops. Participation in conferences was common among assistant directors and
education coordinators. Teachers and assistant teachers were less likely to participate in this type of
professional development. Assistant directors and education coordinators have similar patterns of
participation in professional development activities. Teachers and assistant teachers were less likely to be
attending specialized training, conferences and more likely to be taking community college classes.
Online college classes were infrequent among all staff. Results on the reported types of specialized
training and other professional development events attended by staff can be found in Appendix 1.
10
19
14
7
11
8
2 3 2
6
44
7 9 3
8 57
A S S I S T A N T D I R E C T O R S
E D U C A T I O N C O O R D I N A T O R S
T E A C H E R S A S S I S T A N T T E A C H E R S
CHART 54. INTEREST IN PURSUING TEACHING CERTIFICATE BY POSITION
Early Childhood PK-2 Early Childhood Special Education Elementary Education 1-6

Oldham Innovative Research 61
Supports Needed to Meet Educational Goals
Directors (n=165): Survey respondents were asked what supports they need to reach their professional
development goals. Center directors reported a need for financial aid or scholarship money (33%), courses
on early childhood education administration (20%) and/or online courses (17%) to help them reach their
professional development goals.
58
% 77
%
25
%
15
%
62
% 77
%
30
%
22
%
61
%
67
%
21
%
13
%
56
%
55
%
14
%
13
%
O N S I T E T R A I N I N G W O R K S H O P S S P E C I A L I Z E D T R A I N O N L I N E T R A I N I N G
CHART 55. PROFESSIONAL DEVELOPMENT ACTIVITIES BY POSITION
Assistant Director Education Coordinator Teacher Assistant Teacher
52
%
12
%
14
%
11
%
64
%
14
%
9%
12
% 3
2%
19
%
21
%
7%
18
%
16
%
26
%
6%
C O N F E R E N C E S U N I V E R S I T Y C L A S S E S C O M M U N I T Y C O L L E G E O N L I N E C O L L E G E C L A S S E S
CHART 55A. PROFESSIONAL DEVELOPMENT ACTIVITIES BY POSITION
Assistant Director Education Coordinator Teacher Assistant Teacher

Oldham Innovative Research 62
Directors also indicated that they needed the following supports: time/paid time off, financial
support for education/technology, advanced courses/online courses, coursework in Spanish, high quality
in-state administrative peers and mentors and tax credits for work related purposes.
Center staff (Total sample n=988. Breakdown: Assistant directors n= 76; Education coordinators
n=136; Teachers n=412; Assistant teachers n=364) Center staff have a different profile of supports
needed than center directors. Financial aid and online courses were the most commonly requested
supports. Assistant teachers requested help with studying, writing and math.
Child care: About 1 in 10 staff reported that child care for their own children while pursuing
education would be helpful in meeting their professional development goals.
Mentor/Advisor: Staff noted that mentors or advisors to help with coursework and planning
would help them reach their professional development goals. Assistant teachers requested this more than
3% 7%
0%
17%
33%
10%
20%
Child Care Mentor Transportation Online courses Financial Aid Courses oninfants/toddlers
Course on ECEAdmin
C H A R T 5 6 . S U P P O R T S N E E D E D B Y C E N T E R D I R E C T O R S
1% 3% 4% 1% 0%
Help with course inEnglish
Help with studying Help with writing Help with math Course in otherlanguages
C H A RT 5 6 A . S U P P O RT S N E E D E D BY C E N T E R D I R EC TO RS

Oldham Innovative Research 63
teachers or assistant directors.
Transportation: Transportation to attend professional development opportunities was not noted by
a large percentage of staff members as a support needed to help reach their professional development
goals. Assistant teachers were the most likely to request this support; 5% of assistant teachers said
transportation to PD opportunities would be helpful.
Financial aid: Half of assistant teachers, 48% of teachers, 42% of education coordinators and
38% of assistant directors and directors said financial support, including financial aid and scholarships, is
needed in order to reach their professional development goals. Of all the supports staff were asked about,
financial aid was selected as needed by the largest percentage of staff.
Help with study skills and test taking: 13% of assistant teachers and aides, 8% of teachers, 3% of
education coordinators and 4% of assistant directors and directors reported need in this area.
Help with writing assignments: Help with writing assignments was not requested by a large
number of staff. 6% of assistant teachers and aides, 4% of teachers and 1% of assistant directors and
directors requested help with writing assignments.
Help with math assignments: 12% of assistant teachers and aides, 4% of teachers, 3% of education
coordinators and 5% of assistant directors and directors requested help with math assignments as a
support to help them reach their professional development goals.
8% 8% 0%
38%
7% 15%
2%
42%
9%
17%
2%
48%
11%
19%
5%
50%
C H I L D C A R E M E N T O R / A D V I S O R T R A N S P O R T A T I O N F I N A N C I A L A I D
CHART 57. SUPPORTS FOR PROFESSIONAL DEVELOPMENT
Assistant Directors Education Coordinators Teachers Assistant Teachers

Oldham Innovative Research 64
Help taking a course in English: Across all staff positions, few reported needing help taking a
course in English.
Courses offered in another language: There was not a large population of staff requesting that
courses be offered in other languages. However, it should be noted that the survey was offered in English
and Spanish and thus would only have been filled out by staff that speak those languages. Those who did
ask for courses in other languages specifically mentioned Spanish (12), French (1) and German (1).
Courses related to infants and toddlers: About 10% of staff said more courses relevant to infants
and toddlers would help them reach their professional development goals.
Online courses: Following financial aid as the most commonly selected support needed by staff to
help reach their professional development goals, online courses were the second most requested support.
A quarter of assistant teachers and aides, teachers and education coordinators requested more online
4% 1%
5% 3%
0% 3%
8% 4% 4%
13
%
6%
12
%
H E L P / S T U D Y I N G & T E S T T A K I N G
H E L P / W R I T I N G H E L P / M A T H
CHART 57A. SUPPORTS FOR PROFESSIONAL DEVELOPMENT
Assistant Directors Education Coordinators Teachers Assistant Teachers
1% 3% 10%
34%
0% 2% 7%
26%
1% 2%
11%
26%
2% 3%
9%
24%
H E L P / C O U R S E I N E N G L I S H
C O U R S E I N A N O T H E R L A N G U A G E
C O U R S E S R E L A T E D T O
I N F A N T S / T O D D L E R S
O N L I N E C O U R S E S
CHART 57B. SUPPORTS FOR PROFESSIONAL DEVELOPMENT
Assistant Directors Education Coordinators Teachers Assistant Teachers

Oldham Innovative Research 65
courses. A third of assistant directors and directors requested more online courses as a means to help
reach their professional development goals.
Supports Offered to Staff
Of the 167 directors who responded to a question about the supports offered to staff at their center,
68% report their center offers mentoring or coaching by someone at the center and orientation for staff
before beginning new responsibilities. 6 out of 10 directors report staff are offered paid planning or prep
time. 34% of directors agree to support the TEACH Scholarship Program. 14% of centers report offering
staff mentoring or coaching by an independent mentor/coach.
In addition to the supports detailed above, just over half of directors report their center offers
financial support for staff to attend training, professional development opportunities and local
conferences. 36% offer financial support to staff to take college courses. 2 out of 10 offer financial
support to attend national conferences.
68% 68% 62%
34%
14%
Mentoring in center Orientation Paid planning/prep TEACH scholarship Mentoring outsidecenter
C H A R T 5 8 . D I R E C TO R R E P O R T O F S U P P O R T S O F F E R E D TO S TA F F
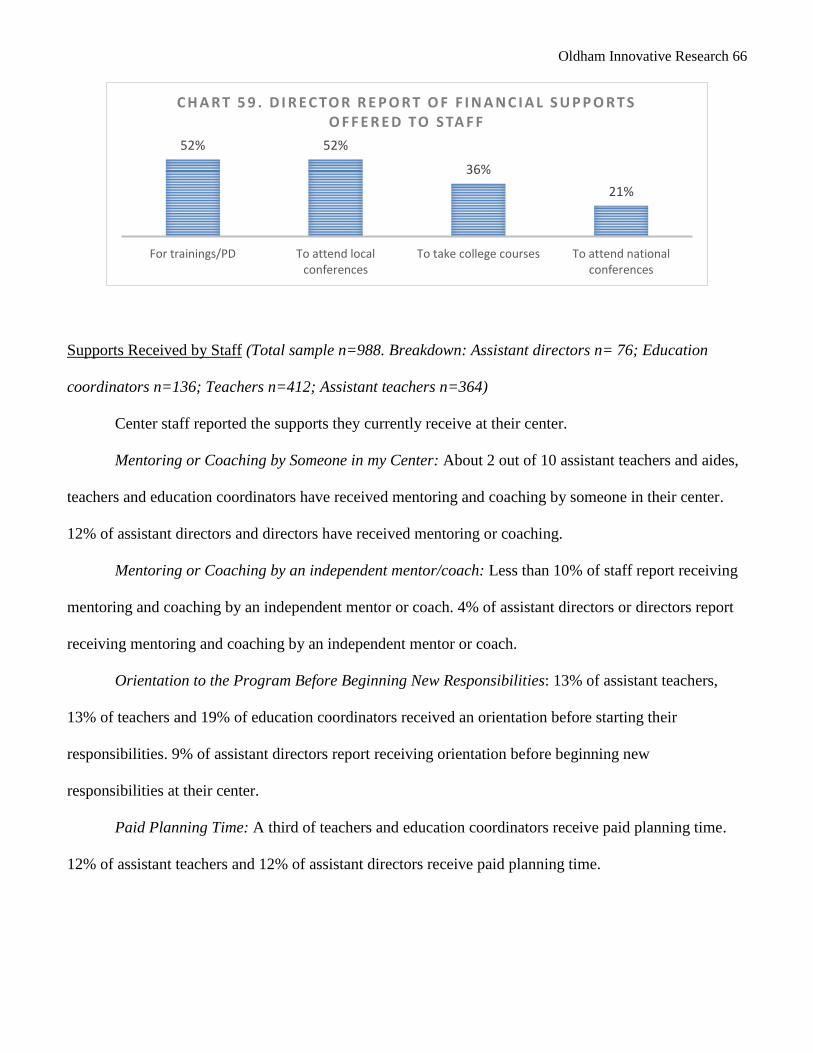
Oldham Innovative Research 66
Supports Received by Staff (Total sample n=988. Breakdown: Assistant directors n= 76; Education
coordinators n=136; Teachers n=412; Assistant teachers n=364)
Center staff reported the supports they currently receive at their center.
Mentoring or Coaching by Someone in my Center: About 2 out of 10 assistant teachers and aides,
teachers and education coordinators have received mentoring and coaching by someone in their center.
12% of assistant directors and directors have received mentoring or coaching.
Mentoring or Coaching by an independent mentor/coach: Less than 10% of staff report receiving
mentoring and coaching by an independent mentor or coach. 4% of assistant directors or directors report
receiving mentoring and coaching by an independent mentor or coach.
Orientation to the Program Before Beginning New Responsibilities: 13% of assistant teachers,
13% of teachers and 19% of education coordinators received an orientation before starting their
responsibilities. 9% of assistant directors report receiving orientation before beginning new
responsibilities at their center.
Paid Planning Time: A third of teachers and education coordinators receive paid planning time.
12% of assistant teachers and 12% of assistant directors receive paid planning time.
52% 52%
36%
21%
For trainings/PD To attend localconferences
To take college courses To attend nationalconferences
C H A R T 5 9 . D I R E C TO R R E P O R T O F F I N A N C I A L S U P P O R T S O F F E R E D TO S TA F F

Oldham Innovative Research 67
Financial Support to Take College Courses: 16-18% of assistant teachers or aides, teachers and
education coordinators report receiving financial support to take college courses.
Financial Support for Other Training/Professional Development: 16% of assistant teacher and
aides and 16% of teachers have received financial support for other trainings or professional development
opportunities. 29% of education coordinators and 2 out of 10 assistant directors and directors received
financial support to attend other training or professional development opportunities.
Financial Support to Attend National Conferences: As compared to financial support for college
courses or trainings and professional development, fewer staff have received financial support to attend
national conferences. 3% of assistant teachers and teachers, 10% of education coordinators and 9% of
assistant directors and directors have received financial supports to attend national conferences.
Financial Support to Attend Local Conferences: 9% of assistant teachers and aides, 16% of
teachers, 29% of education coordinators and 18% of assistant directors and directors have received
financial support to attend local conferences.
12%
4%
9% 12%
20%
8%
19%
34%
21%
8%
13%
33%
23%
7%
13% 12%
Mentoring in Center Mentor outside of Center Orientation in Center Paid Planning Time
CHART 60. SUPPORTS RECEIVED BY STAFF
Assistant Directors Education Coordinator Teachers Assistant Teachers

Oldham Innovative Research 68
Internet Access
97% of directors (n = 140) report they have reliable (daily) Internet access; 3% do not. Directors
most often39
access the Internet at their work site (73%) and at their home (72%). 44% access the Internet
on their phone and 12% report accessing the Internet at another location.
39
Multiple responses could be selected.
12%
20%
9%
18% 18%
29%
10%
29%
16% 16%
3%
16% 18%
16%
3%
9%
To Take College Courses To Take Other Trainings To Attend NationalConference
To Attend Local Conferences
CHART 61. F INANCIAL SUPPORTS RECEIVED BY STAFF
Assistant Directors Education Coordinators Teachers Assistant Teachers
12%
44%
72%
73%
Another Site Location
On My Cell Phone
At My Home
At Work Site
C H A R T 6 2 . H O W I N T E R N E T A C C E S S E D , D I R E C T O R S
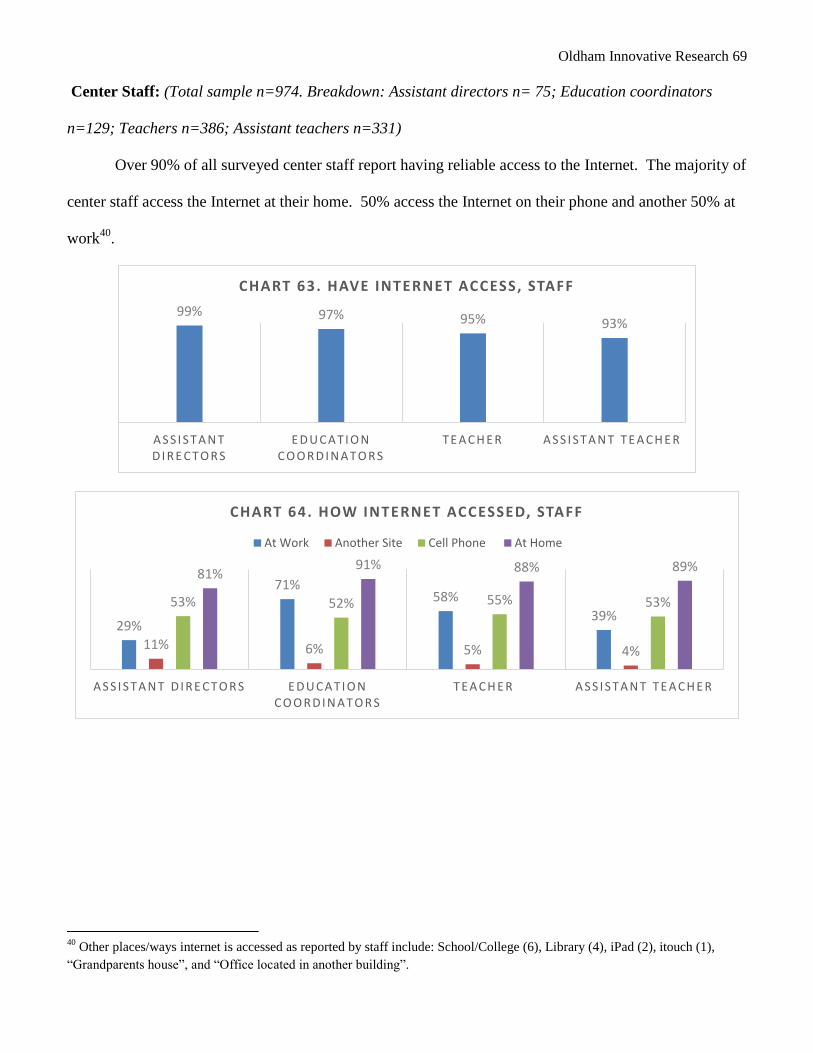
Oldham Innovative Research 69
Center Staff: (Total sample n=974. Breakdown: Assistant directors n= 75; Education coordinators
n=129; Teachers n=386; Assistant teachers n=331)
Over 90% of all surveyed center staff report having reliable access to the Internet. The majority of
center staff access the Internet at their home. 50% access the Internet on their phone and another 50% at
work40
.
40
Other places/ways internet is accessed as reported by staff include: School/College (6), Library (4), iPad (2), itouch (1),
“Grandparents house”, and “Office located in another building”.
99% 97% 95% 93%
A S S I S T A N T D I R E C T O R S
E D U C A T I O N C O O R D I N A T O R S
T E A C H E R A S S I S T A N T T E A C H E R
CHART 63. HAVE INTERNET ACCESS, STAFF
29%
71% 58%
39%
11% 6% 5% 4%
53% 52% 55% 53%
81% 91% 88% 89%
A S S I S T A N T D I R E C T O R S E D U C A T I O N C O O R D I N A T O R S
T E A C H E R A S S I S T A N T T E A C H E R
CHART 64. HOW INTERNET ACCESSED, STAFF
At Work Another Site Cell Phone At Home

Oldham Innovative Research 70
IV. Family Child Care Homes
The Family Child Care Workforce surveys was analyzed for 201 family child care educators. 29
surveys were completed online through surveymonkey.com. 172 providers completed the survey on
paper. 102 surveys were completed in English and 99 in Spanish. In key places within the report, results
for English speaking educators are presented in contrast to Spanish- speaking educators41
.
A. Demographics of family child care homes
Location of Family Child Care Homes (n = 193)
193 family child care (FCC) educators reported their location. 100 of the providers, 52%, are
located in Providence.
TABLE 29. SURVEY LOCATIONS
Location Number of Family
Child Care Homes
Location
Number of Family
Child Care Homes
Barrington 2 New Shoreham 0
Bristol 0 Narragansett 0
Burrillville 1 North Kingstown 2
Central Falls 7 North Providence 4
Charlestown 0 North Smithfield 0
Coventry 3 Pawtucket 15
Cranston 18 Portsmouth 1
Cumberland 3 Providence 100
East Greenwich 0 Richmond 3
East Providence 3 Scituate 1
Exeter 1 Smithfield 3
Foster 0 South Kingstown 2
Glocester 1 Tiverton 2
Hopkinton 0 Warren 1
Jamestown 1 Warwick 5
Johnston 1 West Warwick 1
Lincoln 3 West Greenwich 0
41
Spanish speaking educators are defined as those who only report speaking Spanish. English speaking educators are defined
as those who report speaking English and/or both English and Spanish.
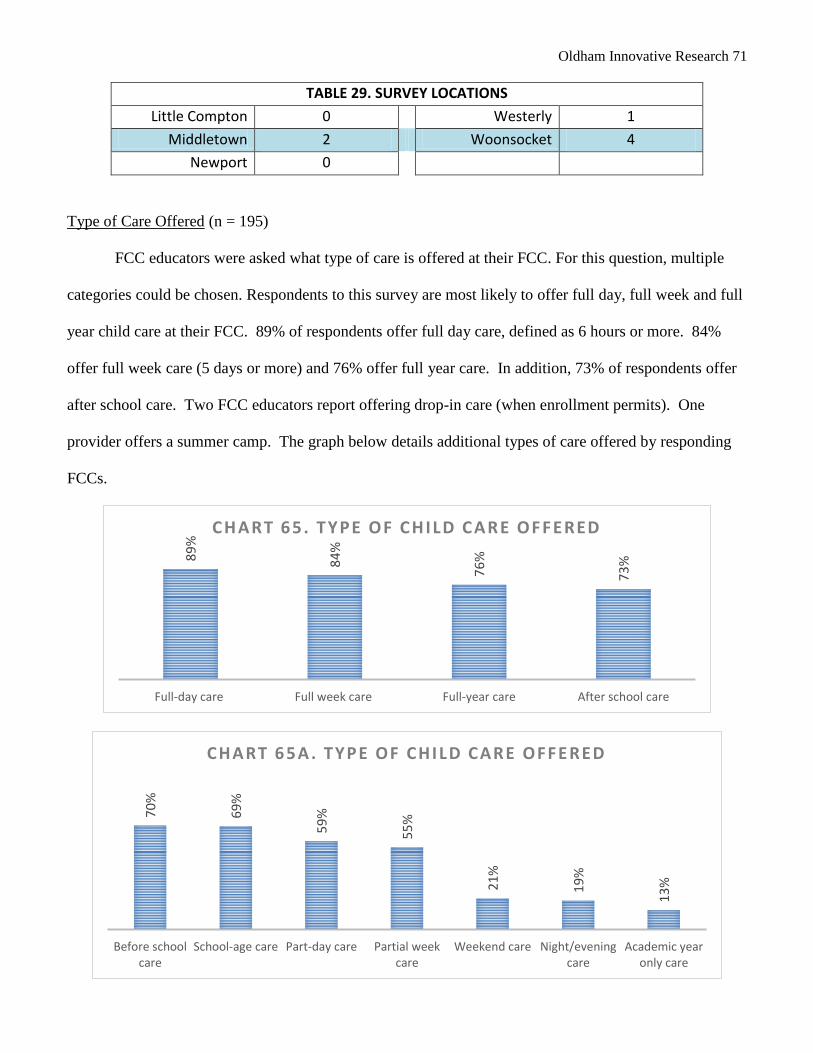
Oldham Innovative Research 71
TABLE 29. SURVEY LOCATIONS
Little Compton 0 Westerly 1
Middletown 2 Woonsocket 4
Newport 0
Type of Care Offered (n = 195)
FCC educators were asked what type of care is offered at their FCC. For this question, multiple
categories could be chosen. Respondents to this survey are most likely to offer full day, full week and full
year child care at their FCC. 89% of respondents offer full day care, defined as 6 hours or more. 84%
offer full week care (5 days or more) and 76% offer full year care. In addition, 73% of respondents offer
after school care. Two FCC educators report offering drop-in care (when enrollment permits). One
provider offers a summer camp. The graph below details additional types of care offered by responding
FCCs.
89
%
84
%
76
%
73
%
Full-day care Full week care Full-year care After school care
CHART 65. TYPE OF CHILD CARE OFFERED
70
%
69
%
59
%
55
%
21
%
19
%
13
%
Before schoolcare
School-age care Part-day care Partial weekcare
Weekend care Night/eveningcare
Academic yearonly care
CHART 65A . TYP E OF CHILD CARE OFFE RED

Oldham Innovative Research 72
Hardships Affecting FCCs (n = 142)
FCC educators were asked to select from a list if any hardships had affected their FCC in the past
12 months.
English and Spanish Speaking Educators
75 English speaking and 67 Spanish speaking family child care educators responded. English
speaking family child care educators report that low enrollment is a significant hardship while Spanish
speaking family child care educators report that stagnant salaries for staff is the most salient issue.
Additional hardships that were listed in “other hardships” included competition from other programs,
parents being laid-off and parents not being eligible for child care subsidies.
75%
51% 50% 44%
24%
52% 61%
51%
33% 39%
low enrollment stagnant salaries families behind/notpaying fees
limits/no purchasing ofequipment/materials
limits/no support forattending PDopportunities
CHART 66. HARDSHIPS AT FCC
English Speakers Spanish Speakers
18% 29%
15% 17% 32%
46%
layoffs of assistants cutting of staff salaries and/orhours
cutting of benefits
CHART 66A . HARDSHIPS AT FCC
English Speakers Spanish Speakers

Oldham Innovative Research 73
Assistants (n = 185)
English and Spanish Speaking Educators
44% of English speaking and 46% of Spanish speaking family child care educators have
assistants. Most family child care providers have just one assistant.
TABLE 30. NUMBER OF ASSISTANTS FOR ENGLISH AND SPANISH SPEAKING EDUCATORS
Number of Assistants English Spanish
1 assistant 28/44 63.6%
6/15 40.0%
2 assistants 12/44 27.3%
3/15 20.0%
3+ assistants 4/44 9.1%
6/15 40.0%
Wage: 73.7% of providers who have assistants report they pay their assistants a regular wage.
Wages range from $5.00/hour to $17.00/hour. The median wage is $9.00/hour.
Languages of fluency: 41.9% of assistants speak English only, 27.9% speak Spanish only, and
30.2% are bilingual in Spanish and English.
Turnover: Of those providers who report having an assistant, 3.4% (or 6 providers) report that they
have had an assistant leave the position in the last 12 months.
44
% 56
%
46
%
54
%
A S S I S T A N T N O A S S I S T A N T
CHART 67. ASSISTANTS WITHIN FAMILY CHILD CARE HOMES
English Speakers Spanish Speakers

Oldham Innovative Research 74
B. What are the characteristics of the early child care workforce in family child
care homes?
The first research question in the early childhood workforce study was “What are the characteristics of
the child care workforce?” This question examined individual characteristics, employment characteristics
and compensation and benefits.
Gender (n = 191)
FCC educators are predominantly female; 99% of respondents are female and 1% are male.
Ethnicity (n = 194)
58% of FCC educators identify as Latino/a and 30% as Caucasian/White. 5% identify as African
American, 4% Asian/Pacific Islander, 1% multi-ethnic and 1% other.
Language(s) Spoken (n = 188)
38% of FCC educators speak English only, 44% speak Spanish only and 17% are bilingual in
English and Spanish. Additional languages that respondents speak include Cape Verdean, Chinese,
French and Yoruba.
58%
30%
5% 4% 1% 1%
Latino/a Caucasian/White African American Asian/PacificIslander
Multi-ethnic Other
CHART 68. ETHNICITY OF PROVIDERS

Oldham Innovative Research 75
Length of Time as FCC Owner (n = 181)
Almost 9 out of 10 responding providers have owned their FCC business for 5 or more years. 12%
have been an FCC business owner for less than 5 years.
Experience in ECE (n = 191)
FCC educators were asked if they worked in the early childhood education field prior to owning
their own family child care business. Of the 191 respondents who answered this question, more than 6 out
of 10 (64%) had no prior experience in ECE. 36% report that they had experience in ECE prior to having
their own business.
38
%
44
%
17
%
E N G L I S H O N L Y S P A N I S H O N L Y B I L I N G U A L
CHART 69. LANGUAGE(S) SPOKEN
1% 11%
33% 30% 26%
Less than 1 year 1 to 5 years 5 to 10 years 10 to 15 years More than 15years
CHART 70. LENGTH OF T IME AS OWNER OF FCC

Oldham Innovative Research 76
Of those who had prior experience in ECE, half (51%) had worked in ECE for 5 years or less.
About 1 in 3 respondents worked in ECE for between 5 and 10 years before opening their own FCC
business. The remaining 18% had 10 or more years of experience.
Average Hours Worked per Week (n = 188)
Educators were asked how many hours they work per week, on average. 7 out of 10 respondents
work more than 40 hours a week. About 1 in 3 providers (35%) work an average of between 41 and 50
hours a week. 1 in 4 providers (26%) work 51 to 60 hours a week, on average. 17% work between 31 to
40 hours a week. The median number of hours worked per week is 50, with a range from 6 to 80 hours.
Yes 36% No
64%
CHART 71. EXPERIENCE IN ECE PRIOR TO OWNING FCC BUSINESS?
Yes No
2%
49% 31%
9% 9%
Less than a year 1 to 5 years 5 to 10 years 10 to 15 years More than 15years
CHART 72. LENGTH OF T IME IN ECE F IELD PRIOR TO FCC
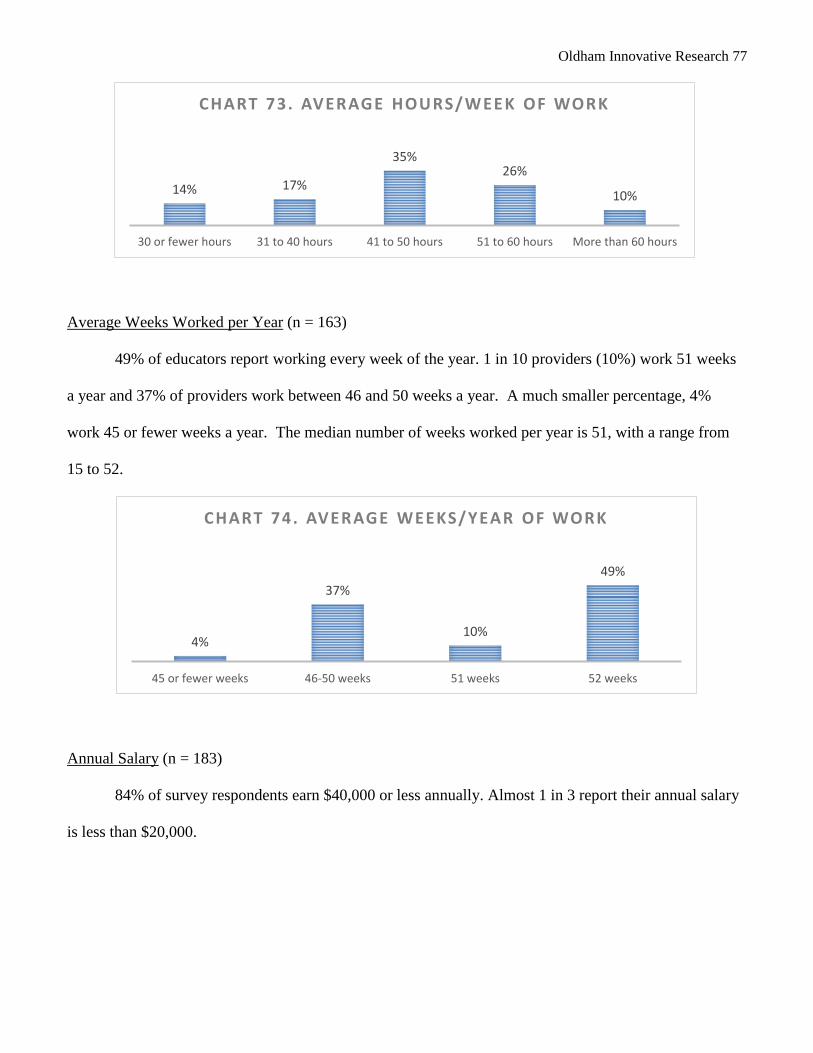
Oldham Innovative Research 77
Average Weeks Worked per Year (n = 163)
49% of educators report working every week of the year. 1 in 10 providers (10%) work 51 weeks
a year and 37% of providers work between 46 and 50 weeks a year. A much smaller percentage, 4%
work 45 or fewer weeks a year. The median number of weeks worked per year is 51, with a range from
15 to 52.
Annual Salary (n = 183)
84% of survey respondents earn $40,000 or less annually. Almost 1 in 3 report their annual salary
is less than $20,000.
14% 17%
35% 26%
10%
30 or fewer hours 31 to 40 hours 41 to 50 hours 51 to 60 hours More than 60 hours
CHART 73. AVERAGE HOURS/WEEK OF WORK
4%
37%
10%
49%
45 or fewer weeks 46-50 weeks 51 weeks 52 weeks
CHART 74. AVERAGE WEEKS/YEAR OF WORK

Oldham Innovative Research 78
English and Spanish Speaking Educators (n = 94 English speaking and 89 Spanish speaking)
81% of English speaking family child care educators and 89% of Spanish speaking family child
care educators earn $40,000 or less annually. A quarter (23%) of English speakers and four out of 10
(42%) report their annual salary is less than $20,000.
Health and Dental Insurance (n = 188)
Just over half of family child care educators report they have health insurance (57%). 43% do not.
A smaller percentage report having dental insurance: 46%. The majority, 54%, do not have dental
insurance.
32% 28% 24% 10% 5%
Less than $20,000 $20,001 to 30,000 $30,001 to 40,000 $40,001 to 50,000 50,001 or greater
CHART 75. ANNUAL SALARY
23% 30% 28%
12% 4% 3%
42%
27% 20%
8% 3% 0%
L E S S T H A N $ 2 0 , 0 0 0
$ 2 0 , 0 0 1 T O $ 3 0 , 0 0 0
$ 3 0 , 0 0 1 T O $ 4 0 , 0 0 0
$ 4 0 , 0 0 1 T O $ 5 0 , 0 0 0
$ 5 0 , 0 0 1 T O $ 6 0 , 0 0 0
$ 6 0 , 0 0 1 O R G R E A T E R
CHART 76. ANNUAL SALARY
English speakers Spanish speakers

Oldham Innovative Research 79
Additional Employment (n = 191)
18 family child care educators (9%) report they work another job. The majority of educators, 91%,
do not work another job. Those who do work another job work between 4 and 43 hours a week at this
second job, with a median of 20 hours a week. When asked why they work another job, 6 of the 18 (33%)
said they need the supplemental income. One person said she owns another business and another said she
enjoys working another job.
English and Spanish Speaking Educators (n = 97 English speaking and 94 Spanish speaking)
13% of English speaking family child care educators work another job while 5% of Spanish
speaking family child care educators work another job.
TABLE 31. ADDITIONAL EMPLOYMENT AMONG FCC EDUCATORS
FCC Educators Work another job Average hours per week
English Speakers 13/97 (13.4%) 18.25 hours Median = 20
Spanish Speakers 5/94 (5.3%) 15.20 hours Median = 15
Benefits Provided to Assistants (n = 87)
Of the 87 respondents who report they have an assistant at their FCC, 29% report they provide
their assistants with paid vacations and paid holidays. 20% report providing their assistants with reduced
rates for their children to attend the FCC. 15% give bonuses and 12% provide paid sick leave. 6% offer
some type of financial assistance for college credits or professional development. One provider (1%)
46%
57%
54%
43%
D E N T A L I N S U R A N C E
H E A L T H I N S U R A N C E
CHART 77. INSURANCE COVERAGE
Yes No

Oldham Innovative Research 80
reports offering dental insurance42
, one offers disability insurance and one offers a retirement plan. No
providers offer health insurance to their assistants. Other benefits offered include: flexible hours,
allowing staff to bring children to work, yearly physical exams and a gym membership.
42
The one provider who offers dental insurance does not fully fund the plan.
29% 29% 20%
15% 12% 6%
Paid Vacation Paid Holidays Reduced rates forchildren of staff
Bonus Paid Sick Leave Financialassistance for
college credits/PD
CHART 78. TOP BENEFITS PROVIDED TO FCC ASSISTANTS

Oldham Innovative Research 81
C. Who are the populations served by family child care homes?
The second research question in the early childhood workforce study was “Who are the
populations served by the family child care homes?”. This question examined age groups served as well
as low income and English language learners within home based programs.
Enrollment (n = 124)
FCC educators were asked to list how many children of each age group they have enrolled full and
part time. 124 FCC educators provided details of enrollment43
. 61% of educators serve infants, 73%
serve toddlers, 84% serve preschoolers and 72% serve school age children.
English and Spanish Speaking Educators (n = 104 English speaking and 97 Spanish speaking)
About 6 out of 10 English and Spanish speaking family child care homes serve infants. Between
67% to 76% serve toddlers. 90% of English speaking educators and 75% of Spanish speaking educators
are serving preschoolers. 61% of English speaking educators and 90% of Spanish speaking educators are
serving school age children.
43
Calculations of enrollment are based on the number of survey respondents who provided details on the numbers of infants,
toddlers, preschoolers and/or school age children enrolled in their FCC (n=124).
61% 73%
84% 72%
Infants Toddlers Preschoolers School-age
CHART 79. PERCENT OF FCC HOMES SERVING AG E G ROUPS
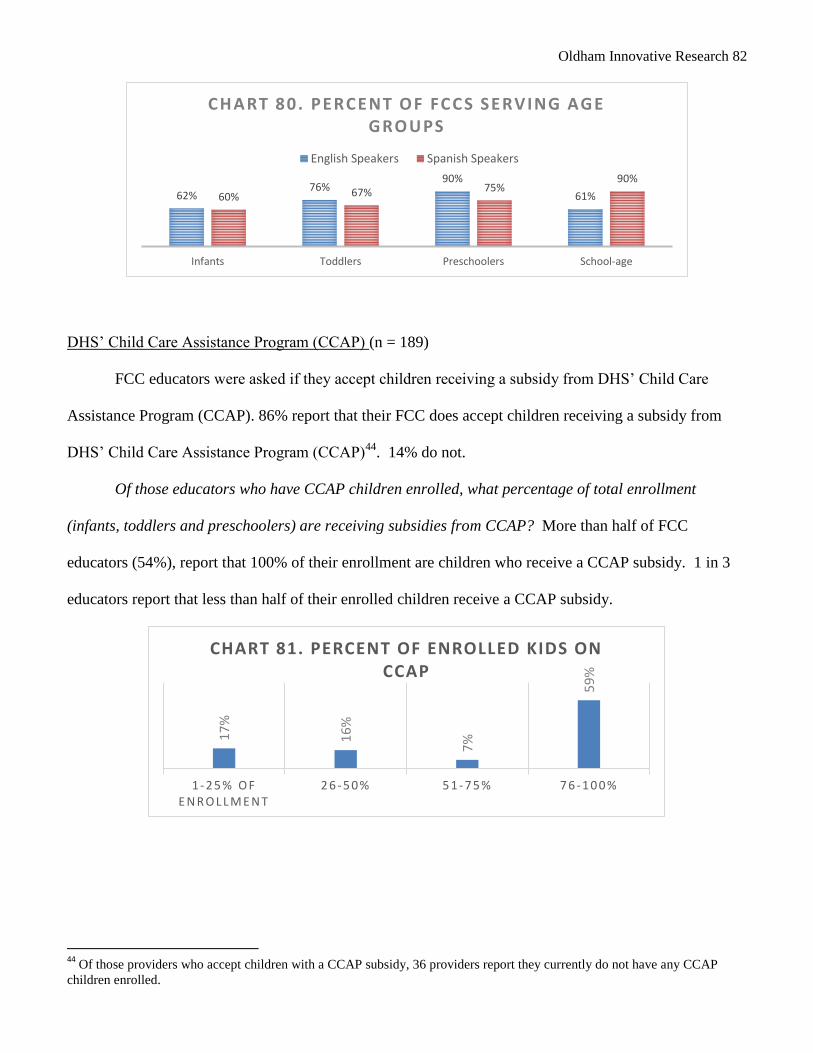
Oldham Innovative Research 82
DHS’ Child Care Assistance Program (CCAP) (n = 189)
FCC educators were asked if they accept children receiving a subsidy from DHS’ Child Care
Assistance Program (CCAP). 86% report that their FCC does accept children receiving a subsidy from
DHS’ Child Care Assistance Program (CCAP)44
. 14% do not.
Of those educators who have CCAP children enrolled, what percentage of total enrollment
(infants, toddlers and preschoolers) are receiving subsidies from CCAP? More than half of FCC
educators (54%), report that 100% of their enrollment are children who receive a CCAP subsidy. 1 in 3
educators report that less than half of their enrolled children receive a CCAP subsidy.
44
Of those providers who accept children with a CCAP subsidy, 36 providers report they currently do not have any CCAP
children enrolled.
62% 76%
90%
61% 60% 67% 75% 90%
Infants Toddlers Preschoolers School-age
CH ART 80. PERCENT OF FCCS SERVING AGE GRO UPS
English Speakers Spanish Speakers
17
%
16
%
7%
59
%
1 - 2 5 % O F E N R O L L M E N T
2 6 - 5 0 % 5 1 - 7 5 % 7 6 - 1 0 0 %
CHART 81. PERCENT OF ENROLLED KIDS ON CCAP

Oldham Innovative Research 83
Children Who Speak a Language Other Than English in Their Homes (n = 194)
When asked if their FCC has children who speak a language other than English in their home,
45% of family child care educators report having children who speak a language other than English in
their home. 55% have English-only speaking children.
Of those educators who have children who speak a language other than English at home, what
percentage of total enrollment (infants, toddlers, preschoolers and school-age) are these children? The
following graph details the percentage of total enrollment of children who are Dual Language Learners
(DLL). 43% of educators report 76-100% of their children are DLL. 44% of educators say that half or
less of their enrolled children are DLL.
English and Spanish Speaking Educators (n = 99 English speaking and 95 Spanish speaking)
Examining English and Spanish speaking educators separately, 36% of English speaking
educators and 54% of Spanish speaking educators have children who speak a language other than English
in their homes. Spanish speaking educators have a greater proportion of their enrollment made up of
children who speak a language other than English.
23
%
21
%
14
% 4
3%
1 - 2 5 % O F
E N R O L L M E N T 2 6 - 5 0 % 5 1 - 7 5 % 7 6 - 1 0 0 % O F
E N R O L L M E N T
CHART 82. PERCENT OF ENROLLED KIDS WHO ARE DLL

Oldham Innovative Research 84
28
%
24
%
16
% 3
2%
16
%
16
%
11
%
58
%
1 - 2 5 % O F E N R O L L M E N T 2 6 - 5 0 % 5 1 - 7 5 % 7 6 - 1 0 0 % O F E N R O L L M E N T
CHART 83. PERCENT OF ENROLLED KIDS WHO ARE DLL
English Speakers Spanish Speakers
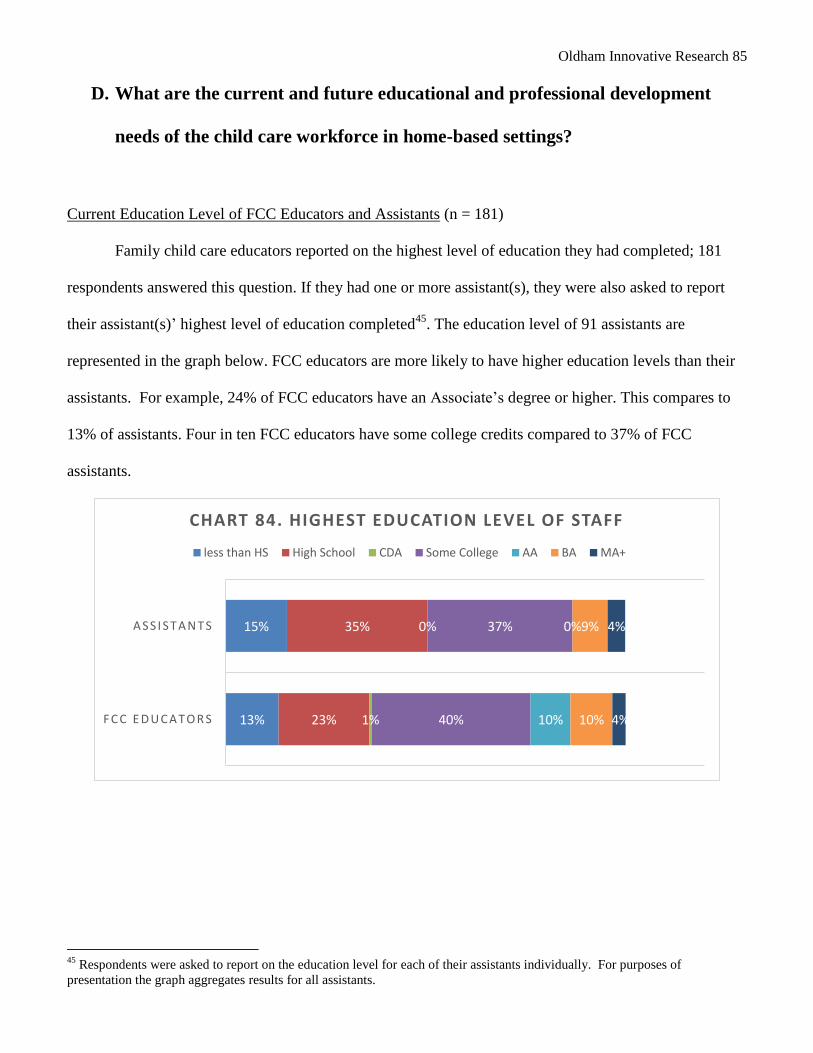
Oldham Innovative Research 85
D. What are the current and future educational and professional development
needs of the child care workforce in home-based settings?
Current Education Level of FCC Educators and Assistants (n = 181)
Family child care educators reported on the highest level of education they had completed; 181
respondents answered this question. If they had one or more assistant(s), they were also asked to report
their assistant(s)’ highest level of education completed45
. The education level of 91 assistants are
represented in the graph below. FCC educators are more likely to have higher education levels than their
assistants. For example, 24% of FCC educators have an Associate’s degree or higher. This compares to
13% of assistants. Four in ten FCC educators have some college credits compared to 37% of FCC
assistants.
45
Respondents were asked to report on the education level for each of their assistants individually. For purposes of
presentation the graph aggregates results for all assistants.
13%
15%
23%
35%
1%
0%
40%
37%
10%
0%
10%
9%
4%
4%
F C C E D U C A T O R S
A S S I S T A N T S
CHART 84. HIGHEST EDUCATION LEVEL OF STAFF
less than HS High School CDA Some College AA BA MA+

Oldham Innovative Research 86
English and Spanish Speaking Educators (n = 99 English speaking and 82 Spanish speaking)
Different levels of education were reported by English speaking staff and Spanish speaking staff.
5% of English speaking educators report having less than a high school diploma and 23% of Spanish
speaking educators report having less than a high school diploma. 31% of English speaking educators
report at least a two year college degree and 15% of Spanish speaking family child care educators report
at least a two year college degree
15
% 35%
0%
18% 19%
0% 0% 0% 9%
0% 4%
A S S I S T A N T S
CHART 85. HIGHEST EDUCATION LEVEL OF ASSISTANTS
Less than HS HS CDA Some College/ECE
Some College/Not ECE AA in ECE AA not ECE BA in ECE
BA not ECE MA in ECE MA not ECE
13
%
23%
1%
23% 17%
5% 5% 2% 8%
2% 2%
F C C E D U C A T O R S
CHART 86. HIGHEST EDUCATION LEVEL OF FCC EDUCATORS
Less than HS HS CDA Some College/ECE
Some College/Not ECE AA in ECE AA not ECE BA in ECE
BA not ECE MA in ECE MA not ECE

Oldham Innovative Research 87
Pursuit of Education (n = 181)
Family child care educators were asked whether they were currently pursuing or interested in
pursuing any additional education. Numbers of family child care educators and their assistants pursing or
interested in pursuing additional education are presented in charts 88 and 89.
5%
18%
1%
28%
16%
5%
9%
1%
11%
3% 2%
23%
28%
0%
17% 17%
5%
0%
4% 5%
0% 1%
Less thanHS
HighSchool
CDA CollegeECE
CollegeNon-ECE
AA ECE AA Non-ECE
BA ECE BA Non-ECE
MA ECE MA Non-ECE
CHART 87. EDUCATION LEVEL OF FCC EDUCATORS
English speakers Spanish speakers3
4
7
7
19
13
20
10
19
4 7
7
14
3
2
2
12
3
3
C U R R E N T L Y P U R S U I N G I N T E R E S T I N P U R S U I N G
CHART 88. PURSUIT OF EDUCATION: FCC EDUCATOR
HS Diploma/GED CCRI Level I CDA Credential AA in ECE AA not in ECE
BA in ECE BA not in ECE MA in ECE MA not in ECE

Oldham Innovative Research 88
English and Spanish Speaking Educators (n = 99 English speakers and 82 Spanish speakers)
A quarter of Spanish speaking FCC educators are currently pursuing their high school diploma
(10% of English speaking educators are as well). Smaller numbers of family child care educators are
pursuing some college credits and/or other degrees.
While Spanish speaking educators currently have lower levels of education, the data show there is
substantial desire among the Spanish speaking educators to pursue additional education; 37% of the
Spanish speaking educators report wanting to pursue at least a two year college degree compared to 20%
of English speaking educators who report wanting to pursue at least a two year college degree.
7 8
2
9
0
11
1
18
2
2
0 5
2 4
0 3
0 5
C U R R E N T L Y P U R S U I N G I N T E R E S T I N P U R S U I N G
CHART 89. PURSUIT OF EDUCATION: FCC ASSISTANTS
HS Diploma/GED CCRI Level I CDA Credential AA in ECE AA not in ECE
BA in ECE BA not in ECE MA in ECE MA not in ECE
10%
5% 7% 6%
3% 2% 2% 0%
2%
25%
2%
6% 4%
1%
5%
1% 2% 1%
High SchoolDiploma
CCRI Level 1Program
CDA AA/ECE AA/Non ECE BA/ECE BA/Non ECE MA/ECE MA/NonECE
CHART 90. PURSUIT OF EDUCATION
English speakers Spanish speakers

Oldham Innovative Research 89
National Comparison
As compared to a national sample of FCC educators, there are fewer Rhode Island family child
care educators with an Associate’s or Bachelor’s degree. 10% of family child care educators in Rhode
Island have an Associate’s degree compared to 16% of a national sample of family child care educators.
14% of family child care educators in Rhode Island have at least a Bachelor’s degree compared to 16% of
a national sample of family child care educators.
0%
9% 8% 8% 4% 5%
0% 2% 1%
7% 10%
12% 11%
3%
9%
2%
10%
2%
High SchoolDiploma
CCRI Level 1Program
CDA AA/ECE AA/Non ECE BA/ECE BA/Non ECE MA/ECE MA/NonECE
CHART 91 . INTEREST IN PURSUING EDUCATION
English speakers Spanish speakers
36% 40%
10% 14%
34% 34%
16% 16%
HS or less Some college, no degree AA degree BA or higher
CHART 92 . LE V ELS OF E DUCATION: NATIONAL COMPARISON
RI FCCs National FCCs

Oldham Innovative Research 90
Teacher Certification (n = 181)
FCC educators were asked to indicate whether or not they had attained Rhode Island Teacher
Certification and if so, what type of certificate(s) they have. 14% of FCC educators report they have RI
Teacher Certification. 9%46
of FCC assistants are reported to have a RI Teacher Certification.
Of the 8 FCC educators who report they are currently pursuing certification, 4 are working toward
certification in Early Childhood, 2 toward Early Childhood Special Education and 3 toward certification
in Elementary Education (respondents can select to be pursuing certification in multiple areas). Of the 15
FCC educators who report being interested in pursuing RI Teacher Certification, certification in early
childhood is the most popular, with 13 educators expressing interest. 9 are interested in early childhood
special education and 6 in elementary education.
46
Please note the small sample size for the analysis of assistants with certificates. 9% of the FCC assistants is only 8 assistants.
14
%
9%
% C E R T I F I E D
C H A R T 93 . R I TEA C H ER C ER TIF IC A TIO N
FCC Educator FCC Assistant
8
15
1 4
C U R R E N T L Y P U R S U I N G
I N T E R E S T E D I N P U R S U I N G
C H A R T 94 . R I TEA C H ER C ER TIF IC A TIO N
FCC Educator FCC Assistant

Oldham Innovative Research 91
At the time of the survey, only 1 assistant reported pursuing RI Teacher Certification in both early
childhood special education and elementary education. Of the 4 assistants who reported interest in
pursuing certification, 3 are interested in early childhood, 4 in early childhood special education and 1 in
elementary education.
English and Spanish Speaking Educators47
(n = 99 English speaking and 82 Spanish speaking)
The The data show that 9% of English speaking family child care educators have a Rhode Island
teaching certificate and that 20% of Spanish speaking family child care educators do. 4% of English
speakers and 6% of Spanish speakers are pursuing a teaching certificate and 9% of English speakers and
11% of Spanish speakers would like to pursue a teaching certificate. There is the most interest in
pursuing the early childhood PreK – Grade 2 teaching certificate.
47
According to the data obtained from this question, Spanish speaking educators in Rhode Island are more likely than English
speaking educators to have RI Teaching Certification. This discrepancy may be due to a misunderstanding of the intent of the
question. Spanish speaking respondents may have confused a professional development certificate of completion in early
childhood education with the Rhode Island Department of Education public school certification. These are two different
certificates.
4
13
2
9
3 6
C U R R E N T L Y P U R S U I N G
I N T E R E S T E D I N P U R S U I N G
CHART 95. PURSUIT OF RI TEACHER CERTIFICATION: FCC
EDUCATOR
Early Childhood Early Childhood SPED
Elementary Ed
0 3
1 4
1
1
C U R R E N T L Y P U R S U I N G
I N T E R E S T E D I N P U R S U I N G
CHART 96. PURSUIT OF RI TEACHER CERTIFICATION:
FCC ASSISTANT
Early Childhood Early Childhood SPED
Elementary Ed
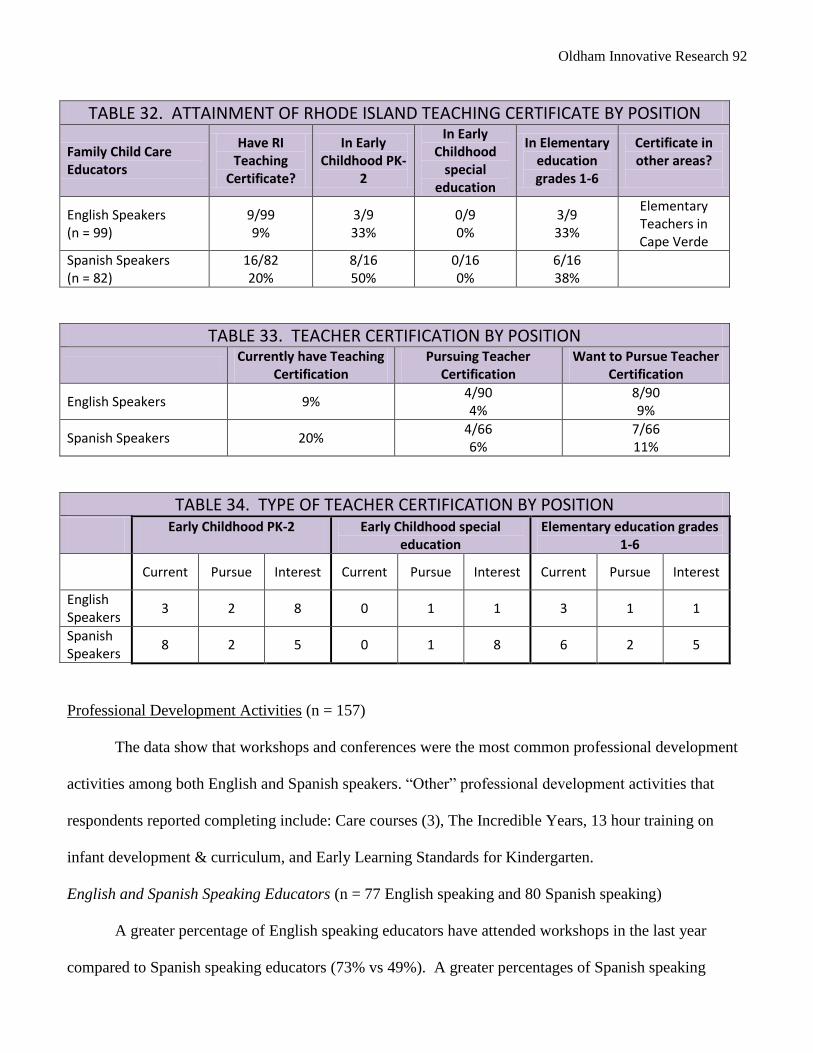
Oldham Innovative Research 92
TABLE 32. ATTAINMENT OF RHODE ISLAND TEACHING CERTIFICATE BY POSITION
Family Child Care Educators
Have RI Teaching
Certificate?
In Early Childhood PK-
2
In Early Childhood
special education
In Elementary education grades 1-6
Certificate in other areas?
English Speakers (n = 99)
9/99 9%
3/9 33%
0/9 0%
3/9 33%
Elementary Teachers in Cape Verde
Spanish Speakers (n = 82)
16/82 20%
8/16 50%
0/16 0%
6/16 38%
TABLE 33. TEACHER CERTIFICATION BY POSITION
Currently have Teaching
Certification Pursuing Teacher
Certification Want to Pursue Teacher
Certification
English Speakers 9% 4/90 4%
8/90 9%
Spanish Speakers 20% 4/66 6%
7/66 11%
TABLE 34. TYPE OF TEACHER CERTIFICATION BY POSITION
Early Childhood PK-2 Early Childhood special education
Elementary education grades 1-6
Current Pursue Interest Current Pursue Interest Current Pursue Interest
English Speakers
3 2 8 0 1 1 3 1 1
Spanish Speakers
8 2 5 0 1 8 6 2 5
Professional Development Activities (n = 157)
The data show that workshops and conferences were the most common professional development
activities among both English and Spanish speakers. “Other” professional development activities that
respondents reported completing include: Care courses (3), The Incredible Years, 13 hour training on
infant development & curriculum, and Early Learning Standards for Kindergarten.
English and Spanish Speaking Educators (n = 77 English speaking and 80 Spanish speaking)
A greater percentage of English speaking educators have attended workshops in the last year
compared to Spanish speaking educators (73% vs 49%). A greater percentages of Spanish speaking

Oldham Innovative Research 93
educators have completed onsite training, specialized training, university classes, college classes and have
attended conferences compared to English speaking educators.
Supports Needed to Meet Professional Development Goals
Family child care educators responding to the survey were asked what supports they need in order
to reach their professional development goals.
English and Spanish Speaking Educators: Financial aid or scholarships was the most commonly selected
support needed by both English and Spanish speaking family child care educators. Online courses were
also a needed support. As compared to English speakers, a larger percentage of Spanish speaking
educators expressed a need for a mentor, courses on infant/toddlers, help with courses in English and help
with studying, writing and math.
20%
73%
15% 16%
38% 49%
30% 13%
Onsite Training Workshops Specialized Training Online training
C H A R T 9 7 . P R O F ES S I O N A L D E V E LO P M E N T A C T I V I T I ES A M O N G E N G L I S H A N D S PA N I S H S P E A K E R S
English speakers Spanish speakers
42%
6% 13%
6%
51%
12% 18%
2%
Conferences University Classes Community College classes Online College Classes
C H A R T 9 7 A . P R O F E S S I O N A L D E V E LO P M E N T A C T I V I T E I S A M O N G E N G L I S H A N D S PA N I S H S P E A K E R S
English speakers Spanish speakers

Oldham Innovative Research 94
Child care: 15% of English speaking educators and 10% of Spanish speaking educators said that
child care would help them reach their professional development goals.
Mentor/Advisor: Mentors or advisors to help with coursework and planning were desired by 14%
of English speaking educators and 40% of Spanish speaking educators.
Transportation: Spanish speaking educators were the one group to request transportation to
support them in their goals (17%).
Online Courses: 21% of English speaking educators and 37% of Spanish speaking educators
requested online courses to support them in their goals.
Financial Aid: Financial support was requested by a third of English speaking educators and
almost half of Spanish speaking educators as a support to help reach their professional development goals.
Courses related to infants and toddlers: Almost half (46%) of Spanish speaking educators and
17% of English speaking educators requested more courses relevant to infant/toddlers.
15% 14% 3%
21%
34%
17% 10%
40%
17%
37% 47% 46%
Child care Mentor Transportation Online Courses Financial Aid Courses onInfants/Toddlers
CHART 98. SUPPORT NEEDED TO REACH PD G OALS
English Speakers Spanish Speakers
10% 4% 5% 4%
11%
43%
18% 25%
30%
45%
Help with course inEnglish
Help with studying Help with writing Help with math Course in otherlanguages
CHART 98A . SUPPORT NEEDED TO REACH PD G OALS
English Speakers Spanish Speakers

Oldham Innovative Research 95
Help taking a course in English: Help taking a course in English was requested by 43% of Spanish
speaking educators.
Help with study skills and testing taking: 4% of English speaking educators and 18% of Spanish
speaking educators request help with study skills and test taking.
Help with writing: 5% of English speaking educators and 25% of Spanish speaking educators
request help with writing.
Help with math: 4% of English speaking educators and 30% of Spanish speaking educators
request help with math.
Courses offered in other lanaguage: Courses in other languages was requested by 45% of
Spanish speaking educators.
Internet Access
English and Spanish Speaking Educators: 97% of English speaking and 71% of Spanish speaking
family child care educators report they have reliable, daily access to the internet. Respondents report
accessing the internet most often at home and at the FCC (the “work site”).
97%
71%
English Speakers Spanish Speakers
CHART 99. DAILY RELIABLE ACCESS TO
THE INTERNET
68%
21%
72%
64%
33%
23%
5%
5%
English Speakers
Spanish Speakers
CHART 100. HOW INTERNET ACCESSED BY EDUCATORS
Another Location On My Phone
At My Home At Work Site

Oldham Innovative Research 96
V. Key Findings
The Rhode Island Early Learning Workforce Study addressed three key research questions:
1. What are the key characteristics of the early child care workforce?
2. Who are the populations served by the centers and family child care programs?
3. What are the current and future educational and professional development needs of the child
care workforce?
Before addressing the findings of each of the research questions, the following data points are
presented to provide contextual information about the child care programs in which Rhode Island’s
early childhood workforce is employed.
More than 33% of responding center directors report that their center has been affected by the
following in the past year: families are behind on payment, enrollment has been low, their center
has limits on purchasing or has been unable to purchase equipment and/or materials, and staff
salaries have been stagnant.
Engaged programs (defined as those accredited by in NAEYC, involved in BrightStars or
involved in the RIDE Comprehensive Early Childhood Education (CECE) Program Approval)
are more likely than non-engaged programs to report that in the last year staff at their center have
been laid off and that staff salaries and/or hours have been cut.
Center directors responding from centers in Rhode Island’s core cities (Central Falls, Pawtucket,
Providence and Woonsocket) are less likely than centers in non-core cities to report difficulty in
finding qualified staff for their center. Center directors report that it is easier to find qualified
staff in Rhode Island’s core cities.
As compared to Head Start programs, non-Head Start programs are more likely to report
classroom closures, families who are behind on paying their child care fees, low enrollment, and
they have cut staff salaries and/or hours.

Oldham Innovative Research 97
Center directors responding from larger programs (programs with more than 100 children) report
more staff layoffs, classroom closures and difficulty in finding qualified staff than small or
medium sized programs.
As compared to medium or large programs, center directors responding from small programs
(programs with less than 60 children) are more likely to report low enrollment and limits on
purchases of equipment and/or materials.
As compared to small or large programs, center directors responding from medium sized
programs (programs with between 60 and100 children) are more likely to report their program
had cut staff benefits.
18% of centers had to close a classroom in the last year; two-thirds of classroom closures affected
preschool classrooms.
As reported by family child care educators, more than a third of family child care programs have
been affected by the following in the past year: low enrollment, families behind on paying fees,
limited or no support for attending professional development activities, limits or an inability to
purchase equipment and/or materials, stagnant staff salaries and cutting of staff benefits, salaries
and/or hours.
Research Question 1: What are the key characteristics of the early child care workforce?
1. As compared to a national sample, Rhode Island has a greater number of teaching staff working
part time48
.
36% of Rhode Island center teaching staff49
report working part time compared to 26% of
teaching staff in a national sample of teachers. 64% of Rhode Island teaching staff work full
48
As defined by the National Survey of Early Care and Education (NSECE), part time work is less than 35 hours per week.
When comparing to the national sample, analyses of Rhode Island teaching staff hours are conducted with this definition. All
other analyses of hours worked use the definitions outlined in the Early Learning Workforce Study center director survey: part
time is less than 30 hours per week and full time is 30 hours or more per week. 49
Teaching staff in Rhode Island includes education coordinators, teachers and assistant teachers.

Oldham Innovative Research 98
time compared to 74% of teachers nationally.
There is a greater percentage of assistant teachers working part time than assistant directors,
education coordinators or teachers.
2. As compared to center staff, family child care educators are more likely to work more than 40
hours per week.
71% of family child care educators report working more than 40 hours a week. 36% report
working more than 50 hours a week. This compares to 17% of assistant directors, 9% of
education coordinators, 6% of teachers and 3% of assistant teachers who report working more
than 40 hours a week.
3. As compared to a national sample of teachers, Rhode Island’s workforce has fewer years of
teaching experience.
19% of teaching staff in Rhode Island have less than a year of experience in the early
childhood field as compared to 4% of teachers in a national sample who have less than a year
of experience.
23% of Rhode Island teaching staff have 10 or more years of experience compared to 50% of
teachers from a national sample.
4. Child care center administrators in Rhode Island have more years of experience than center
teaching staff.
Assistant directors in Rhode Island child care centers have more years experience than
teaching staff. 46% of assistant directors have 10 or more years of experience compared to
15% of assistant teachers who have 10 or more years of experience.

Oldham Innovative Research 99
5. Family child care educators in Rhode Island have more years of experience than child care
center directors.
56% of family child care educators report having 10 or more years of experience as compared
to 34% of center directors who report 10 or more years of experience.
6. 27% of centers report turnover in teaching staff in the last year.
Of those reporting turnover, 41% of child care centers experienced turnover in teachers and
47% experienced turnover in assistant teachers.
Small programs had a higher turnover rate than medium or large programs; there was a 44%
turnover rate in small programs versus 21% in medium programs and 16% in large programs.
Turnover rates did not differ between engaged versus not-engaged programs or in programs in
the core cities versus those not in the core cities. There was not a large enough sample to
compare Head Start programs versus non-Head Start programs.
7. Rhode Island teaching staff earn more money per hour than a national sample of teachers.
Teaching staff in Rhode Island earn a median hourly wage of $11.92. Nationally, teaching
staff earn a median hourly wage of $10.60.
Reported salaries are in alignment with the professional level of staff; assistant directors and
directors earn more than teachers or assistant teachers.
55% of assistant directors, 46% of education coordinators, 17% of teachers and 2% of assistant
teachers earn $30,000 or more a year. 77% of assistant teachers, 37% of teachers and 20% of
education coordinators earn less than $20,000 a year.
42% of Spanish speaking family child care educators and 23% of English speaking family
child care educators earn less than $20,000 a year.

Oldham Innovative Research 100
8. Wages increase as education increases.
Teaching staff in Rhode Island who have a high school diploma or less earn $9.50/hour
compared to $10.00/hour for those with college credits, $12.00/hour for those with an
Associate’s degree and $14.25 for those with at least a Bachelor’s degree.
Nationally, teachers with a high school diploma or less earn $9.00/hour, $9.30/hour with
college credits, $11.00/hour with an Associate’s degree and $14.70/hour with at least a
Bachelor’s degree.
9. Infant/toddler teaching staff earn less than preschool teaching staff.
Infant/toddler teaching staff in Rhode Island earn a median hourly wage of $10.50 compared
to preschool teaching staff that earn $13.00/hour.
Infant/toddler teachers have less education and are paid less than preschool teachers.
Even when comparing infant/toddler teachers and preschool teachers with comparable
education, infant/toddler teachers are paid less. Rhode Island infant/toddler teachers with at
least a Bachelor’s degree earn $13.00/hour. Preschool teachers with at least a Bachelor’s
degree earn $15.25/hour.
10. Half of full time center staff have access to health insurance. 57% of family child care educators
have health insurance.
50% of child care centers offer health insurance to their full time staff. 8% offer health
insurance to their part time staff. 93% of programs ask staff to partially pay for their health
insurance.
57% of family child care educators report having health insurance. No family child care
owners report offering health insurance to their assistants.

Oldham Innovative Research 101
11. 32% of full time center staff do not have access to paid vacation and almost half do not have
access to sick leave. In family child care homes, less than a third of assistants have access to
paid vacation or sick leave.
68% of center programs offer paid vacation to full time staff and 27% offer paid vacation to
part time staff. 55% of center programs offer paid sick leave to full time staff and 25% offer
paid sick leave to part time staff.
29% of assistants within family child care homes are provided with paid vacation, 29% are
provided paid holidays and 12% are provided paid sick leave.
12. Long term benefits from employment, including disability insurance and retirement plans, are
offered to less than half of center staff.
40% of center programs offer a retirement plan to full time staff (only 14% of program fully
fund the retirement program). 10% of center programs offer a retirement plan to part time
staff.
31% of center programs offer disability insurance to full time staff50
. 14% of center programs
offer disability insurance to part time staff.
Only one of the 87 family child care educators who employ assistants offers a retirement plan
and disability insurance.
Research Question 2. Who are the populations served by the centers and family child care programs?
1. Preschoolers are the most commonly served population by centers and family child care homes.
50 Rhode Island has a state-run short-term disability insurance program managed by the Department of Labor and Training. The
majority of private employers/employees are required to participate in this program. In responding to this question, center staff
may have been unaware of this program or misunderstood the question since disability insurance is offered through the state
and not directly by the center. This context is important to keep in mind when responding to this data.

Oldham Innovative Research 102
92% of responding centers serve preschoolers. Fewer programs serve toddlers (62%), school
age children (51%) and infants (43%).
84% of family child care homes serve preschoolers, 73% serve toddlers, 72% serve school age
and 61% serve infants. Spanish speaking family child care educators are more likely to serve
school age children.
2. The majority of centers and family child care homes have children enrolled who speak a
language other than English.
Three-quarters (76%) of centers have children enrolled who speak a language other than
English in the home.
57% of family child care educators report that more than half of their enrollment is children
who speak a language other than English in the home.
Research Question 3. What are the current and future educational and professional development needs
of the child care workforce?
1. Three-quarters of center directors report having achieved a 4 year college degree, many in early
childhood education.
Three-quarters of center directors report having a Bachelor’s degree or higher level degree.
31% of center directors report having a Bachelor’s degree in early childhood education. An
additional 15% of center directors report having a Master’s degree in early childhood
education.
Engaged programs, those participating in national accreditation, BrightStars or the RIDE
Comprehensive Early Childhood Education Program Approval, are more likely than non-
engaged programs to have a director with a Master’s degree.

Oldham Innovative Research 103
As compared to directors of programs in non-core cities, center directors who work at
programs in the core cities (Central Falls, Pawtucket, Providence or Woonsocket) are more
likely to have a Master’s degree.
2. Education level of Spanish speaking family child care educators is lower than the education
level of English speaking family child care educators.
23% of Spanish speaking family child care educators have less than a high school diploma
compared to 5% of English speaking family child care educators.
15% of Spanish speaking family child care educators have at least a two year college degree
compared to 31% of English speaking educators.
Although Spanish speaking family child care educators have lower levels of education than
English speaking family child care educators, data shows Spanish speaking educators have a
greater desire to pursue additional education; 37% of Spanish speaking educators want to
pursue at least a two year college degree as compared to 20% of English speaking educators.
3. There are more Rhode Island teaching staff with Bachelor’s degrees than in a national sample
of teachers.
31% of Rhode Island teaching staff have a Bachelor’s degree compared to 26% of a national
teaching sample. 9% of Rhode Island teaching staff have a Master’s degree compared to 9%
of a national teaching sample.
4. As compared to a national sample of teachers, fewer infant/toddler teachers in Rhode Island
have a Bachelor’s degree. However, more Rhode Island infant/toddler teachers have some
college credits when compared to a national sample.

Oldham Innovative Research 104
15% of the Rhode Island infant/toddler teaching staff have a Bachelor’s degree as compared to
19% of a national sample.
44% of the Rhode Island infant/toddler teaching staff have some college credits compared to
36% of the national sample.
5. Similar to national trends, Rhode Island infant/toddler teaching staff have less education than
preschool teaching staff.
24% of the infant/toddler teaching staff in Rhode Island have a high school diploma or less
compared to 8% of the preschool teaching staff.
15% of the infant/toddler teaching staff have a Bachelor’s degree compared to 47% of the
preschool teaching staff.
These trends are similar to national data. 47% of the Rhode Island preschool teaching staff
have a Bachelor’s degree compared to 45% of a national teaching sample of preschool
teachers. 15% of the Rhode Island infant/toddler teaching staff have a Bachelor’s compared to
19% of the national infant/toddler teaching sample.
6. As compared to a national sample of family child care educators, a smaller percentage of Rhode
Island family child care educators have an Associate’s or Bachelor’s degree.
10% of family child care educators in Rhode Island have an Associate’s degree compared to
16% of a national sample of family child care educators.
14% of family child care educators in Rhode Island have at least a Bachelor’s degree
compared to 16% of a national sample of family child care educators.
7. The Rhode Island child care workforce is interested in pursuing higher levels of education,
particularly Bachelor’s and Master’s degrees.

Oldham Innovative Research 105
31% of assistant directors, 45% of education coordinators, 42% of teachers and 28% of
assistant teachers are interested in pursuing a Bachelor’s or Master’s degree.
4% of assistant directors, 2% of education coordinators, 15% of teachers and 10% of assistant
teachers are interested in pursuing a Bachelor’s degree in early childhood education.
10% of assistant directors, 25% of education coordinators, 15% of teachers and 8% of assistant
teachers are interested in pursuing a Master’s degree in early childhood education.
8% of English speaking family child care educators and 23% of Spanish speaking family child
care educators are interesting in pursuing a Bachelor’s or Master’s degree.
5% of English speaking family child care educators and 9% of Spanish speaking family child
care educators are interested in pursuing a Bachelor’s degree in early childhood education.
2% of English speaking family child care educators and 10% of Spanish speaking family child
care educators are interested in pursuing a Master’s degree in early childhood education.
8. The Rhode Island child care workforce is interested in pursuing teacher certification, primarily
certification in early childhood, PreK to Grade 2.
45% of directors have a Rhode Island teaching certificate. 67% of education coordinators, 34%
of assistant directors, 25% of assistant directors, 25% of teachers and 6% of assistant teachers
have a Rhode Island teaching certificate.
10 assistant directors51
, 19 education coordinators, 147 teachers and 118 assistant teachers
want to pursue a teaching certificate in early childhood PreK- Grade 2. Smaller numbers want
a teaching certificate in early childhood special education and elementary education grades 1-
6.
51
Data are presented in actual numbers rather than percentages because of the small sample. These numbers within the context
of the response rate can be used to estimate demand for certain programs.

Oldham Innovative Research 106
14% of family child care educators and 9% of family child care assistants have a Rhode Island
teaching certificate.
8 English speaking family child care educators and 7 of Spanish speaking family child care
educators want to pursue teaching certification.
9. Participation in professional development primarily occurs thru onsite trainings, workshops
and conferences.
Participation in professional development for center staff primarily occurs thru onsite trainings
and workshops. In addition to onsite trainings and workshops, administrative staff are also
likely to attend conferences.
Participation in professional development for family child care educators primarily occurs thru
workshops and conferences.
10. Financial aid, online courses and mentors are the primary resources needed to support the
family child care workforce in meeting their professional development goals52
.
34% of English speaking family child care educators and 47% of Spanish speaking family
child care educators report they need financial aid to support them in reaching their
professional development goals.
21% of English speaking family child care educators and 37% of Spanish speaking family
child care educators need online courses to support their professional development goals.
14% of English speaking family child care educators and 40% of Spanish speaking family
child care educators need mentors to support their professional development goals.
52
Professional development goals may include goals related to educational advancement.

Oldham Innovative Research 107
11. As compared to other teaching staff, assistant teachers and Spanish speaking family child care
educators report needing specific supports to help them reach their professional development
goals.
Assistant teachers and Spanish speaking family child care educators report needing help with
study skills and test taking, help taking courses in English, and help with math and writing
assignments..
47% of Spanish speaking family child care educator report they need courses related to infants
and toddlers to help them reach their professional development goals.
12. The level and type of supports offered by child care centers to staff range across centers and
staff positions.
About half of center directors report their center offers mentoring, orientation, paid planning
and preparation time and financial support for trainings and local conferences.
About a third of center teaching staff report being offered paid planning time. About a quarter
report being offered mentoring within the program. Less than a quarter of teaching staff report
they are offered orientation.
Education coordinators are more likely than teachers and assistant teachers to be offered
financial support to attend local and national conferences.
13. The majority of the child care workforce reports having reliable access to the Internet.
97% of directors, 99% of assistant directors, 97% of education coordinators, 95% of teachers
and 93% of assistant teachers report reliable Internet access. Internet is primarily accessed in
the home.
97% of English speaking family child care educators and 71% of Spanish speaking family
child care educators report reliable Internet access. Internet is primarily accessed in the home.

Oldham Innovative Research 108
VI. Recommendations and Considerations
The following recommendations are based on the findings from the Early Learning Workforce
Study that are presented above and in the comprehensive final report. The objective of this study is to
provide information that will help to inform the development of statewide policies, programs and
initiatives to support individuals working in early learning programs to improve the school readiness of
children.
1. Continue to track key variables over time through the Early Care and Education Data
System/Workforce Registry.
2. Use the results of this study to align technical assistance and professional development that is
provided to the early child care workforce.
3. Use the results of this study to inform ongoing data collection efforts.
4. Consider the larger context of the programs in which the workforce is employed when designing
supports. Context may include, but is not limited to, financial constraints that affect staff, program
location, program size, experience of directors and teaching staff and type of program funding.
5. Identify best practices for offering professional development opportunities to part time child care
staff.
6. Investigate why infant/toddler teachers earn less than preschool teachers even when staff have
comparable education levels.
7. Investigate why there is less availability of infant/toddler care within child care programs and
whether there is demand for more spaces.
8. Tailor technical assistance and professional development to the unique needs of different positions
and populations of the child care workforce.
9. Invest in online options for professional development opportunities.

Oldham Innovative Research 109
10. In considering the high demand for Bachelor’s and Master’s level programs, determine whether
there are current programs to meet the demand, if this is a gap in services or if there are other
obstacles that prevent the workforce from entering programs.
11. Align TEACH scholarships with the expressed demand for increased education.
12. Consider the impact increased education level has on wages, turnover and departure from the field.
13. Consider whether the child care workforce has adequate knowledge to serve children learning
English and/or children who speak a language other than English. If this is a gap in workforce
knowledge, create professional development supports to address this need.
14. Consider whether the child care workforce is adequately trained to serve infants/toddlers
effectively. If this is a gap in workforce knowledge, create professional development supports to
address this need.

Oldham Innovative Research 110
VII. Appendices
Appendix A. Data from “Other” Questions
Various questions throughout all three surveys asked for narrative information referred to as “other”
information. Detailed “other” information is presented from the three surveys below.
1. Number of College Credits.
Directors: Number of College Credits. If respondents reported they have college credits, either in ECE,
childhood development or another field, they were asked to report how many credits they have. 14
respondents noted their current credit level.
1-12 credits 3 respondents (21.4%)
13-17 credits 2 respondents (14.3%)
18-23 credits 2 respondents (14.3%)
More than 24 credits 6 respondents (42.9%)
Directors that reported having some college credits in another field, reported the following fields:
Business or Accounting degree (1) and Communications degree (1).
Center Staff: Number of College Credits. If respondents reported they have college credits, either in
ECE, childhood development or another field, they were asked to report how many credits they have.
College Credits
1-12 credits 13-17 credits 18-23 credits 24 or more
credits
Assistant Director
(n = 7)
3 (42.9%) 1 (14.3%) 2 (28.6%) 1 (14.3%)
Education
Coordinator (n =
5)
2 (40.0%) 0 (0.0%) 1 (20.0%) 2 (40.0%)
Teacher (n = 66) 26 (39.4%) 11 (16.7%) 7 (10.6%) 22 (33.3%)
Assistant Teacher
(n = 83)
36 (43.4%) 13 (15.7%) 16 (19.3%) 18 (21.7%)
Staff who reported having some college credits in another field, reported the following fields: General
Studies (21), Early Childhood Education (19), Psychology (9), Business (8), Nursing (8) (including

Oldham Innovative Research 111
Licensed Practical Nursing and Pediatrics), Liberal Arts (5), Elementary Education (5), Criminal Justice
(5), Special Education (4), Social Work (3), General Education (3), Accounting (2), Physical Education
(2), Human Services (2), Associates in Art (1), Chemical Technology (1), Child Development (1),
Communications (1), Culinary Arts (1), Education (1), English (1), Health Education (1), Human Services
Management (1), Management (1), Massage Therapy (1), Medical Assistant (1), Medical Field (1), Music
(1), Musical Theater (1), Network Engineer (1), Nutrition (1), Occupational Therapy (1), Pharmacy
Technician (1), Political Science/Law (1), Respiratory Therapy (1), Social Services (1), Special Education
K-6 (1), Speech Language Hearing Science (1), Studio Art (1), Assistant teacher Certificate (1), Women
Studies (1) and X-Ray (1).
Family Child Care Educators: Number of College Credits. If respondents reported they have college
credits, either in ECE, childhood development or another field, they were asked to report how many
credits they have. The following table breaks down the number of credits reported by respondents. 62
survey respondents answered this question.
1-12 credits 37 providers (59.7%)
13-17 credits 4 providers (6.5%)
18-23 credits 5 providers (8.1%)
More than 24 credits 16 providers (25.8%)
Family child care educators that reported having some college credits in another field, reported the
following fields: Pharmacy (1), Criminal Justice and Sociology (1), Administration (1), Travel and
Tourism (1) and a Bachelors in Commerce and Administration (1).
Family Child Care Assistants: Number of College Credits. If respondents reported they have college
credits, either in ECE, childhood development or another field, they were asked to report how many
credits they have. The following table breaks down the number of credits reported by FCC assistants. 24
survey respondents answered this question.
1-12 credits 8 assistants (33.3%)
13-17 credits 5 assistants (20.8%)
18-23 credits 3 assistants (12.5%)
More than 24 credits 8 assistants (33.3%)

Oldham Innovative Research 112
2. Other types of certificates
Directors: Current Rhode Island Teaching Certificates. Three directors specified “other” certificates
they currently have. Directors reported: K-8 Special Education, Middle School Endorsement in English
and Teacher of Hearing Disorders Grades PK-12.
Center Staff: Current Rhode Island Teaching Certificates. Staff were asked what “other” certificates
they currently have. Some staff indicated multiple certificates; therefore the number of certificates
indicated is greater than the number of staff who answered this question. Staff reported: Assistant teacher
Certification (7), Literacy coach/specialist, K-12 (2), Elementary Education, K-8 (2), ELS (2), Reading
Specialist (2), Adaptive Physical Education (1), Administration in Special Education (1), Art: Pre K-
grade 12 (1), Early Childhood Education (1), K-12 Health and Physical Education (1), Library Media (1),
Middle School / High School (1), Music PK-12 (1), PH-5 Life Certificate (1), PRAXIS I+II (1),
Secondary English (1), Special Education (10) (including: K-12, K-8, Profound/Severe, 1st-6
th and
Mild/Moderate), State of Connecticut (1) and Substitute teacher PK-12 (1).
Family Child Care Educators: Current Rhode Island Teaching Certificates. Two educators specified
“other” certificates they currently have. Educators reported: “Early childhood certificate at CCRI” and
“elementary teacher/Cape Verde”.
3. “Other” types of associates degrees
Directors: Associates degrees. Licensed Practical Nurse (1) and Liberal Arts (1).
Center Staff: Associates degrees. Staff who reported having an Associate’s degree, reported the
following fields: General Studies (7), Business (5), Art (4), Special Education (3), Science (3),
Psychology (3), Nursing (3), Accounting (2), Education / Special Education (2), Elementary Education
(2), Occupational Therapy Assistant (2), Administrative Assistant (1), Building and Architectural
Engineering (1), Communication (1), Computer Programming Technology (1), Criminal Justice (1), Early
Childhood Education (1), Fine Arts (1), General Education (1), Human Services (1), Interior Design (1),
Liberal Arts (1), Marketing (1), Social Work (1) and Travel and Tourism (1).

Oldham Innovative Research 113
Family Child Care Educators: Associates degrees. FCC educators who reported having an Associate’s
degree, reported the following fields: Science (1), Business (1), Arts (1), Business administration (1),
administrative assistant (1), animal science (1), general studies (1) and photography (1).
4. “Other” types of Bachelor’s Degrees
Directors: Bachelor’s degrees. Directors who reported having a Bachelor’s degree, reported the
following fields: Elementary Education (11), Psychology (6), Business Administration/Management (3),
Human Services (3), Human Development & Family Studies (2), Art Education (1), Communication
Disorders (1), Community Development (1), Corrections (1), Early Childhood Education (1), English (1),
General Studies (core in education) (1), Mathematics (1), Social Science (1), Sociology (1) and Studio
Arts (1).
Center Staff: Bachelor’s Degrees. Staff who reported having a Bachelor’s degree, reported the
following fields: Elementary Education (35), Psychology (28), Family Studies (14), English (13),
Business (10), Human Development (10), Arts (8), Special Education (7), Communications (5), Education
(5), History (4), Marketing (4), Nursing (4), Sociology (4), Speech (3) (including: Hearing Science,
Communication, and Language Pathology), Political science (3), Science (3), Art Education (2), Art
History (2), Early Childhood Education (2), Environmental Science (2), Music (2), Spanish (2),
Accounting (1), Ceramics (1), Civil Engineering (1), Communicative Disorders (1), Community Health
Education (1), Engineering (1), Family Development (1), Family Service (1), Food Science and Nutrition
(1), Food Service Management (1), French (1), General Studies (1), Hospitality Management (1), Hotel
Management (1), Human Services (1), Information Technology (1), International Studies (1),
Management (1), Middle School Education (1), Nuclear Medicine (1), Slavic Studies (1), Social and
Health Services (1), Social Work (1), Sports Management (1), Studio Art (1), Theater (1), Travel and
Tourism Management (1), Wildlife Conservation Biology (1) and Women's Studies (1).
Family Child Care Educator: Bachelor’s degrees. Educators who reported having a Bachelor’s
degree, reported the following fields: Elementary Education (3), Elementary Education and Music (1),
Severe and Profound Education (1), Criminal Justice & Sociology (1), Economics (1), Speech
Communications (1), Social Work (1), Psychology and Religious Studies (1), Nursing (1), Administration
(1), Retail Management (1), Psychology (1) and Marketing (1).

Oldham Innovative Research 114
Family Child Care Assistant: Bachelor’s degrees. Family Child Care Assistants who reported having a
Bachelor’s degree, reported the following fields: Elementary Education (1), Arts and Political Science
(1), Accounting (1), Education (1), English (1) and Fine Arts (1).
5. “Other” types of Advanced Degrees
Directors: Advanced degrees. Directors who reported having an advanced degree, reported the
following fields: Elementary Education (4), Special Education (3), Psychology (2), Cultural Studies,
International Relations (1) and Education of the Deaf (1).
Center Staff: Advanced Degrees. Staff who reported having an advanced degree, reported the following
fields: Special Education (8), Education (5), Psychology (3) (including: counseling, development and
school), Elementary Education (3), Reading (2), Arts (1), Business Administration (1), Criminal justice
(1), Educational Leadership (1), ESL (1), Finance (1), Foreign Languages (1), Health Education (1),
Library science (1), Literacy (1), Music Performance (1), Nutrition (1), Social Work (1).
Family Child Care Educator: Advanced degrees. Family Child Care Educators who reported having an
advanced degree, reported the following fields: Masters in Early Childhood Education (1), and Masters in
Elementary Education (1) and Education of Science, grade 5-12 (1).
6. “Other” types of Specialized Training
Center Staff: Specialized Training. Of the staff who reported attending specialized training, the specific
trainings indicated were: CPR/ First Aid (18), RIELS (General) (15), REILS 2 (13), Incredible Years
Training (6), Autism (4), RIELS 1 (4), SIDS/Trauma (4), CLASS Training (3), Care Courses (3), CDA
(3), PBIS (3), RIELS 3 (3), Therapeutic Behavior Training (3), Behavior Management (3), Handle with
Care Restraint Training (2), Ready to Learn Providence Classes (2), Sign Language Training (2),
Technology Training (2), Student Teacher Classes (2), Bright-Stars Classes (2), Administration (1), AIU
online classes (1), Anxiety (1), ASL (1), BA in Psychology (1), Bradleys (1), Camp Training (1), CAN
(1), Child Abuse (1), Child Care Support Network (1), Childcare Courses (1), Classroom Observations
(1), College Courses (1), Communication Training (1), Data Team (1), Early Learning Standards (1), EC
Conference (1), ECE Administration Fellowship at UCLA School of Management (1), ECERS Training
(1), Education Psychology (1), Facilitating Staff Course (1), Family Fun Activities Instructor (1), Foster

Oldham Innovative Research 115
Care Training (1), Foundations (1), Grant Training (1), Handwriting Without Tears (1), Middle School
(1), Mid-Wifery Classes (1), Montessori (1), Moram Workshop (1), Next Steps (1), Nutrition for Toddlers
(1), PECS Training (1), Planning/ Curriculum Training (1), Primary Orientation Training (Montessori)
(1), Reading Professional Development Articles and writing summaries (1), Responsive Classroom (1),
Rhode Island College Classes (1), School Wide Positive Behavioral Support Systems (1), Science with
Water (1), Seminars (1), Special Needs Workshops (1), Statistical training in working with large scale
weighted data sets (1), Teacher Strategies Gold Training (1) and Team Teaching workshop (1).
Family Child Care Educators: Specialized Training. Of the staff who reported attending specialized
training, the specific trainings indicated were: CPR (1), First Aid (1), Nutrition Classes (4), Ready to
Learn (2), At Home courses (1), Development and Growth of the Child (1), Autism/ How to work with
Special Needs (1), CARE Courses (1), ELS (1), Enki Education Study (1), Home School (1), Curriculum
written by RI resident (1), Sensory Integration (1).
7. “Other” types of Professional Development Activities
Center Staff: Other professional development activities. Staff were asked what other professional
development activities they participated in. Other professional development activities staff reported
attending include: CPR (7), Care Courses (6), CLASS (4), Workshops (4) (including: Math, Science and
Literacy), RIELS Training (4), Correspondence Courses (3), CDA (3), RIELS 3 (2), TSG (2), Monthly
written training (2), Director's Community of Practice (1), Autism Training (1), Behavioral & Social
Emotional Trainings (1), Brightstar Conference (1), CCRI Warwick Lincoln (1), Child Development
Course (1), Children's Friend Professional Development (1), Curriculum Planning (1), Community of
Practice (1), Family Service Credentialing for Family Advocates (1), Infant Toddler Development (1),
Internships (1), IYS Incredible Years (1), Job Trainings (1), On-site trainings through ERF (1), Online
Research (1), PRAXIS prep (1), Presenter at the Rhode Island Early Education Conference (1),
Professional Development Articles (1), Readings and discussions at faculty development meetings (1),
Ready to Learn Associate (1), Rhode Island College –TEACH - Bachelor’s degree (1), RI Early
Childhood Conference (1), Supervisory Training (1), Waldorf Education (1), Webinars in ECE (1),
Webteaching.com (1) and X-ray tech (1).
Family Child Care Educators: Other professional development activities. Educators were asked what
other professional development activities they participated in. Other professional development activities

Oldham Innovative Research 116
educators reported attending include: Care Courses (3), Early Leaning Standards (1), First Steps (1),
Infant Development (1) and The Incredible Years (1).
8. “Other” supports needed to accomplish professional development or educational goals
Center staff: Other Supports Needed for Professional Development
Time/Flexibility
Flexible work schedule (4)
More time (in the day/ off from work) (4)
Financial Support
Money (4)
Financial Aid/ Scholarships (2)
“Support for earning Master’s degree (money, support, time, workplace support)”
“This is my last year of aid benefits, then I have to pay 100% of tuition myself.”
Classes (affordable)/Credits/Education
“Advisor to help with the process to get teacher certification.”
“Guidance towards certification and classes to prepare.”
“Mentoring in advocacy work-doing workshops, research, grant writing.”
“Affordable classes in Sign Language.”
“Classes around my work schedule or time I spend at work being counted as credentials toward
completion of the degree.”
“Classes at night or online that are free.”
“Computer grants / computer skills classes.”
“Credit for life experience.”
“Credit for life-long experiences.”
“Don't have the ability to work full time and do school.”
“Grant Training Programs.”
“Care Courses for on-line classes.”

Oldham Innovative Research 117
“Would like to take a CDA & Courses related to infant/toddler but unable to afford it because
make "too much" for assistant.”
“Would like to transfer Montessori Credits into M. Ed., also interested in using Arts for Therapy.”
“Interested in programs similar to TEACH program at CCRI.”
“More college courses in Early Childhood in Newport area.”
“More Human Services classed offered throughout the summer sessions or online.”
“More professional development opportunities and or organizations.”
“More school-age courses.”
“New coursework available at the local state college level.”
“Not sure what advanced degree I would like to pursue.”
“PRAXIS”
“Professional development geared towards my level of experience and that takes into account my
experience and previous professional development.”
“Professional development workshops.”
“Quality professional development opportunities can be challenging to find at an appropriate time
and for a reasonable fee.”
“REALS Trainings.”
“RI Teacher Certification.”
“Support in getting RI teacher certification.”
“Some deeper level courses.”
“Staff Trainings and Leadership Support.”
“TEACH program from Ready to Learn Providence.”
“Teach scholar.”
“Online courses would be great because I could work them into my schedule and not have to
worry about losing hours at work and missing time at home, with my child.”
Other
“CPR. More support in TSG.”
“Greater opportunities.”
“Someone to watch my elderly mom.”

Oldham Innovative Research 118
Family Child Care Educators: Other Supports Needed for Professional Development
Flexible course hours and work hours to complete course work (4)
Mentors/Advisors (2)
Classes in Spanish (2)
Learn and write English (1)
“Acceptance of Training hours for college credits. Since I received my degree more than 10 years
ago my course credits are not acceptable towards an Associates or Bachelors in ECE. I have 100's
of professional training hours that could be transferred to college credits therefore lessening the
time frame and course work to attain a degree in the ECE field.”
“I have benefited from certain credit classes in Spanish, and parents prefer Spanish are taught [to]
their children [so they will] learn another language other than [what] they will learn in school.”
9. “Other” supports offered by centers
Directors: Other supports offered by centers. Ten directors reported other supports offered by their
centers or made comments regarding supports:
CPR and First Aid (2),
Monthly staff meetings (2),
Workshops (2),
Care courses,
Pre-service training and quarterly in-service trainings,
Weekly 1 hour core meetings (Head teacher, lead Teachers and Director) and
Head teacher observes each room for one morning every other month and offers observations.
Center Staff: Other supports offered by centers.
Financial Support
Financial Aid/ Support (4)
“TEACH program pays 80% of tuition.”
“As owner and co-teacher I do offer paid planning/ $$ reimbursement and paid time for co-
teachers to attend classes or complete on-line courses. We mentor/coach each other.”
“Early Childhood Education Certification Grant”

Oldham Innovative Research 119
“Financial support for PD is provided as available and within budgetary limits; financial support
for Comprehensive Member benefits to NAEYC are provided.”
Other Support
Mentoring/Consultation (4)
TEACH (2)
“Access to supplies classroom supplies.”
“Head Teacher & Director.”
“On-site training.”
“Reflective weekly supervision.”
“Resource Professionals from community”
“Talking with co-teachers.”
“Teaching team meetings with Director of Center.”
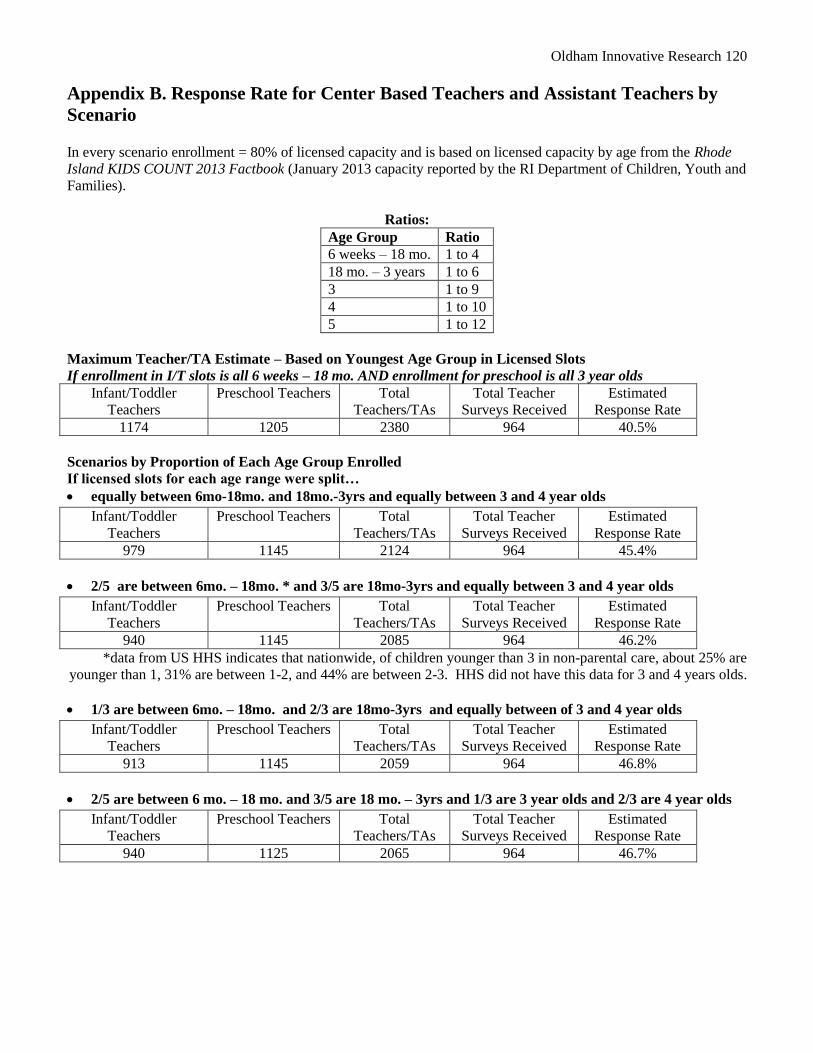
Oldham Innovative Research 120
Appendix B. Response Rate for Center Based Teachers and Assistant Teachers by
Scenario
In every scenario enrollment = 80% of licensed capacity and is based on licensed capacity by age from the Rhode
Island KIDS COUNT 2013 Factbook (January 2013 capacity reported by the RI Department of Children, Youth and
Families).
Ratios:
Age Group Ratio
6 weeks – 18 mo. 1 to 4
18 mo. – 3 years 1 to 6
3 1 to 9
4 1 to 10
5 1 to 12
Maximum Teacher/TA Estimate – Based on Youngest Age Group in Licensed Slots
If enrollment in I/T slots is all 6 weeks – 18 mo. AND enrollment for preschool is all 3 year olds
Infant/Toddler
Teachers
Preschool Teachers Total
Teachers/TAs
Total Teacher
Surveys Received
Estimated
Response Rate
1174 1205 2380 964 40.5%
Scenarios by Proportion of Each Age Group Enrolled
If licensed slots for each age range were split…
equally between 6mo-18mo. and 18mo.-3yrs and equally between 3 and 4 year olds
Infant/Toddler
Teachers
Preschool Teachers Total
Teachers/TAs
Total Teacher
Surveys Received
Estimated
Response Rate
979 1145 2124 964 45.4%
2/5 are between 6mo. – 18mo. * and 3/5 are 18mo-3yrs and equally between 3 and 4 year olds
Infant/Toddler
Teachers
Preschool Teachers Total
Teachers/TAs
Total Teacher
Surveys Received
Estimated
Response Rate
940 1145 2085 964 46.2%
*data from US HHS indicates that nationwide, of children younger than 3 in non-parental care, about 25% are
younger than 1, 31% are between 1-2, and 44% are between 2-3. HHS did not have this data for 3 and 4 years olds.
1/3 are between 6mo. – 18mo. and 2/3 are 18mo-3yrs and equally between of 3 and 4 year olds
Infant/Toddler
Teachers
Preschool Teachers Total
Teachers/TAs
Total Teacher
Surveys Received
Estimated
Response Rate
913 1145 2059 964 46.8%
2/5 are between 6 mo. – 18 mo. and 3/5 are 18 mo. – 3yrs and 1/3 are 3 year olds and 2/3 are 4 year olds
Infant/Toddler
Teachers
Preschool Teachers Total
Teachers/TAs
Total Teacher
Surveys Received
Estimated
Response Rate
940 1125 2065 964 46.7%

Oldham Innovative Research 121
Appendix C. Surveys
~ Child Care Center Early Workforce Survey for Administrators53
~
Instructions: Please read through the entire survey before beginning to answer any questions. After reading
through the survey, determine who could best complete the survey fully knowing that in some cases it could be
more than one person at the site completing certain sections. Please have all staff who work in classrooms or
administrative positions complete the included “Center Staff Survey” enclosed. Staff can complete the survey
and return it to the center’s director to send back with this survey; they can send their completed survey back on
their own; they can complete the survey on-line through Survey Monkey; or they can drop off their survey at a local
DHS office at 57 Howard Ave, Louis Pasteur Building #57, Cranston, RI or the RIDE office at 255 Westminster, 4th
Floor, Providence, RI.
Materials that will help you in filling out the survey include: the “Center Staff Survey”, personnel records,
professional development records, and demographic information on the children.
For the person(s) that helped to complete this particular survey, what is your job title(s)? _____________________
The Program
1. What is the name of the child care center where you are employed?
2. How many surveys did you distribute to staff?_________
3. What town is your program located in? ____________________
4. How long have you been the director of the center where you are currently working? (Please check one):
___less than a year ___1-3 years ___4-5 years
___6-10 years ___11-15 years ___16-20 years
___21-25 years ___more than 25 years
5. How long have you worked in the early childhood education profession? (Please check one):
___less than a year ___1-3 years ___4-5 years
___6-10 years ___11-15 years ___16-20 years
___21-25 years ___more than 25 years
6. Is your program…? (Check one):
___ not-for-profit ___ for-profit
7. Which of the following does your center offer? (Please check all that apply):
___full-day care (6 hours or more) ___academic year only care
___part-day care (less than 6 hours) ___after school care
___full week care (5 days or more) ___before school care
53
Slight modifications were made to this version of the survey to reflect changes that we would recommend were someone to
replicate parts of this survey.

Oldham Innovative Research 122
___partial week care (4 days or less) ___night/evening care (after 7:00 pm)
___school-age care ___weekend care
___full-year care ___Other:___________________________________
8. Do you receive funding from any of the following? (Check all that apply)
__Early Head Start
__Head Start
__State Funded Pre-Kindergarten Program
__Child and Adult Care Food Program (CACFP)
__None of the above
Does your program participate in the following quality initiatives? (Check all that apply):
9. NAEYC Accreditation: ___accredited ___currently seeking accreditation
10. BrightStars: ___Yes ___ No
11. If your program does participate in BrightStars, please specify current star level: ____
12. RIDE Comprehensive Early Childhood Education Approval: ___Yes ___ No
13. How many full-time staff members does your center employ?
Full-time (30 hours or more per week)
Administrators/Directors
Assistant Administrator/Director
Head Teachers/Ed. Coordinators
Teachers
Assistant Teachers
Floaters/Substitutes
Total Paid Staff
14. How many part-time staff members does your center employ?
Part-time
(29 hours or less per week)
Administrators/Directors
Assistant Administrator/Director
Head Teachers/Ed. Coordinators
Teachers
Assistant Teachers
Floaters/Substitutes
Total Paid Staff

Oldham Innovative Research 123
15. What is the total number of children enrolled full-time at your center for each of the age groups below?
Age Group Full-Time Enrollment
Infants (birth-18 months)
Toddlers (18 months-35 months)
Preschoolers (3-5 year olds)
School-age (age 5 and up, including
Kindergarten)
16. What is the total number of children enrolled part-time at your center for each of the age groups below?
Age Group Part-Time Enrollment
Infants (birth-18 months)
Toddlers (18 months-35 months)
Preschoolers (3-5 year olds)
School-age (age 5 and up, including
Kindergarten)
17. Does your program accept children receiving a subsidy from DHS' Child Care Assistance Program
(CCAP)?: ___yes ___no
18. If yes, how many infant, toddler, and/or preschool children ONLY in your center are in the CCAP
program?______
19. Are there children who speak a language other than English in their home?: ___yes ___no
a. If yes, how many?________
20. In the past year, has your center closed any classrooms?: ___yes ___no
If yes, how many?: _____
21. If classrooms have been closed, what age groups were affected? (Please check all that apply):
___Infant classrooms
___Toddler classrooms
___Preschool classrooms
___School-age classrooms
Other: _________________________
22. Has your center been affected by any of the following in the past year? (Please check all that apply):
___layoff staff
___low enrollment
___ difficulty finding qualified staff
___stagnant salaries (no raises)
___cutting staff salaries and/or hours
___cutting staff benefits
___families behind on paying their child care fees
___limits or no purchasing of equipment and/or materials
___limits or no support for attending professional development opportunities
Oldham Innovative Research 124
___Other:____________________________________
___None of the above
Compensation and Supports
What is the range of the hourly rate of pay by job title at your center? :
23. Please indicate the lowest hourly rate of pay for the positions listed below.
24. Please indicate the highest hourly rate of pay for the positions listed below.
Lowest Rate
of Pay
Highest Rate
of Pay
Administrators/Directors
Head Teachers/ Education Coordinators
Teachers
Teacher Assistants/Teacher Aides
Other, please specify: ______________________
25. What benefits does your center provide to staff? (Please check all that apply for full and part time staff):
Full-time (work 30 hours or
more per week)
Part-time
(work 29 hours or
less per week)
Health Insurance
Dental Insurance
Disability Insurance
Paid Vacation
Paid Sick Leave
Retirement Plan
Paid Holidays (ex: New Year’s Day)
Financial assistance for college
credits/professional development
Reduced rates for children of staff
Other
Please Specify: _________________
None of the above
26. If your center offers health insurance, is it fully funded by the center? ___ yes ___ no
a. If no, what percentage does the employee pay for? _____%
27. If your center offers dental insurance, is it fully funded by the center? ___ yes ___ no
a. If no, what percentage does the employee pay for? _____%
28. If your center offers a retirement plan, is it fully funded by the center? ___ yes ___ no
29. Has there been staff turnover (staff have left this center) in these positions in the past 12 months?
Oldham Innovative Research 125
30. If yes, how many staff members from each position have left in the past 12 months?
Turnover in past 12
months
Number of Staff that
Have Left in the Past 12
Months
Administrators/Directors __Yes __No __N/A
Head Teachers/ Education Coordinators __Yes __No __N/A
Teachers __Yes __No __N/A
Teacher Assistants/Teacher Aides __Yes __No __N/A
Floaters/Substitutes __Yes __No __N/A
31. What types of supports are offered to staff? (Check all that apply):
Supports Offered
Mentoring or coaching by someone in the center
Mentoring or coaching by an independent mentor/coach
Orientation before beginning new responsibilities
Paid planning/prep time
Financial support to take college courses
TEACH Scholarship Program
Financial support for other trainings/professional development
Financial support to attend national conferences
Financial support to attend local conferences
Other supports
Please specify: ______________________
None of the above
32. What do you consider to be your annual salary? (Check one)
___ Less than $15,000 ___$50,001-$60,000
___$15,001-$20,000 ___$60,001-$70,000
___$20,001-$30,000 ___$70,001-$80,000
___$30,001-$40,000 ___$80,001-$90,000
___$40,001-$50,000 ___$90,001-$100,000
___ Above $100,001
33. Do you work another job? ____ yes ____ no
34. If yes, how many hours do you work each week? ____hours/week
35. If yes, what is your average hourly wage? $______/hour
Professional Development
36. What is your current education level? (Please pick one that most closely describes):
___high school not completed
___high school diploma/GED
___CDA credential
___Some college credits in Early Childhood Education or Child Development
___Some college credits in another field
___Associates degree in Early Childhood or Child Development

Oldham Innovative Research 126
___Associates degree in another field
In what field do you have an associate’s degree? ___________________________________________
___Bachelors degree in Early Childhood or Child Development
___Bachelors degree in another field
In what field do you have a bachelor’s degree? ___________________________________________
___Advanced degree in Early Childhood or Child Development
___Advanced degree in another field
In what field do you have an advanced degree? ___________________________________________
37. If you have some college credits, how many credits do you have?
1-12 credits 13-17 credits 18-23 credits 24 or more credits
38. If your college credits are in another field, in what field do you have these credits?
__________________________________________
39. Do you have RI teacher certification? ____yes ____no
40. If yes, please indicate what type(s) of certificate(s) you have:
___Early Childhood, Grades PK-2 ___Early Childhood Special Education
___Elementary Education, Grades 1-6 ___Other: ________________________
41. Are you currently pursuing or interested in pursuing any of the following (please check below):
42. What
supp
orts
wou
ld
you
need
to
reac
h
your
prof
essi
onal
deve
lopment goals? (Check any that apply)?
Child care for my children
Mentor or Advisor to help with coursework and planning
Transportation to class
Help taking a course in English
Help with study skills and test taking
Help with writing assignments
Help with math assignments
Currently Pursuing
Interested in
Pursuing
CDA credential
College Credits in Early Childhood Education or Child Development
College credits in another field
Associates degree in Early Childhood or Child Development
Associates degree in another field
Bachelors degree in Early Childhood or Child Development
Bachelors degree in another field
Advanced degree in Early Childhood or Child Development
Advanced degree in another field
RI Teacher Certification
a. Early Childhood (Grades PK-2)
b. Early Childhood Special Education
c. Elementary Education (Grades 1-6)
d. Other:_______________________________
None of the above

Oldham Innovative Research 127
Online courses
Courses in another language
Please specify: ______________________
Financial Aid or Scholarship
More courses related to infants and toddlers
More courses specific to early childhood education administration
None of the above
43. Are there any other supports that were not listed in the previous question that you need to reach your
professional goals?
44. Do you have reliable (daily access) internet access? ____yes ____no
45. If yes, how do you access the internet? (Please check all that apply):
___At work site
___Another site location
___On my cell phone
___At my home
___Other (please specify):_________________________________________

Oldham Innovative Research 128
~Center Staff Survey54
~
1. Describe your position at the center where you work (please pick the one choice that most closely describes
your position)
____Assistant Administrator/Assistant Director
____Head Teacher/ Education Coordinator
____Teacher
____Teacher Assistant/ Teacher Aides
2. How many hours a week (on average) do you work at your center?: _________ hours
3. How many weeks a year do you work at your center?: _______ weeks
4. What is your gender?
___Male ___Female
5. How would you describe your race/ethnicity?
___Caucasian ___Latina/Latino
___African American ___Asian/Pacific Islander
___American Indian or Alaskan Native ___Multi-ethnic
___Other:________________________________________
6. What languages are you fluent in?
___English _____Spanish Other(s) (please specify): ______________________
7. How long have you been working at the center where you are currently employed? (please pick one):
___less than a year ___1-3 years ___4-5 years
___6-10 years ___11-15 years ___16-20 years
___21-25 years ___more than 25 years
8. Which age group do you work with at this center? (check all that apply)
___ infants (birth-18 months) ____ toddlers (18-35 months) ___preschoolers (3-5 year olds)
___ school age (age 5 and up, including Kindergarten)
9. What is your current education level (please pick one that most closely describes):
___high school not completed ___high school diploma/GED
___CDA credential
___Some college credits in Early Childhood Education or Child Development (indicate below)
1-12 credits 13-17 credits 18-23 credits 24 or more credits
___Some college credits in another field (indicate below)
1-12 credits 13-17 credits 18-23 credits 24 or more credits
In what field do you have these credits? _____________________________________________
___Associates degree in Early Childhood or Child Development
___Associates degree in another field
In what field do you have an associates degree? ___________________________________________
___Bachelors degree in Early Childhood or Child Development
___Bachelors degree in another field
54
Slight modifications were made to this version of the survey to reflect changes that we would recommend were someone to
replicate parts of this survey.

Oldham Innovative Research 129
In what field do you have a bachelors degree? ___________________________________________
___Advanced degree in Early Childhood or Child Development
___Advanced degree in another field
In what field do you have an advanced degree? ___________________________________________
10. Do you have RI teacher certification? ____yes ____no
11. If yes, please indicate what type(s) of certificate(s) you have:
___Early Childhood, Grades PK-2 ___Early Childhood Special Education
___Elementary Education, Grades 1-6 ___Other: ________________________
12. Are you currently pursuing or interested in pursuing any of the following (please check):
Currently Pursuing
Interested in
Pursuing
High School Diploma/GED
CDA credential
College Credits in Early Childhood Education or Child Development
College credits in another field
Associates degree in Early Childhood or Child Development
Associates degree in another field
Bachelors degree in Early Childhood or Child Development
Bachelors degree in another field
Advanced degree in Early Childhood or Child Development
Advanced degree in another field
None of the above
13. What supports would you need to reach your professional development goals (check any that apply)?
Child care for my children
Mentor or Advisor to help with coursework and planning
Transportation to attend professional development opportunities
Help taking a course in English
Help with study skills and test taking
Help with writing assignments
Help with math assignments
Online courses
Courses in another language
Please specify: ______________________
Financial Aid or Scholarship
More courses related to infants and toddlers
Other supports
Please specify: ______________________
None of the above
14. Are you currently pursuing RI teacher certification? ____yes ____no
15. If yes, please indicate what type(s) of certificate(s) you are pursuing:
___Early Childhood, Grades PK-2 ___Early Childhood Special Education
___Elementary Education, Grades 1-6 ___Other: ________________________
16. If you are not currently seeking RI teacher certification, would you be interested in pursuing certification in
the future? ____yes ____no

Oldham Innovative Research 130
17. If yes, please indicate what type(s) of certificate(s) you are interested in pursuing:
___Early Childhood, Grades PK-2 ___Early Childhood Special Education
___Elementary Education, Grades 1-6 ___Other: ________________________
18. In the past year, what professional development activities did you participate in (please check all that
apply):
___On-site training at center ___Community College classes
___University classes ___On-line college classes
___Workshops ___On-line training
___Conferences
___Specialized training, please specify: ______________________
___Other:____________________________________________________
___None
19. What types of supports do you currently receive (please check all that apply)?:
Mentoring or coaching by someone in my center
Mentoring or coaching by an independent mentor/coach
Orientation before beginning new responsibilities
Paid planning/prep time
Financial support to take college courses
Financial support for other trainings/professional development
Financial support to attend national conferences
Financial support to attend local conferences
Other supports
Please specify: ______________________
None of the above
20. Do you have reliable (daily access) internet access? ____yes ____no
21. If yes, how do you access the internet? (Please check all that apply):
___At work site
___Another site location
___On my cell phone
___At my home
___Other (please specify):_________________________________________
22. Does your job at this child care center offer health insurance? ___ yes ___ no ___ don’t know
23. If yes, do you have to pay for part of your health insurance?
____ yes ____ no ____ I do not use the health insurance offered through this job
24. Does your job at this child care center offer dental insurance? ___ yes ___ no ___ don’t know
25. If yes, do you have to pay for part of your dental insurance?
____ yes ____ no ____ I do not use the dental plan offered through this job
26. Does your job at this child care center offer disability insurance? ___ yes ___ no ___ don’t know
27. Does this job offer a retirement or pension plan? ___ yes ___ no ___ don’t know
28. If yes, does your employer fully fund this plan? ___ yes ___ no ___ don’t know

Oldham Innovative Research 131
29. How many days of paid vacation do you receive each year? (check one)
___0 ___1-3 ___3-6 ___6-10 ___More than 10
30. How many days of paid sick leave do you receive each year? (check one)
___0 ___1-3 ___3-6 ___6-1 0 ___More than 10
31. Are you paid for holidays (4th of July, New Years, etc.) that you do not work? ___ yes____ no
32. What do you consider to be your hourly wage? $__________ per hour
33. How are your wages calculated? Please Check one
________________________
34. What do you consider to be your annual salary? (check one)
___ Less than $15,000 ___$50,001-$60,000
___$15,001-$20,000 ___$60,001-$70,000
___$20,001-$30,000 ___$70,001-$80,000
___$30,001-$40,000 ___$80,001-$90,000
___$40,001-$50,000 ___$90,001-$100,000
___ Above $100,001
35. Do you work another job? ____ yes ____ no
36. If yes, how many hours do you work each week? ____hours/week
37. If yes, what is your average hourly wage? $______/hour

Oldham Innovative Research 132
~ Family Child Care Workforce Survey55
~
You and Your Program
1. What town is your family child care located in? ____________________
2. Have you worked in Early Childhood Education prior to having your own family child care business?
_____yes ____no
b) If yes, how long did you work in Early Childhood Education?
___less than a year
___1- 2 years ___9- 10 years
___3-5 years ___11- 15 years
___6-8 years ___More than 15 years
3. How long have you been the owner of your family child care program (please check one):
___less than a year
___1- 2 years ___9- 10 years
___3-5 years ___11- 15 years
___6 -8 years ___More than 15 years
4. Do you have other paid staff members, such as an assistant? _____Yes ____No
If yes, how many? ______
5. How many hours a week (on average) do you work at your family child care?: _________ hours
6. How many weeks a year do you work at your family child care?: _______ weeks
7. What is your gender?
___Male ___Female
8. How would you describe your race/ethnicity?
___Caucasian ___Latina/Latino
___African American ___Asian/Pacific Islander
___American Indian or Alaskan Native ___Multi-ethnic
___Other:________________________________________
9. What languages are you fluent in?
___English _____Spanish ____Other(s) (please specify):___________________
10. Which of the following does your family child care offer? (please check all that apply):
___full-day care (6 hours or more) ___academic year only care
___part-day care (less than 6 hours) ___after school care
___full week care (5 days or more) ___before school care
___partial week care (4 days or less) ___night/evening care (after 7:00 pm)
___school-age care ___weekend care
55
Slight modifications were made to this version of the survey to reflect changes that we would recommend were someone to
replicate parts of this survey.

Oldham Innovative Research 133
___full-year care ___Other:___________________________________
11. Please list how many children in each age group are currently in your family child care:
Age Group Full-Time
Enrollment
Part-Time
Enrollment
Infants (birth-18 months)
Toddlers (18 months-35 months)
Preschoolers (3-5 year olds)
School-age (age 5 and up, including
Kindergarten)
12. Does your family child care accept children receiving a subsidy from DHS' Child Care Assistance Program
(CCAP)?: ___yes ___no
If yes, how many infant, toddler, and/or preschool children ONLY in your family child care are in the
CCAP program?______
13. Are there children who speak a language other than English in their home: ___yes ___no
If yes, how many?: _____
Assistants 14. Do you have an assistant? _____Yes ____No (if no, skip to section III)
1) If yes, how many? ______
2) Do you pay them a regular wage? _____Yes ____No
3) If you do pay them a regular wage, what is that wage? $______/hour
15. What languages are your assistants fluent in (please check all that apply):
_____English
_____Spanish
____Other:_________________________
16. If you have assistants, what benefits does your family child care business provide? (please check all that
apply):
Benefit
Health Insurance
Dental Insurance
Disability Insurance
Paid Vacation
Paid Sick Leave
Retirement Plan
Paid Holidays (ex: New Year’s Day)
Financial assistance for college
credits/professional development
Reduced rates for children of staff
Bonus

Oldham Innovative Research 134
Other
Please Specify: _________________
None of the above
17. If you offer health insurance, is it fully funded by your family child care home? ___ yes ___ no
18. If you offer dental insurance, is it fully funded by your family child care home? ___ yes ___ no
19. Have any of your assistants left their position in the past 12 months:
___yes ___no If yes, how many? ________
Education and Professional Development
What is…
20. Your current education level
21. The education levels of your assistant
22. The education levels of your assistant 2 (if you have more than 1 assistant)
23. The education levels of your assistant 3 (if you have more than 2 assistants)
Education Level You Assistant
1
Assistant
2
Assistant
3
High school not completed
High school diploma/GED
CDA credential
Some college credits in Early Childhood Education or Child
Development (indicate below)
a. 1-12 credits
b. 13-17credits
c. 18-23 credits
d. More than 24 credits
Some college credits in another field (indicate below)
a. 1-12 credits
b. 13-30 credits
c. More than 30 credits
d. In what field are these credits?
Associates degree in Early Childhood or Child Development
Associates degree in another field
a. In what field do you have an associate’s degree?
Bachelors degree in Early Childhood or Child Development
Bachelors degree in another field
a. In what field do you have a Bachelor’s degree?
Advanced degree in Early Childhood or Child Development
Advanced degree in another field
a. In what field do you have an advanced degree?
Do you have a RI teacher certification
a. Early Childhood, Grades PK-2

Oldham Innovative Research 135
b. Early Childhood Special Education
c. Elementary Education, Grades 1-6
d. Other:______________________________
24. Are you or your assistant(s) currently pursuing or interested in pursuing any of the following?
25. Is your assistant currently pursuing or interested in pursuing any of the following?
26. Is your assistant 2 currently pursuing or interested in pursuing any of the following?
27. Is your assistant 3 currently pursuing or interested in pursuing any of the following?
Education Level You Assistant 1 Assistant 2 Assistant 3
Current Interested Current Interested Current Interested Current Interested
High school
diploma/GED
CCRI Level 1 Early
Childhood Cohort
Program
CDA credential
Associate’s degree in
ECE or Child
Development
Associate’s degree in
another field
Bachelor’s degree in
ECE or Child
Development
Bachelor’s degree in
another field
Advanced degree in
ECE or Child
Development
Advanced degree in
another field
RI Teaching
Certification
a. Early Childhood
b. Early Childhood
Special Education
c. Elementary
Education
d. Other:_____
None of the above
28. What supports would you need to reach your professional development goals (check any that apply)?
Child care for my children

Oldham Innovative Research 136
Mentor or Advisor to help with coursework and planning
Transportation to class
Training/courses offered in languages besides English
What languages?____________________________
Help taking a course in English
Help with study skills and test taking
Help with writing assignments
Help with math assignments
Online courses
Financial Aid or Scholarship
More courses related to infants and toddlers
Other supports
Please specify: ______________________
None of the above
29. In the past year, what professional development activities did you participate in (please check all that
apply):
___On-site training ___Community College classes
___University classes ___On-line college classes
___Workshops ___On-line training
___Conferences
___Specialized training, please specify: ______________________
___Other:____________________________________________________
___None
30. Do you have reliable (daily access) internet access? ____yes ____no
31. If yes, how do you access the internet? (Please check all that apply):
___At the family child care
___Another site location (please specify):________________________
___On my cell phone
___At my home
___Other (please specify):_________________________________________
Compensation
32. What do you consider to be your annual salary? (check one)
___ Less than $15,000 ___$50,001-$60,000
___$15,001-$20,000 ___$60,001-$70,000
___$20,001-$30,000 ___$70,001-$80,000
___$30,001-$40,000 ___$80,001-$90,000
___$40,001-$50,000 ___$90,001-$100,000
___ Above $100,001
33. Do you have health insurance for yourself? _____yes ____no
34. Do you have dental insurance for yourself? _____yes ____no
Oldham Innovative Research 137
35. Have any of the following affected your family child care in that past year (please check all that apply):
___low enrollment
___layoffs of helpers/assistants
___stagnant salaries (no raises)
___cutting of staff salaries and/or hours
___cutting of benefits
___families behind on or not paying their child care fees
___limits or no purchasing of equipment and/or materials
___limits or no support for attending professional development opportunities
___Other:____________________________________
___none of the above
36. Do you work another job? ____ yes ____ no
If yes, how many hours a week do you work at another job? _______
Why do you work another job (please explain): __________________________________________________