lidar acquisition report - data.kansasgis.org
TRANSCRIPT
Aerial Lidar Report 16104 Kansas Department of Agriculture, 2017 Kansas Lidar February 2018

Kansas Department of Agriculture, 2017 Kansas Lidar Aerial Lidar Report, 16104
February 2018
Table of Contents Lidar Acquisition ..............................................................................................................2
1.1 Acquisition ......................................................................................................................... 2
1.2 Acquisition Status Report .................................................................................................. 2
1.3 Acquisition Details ............................................................................................................. 2
1.4 Project Purpose ................................................................................................................. 2
1.5 Lidar Flight-line Orientation .............................................................................................. 3
1.6 Acquisition Equipment ...................................................................................................... 3
1.7 Lidar System Acquisition Parameters ................................................................................ 5
1.8 GNSS Reference Station(s) ................................................................................................ 6
1.9 Airborne GNSS Kinematic .................................................................................................. 7
Lidar Processing ...............................................................................................................8
2.1 Lidar Point Cloud Generation ............................................................................................ 8
2.2 Coordinate Reference System ........................................................................................... 9
2.3 Lidar Point Cloud Statistics ................................................................................................ 9
2.4 Expected Horizontal Positional Error ................................................................................ 9
2.5 Smooth Surface Repeatability (Intraswath) .................................................................... 10
2.6 Lidar Calibration .............................................................................................................. 11
2.7 Overlap Consistency (Interswath) ................................................................................... 12
2.8 Lidar Classification ........................................................................................................... 14
Lidar Accuracy................................................................................................................ 14
3.1 Ground Surveyed Check Points ....................................................................................... 14
3.2 Vertical Accuracy Requirements ..................................................................................... 14
3.3 Check Point Distribution.................................................................................................. 15
3.4 Vertical Accuracy Results ................................................................................................ 17
3.5 Check Point Assessment .................................................................................................. 17
Certification ................................................................................................................... 26
4.1 Limitations of Use ............................................................................................................ 26
GNSS Processing ............................................................................................................ 27

Kansas Department of Agriculture, 2017 Kansas Lidar Aerial Lidar Report, 16104
February 2018
2 | P a g e
Lidar Acquisition
1.1 Acquisition The Atlantic Group, LLC (Atlantic) has successfully completed lidar acquisition for the State of Kansas Lidar Area of Interest (AOI). Lidar for this AOI was acquired in thirteen (13) flight mission completed on May 5th, 2017. The project area encompasses 213,121 acres, 8,625 square kilometers or 3,330 square miles.
1.2 Acquisition Status Report Upon notification to proceed, the flight crew loaded the flight plans and validated the flight parameters. Atlantic’s Director of Flight Operations contacted air traffic control and coordinated flight pattern requirements. Lidar acquisition began immediately upon notification that control base stations were in place. During flight operations, the flight crew monitored weather and atmospheric conditions. Lidar missions were flown only when no condition existed below the sensor that would affect the collection of data. The pilot constantly monitored the aircraft course, position, pitch, roll, and yaw of the aircraft. The sensor operator monitored the sensor, the status of the GNSS constellations, and performed the first QC review during acquisition. The flight crew constantly reviewed weather and cloud locations. Any flight lines impacted by unfavorable conditions were marked as invalid and re-flown at an optimal time.
1.3 Acquisition Details Atlantic acquired one hundred and fifty (150) passes of the AOI as a series of perpendicular and/or adjacent flight-lines. Differential GNSS unit in aircraft recorded sample positions at 2 Hz or more frequency. Lidar data was only acquired when a minimum of 6 satellites were in view.
Atlantic lidar sensors are calibrated at a designated site located at the Fayetteville Municipal Airport (FYM) in Fayetteville, TN and are periodically checked and adjusted to minimize corrections at project sites.
1.4 Project Purpose The primary purpose of the lidar survey was to establish measurements of the bare earth surface, as well as top surface feature data for providing geometric inputs for modeling, other numerical modeling and economic related assessments.

Kansas Department of Agriculture, 2017 Kansas Lidar Aerial Lidar Report, 16104
February 2018
3 | P a g e
1.5 Lidar Flight-line Orientation The following graphic represents the alignment of the project area of interest (AOI) and the flight-lines executed to provide AOI coverage.
Figure 1: Trajectories as flown by Atlantic
1.6 Acquisition Equipment Atlantic operated a Partenavia S.P.A P 68 C/TC (N775MW) and a Cessna T210L (N732JE) both outfitted with a Leica ALS70-

Kansas Department of Agriculture, 2017 Kansas Lidar Aerial Lidar Report, 16104
February 2018
4 | P a g e
HP lidar system during the collection of the project area. Table 1 represents a list of the features and characteristics for the Leica ALS70-HP lidar system:
Atlantic’s Sensor Characteristics
Leica ALS70-HP
Manufacturer Leica
Model ALS70 - HP
Platform Fixed-Wing
Scan Pattern Sine, Triangle, Raster
Maximum Scan Rate (Hz)
Sine 200
Triangle 158
Raster 120
Field of View (°) 0 - 75 (Full Angle, User Adjustable)
Maximum Pulse rate (kHz) 500
Maximum Flying height (m AGL) 3500
Number of returns Unlimited
Number of Intensity Measurements 3 (First, Second, Third)
Roll Stabilization (Automatic Adaptive, °) 75 - Active FOV
Storage Media Removable 500 GB SSD
Storage Capacity (Hours @ Max Pulse Rate) 6
Size (cm) Scanner 37 W x 68 L x 26 H
Control Electronics 45 W x 47 D x 36 H
Weight (kg) Scanner 43
Control Electronics 45
Operating Temperature 0 - 40 °C
Flight Management FCMS
Power Consumption 927 @ 22.0 - 30.3 VDC
Table 1: Atlantic Sensor Characteristics

Kansas Department of Agriculture, 2017 Kansas Lidar Aerial Lidar Report, 16104
February 2018
5 | P a g e
1.7 Lidar System Acquisition Parameters Table 2 illustrates Atlantic’s system parameters for lidar acquisition on this project.
Lidar System Acquisition Parameters
Item Parameter
System Leica ALS-70 HP
Nominal Pulse Spacing (m) 0.7
Nominal Pulse Density (pls/m²) 2.4
Nominal Flight Height (AGL meters) 2,390
Nominal Flight Speed (kts)
130
Pass Heading (degree) Varies
Sensor Scan Angle (degree) 45
Scan Frequency (Hz) 35.1
Pulse Rate of Scanner (kHz) 264.8
Line Spacing (m) 1,225
Pulse Duration of Scanner (ns) 4
Pulse Width of Scanner (m) 0.53
Central Wavelength of Sensor Laser (nm) 1064
Sensor Operated with Multiple Pulses Yes
Beam Divergence (mrad) 0.22
Nominal Swath Width (m) 1,663
Nominal Swath Overlap (%) 20
Scan Pattern Triangle
Table 2: Atlantic Lidar System Acquisition Parameters

Kansas Department of Agriculture, 2017 Kansas Lidar Aerial Lidar Report, 16104
February 2018
6 | P a g e
1.8 GNSS Reference Station(s) Three (3) Continuously Operating Reference Stations (CORS) and Three (3) NGS Monuments and Three (3) set stations were used to control the lidar acquisition for the project area. The coordinates provided in Table 3 below are in NAD83 (2011), Geographic Coordinate System, Ellipsoid, Meters.
GPS Reference Station Coordinates
Designation Type PID Latitude (N) Longitude (W) Elevation
ATL1 SET 39 38 56.64637 097 48 01.72210 401.750
ATL2 SET 39 43 08.11994 097 08 35.95727 408.964
ATL4 SET 39 45 16.68372 096 56 37.98604 379.685
CONCORDIA NGS KF0937 39 31 23.00578 097 40 34.41882 460.732
CYWB NGS KF0792 39 22 57.85318 097 09 29.76503 340.282
KSU1 CORS DI3428 39 06 02.67747 096 36 34.09348 326.620
NEFR CORS DN7500 40 08 53.35429 097 10 14.42453 413.539
NERC CORS DN5842 40 04 32.25406 098 31 05.27200 495.045
RYDAL_RESET NGS KF0927 39 47 05.67588 097 43 33.54713 443.199
Table 3: GNSS Reference Station Coordinates

Kansas Department of Agriculture, 2017 Kansas Lidar Aerial Lidar Report, 16104
February 2018
7 | P a g e
Figure 2: GNSS Reference Station(s)
1.9 Airborne GNSS Kinematic Differential GNSS unit in aircraft collected positions at 2 Hz. Airborne GNSS data was processed using the Inertial Explorer (version 8.60.6717) software. Flights were flown with a minimum of 6 satellites in view (10° above the horizon).
For all flights, the GNSS data can be classified as good, with residuals of 3cm average or better but none larger than 10cm being recorded.
Data collected by the lidar unit is reviewed for completeness, acceptable density and to make sure all data is captured without errors or corrupted values. In addition, all GNSS, aircraft trajectory, mission information, and ground control files are reviewed and logged into a database.
GNSS processing results for each lift are included in Section 5: GNSS Processing.

Kansas Department of Agriculture, 2017 Kansas Lidar Aerial Lidar Report, 16104
February 2018
8 | P a g e
Lidar Processing
2.1 Lidar Point Cloud Generation Atlantic used Leica software products to download the IPAS ABGNSS/IMU data and raw laser scan files from the airborne system. Waypoint Inertial Explorer is used to extract the raw IPAS ABGNSS/IMU data, which is further processed in combination with controlled base stations to provide the final Smoothed Best Estimate Trajectory (SBET) for each mission. The SBET’s are combined with the raw laser scan files to export the Lidar ASCII Standard (*.las) formatted swath point clouds.
Figure 3: Lidar swath data showing complete coverage

Kansas Department of Agriculture, 2017 Kansas Lidar Aerial Lidar Report, 16104
February 2018
9 | P a g e
2.2 Coordinate Reference System Horizontal Datum: North American Datum of 1983 (HARN) Coordinate System: Universal Transverse Mercator Zone 14 North Vertical Datum: North American Vertical Datum of 1988 Geoid Model: Geoid12B Units of Reference: Meters
2.3 Lidar Point Cloud Statistics Table 4 illustrates the overall lidar point cloud statistics for this project.
Point Cloud Statistics
Category Value
Total Points 32,047,882,156
Nominal Pulse Spacing (m) 0.6211
Nominal Pulse Density (pls/m²) 2.59
Nominal Pulse Spacing (ft) 2.0376
Nominal Pulse Density (pls/ft²) 0.24
Aggregate Total Points 29,839,973,382
Aggregate Nominal Pulse Spacing (m) 0.5702
Aggregate Nominal Pulse Density (pls/m²) 3.08
Aggregate Nominal Pulse Spacing (ft) 1.8708
Aggregate Nominal Pulse Density (pls/ft²) 0.29 Table 4: Lidar Point Cloud Statistics
2.4 Expected Horizontal Positional Error As described in Section 7.5 of the ASPRS Positional Accuracy Standards for Digital Geospatial Data the horizontal errors in lidar data are largely a function of GNSS positional error, INS angular error, and flying altitude. Therefore, lidar data collected with GNSS error of 8cm and the IMU error of 0.00427 degrees at an altitude of 2,390m; the expected radial horizontal positional error will be RMSEz = 33.8cm.

Kansas Department of Agriculture, 2017 Kansas Lidar Aerial Lidar Report, 16104
February 2018
10 | P a g e
2.5 Smooth Surface Repeatability (Intraswath) Departures from planarity of first returns within single swaths in non-vegetated areas were assessed at multiple locations with hard surface areas (parking lots or large rooftops) inside the project area. Each area was evaluated using signed difference rasters (maximum elevation – minimum elevation) at a cell size equal to 2 x ANPS, rounded to the next integer. The following graphic depicts a sample of the assessment.
Figure 4: Smooth Surface Repeatability of ≤6cm

Kansas Department of Agriculture, 2017 Kansas Lidar Aerial Lidar Report, 16104
February 2018
11 | P a g e
2.6 Lidar Calibration Lidar ranging data were initially calibrated using previous best parameters for this instrument and aircraft. Using a combination of GeoCue, TerraScan and TerraMatch; the overlapping swath point clouds are corrected for any orientation or linear deviations to obtain the best fit swath-to-swath calibration. Relative calibration was evaluated using advanced plane-matching analysis and parameter corrections derived. This process was repeated interactively until residual errors between overlapping swaths, across all project missions, was reduced to ≤2cm. A final analysis of the calibrated lidar is preformed using a TerraMatch Tie Line report for an overall statistical model of the project area.
Upon completion of the data calibration, Atlantic runs a complete set of elevation difference intensity rasters (dZ Orthos). A user-defined color ramp is applied depicting the offsets between overlapping swaths based on project specifications. The dZ orthos provide an opportunity to review the data calibration in a qualitative manner. Atlantic assigns green to all offset values that fall below the required RMSDz requirement of the project. A yellow color is assigned for offsets that fall between the RMSDz value and 1.5x of that value. Finally, red values are assigned to all values that fall beyond 1.5x of the RMSDz requirements of the project.
No Data 0m to 0.04m 0.04m to 0.08m 0.08m to 0.12m > 0.12m
Figure 5: Swath Overlap Difference of ≤8cm, Maximum of ±16cm
Kansas Department of Agriculture, 2017 Kansas Lidar Aerial Lidar Report, 16104
February 2018
12 | P a g e
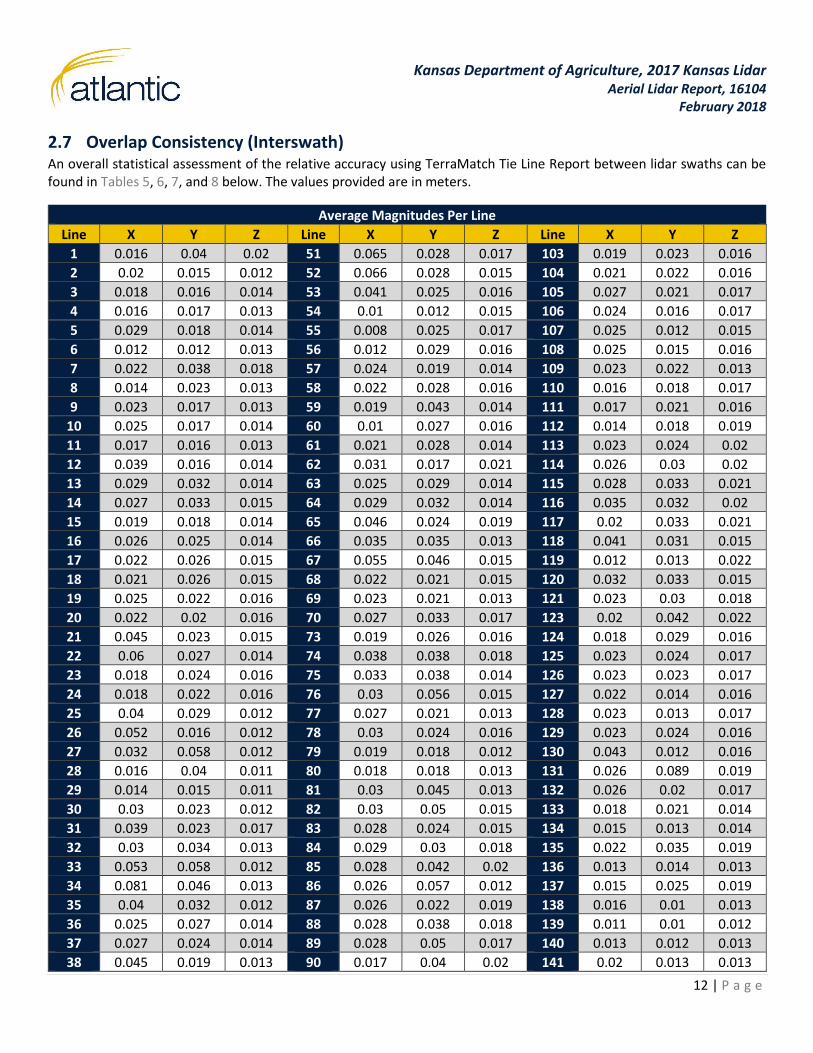
2.7 Overlap Consistency (Interswath) An overall statistical assessment of the relative accuracy using TerraMatch Tie Line Report between lidar swaths can be found in Tables 5, 6, 7, and 8 below. The values provided are in meters.
Average Magnitudes Per Line
Line X Y Z Line X Y Z Line X Y Z
1 0.016 0.04 0.02 51 0.065 0.028 0.017 103 0.019 0.023 0.016
2 0.02 0.015 0.012 52 0.066 0.028 0.015 104 0.021 0.022 0.016
3 0.018 0.016 0.014 53 0.041 0.025 0.016 105 0.027 0.021 0.017
4 0.016 0.017 0.013 54 0.01 0.012 0.015 106 0.024 0.016 0.017
5 0.029 0.018 0.014 55 0.008 0.025 0.017 107 0.025 0.012 0.015
6 0.012 0.012 0.013 56 0.012 0.029 0.016 108 0.025 0.015 0.016
7 0.022 0.038 0.018 57 0.024 0.019 0.014 109 0.023 0.022 0.013
8 0.014 0.023 0.013 58 0.022 0.028 0.016 110 0.016 0.018 0.017
9 0.023 0.017 0.013 59 0.019 0.043 0.014 111 0.017 0.021 0.016
10 0.025 0.017 0.014 60 0.01 0.027 0.016 112 0.014 0.018 0.019
11 0.017 0.016 0.013 61 0.021 0.028 0.014 113 0.023 0.024 0.02
12 0.039 0.016 0.014 62 0.031 0.017 0.021 114 0.026 0.03 0.02
13 0.029 0.032 0.014 63 0.025 0.029 0.014 115 0.028 0.033 0.021
14 0.027 0.033 0.015 64 0.029 0.032 0.014 116 0.035 0.032 0.02
15 0.019 0.018 0.014 65 0.046 0.024 0.019 117 0.02 0.033 0.021
16 0.026 0.025 0.014 66 0.035 0.035 0.013 118 0.041 0.031 0.015
17 0.022 0.026 0.015 67 0.055 0.046 0.015 119 0.012 0.013 0.022
18 0.021 0.026 0.015 68 0.022 0.021 0.015 120 0.032 0.033 0.015
19 0.025 0.022 0.016 69 0.023 0.021 0.013 121 0.023 0.03 0.018
20 0.022 0.02 0.016 70 0.027 0.033 0.017 123 0.02 0.042 0.022
21 0.045 0.023 0.015 73 0.019 0.026 0.016 124 0.018 0.029 0.016
22 0.06 0.027 0.014 74 0.038 0.038 0.018 125 0.023 0.024 0.017
23 0.018 0.024 0.016 75 0.033 0.038 0.014 126 0.023 0.023 0.017
24 0.018 0.022 0.016 76 0.03 0.056 0.015 127 0.022 0.014 0.016
25 0.04 0.029 0.012 77 0.027 0.021 0.013 128 0.023 0.013 0.017
26 0.052 0.016 0.012 78 0.03 0.024 0.016 129 0.023 0.024 0.016
27 0.032 0.058 0.012 79 0.019 0.018 0.012 130 0.043 0.012 0.016
28 0.016 0.04 0.011 80 0.018 0.018 0.013 131 0.026 0.089 0.019
29 0.014 0.015 0.011 81 0.03 0.045 0.013 132 0.026 0.02 0.017
30 0.03 0.023 0.012 82 0.03 0.05 0.015 133 0.018 0.021 0.014
31 0.039 0.023 0.017 83 0.028 0.024 0.015 134 0.015 0.013 0.014
32 0.03 0.034 0.013 84 0.029 0.03 0.018 135 0.022 0.035 0.019
33 0.053 0.058 0.012 85 0.028 0.042 0.02 136 0.013 0.014 0.013
34 0.081 0.046 0.013 86 0.026 0.057 0.012 137 0.015 0.025 0.019
35 0.04 0.032 0.012 87 0.026 0.022 0.019 138 0.016 0.01 0.013
36 0.025 0.027 0.014 88 0.028 0.038 0.018 139 0.011 0.01 0.012
37 0.027 0.024 0.014 89 0.028 0.05 0.017 140 0.013 0.012 0.013
38 0.045 0.019 0.013 90 0.017 0.04 0.02 141 0.02 0.013 0.013

Kansas Department of Agriculture, 2017 Kansas Lidar Aerial Lidar Report, 16104
February 2018
13 | P a g e
39 0.044 0.027 0.012 91 0.033 0.04 0.019 142 0.016 0.013 0.013
40 0.03 0.026 0.014 92 0.06 0.025 0.019 143 0.023 0.053 0.018
41 0.033 0.022 0.013 93 0.033 0.014 0.018 144 0.031 0.017 0.014
42 0.026 0.032 0.015 94 0.027 0.022 0.02 145 0.037 0.017 0.016
43 0.01 0.028 0.015 95 0.026 0.027 0.018 146 0.031 0.033 0.015
44 0.024 0.02 0.016 96 0.032 0.019 0.019 147 0.054 0.03 0.016
45 0.015 0.026 0.013 97 0.039 0.033 0.019 148 0.028 0.017 0.017
46 0.018 0.034 0.015 98 0.033 0.031 0.02 149 0.021 0.014 0.02
47 0.035 0.017 0.015 99 0.028 0.027 0.02 150 0.019 0.013 0.016
48 0.06 0.02 0.016 100 0.025 0.029 0.022 151 0.02 0.017 0.018
49 0.037 0.026 0.015 101 0.026 0.025 0.02 152 0.013 0.035 0.022
50 0.028 0.03 0.016 102 0.014 0.02 0.016 153 0.013 0.022 0.025 Table 5: Average Tie Line Magnitudes per Line
Internal Observation Statistics
Category X Y Z
Average Magnitude 0.025 0.023 0.016
RMS Values 0.050 0.044 0.022
Maximum Values 0.112 0.084 0.090
Observation Weight 14226.0 14226.0 355754.0 Table 6: Tie Line Observation Statistics
Overall Relative Accuracy
Category Mismatch
Average 3D Mismatch 0.01727
Average XY Mismatch 0.04469
Average Z Mismatch 0.01588 Table 7: Relative Accuracy Results
TerraMatch Tie Lines
Category Observations
Section Lines 147,230
Roof Lines 6,845 Table 8: Total Tie Lines

Kansas Department of Agriculture, 2017 Kansas Lidar Aerial Lidar Report, 16104
February 2018
14 | P a g e
2.8 Lidar Classification Atlantic uses multiple automated filtering routines on the calibrated lidar point cloud identifying and extracting bare-earth and above ground features. GeoCue, TerraScan, and TerraModeler software was used for the initial batch processing and manual editing of the lidar point clouds. Atlantic utilized collected breakline data to preform classification for classes’ 9-Water and 10-Ignored Ground in LP360. Outlined in Table 9 are the classification codes utilized for this project.
ASPRS Standard Lidar Point Classes
Code Description
1 Unclassified
2 Ground
7 Low Noise
9 Water
10 Ignored Ground
17
Bridges
18 High Noise
Flags Overlap & Withheld Table 9: Point Cloud Classification Scheme
Lidar Accuracy
3.1 Ground Surveyed Check Points Atlantic established a total of one-hundred and sixty-eight (168) check points for this project (93 NVA + 75 VVA). Point cloud data accuracy was tested against a Triangulated Irregular Network (TIN) constructed from lidar points in clear and open areas. A clear and open area can be characterized with respect to topographic and ground cover variation such that a minimum of 5 times the NPS exists with less than 1/3 of the RMSEZ deviation from a low-slope plane. Slopes that exceed 10 percent were avoided. Each land cover type representing 10 percent or more of the total project area were tested and reported with a VVA. In land cover categories other than dense urban areas, the tested points did not have obstructions 45 degrees above the horizon to ensure a sufficient TIN surface. The VVA value is provided as a target. It is understood that in areas of dense vegetation, swamps, or extremely difficult terrain, this value may be exceeded. The NVA value is a requirement that must be met, regardless of any allowed “busts” in the VVA(s) for individual land cover types within the project. Checkpoints for each assessment (NVA & VVA) are required to be well-distributed throughout the land cover type, for the entire project area.
3.2 Vertical Accuracy Requirements Below are the vertical accuracy reporting requirements for this project:
Vertical Accuracy Reporting Requirements in Meters: RMSEZ ≤ 10.0cm (Non-Vegetated Swath, DEM)
NVA ≤ 19.6cm 95% Confidence Level (Swath, DEM) VVA ≤ 29.4cm 95th Percentile (DEM)
*The terms NVA (Non-vegetated Vertical Accuracy) and VVA (Vegetated Vertical Accuracy) are from the ASPRS Positional Accuracy Standards for Digital Geospatial Data v1.0 (2014). The term NVA refers to assessments in clear, open areas (which

Kansas Department of Agriculture, 2017 Kansas Lidar Aerial Lidar Report, 16104
February 2018
15 | P a g e
typically produce only single lidar returns); the term VVA refers to assessments in vegetated areas (typically characterized by multiple return lidar).
3.3 Check Point Distribution
The following graphics depict the location and distribution of NVA and VVA check points established for this project.
Figure 6: Non-vegetated Vertical Accuracy (NVA) Check Point Distribution

Kansas Department of Agriculture, 2017 Kansas Lidar Aerial Lidar Report, 16104
February 2018
16 | P a g e
Figure 7: Vegetated Vertical Accuracy (VVA) Check Point Distribution

Kansas Department of Agriculture, 2017 Kansas Lidar Aerial Lidar Report, 16104
February 2018
17 | P a g e
3.4 Vertical Accuracy Results An overall statistical assessment of the check points can be found in Tables 10 and 11 below. The values provided are in meters.
Non-vegetated Vertical Accuracy (NVA) and Vegetated Vertical Accuracy (VVA)
Broad Land Cover Type # of Points RMSEz 95% Confidence Level 95th Percentile
NVA of Point Cloud 93 0.062 0.122
NVA of Bare Earth 93 0.061 0.119
NVA of DEM 93 0.059 0.115
VVA of Bare Earth 71 0.077 0.146 Table 10: Non-vegetated Vertical Accuracy (NVA) and Vegetated Vertical Accuracy (VVA)
Vegetated Vertical Accuracy (VVA) 5% Outliers > 95th Percentile (0.170m)
PointID Easting Northing KnownZ LaserZ Description DeltaZ
HG12 647743.869 4403924.301 455.735 456.008 High Grass 0.273
HG23 638215.234 4398754.280 456.590 456.769 High Grass 0.179
TR08 611105.405 4417484.227 506.978 507.209 Trees 0.231
TR22 606497.208 4361217.350 443.836 444.036 Trees 0.200 Table 11: 5% Outlier Check Points
3.5 Check Point Assessment A vertical accuracy assessment of the NVA & VVA check points against the lidar point cloud and bare-earth lidar can be found in Tables 12, 13, 14, and 15 below. The coordinates provided are in NAD83 (HARN), UTM Zone 14 North, NAVD88 (Geoid12B), Meters.
Non-vegetated Vertical Accuracy (NVA) Check Point Assessment (Point Cloud)
PointID Easting Northing KnownZ LaserZ Description DeltaZ
BE01 663011.283 4347807.256 388.617 388.600 Open Terrain/Bare Earth -0.017
BE02 645253.271 4350620.782 433.536 433.603 Open Terrain/Bare Earth 0.067
BE03 637332.474 4351937.619 402.843 402.777 Open Terrain/Bare Earth -0.066
BE04 614778.153 4361341.006 470.417 470.451 Open Terrain/Bare Earth 0.034
BE05 598570.782 4365940.359 441.646 441.674 Open Terrain/Bare Earth 0.028
BE06 596563.668 4384545.394 432.808 432.898 Open Terrain/Bare Earth 0.090
BE07 615605.135 4374249.867 448.448 448.402 Open Terrain/Bare Earth -0.046
BE08 629100.838 4372856.856 420.502 420.583 Open Terrain/Bare Earth 0.081
BE09 641831.261 4374587.897 414.688 414.723 Open Terrain/Bare Earth 0.035
BE10 648920.840 4363502.162 390.491 390.521 Open Terrain/Bare Earth 0.030
BE12 674181.130 4352776.237 386.726 386.733 Open Terrain/Bare Earth 0.007
BE13 673889.759 4371750.448 387.003 387.061 Open Terrain/Bare Earth 0.058
BE14 659410.235 4375671.500 405.238 405.295 Open Terrain/Bare Earth 0.057
BE15 672182.369 4386405.186 438.460 438.509 Open Terrain/Bare Earth 0.049
BE16 685937.984 4390047.104 373.759 373.775 Open Terrain/Bare Earth 0.016
BE17 685523.216 4404415.382 369.325 369.437 Open Terrain/Bare Earth 0.112
BE18 685949.526 4418945.311 414.760 414.810 Open Terrain/Bare Earth 0.050

Kansas Department of Agriculture, 2017 Kansas Lidar Aerial Lidar Report, 16104
February 2018
18 | P a g e
BE19 672019.799 4417009.375 404.270 404.260 Open Terrain/Bare Earth -0.010
BE20 665612.346 4410469.299 410.669 410.683 Open Terrain/Bare Earth 0.014
BE21 652732.952 4393214.078 420.666 420.617 Open Terrain/Bare Earth -0.049
BE22 641555.767 4391935.827 417.488 417.557 Open Terrain/Bare Earth 0.069
BE23 635207.112 4384925.585 406.924 406.948 Open Terrain/Bare Earth 0.024
BE24 624608.282 4395127.802 412.060 412.128 Open Terrain/Bare Earth 0.068
BE25 614047.225 4393248.884 469.197 469.181 Open Terrain/Bare Earth -0.016
BE26 601174.246 4396407.039 454.008 454.049 Open Terrain/Bare Earth 0.041
BE27 594744.379 4412421.712 469.910 469.981 Open Terrain/Bare Earth 0.071
BE28 612149.111 4410259.393 475.822 475.843 Open Terrain/Bare Earth 0.021
BE29 609009.577 4423857.428 509.876 509.888 Open Terrain/Bare Earth 0.012
BE30 631098.166 4412998.192 481.354 481.354 Open Terrain/Bare Earth 0.000
BE31 642428.358 4424927.443 486.909 486.952 Open Terrain/Bare Earth 0.043
OT01 597637.928 4417334.417 480.919 480.905 Open Terrain/Bare Earth -0.014
OT02 648501.359 4371501.254 391.659 391.738 Open Terrain/Bare Earth 0.079
OT03 606913.237 4399700.006 440.590 440.632 Open Terrain/Bare Earth 0.042
OT04 619809.047 4388557.158 440.437 440.469 Open Terrain/Bare Earth 0.032
OT05 634585.581 4396728.693 431.280 431.374 Open Terrain/Bare Earth 0.094
OT06 637746.409 4420357.064 478.368 478.359 Open Terrain/Bare Earth -0.009
OT07 650916.579 4406228.920 469.222 469.223 Open Terrain/Bare Earth 0.001
OT08 616903.805 4385267.607 418.660 418.673 Open Terrain/Bare Earth 0.013
OT09 621138.976 4368238.787 465.377 465.360 Open Terrain/Bare Earth -0.017
OT10 605200.390 4356350.815 425.103 425.131 Open Terrain/Bare Earth 0.028
OT11 643652.078 4365789.666 420.461 420.474 Open Terrain/Bare Earth 0.013
OT12 659011.784 4357415.112 385.766 385.749 Open Terrain/Bare Earth -0.017
OT13 659855.765 4338044.807 404.180 404.137 Open Terrain/Bare Earth -0.043
OT14 637610.526 4331003.808 412.680 412.675 Open Terrain/Bare Earth -0.005
OT15 669425.960 4353577.264 376.470 376.404 Open Terrain/Bare Earth -0.066
OT16 675473.673 4384889.771 427.982 428.019 Open Terrain/Bare Earth 0.037
OT17 675169.712 4397672.224 428.701 428.708 Open Terrain/Bare Earth 0.007
OT18 681875.407 4411528.994 395.372 395.396 Open Terrain/Bare Earth 0.024
OT19 682535.853 4425277.581 400.661 400.665 Open Terrain/Bare Earth 0.004
OT20 663621.369 4421749.958 455.233 455.202 Open Terrain/Bare Earth -0.031
OT21 606149.597 4385962.720 418.728 418.774 Open Terrain/Bare Earth 0.046
OT22 596214.001 4380282.325 457.913 457.933 Open Terrain/Bare Earth 0.020
OT23 629332.928 4363226.699 474.563 474.569 Open Terrain/Bare Earth 0.006
OT24 667890.271 4350252.643 368.526 368.537 Open Terrain/Bare Earth 0.011
OT25 657747.963 4384729.230 394.524 394.411 Open Terrain/Bare Earth -0.113
OT26 644856.043 4386792.596 406.849 406.862 Open Terrain/Bare Earth 0.013
OT27 643483.955 4413220.615 443.223 443.444 Open Terrain/Bare Earth 0.221
OT28 630146.312 4401307.214 453.604 453.610 Open Terrain/Bare Earth 0.006
OT29 618570.006 4417484.037 498.006 498.082 Open Terrain/Bare Earth 0.076
OT30 679057.133 4402622.137 397.145 397.055 Open Terrain/Bare Earth -0.090

Kansas Department of Agriculture, 2017 Kansas Lidar Aerial Lidar Report, 16104
February 2018
19 | P a g e
OT31 674662.377 4335054.395 382.725 382.733 Open Terrain/Bare Earth 0.008
UT01 624943.335 4419337.216 497.574 497.627 Urban Terrain 0.053
UT02 602941.531 4409331.184 446.485 446.358 Urban Terrain -0.127
UT03 594699.841 4399395.584 452.295 452.224 Urban Terrain -0.071
UT04 596932.189 4374391.421 474.236 474.322 Urban Terrain 0.086
UT05 596727.938 4354618.215 418.531 418.566 Urban Terrain 0.035
UT06 614887.056 4354869.899 447.481 447.473 Urban Terrain -0.008
UT07 608162.702 4377038.676 437.751 437.706 Urban Terrain -0.045
UT08 614918.106 4385283.395 418.589 418.535 Urban Terrain -0.054
UT09 615491.933 4400591.392 462.079 462.011 Urban Terrain -0.068
UT10 625132.489 4408716.372 485.691 485.540 Urban Terrain -0.151
UT11 618403.460 4423901.400 478.885 478.928 Urban Terrain 0.043
UT12 634240.464 4424450.023 481.859 481.748 Urban Terrain -0.111
UT13 643256.292 4406792.000 484.654 484.686 Urban Terrain 0.032
UT14 636742.810 4388944.174 410.772 410.697 Urban Terrain -0.075
UT15 628811.197 4385549.029 404.289 404.146 Urban Terrain -0.143
UT16 633926.523 4372917.881 424.863 424.882 Urban Terrain 0.019
UT17 633960.058 4363214.316 441.304 441.212 Urban Terrain -0.092
UT18 632414.133 4356741.982 424.614 424.552 Urban Terrain -0.062
UT19 644195.137 4337082.993 411.326 411.274 Urban Terrain -0.052
UT20 656255.727 4333149.081 369.552 369.498 Urban Terrain -0.054
UT21 655042.483 4345965.652 408.583 408.454 Urban Terrain -0.129
UT22 664861.229 4357039.651 361.694 361.635 Urban Terrain -0.059
UT23 671798.720 4342359.015 360.152 360.121 Urban Terrain -0.031
UT24 664275.369 4370469.149 396.730 396.745 Urban Terrain 0.015
UT25 655021.878 4376526.920 401.593 401.553 Urban Terrain -0.040
UT26 672178.565 4378060.657 403.885 403.852 Urban Terrain -0.033
UT27 673632.491 4394306.462 407.540 407.570 Urban Terrain 0.030
UT28 657535.532 4397357.155 424.436 424.467 Urban Terrain 0.031
UT29 656357.372 4415123.603 427.512 427.435 Urban Terrain -0.077
UT30 656886.148 4426519.686 475.296 475.292 Urban Terrain -0.004
UT31 682365.627 4418213.044 397.238 397.098 Urban Terrain -0.140
UT32 682461.267 4397649.314 404.067 404.069 Urban Terrain 0.002 Table 12: Lidar Point Cloud NVA Assessment
Non-vegetated Vertical Accuracy (NVA) Check Point Assessment (Bare-Earth)
PointID Easting Northing KnownZ LaserZ Description DeltaZ
BE01 663011.283 4347807.256 388.617 388.600 Open Terrain/Bare Earth -0.017
BE02 645253.271 4350620.782 433.536 433.600 Open Terrain/Bare Earth 0.064
BE03 637332.474 4351937.619 402.843 402.741 Open Terrain/Bare Earth -0.102
BE04 614778.153 4361341.006 470.417 470.441 Open Terrain/Bare Earth 0.024
BE05 598570.782 4365940.359 441.646 441.674 Open Terrain/Bare Earth 0.028

Kansas Department of Agriculture, 2017 Kansas Lidar Aerial Lidar Report, 16104
February 2018
20 | P a g e
BE06 596563.668 4384545.394 432.808 432.955 Open Terrain/Bare Earth 0.147
BE07 615605.135 4374249.867 448.448 448.402 Open Terrain/Bare Earth -0.046
BE08 629100.838 4372856.856 420.502 420.582 Open Terrain/Bare Earth 0.080
BE09 641831.261 4374587.897 414.688 414.712 Open Terrain/Bare Earth 0.024
BE10 648920.840 4363502.162 390.491 390.521 Open Terrain/Bare Earth 0.030
BE12 674181.130 4352776.237 386.726 386.726 Open Terrain/Bare Earth 0.000
BE13 673889.759 4371750.448 387.003 387.023 Open Terrain/Bare Earth 0.020
BE14 659410.235 4375671.500 405.238 405.246 Open Terrain/Bare Earth 0.008
BE15 672182.369 4386405.186 438.460 438.509 Open Terrain/Bare Earth 0.049
BE16 685937.984 4390047.104 373.759 373.775 Open Terrain/Bare Earth 0.016
BE17 685523.216 4404415.382 369.325 369.437 Open Terrain/Bare Earth 0.112
BE18 685949.526 4418945.311 414.760 414.810 Open Terrain/Bare Earth 0.050
BE19 672019.799 4417009.375 404.270 404.260 Open Terrain/Bare Earth -0.010
BE20 665612.346 4410469.299 410.669 410.722 Open Terrain/Bare Earth 0.053
BE21 652732.952 4393214.078 420.666 420.617 Open Terrain/Bare Earth -0.049
BE22 641555.767 4391935.827 417.488 417.557 Open Terrain/Bare Earth 0.069
BE23 635207.112 4384925.585 406.924 406.948 Open Terrain/Bare Earth 0.024
BE24 624608.282 4395127.802 412.060 412.128 Open Terrain/Bare Earth 0.068
BE25 614047.225 4393248.884 469.197 469.181 Open Terrain/Bare Earth -0.016
BE26 601174.246 4396407.039 454.008 454.049 Open Terrain/Bare Earth 0.041
BE27 594744.379 4412421.712 469.910 469.981 Open Terrain/Bare Earth 0.071
BE28 612149.111 4410259.393 475.822 475.843 Open Terrain/Bare Earth 0.021
BE29 609009.577 4423857.428 509.876 509.888 Open Terrain/Bare Earth 0.012
BE30 631098.166 4412998.192 481.354 481.354 Open Terrain/Bare Earth 0.000
BE31 642428.358 4424927.443 486.909 486.911 Open Terrain/Bare Earth 0.002
OT01 597637.928 4417334.417 480.919 480.905 Open Terrain/Bare Earth -0.014
OT02 648501.359 4371501.254 391.659 391.738 Open Terrain/Bare Earth 0.079
OT03 606913.237 4399700.006 440.590 440.632 Open Terrain/Bare Earth 0.042
OT04 619809.047 4388557.158 440.437 440.469 Open Terrain/Bare Earth 0.032
OT05 634585.581 4396728.693 431.280 431.374 Open Terrain/Bare Earth 0.094
OT06 637746.409 4420357.064 478.368 478.335 Open Terrain/Bare Earth -0.033
OT07 650916.579 4406228.920 469.222 469.223 Open Terrain/Bare Earth 0.001
OT08 616903.805 4385267.607 418.660 418.673 Open Terrain/Bare Earth 0.013
OT09 621138.976 4368238.787 465.377 465.360 Open Terrain/Bare Earth -0.017
OT10 605200.390 4356350.815 425.103 425.111 Open Terrain/Bare Earth 0.008
OT11 643652.078 4365789.666 420.461 420.474 Open Terrain/Bare Earth 0.013
OT12 659011.784 4357415.112 385.766 385.749 Open Terrain/Bare Earth -0.017
OT13 659855.765 4338044.807 404.180 404.137 Open Terrain/Bare Earth -0.043
OT14 637610.526 4331003.808 412.680 412.675 Open Terrain/Bare Earth -0.005
OT15 669425.960 4353577.264 376.470 376.404 Open Terrain/Bare Earth -0.066
OT16 675473.673 4384889.771 427.982 428.019 Open Terrain/Bare Earth 0.037
OT17 675169.712 4397672.224 428.701 428.691 Open Terrain/Bare Earth -0.010
OT18 681875.407 4411528.994 395.372 395.396 Open Terrain/Bare Earth 0.024

Kansas Department of Agriculture, 2017 Kansas Lidar Aerial Lidar Report, 16104
February 2018
21 | P a g e
OT19 682535.853 4425277.581 400.661 400.665 Open Terrain/Bare Earth 0.004
OT20 663621.369 4421749.958 455.233 455.202 Open Terrain/Bare Earth -0.031
OT21 606149.597 4385962.720 418.728 418.774 Open Terrain/Bare Earth 0.046
OT22 596214.001 4380282.325 457.913 457.933 Open Terrain/Bare Earth 0.020
OT23 629332.928 4363226.699 474.563 474.569 Open Terrain/Bare Earth 0.006
OT24 667890.271 4350252.643 368.526 368.537 Open Terrain/Bare Earth 0.011
OT25 657747.963 4384729.230 394.524 394.411 Open Terrain/Bare Earth -0.113
OT26 644856.043 4386792.596 406.849 406.860 Open Terrain/Bare Earth 0.011
OT27 643483.955 4413220.615 443.223 443.332 Open Terrain/Bare Earth 0.109
OT28 630146.312 4401307.214 453.604 453.609 Open Terrain/Bare Earth 0.005
OT29 618570.006 4417484.037 498.006 498.082 Open Terrain/Bare Earth 0.076
OT30 679057.133 4402622.137 397.145 397.055 Open Terrain/Bare Earth -0.090
OT31 674662.377 4335054.395 382.725 382.720 Open Terrain/Bare Earth 0.005
UT01 624943.335 4419337.216 497.574 497.562 Urban Terrain -0.012
UT02 602941.531 4409331.184 446.485 446.358 Urban Terrain -0.127
UT03 594699.841 4399395.584 452.295 452.224 Urban Terrain -0.071
UT04 596932.189 4374391.421 474.236 474.322 Urban Terrain 0.086
UT05 596727.938 4354618.215 418.531 418.566 Urban Terrain 0.035
UT06 614887.056 4354869.899 447.481 447.473 Urban Terrain -0.008
UT07 608162.702 4377038.676 437.751 437.706 Urban Terrain -0.045
UT08 614918.106 4385283.395 418.589 418.535 Urban Terrain -0.054
UT09 615491.933 4400591.392 462.079 462.011 Urban Terrain -0.068
UT10 625132.489 4408716.372 485.691 485.540 Urban Terrain -0.151
UT11 618403.460 4423901.400 478.885 478.928 Urban Terrain 0.043
UT12 634240.464 4424450.023 481.859 481.748 Urban Terrain -0.111
UT13 643256.292 4406792.000 484.654 484.686 Urban Terrain 0.032
UT14 636742.810 4388944.174 410.772 410.697 Urban Terrain -0.075
UT15 628811.197 4385549.029 404.289 404.146 Urban Terrain -0.143
UT16 633926.523 4372917.881 424.863 424.882 Urban Terrain 0.019
UT17 633960.058 4363214.316 441.304 441.212 Urban Terrain -0.092
UT18 632414.133 4356741.982 424.614 424.523 Urban Terrain -0.091
UT19 644195.137 4337082.993 411.326 411.274 Urban Terrain -0.052
UT20 656255.727 4333149.081 369.552 369.498 Urban Terrain -0.054
UT21 655042.483 4345965.652 408.583 408.454 Urban Terrain -0.129
UT22 664861.229 4357039.651 361.694 361.635 Urban Terrain -0.059
UT23 671798.720 4342359.015 360.152 360.121 Urban Terrain -0.031
UT24 664275.369 4370469.149 396.730 396.745 Urban Terrain 0.015
UT25 655021.878 4376526.920 401.593 401.553 Urban Terrain -0.040
UT26 672178.565 4378060.657 403.885 403.852 Urban Terrain -0.033
UT27 673632.491 4394306.462 407.540 407.570 Urban Terrain 0.030
UT28 657535.532 4397357.155 424.436 424.425 Urban Terrain -0.011
UT29 656357.372 4415123.603 427.512 427.435 Urban Terrain -0.077
UT30 656886.148 4426519.686 475.296 475.292 Urban Terrain -0.004

Kansas Department of Agriculture, 2017 Kansas Lidar Aerial Lidar Report, 16104
February 2018
22 | P a g e
UT31 682365.627 4418213.044 397.238 397.098 Urban Terrain -0.140
UT32 682461.267 4397649.314 404.067 403.974 Urban Terrain -0.093 Table 13: Bare-Earth Lidar NVA Assessment
Non-vegetated Vertical Accuracy (NVA) Check Point Assessment (DEM)
PointID Easting Northing KnownZ DEMZ Description DeltaZ
BE01 663011.283 4347807.256 388.617 388.600 Open Terrain/Bare Earth 0.017
BE02 645253.271 4350620.782 433.536 433.543 Open Terrain/Bare Earth -0.007
BE03 637332.474 4351937.619 402.843 402.745 Open Terrain/Bare Earth 0.098
BE04 614778.153 4361341.006 470.417 470.438 Open Terrain/Bare Earth -0.021
BE05 598570.782 4365940.359 441.646 441.687 Open Terrain/Bare Earth -0.041
BE06 596563.668 4384545.394 432.808 432.937 Open Terrain/Bare Earth -0.129
BE07 615605.135 4374249.867 448.448 448.392 Open Terrain/Bare Earth 0.056
BE08 629100.838 4372856.856 420.502 420.578 Open Terrain/Bare Earth -0.076
BE09 641831.261 4374587.897 414.688 414.657 Open Terrain/Bare Earth 0.031
BE10 648920.840 4363502.162 390.491 390.482 Open Terrain/Bare Earth 0.009
BE12 674181.130 4352776.237 386.726 386.709 Open Terrain/Bare Earth 0.017
BE13 673889.759 4371750.448 387.003 387.023 Open Terrain/Bare Earth -0.020
BE14 659410.235 4375671.500 405.238 405.223 Open Terrain/Bare Earth 0.015
BE15 672182.369 4386405.186 438.460 438.487 Open Terrain/Bare Earth -0.027
BE16 685937.984 4390047.104 373.759 373.776 Open Terrain/Bare Earth -0.017
BE17 685523.216 4404415.382 369.325 369.402 Open Terrain/Bare Earth -0.077
BE18 685949.526 4418945.311 414.760 414.756 Open Terrain/Bare Earth 0.004
BE19 672019.799 4417009.375 404.270 404.276 Open Terrain/Bare Earth -0.006
BE20 665612.346 4410469.299 410.669 410.709 Open Terrain/Bare Earth -0.040
BE21 652732.952 4393214.078 420.666 420.619 Open Terrain/Bare Earth 0.047
BE22 641555.767 4391935.827 417.488 417.499 Open Terrain/Bare Earth -0.011
BE23 635207.112 4384925.585 406.924 406.971 Open Terrain/Bare Earth -0.047
BE24 624608.282 4395127.802 412.060 412.026 Open Terrain/Bare Earth 0.034
BE25 614047.225 4393248.884 469.197 469.167 Open Terrain/Bare Earth 0.030
BE26 601174.246 4396407.039 454.008 453.988 Open Terrain/Bare Earth 0.020
BE27 594744.379 4412421.712 469.910 469.963 Open Terrain/Bare Earth -0.053
BE28 612149.111 4410259.393 475.822 475.834 Open Terrain/Bare Earth -0.012
BE29 609009.577 4423857.428 509.876 509.891 Open Terrain/Bare Earth -0.015
BE30 631098.166 4412998.192 481.354 481.355 Open Terrain/Bare Earth -0.001
BE31 642428.358 4424927.443 486.909 486.904 Open Terrain/Bare Earth 0.005
OT01 597637.928 4417334.417 480.919 480.912 Open Terrain/Bare Earth 0.007
OT02 648501.359 4371501.254 391.659 391.727 Open Terrain/Bare Earth -0.068
OT03 606913.237 4399700.006 440.590 440.565 Open Terrain/Bare Earth 0.025
OT04 619809.047 4388557.158 440.437 440.439 Open Terrain/Bare Earth -0.002
OT05 634585.581 4396728.693 431.280 431.364 Open Terrain/Bare Earth -0.084
OT06 637746.409 4420357.064 478.368 478.346 Open Terrain/Bare Earth 0.022

Kansas Department of Agriculture, 2017 Kansas Lidar Aerial Lidar Report, 16104
February 2018
23 | P a g e
OT07 650916.579 4406228.920 469.222 469.222 Open Terrain/Bare Earth 0.000
OT08 616903.805 4385267.607 418.660 418.641 Open Terrain/Bare Earth 0.019
OT09 621138.976 4368238.787 465.377 465.331 Open Terrain/Bare Earth 0.046
OT10 605200.390 4356350.815 425.103 425.082 Open Terrain/Bare Earth 0.021
OT11 643652.078 4365789.666 420.461 420.485 Open Terrain/Bare Earth -0.024
OT12 659011.784 4357415.112 385.766 385.751 Open Terrain/Bare Earth 0.015
OT13 659855.765 4338044.807 404.180 404.144 Open Terrain/Bare Earth 0.036
OT14 637610.526 4331003.808 412.680 412.659 Open Terrain/Bare Earth 0.021
OT15 669425.960 4353577.264 376.470 376.402 Open Terrain/Bare Earth 0.068
OT16 675473.673 4384889.771 427.982 428.018 Open Terrain/Bare Earth -0.036
OT17 675169.712 4397672.224 428.701 428.681 Open Terrain/Bare Earth 0.020
OT18 681875.407 4411528.994 395.372 395.413 Open Terrain/Bare Earth -0.041
OT19 682535.853 4425277.581 400.661 400.632 Open Terrain/Bare Earth 0.029
OT20 663621.369 4421749.958 455.233 455.194 Open Terrain/Bare Earth 0.039
OT21 606149.597 4385962.720 418.728 418.758 Open Terrain/Bare Earth -0.030
OT22 596214.001 4380282.325 457.913 457.926 Open Terrain/Bare Earth -0.013
OT23 629332.928 4363226.699 474.563 474.505 Open Terrain/Bare Earth 0.058
OT24 667890.271 4350252.643 368.526 368.515 Open Terrain/Bare Earth 0.011
OT25 657747.963 4384729.230 394.524 394.417 Open Terrain/Bare Earth 0.107
OT26 644856.043 4386792.596 406.849 406.858 Open Terrain/Bare Earth -0.009
OT27 643483.955 4413220.615 443.223 443.319 Open Terrain/Bare Earth -0.096
OT28 630146.312 4401307.214 453.604 453.622 Open Terrain/Bare Earth -0.018
OT29 618570.006 4417484.037 498.006 498.057 Open Terrain/Bare Earth -0.051
OT30 679057.133 4402622.137 397.145 397.052 Open Terrain/Bare Earth 0.093
OT31 674662.377 4335054.395 382.725 382.707 Open Terrain/Bare Earth 0.018
UT01 624943.335 4419337.216 497.574 497.550 Urban Terrain 0.024
UT02 602941.531 4409331.184 446.485 446.354 Urban Terrain 0.131
UT03 594699.841 4399395.584 452.295 452.214 Urban Terrain 0.081
UT04 596932.189 4374391.421 474.236 474.311 Urban Terrain -0.075
UT05 596727.938 4354618.215 418.531 418.557 Urban Terrain -0.026
UT06 614887.056 4354869.899 447.481 447.441 Urban Terrain 0.040
UT07 608162.702 4377038.676 437.751 437.726 Urban Terrain 0.025
UT08 614918.106 4385283.395 418.589 418.536 Urban Terrain 0.053
UT09 615491.933 4400591.392 462.079 461.984 Urban Terrain 0.095
UT10 625132.489 4408716.372 485.691 485.549 Urban Terrain 0.142
UT11 618403.460 4423901.400 478.885 478.925 Urban Terrain -0.040
UT12 634240.464 4424450.023 481.859 481.770 Urban Terrain 0.089
UT13 643256.292 4406792.000 484.654 484.677 Urban Terrain -0.023
UT14 636742.810 4388944.174 410.772 410.681 Urban Terrain 0.091
UT15 628811.197 4385549.029 404.289 404.142 Urban Terrain 0.147
UT16 633926.523 4372917.881 424.863 424.802 Urban Terrain 0.061
UT17 633960.058 4363214.316 441.304 441.196 Urban Terrain 0.108
UT18 632414.133 4356741.982 424.614 424.526 Urban Terrain 0.088

Kansas Department of Agriculture, 2017 Kansas Lidar Aerial Lidar Report, 16104
February 2018
24 | P a g e
UT19 644195.137 4337082.993 411.326 411.274 Urban Terrain 0.052
UT20 656255.727 4333149.081 369.552 369.493 Urban Terrain 0.059
UT21 655042.483 4345965.652 408.583 408.452 Urban Terrain 0.131
UT22 664861.229 4357039.651 361.694 361.639 Urban Terrain 0.055
UT23 671798.720 4342359.015 360.152 360.118 Urban Terrain 0.034
UT24 664275.369 4370469.149 396.730 396.673 Urban Terrain 0.057
UT25 655021.878 4376526.920 401.593 401.535 Urban Terrain 0.058
UT26 672178.565 4378060.657 403.885 403.857 Urban Terrain 0.028
UT27 673632.491 4394306.462 407.540 407.520 Urban Terrain 0.020
UT28 657535.532 4397357.155 424.436 424.406 Urban Terrain 0.030
UT29 656357.372 4415123.603 427.512 427.438 Urban Terrain 0.074
UT30 656886.148 4426519.686 475.296 475.290 Urban Terrain 0.006
UT31 682365.627 4418213.044 397.238 397.103 Urban Terrain 0.135
UT32 682461.267 4397649.314 404.067 403.973 Urban Terrain 0.094 Table 14: Bare=Earth DEM NVA Assessment
Vegetated Vertical Accuracy (VVA) Check Point Assessment (Bare Earth)
PointID Easting Northing KnownZ LaserZ Description DeltaZ
BR01 600853.785 4420517.311 463.787 463.893 Brush 0.106
BR02 610933.284 4404595.040 460.201 460.260 Brush 0.059
BR04 627711.538 4359218.177 470.544 470.669 Brush 0.125
BR05 619630.292 4379104.518 446.491 446.561 Brush 0.070
BR06 629130.870 4396858.931 471.977 472.100 Brush 0.123
BR07 625823.652 4414489.940 485.364 485.411 Brush 0.047
BR08 645855.137 4414832.891 424.044 424.021 Brush -0.023
BR09 642995.648 4398191.838 469.518 469.521 Brush 0.003
BR10 660637.622 4406370.156 413.430 413.504 Brush 0.074
BR11 664923.654 4426740.194 408.365 408.335 Brush -0.030
BR12 673355.037 4405738.836 411.627 411.647 Brush 0.020
BR13 681025.686 4386661.063 432.431 432.484 Brush 0.053
BR14 663892.395 4397088.756 442.882 443.017 Brush 0.135
BR15 662641.305 4382194.009 429.443 429.567 Brush 0.124
BR16 669069.437 4371991.031 423.151 423.313 Brush 0.162
BR17 677022.015 4365753.779 416.842 416.824 Brush -0.018
BR18 677580.076 4345863.577 384.931 385.048 Brush 0.117
BR19 666270.126 4342870.441 398.498 398.596 Brush 0.098
BR20 653437.419 4341087.799 379.822 379.859 Brush 0.037
BR21 639035.688 4341782.288 403.989 404.047 Brush 0.058
BR22 643453.568 4361503.390 400.236 400.285 Brush 0.049
BR23 644020.201 4377987.496 397.785 397.895 Brush 0.110
BR24 635546.507 4401809.494 445.081 445.131 Brush 0.050
BR25 660687.167 4368565.879 398.963 399.105 Brush 0.142

Kansas Department of Agriculture, 2017 Kansas Lidar Aerial Lidar Report, 16104
February 2018
25 | P a g e
HG01 603133.082 4414184.956 474.052 474.132 High Grass 0.080
HG02 607745.323 4391702.400 431.284 431.311 High Grass 0.027
HG03 623613.875 4363069.042 498.540 498.621 High Grass 0.081
HG04 600640.283 4362745.909 453.684 453.773 High Grass 0.089
HG05 645540.299 4334410.088 406.796 406.763 High Grass -0.033
HG06 651723.265 4354041.705 401.270 401.380 High Grass 0.110
HG07 662229.213 4351164.328 368.174 368.239 High Grass 0.065
HG08 633910.570 4372911.379 424.043 424.022 High Grass -0.021
HG09 665750.308 4386862.496 438.803 438.963 High Grass 0.160
HG10 654384.922 4373280.715 379.193 379.274 High Grass 0.081
HG11 651248.739 4386541.717 403.081 403.088 High Grass 0.007
HG13 661399.210 4423308.442 441.211 441.174 High Grass -0.037
HG14 637912.820 4414924.724 446.860 446.912 High Grass 0.052
HG15 621016.299 4412727.605 471.416 471.459 High Grass 0.043
HG16 666871.541 4413736.820 415.999 416.025 High Grass 0.026
HG17 679776.032 4406853.115 371.699 371.865 High Grass 0.166
HG18 683448.908 4383438.546 414.522 414.543 High Grass 0.021
HG19 674005.131 4391240.728 424.125 424.261 High Grass 0.136
HG20 621051.688 4374325.098 463.140 463.210 High Grass 0.070
HG21 641895.918 4369812.369 410.802 410.930 High Grass 0.128
HG22 622348.106 4385976.733 421.856 421.849 High Grass -0.007
HG24 623696.106 4399935.942 447.922 447.942 High Grass 0.020
HG25 664655.446 4405598.007 424.273 424.282 High Grass 0.009
HG26 601193.041 4396418.296 453.739 453.768 High Grass 0.029
TR01 629427.122 4368063.416 430.555 430.553 Trees -0.002
TR02 604897.269 4378769.962 450.800 450.896 Trees 0.096
TR03 656357.619 4358872.302 370.902 370.809 Trees -0.093
TR04 634542.778 4393715.273 422.371 422.433 Trees 0.062
TR05 641736.656 4377133.235 391.790 391.805 Trees 0.015
TR06 616911.385 4385260.215 418.358 418.507 Trees 0.149
TR07 631570.721 4407661.819 473.663 473.618 Trees -0.045
TR09 602687.838 4404133.295 436.290 436.267 Trees -0.023
TR10 653865.324 4418146.232 436.605 436.667 Trees 0.062
TR11 657213.369 4408713.211 432.721 432.646 Trees -0.075
TR12 666741.241 4394318.852 437.493 437.534 Trees 0.041
TR13 664617.836 4363854.694 390.242 390.288 Trees 0.046
TR14 667881.979 4350268.053 369.146 369.202 Trees 0.056
TR15 664868.384 4335689.763 403.594 403.550 Trees -0.044
TR16 675932.421 4338591.830 359.227 359.274 Trees 0.047
TR17 648636.078 4345679.148 399.031 399.052 Trees 0.021
TR18 664189.755 4375581.593 419.459 419.527 Trees 0.068
TR19 622580.969 4353342.031 422.593 422.527 Trees -0.066
TR20 656304.381 4392496.078 439.355 439.359 Trees 0.004

Kansas Department of Agriculture, 2017 Kansas Lidar Aerial Lidar Report, 16104
February 2018
26 | P a g e
TR21 671836.767 4342339.808 358.862 358.782 Trees -0.080
TR23 674842.470 4415133.683 411.126 411.161 Trees 0.035
TR24 596611.498 4396391.365 457.061 457.136 Trees 0.075
TR25 602342.631 4426218.101 495.785 495.766 Trees -0.019 Table 15: Bare-Earth Lidar VVA Assessment
Certification
4.1 Limitations of Use The accuracy assessment confirms that the data may be used for the intended applications stated in the Project Purpose section of this document. The dataset may also be used as a topographic input for other applications but the user should be aware that this lidar dataset was designed with a specific purpose and was not intended to meet specifications and/or requirements of users outside of the Kansas Department of Agriculture.
It should also be noted that lidar points do not represent a continuous surface model. Lidar points are discrete measurements of the surface and any values derived within a triangle of three lidar points are interpolated. As such, the user should not use the resultant lidar dataset for vertical placement of a planimetric feature such as a headwall, building footprint or any other planimetric feature unless there is an associated lidar point that can be reasonably located on this structure.
Consideration should be given by the end user of this dataset to the fact that this lidar dataset was developed differently and that previous lidar datasets that may be available for this geographic location. It is likely that the data in this project was created using different geodetic control, a different Geoid, newer lidar technology and more up-to-date processing techniques. As such, any direct comparative analysis performed between this dataset and previous datasets could result in misleading or inaccurate results. Users are encouraged to proceed with caution while performing this type of comparative analysis and to completely understand the variables that make each of these datasets unique and not corollary.
It is encouraged that the user refers to the full FGDC Metadata and project reports for a complete understanding on the content of this dataset.
I, hereby, certify to the extent of my knowledge that the statements and statistics represented in this document are true and factual.
Brian J. Mayfield, ASPRS Certified Photogrammetrist #R1276

Kansas Department of Agriculture, 2017 Kansas Lidar Aerial Lidar Report, 16104
February 2018
27 | P a g e
GNSS Processing
Inertial Explorer version 8.60.6717
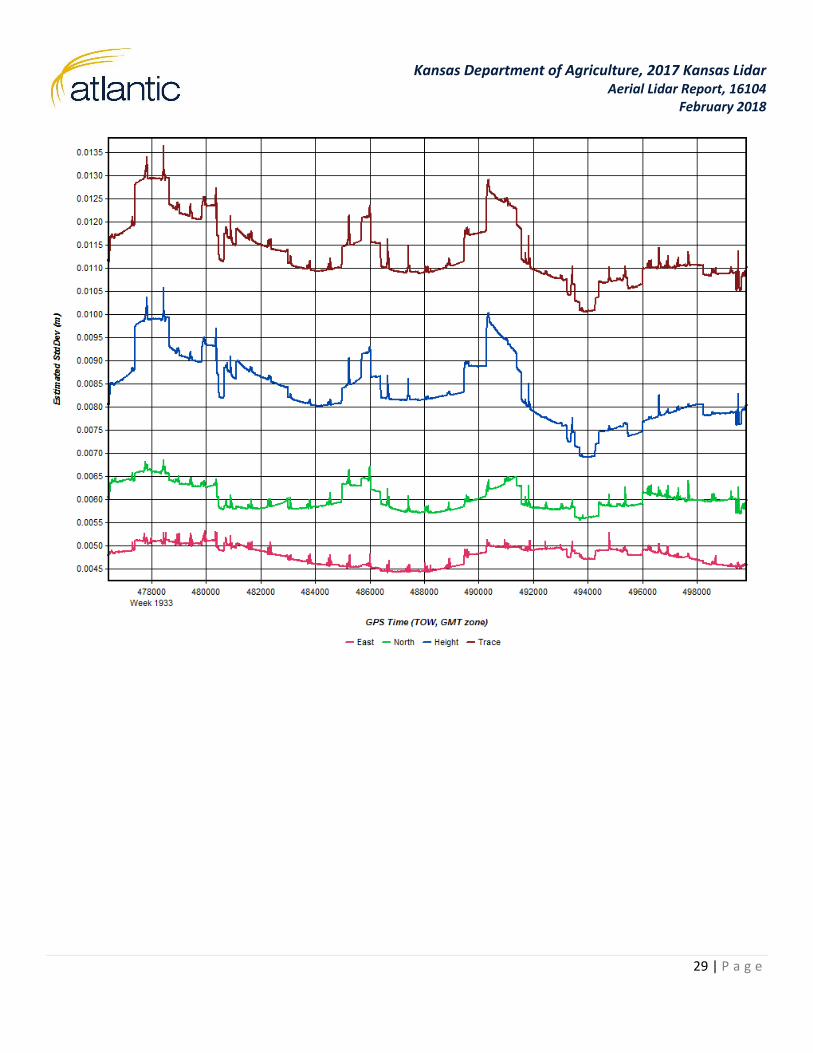
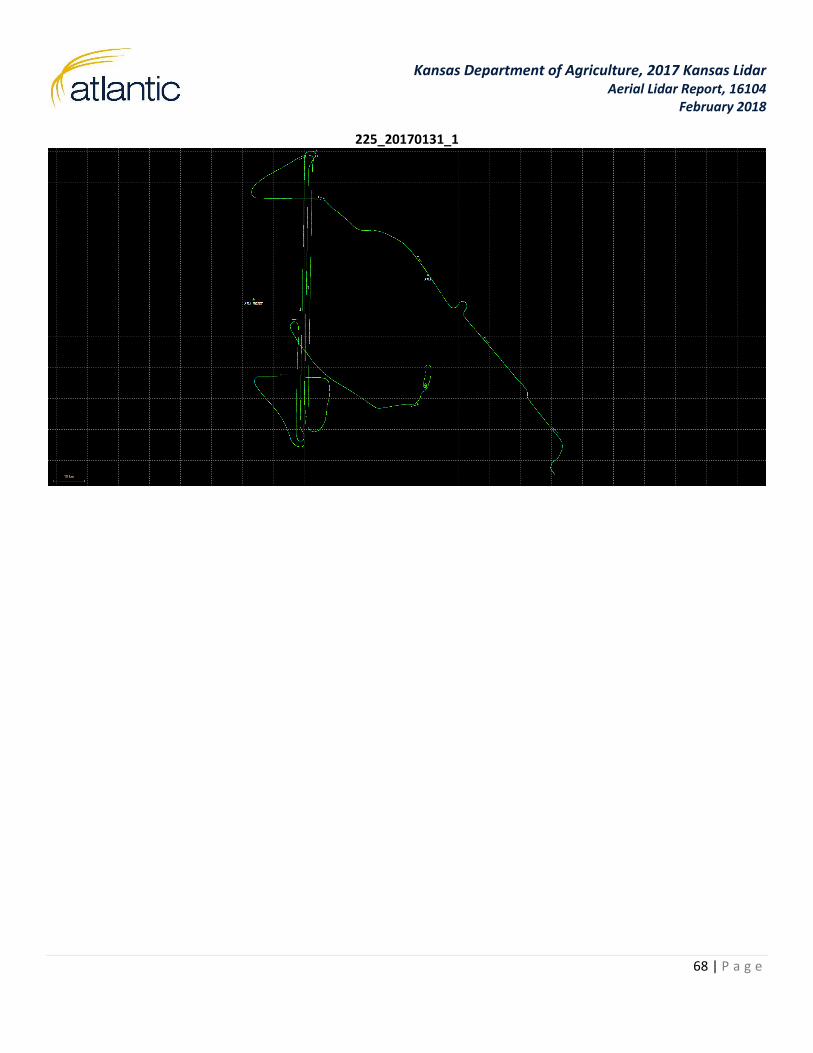
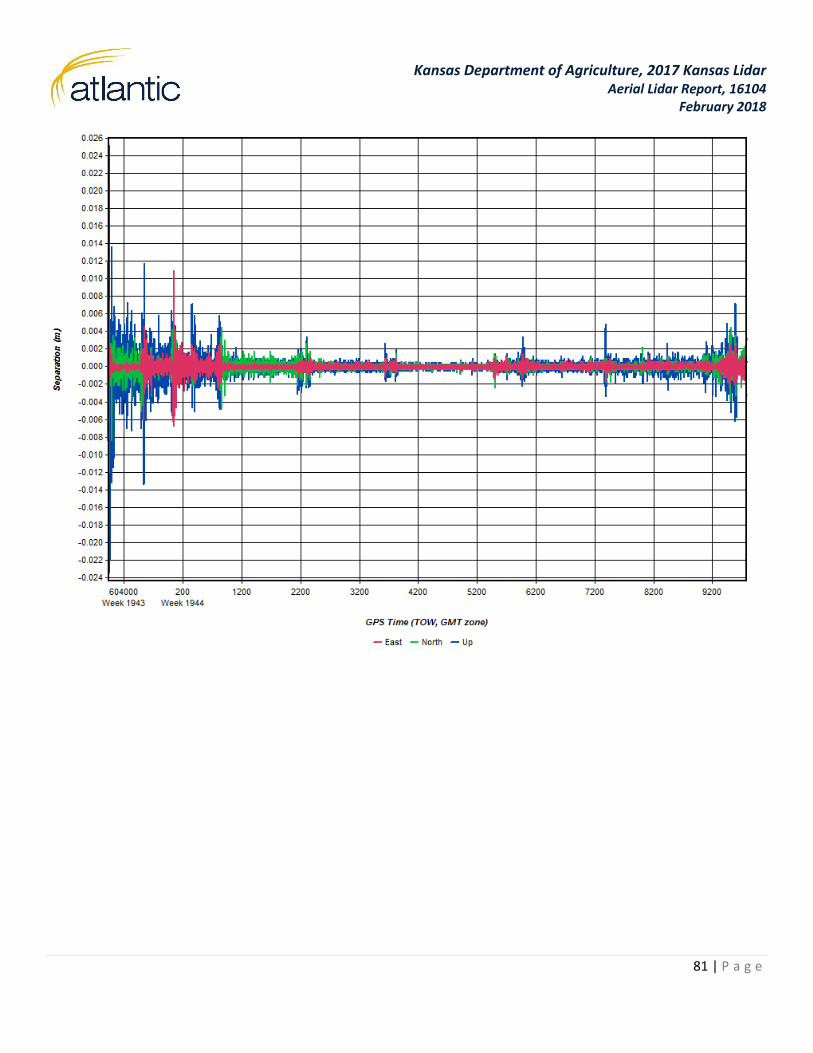
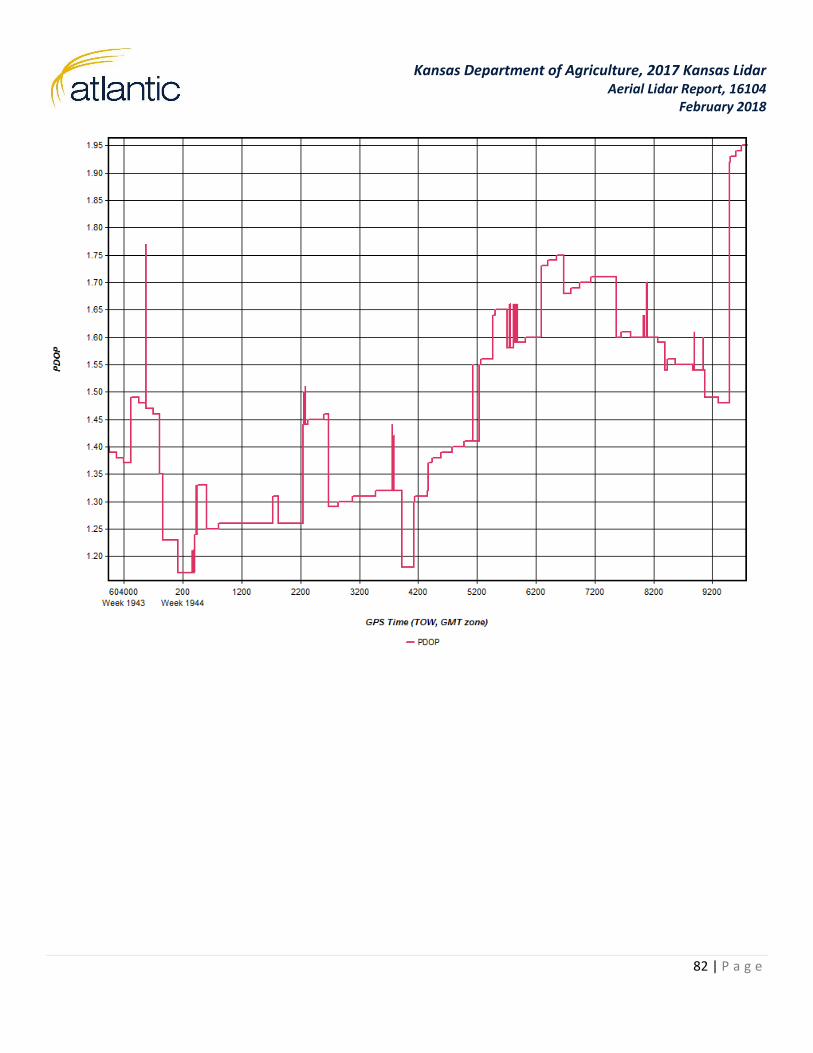
Plots by Mission: Coverage Map, Estimated Position Accuracy, Number of Satellites, Combined Separation, and PDOP.
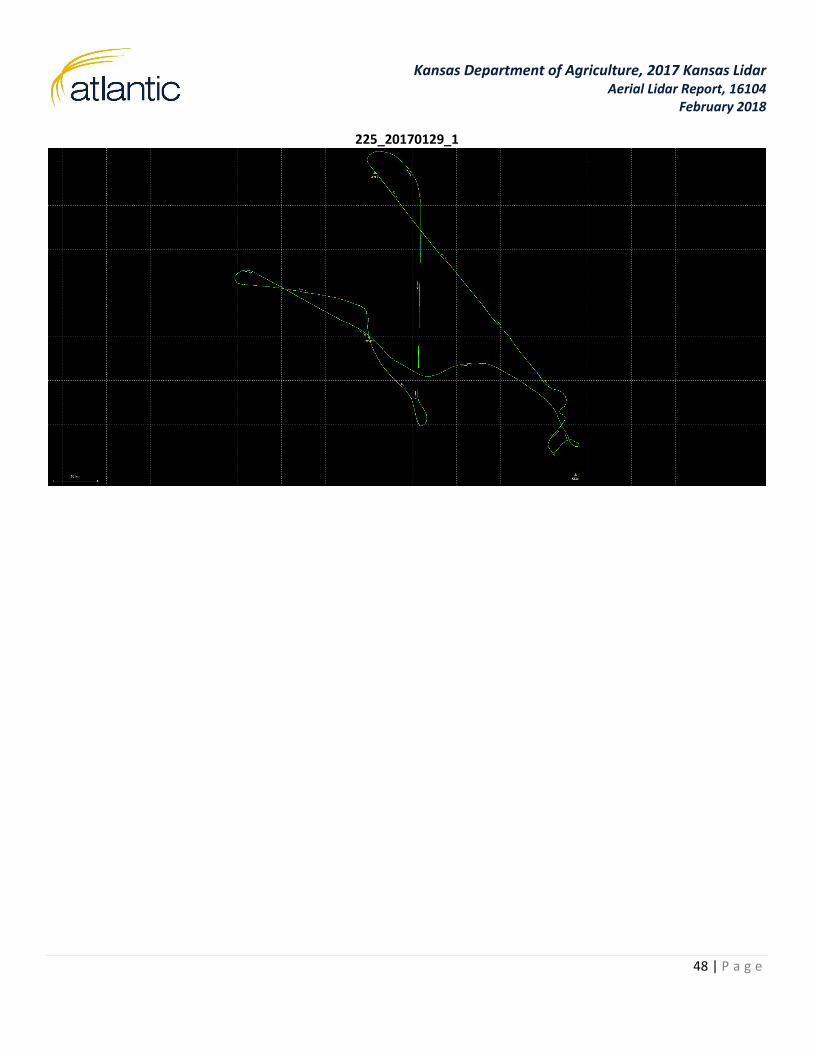
Coverage Map The Coverage Map plot shows the Aircraft GNSS-IMU Trajectory in reference to localized GNSS Reference Stations.
Estimated Position Accuracy The Estimated Position Accuracy plot shows the standard deviations of the east, north, and up directions versus time for the solution. The total standard deviation with a distance dependent component is also plotted.
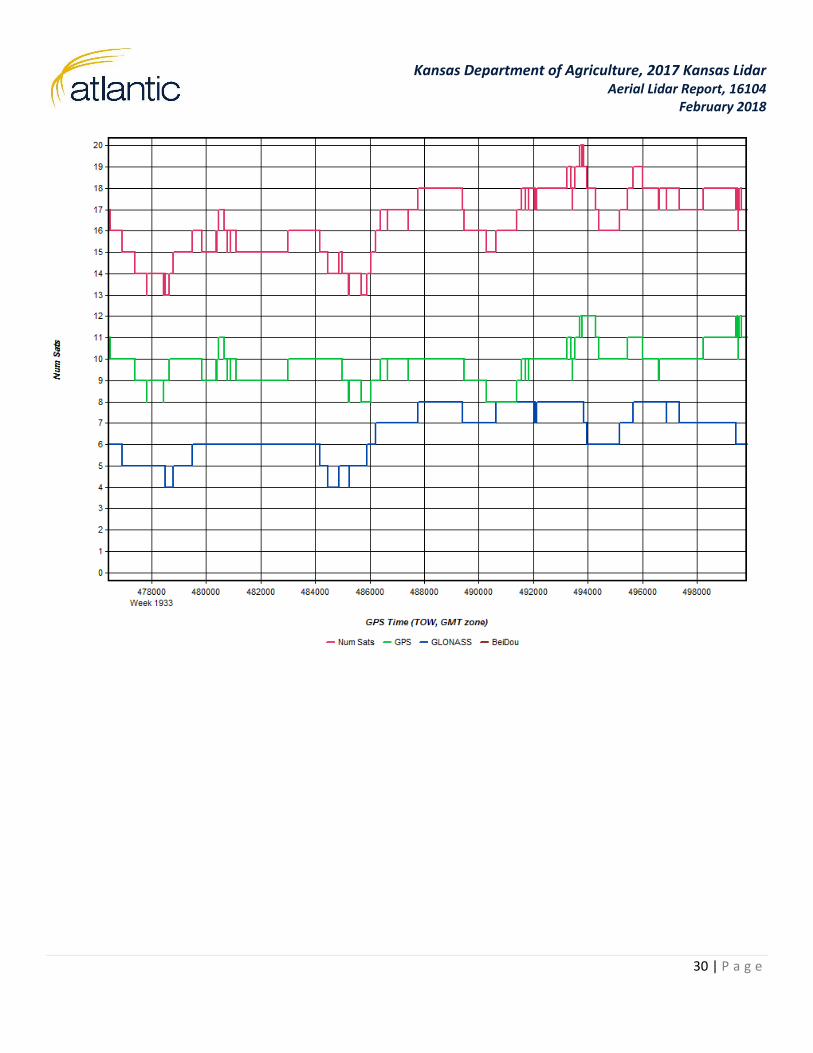
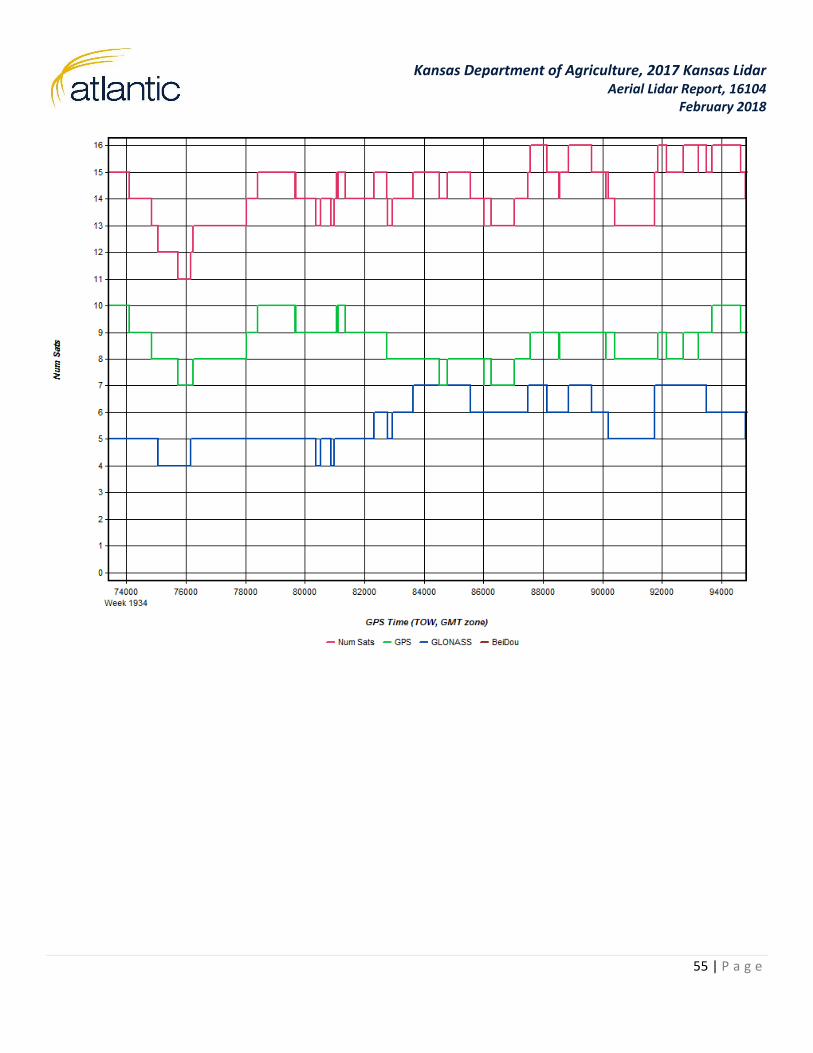
Number of Satellites Plots the number of satellites used in the solution as a function of time. The number of GPS satellites, GLONASS satellites, and the total number of satellites are distinguished with separate lines.
Combined Separation
Plots the north, east, and height position difference between any two solutions loaded into the project. This is most often the forward and reverse processing results, unless other solutions have been loaded from the Combine Solutions dialog. Plotting the difference between forward and reverse solutions can be very helpful in quality checking. When processing both directions, no information is shared between forward and reverse processing. Thus both directions are processed independently of each other. When forward and reverse solutions agree closely, it helps provide confidence in the solution. To a lesser extent, this plot can also help gauge solution accuracy.
PDOP
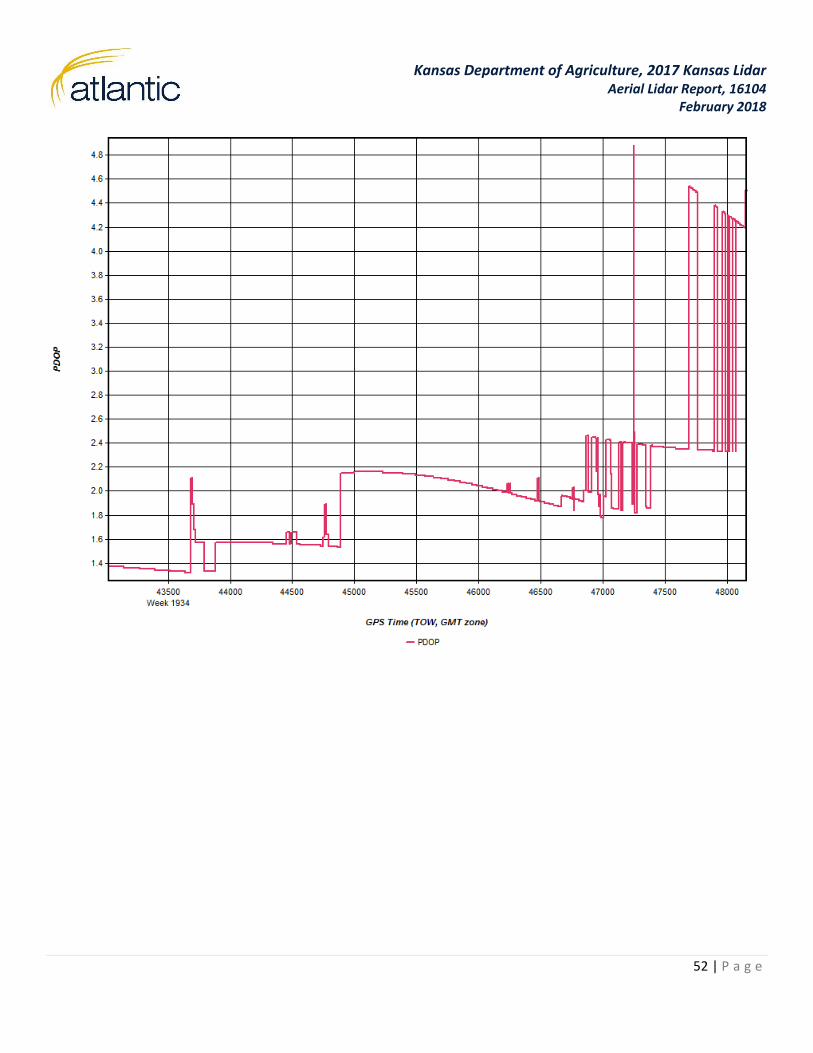
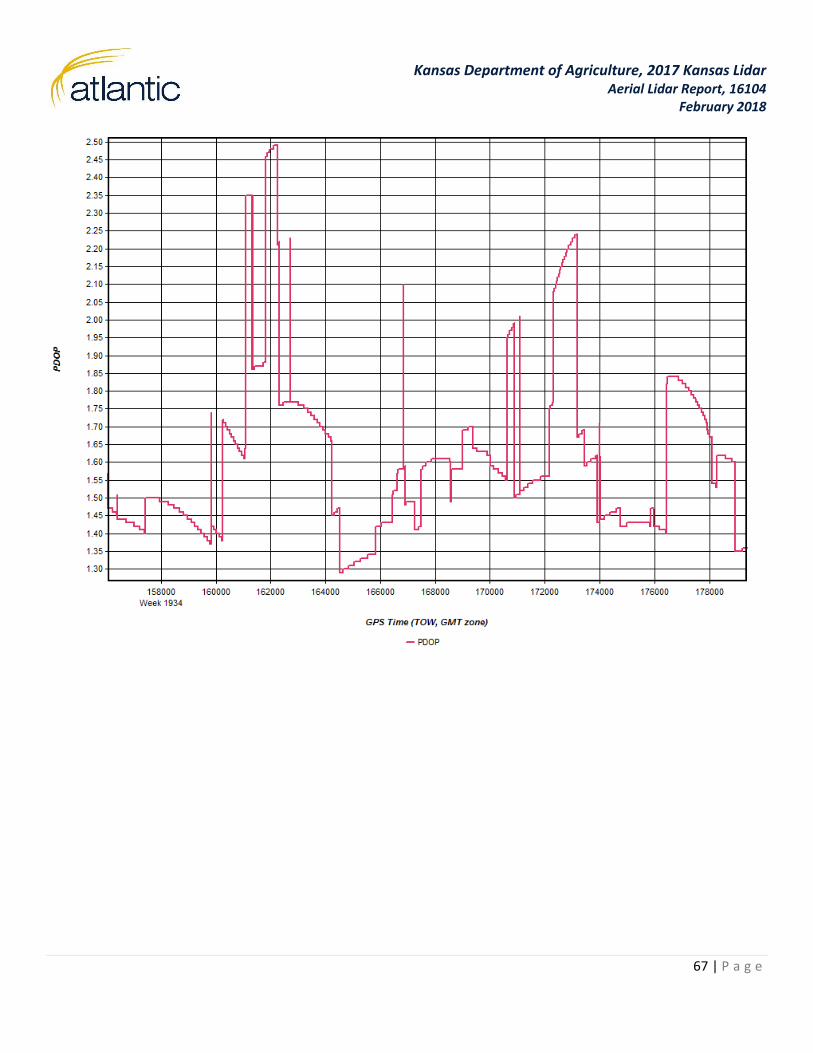
PDOP is a unit less number which indicates how favorable the satellite geometry is to 3D positioning accuracy. A strong satellite geometry, where the PDOP is low, occurs when satellites are well distributed in each direction (north, south, east and west) as well as directly overhead. Values in the range of 1-2 indicate very good satellite geometry, 2-3 are adequate in the sense that they do not generally, by themselves, limit positioning accuracy. Values between 3 and 4 are considered marginal, and values approaching or exceeding 5 can be considered poor. PDOP spikes can occur on aircraft turns were the antenna angle is unfavorable, these spikes while aesthetically unfavorable do not generally reduce the accuracy of the acquired data.

Kansas Department of Agriculture, 2017 Kansas Lidar Aerial Lidar Report, 16104
February 2018
28 | P a g e
225_20170127_1
Kansas Department of Agriculture, 2017 Kansas Lidar Aerial Lidar Report, 16104
February 2018
29 | P a g e
Kansas Department of Agriculture, 2017 Kansas Lidar Aerial Lidar Report, 16104
February 2018
30 | P a g e

Kansas Department of Agriculture, 2017 Kansas Lidar Aerial Lidar Report, 16104
February 2018
31 | P a g e

Kansas Department of Agriculture, 2017 Kansas Lidar Aerial Lidar Report, 16104
February 2018
32 | P a g e

Kansas Department of Agriculture, 2017 Kansas Lidar Aerial Lidar Report, 16104
February 2018
33 | P a g e
225_20170127_2

Kansas Department of Agriculture, 2017 Kansas Lidar Aerial Lidar Report, 16104
February 2018
34 | P a g e

Kansas Department of Agriculture, 2017 Kansas Lidar Aerial Lidar Report, 16104
February 2018
35 | P a g e

Kansas Department of Agriculture, 2017 Kansas Lidar Aerial Lidar Report, 16104
February 2018
36 | P a g e

Kansas Department of Agriculture, 2017 Kansas Lidar Aerial Lidar Report, 16104
February 2018
37 | P a g e

Kansas Department of Agriculture, 2017 Kansas Lidar Aerial Lidar Report, 16104
February 2018
38 | P a g e
225_20170128_1

Kansas Department of Agriculture, 2017 Kansas Lidar Aerial Lidar Report, 16104
February 2018
39 | P a g e

Kansas Department of Agriculture, 2017 Kansas Lidar Aerial Lidar Report, 16104
February 2018
40 | P a g e

Kansas Department of Agriculture, 2017 Kansas Lidar Aerial Lidar Report, 16104
February 2018
41 | P a g e

Kansas Department of Agriculture, 2017 Kansas Lidar Aerial Lidar Report, 16104
February 2018
42 | P a g e

Kansas Department of Agriculture, 2017 Kansas Lidar Aerial Lidar Report, 16104
February 2018
43 | P a g e
225_20170128_2

Kansas Department of Agriculture, 2017 Kansas Lidar Aerial Lidar Report, 16104
February 2018
44 | P a g e

Kansas Department of Agriculture, 2017 Kansas Lidar Aerial Lidar Report, 16104
February 2018
45 | P a g e

Kansas Department of Agriculture, 2017 Kansas Lidar Aerial Lidar Report, 16104
February 2018
46 | P a g e

Kansas Department of Agriculture, 2017 Kansas Lidar Aerial Lidar Report, 16104
February 2018
47 | P a g e
Kansas Department of Agriculture, 2017 Kansas Lidar Aerial Lidar Report, 16104
February 2018
48 | P a g e
225_20170129_1

Kansas Department of Agriculture, 2017 Kansas Lidar Aerial Lidar Report, 16104
February 2018
49 | P a g e

Kansas Department of Agriculture, 2017 Kansas Lidar Aerial Lidar Report, 16104
February 2018
50 | P a g e

Kansas Department of Agriculture, 2017 Kansas Lidar Aerial Lidar Report, 16104
February 2018
51 | P a g e
Kansas Department of Agriculture, 2017 Kansas Lidar Aerial Lidar Report, 16104
February 2018
52 | P a g e

Kansas Department of Agriculture, 2017 Kansas Lidar Aerial Lidar Report, 16104
February 2018
53 | P a g e
225_20170129_2

Kansas Department of Agriculture, 2017 Kansas Lidar Aerial Lidar Report, 16104
February 2018
54 | P a g e
Kansas Department of Agriculture, 2017 Kansas Lidar Aerial Lidar Report, 16104
February 2018
55 | P a g e

Kansas Department of Agriculture, 2017 Kansas Lidar Aerial Lidar Report, 16104
February 2018
56 | P a g e

Kansas Department of Agriculture, 2017 Kansas Lidar Aerial Lidar Report, 16104
February 2018
57 | P a g e

Kansas Department of Agriculture, 2017 Kansas Lidar Aerial Lidar Report, 16104
February 2018
58 | P a g e
225_20170130_1

Kansas Department of Agriculture, 2017 Kansas Lidar Aerial Lidar Report, 16104
February 2018
59 | P a g e

Kansas Department of Agriculture, 2017 Kansas Lidar Aerial Lidar Report, 16104
February 2018
60 | P a g e

Kansas Department of Agriculture, 2017 Kansas Lidar Aerial Lidar Report, 16104
February 2018
61 | P a g e

Kansas Department of Agriculture, 2017 Kansas Lidar Aerial Lidar Report, 16104
February 2018
62 | P a g e

Kansas Department of Agriculture, 2017 Kansas Lidar Aerial Lidar Report, 16104
February 2018
63 | P a g e
225_20170130_2

Kansas Department of Agriculture, 2017 Kansas Lidar Aerial Lidar Report, 16104
February 2018
64 | P a g e

Kansas Department of Agriculture, 2017 Kansas Lidar Aerial Lidar Report, 16104
February 2018
65 | P a g e

Kansas Department of Agriculture, 2017 Kansas Lidar Aerial Lidar Report, 16104
February 2018
66 | P a g e
Kansas Department of Agriculture, 2017 Kansas Lidar Aerial Lidar Report, 16104
February 2018
67 | P a g e
Kansas Department of Agriculture, 2017 Kansas Lidar Aerial Lidar Report, 16104
February 2018
68 | P a g e
225_20170131_1

Kansas Department of Agriculture, 2017 Kansas Lidar Aerial Lidar Report, 16104
February 2018
69 | P a g e

Kansas Department of Agriculture, 2017 Kansas Lidar Aerial Lidar Report, 16104
February 2018
70 | P a g e

Kansas Department of Agriculture, 2017 Kansas Lidar Aerial Lidar Report, 16104
February 2018
71 | P a g e

Kansas Department of Agriculture, 2017 Kansas Lidar Aerial Lidar Report, 16104
February 2018
72 | P a g e

Kansas Department of Agriculture, 2017 Kansas Lidar Aerial Lidar Report, 16104
February 2018
73 | P a g e
225_20170408_1

Kansas Department of Agriculture, 2017 Kansas Lidar Aerial Lidar Report, 16104
February 2018
74 | P a g e

Kansas Department of Agriculture, 2017 Kansas Lidar Aerial Lidar Report, 16104
February 2018
75 | P a g e

Kansas Department of Agriculture, 2017 Kansas Lidar Aerial Lidar Report, 16104
February 2018
76 | P a g e

Kansas Department of Agriculture, 2017 Kansas Lidar Aerial Lidar Report, 16104
February 2018
77 | P a g e

Kansas Department of Agriculture, 2017 Kansas Lidar Aerial Lidar Report, 16104
February 2018
78 | P a g e
225_20170408_2

Kansas Department of Agriculture, 2017 Kansas Lidar Aerial Lidar Report, 16104
February 2018
79 | P a g e

Kansas Department of Agriculture, 2017 Kansas Lidar Aerial Lidar Report, 16104
February 2018
80 | P a g e
Kansas Department of Agriculture, 2017 Kansas Lidar Aerial Lidar Report, 16104
February 2018
81 | P a g e
Kansas Department of Agriculture, 2017 Kansas Lidar Aerial Lidar Report, 16104
February 2018
82 | P a g e

Kansas Department of Agriculture, 2017 Kansas Lidar Aerial Lidar Report, 16104
February 2018
83 | P a g e
225_20170412_1

Kansas Department of Agriculture, 2017 Kansas Lidar Aerial Lidar Report, 16104
February 2018
84 | P a g e

Kansas Department of Agriculture, 2017 Kansas Lidar Aerial Lidar Report, 16104
February 2018
85 | P a g e

Kansas Department of Agriculture, 2017 Kansas Lidar Aerial Lidar Report, 16104
February 2018
86 | P a g e

Kansas Department of Agriculture, 2017 Kansas Lidar Aerial Lidar Report, 16104
February 2018
87 | P a g e

Kansas Department of Agriculture, 2017 Kansas Lidar Aerial Lidar Report, 16104
February 2018
88 | P a g e
225_20170505_1

Kansas Department of Agriculture, 2017 Kansas Lidar Aerial Lidar Report, 16104
February 2018
89 | P a g e

Kansas Department of Agriculture, 2017 Kansas Lidar Aerial Lidar Report, 16104
February 2018
90 | P a g e

Kansas Department of Agriculture, 2017 Kansas Lidar Aerial Lidar Report, 16104
February 2018
91 | P a g e

Kansas Department of Agriculture, 2017 Kansas Lidar Aerial Lidar Report, 16104
February 2018
92 | P a g e