lidar applications in precision forestry - university of washington
TRANSCRIPT
Lidar Applications in Precision Forestry L. Monika Moskal1, Todd Erdody1, Akira Kato2, Jeffery Richardson1, Guang Zheng1 and
David Briggs3
1Precision Forestry Cooperative and Remote Sensing and Geospatial Applications Laboratory, University of Washington, [email protected]
2Chiba University, Japan 3 Precision Forestry Cooperative and Stand Management Cooperative, University of
Washington Abstract Precision forestry leverages advance technology sensing and analytical tools to support site-specific economic, environmental, and sustainable decision making for the forestry sector. The discipline is highly reliant on accurate, timely and detailed forest inventory characterization and structural information, spanning extensive land holdings. Discrete, high density, lidar point cloud has become an invaluable dataset utilized in precision forestry applications. This paper gives a synopsis of a research with aerial and terrestrial lidar to provide detailed forest inventory characteristics such as canopy heights and volumes as well as diameter at breast height. The estimation of Leaf Area Index (LAI) and forest fuel metrics are also addressed. The results presented here summarize the achievable accuracies and future goals of applied lidar remote sensing research in the field of precision forestry. Key words: precision forestry, forest inventory, leaf area index (LAI), volume, fuels 1. Introduction Precision forestry leverages advance technology and tools to support sustainable decision making incorporating biological, ecological, social and economic components of forestry. Because forests span extensive land holdings precision forestry is highly reliant on accurate, timely, repeatable, detailed and spatially explicit forest inventory characterizations and structural information. One monitoring technology that ideally suits the needs of precision forestry is remote sensing. From its earliest days remote sensing has been utilizing emerging technologies to systematically monitor spatially explicitly changes on the landscape. In recent years the science of remote sensing has been leaning towards leveraging these monitoring methodologies as the fundamental geospatial database deliverable for decision support tools. Such tools are needed critical components in the timber industry where more and more forests are expected to not only provide timber product revenues but also a diverse range of ecosystem services for the public, industrial and private landowners. Moreover, wildfire and forest health management, understanding of efficient and optimal carbon sequestration and water interception, distribution of wildlife habitat and potential stock of cellulosic biofuels all require information that is achievable and enhanced with various satellite, aerial and terrestrial remote sensing techniques. Thus, remote sensing integrated with geospatial procedures and efficient field sampling techniques promises a fundamental data source for ecologically, socially and economically sustainable on-the-ground forest management.
Laser scanning methods such as aerial lidar have been effectively demonstrated in precision forestry applications, for example: in forest height inventory assessment (Andersen et al. 2006), multiple resource inventory (Reutebuch et al. 2005), ecosystem studies (Lefsky et al. 2002) and stand value estimates (Murphy 2008). The improvements in density and foremost availability of aerial and terrestrial lidar technology in the last few years have supplemented the inventory research and facilitated research focusing on leaf area and productivity parameterization necessary for assessment of ecosystem services (Richardson et al. 2009; Moskal and Kato, 2008) and biomass estimation (Popescue et al. 2004). Previously, Vose et al. (1988) have demonstrated the relationship between leaf area and nutrient through ground sampling, however, non-destructive testing (NDT) methods facilitated by terrestrial laser scanning allow for re-visitation and multitemporal assessment of above ground biomass accumulation; a critical characteristics of productivity that can be related to carbon sequestration or water interception. The relationship between nutrient treatments and plantation response has not been explored through the laser scanner remote sensing perspective. Such approach, combined with three-dimensional crown reconstruction (Moskal and Kato 2008; Kato et al, in press) and derivation of leaf area index (LAI) from a discreet return lidar point cloud (Richardson et al. 2009), will benefit from the systematic ability of aerial lidar to capture spatially explicit coverage of the nutrient treatment sites and the fine structural and temporal resolutions provided by the terrestrial lidar instrument. Terrestrial lidar data will likely permit the development of stem structure characterization and branching which can, combined with other NDT methods, be applied to research exploring assessment of log quality (Briggs et al. 2008) as well as biomass and stand characterization. Furthermore, the methods gained in exploring the structural complexities of the aerial and terrestrial lidar can be implemented in wild fire prediction (Mutlu et al. 2008) and advance visualization of forest characteristics (McGaughey 2004; Moskal et al. 2004). In this brief synopsis paper we highlight some of the recent results of research utilizing aerial and terrestrial lidar by the Precision Forestry Cooperative at the University of Washington. We focus on components of traditional forest inventories diameter at breast height (dbh) and canopy height, as well as crown volume estimates. The estimation of LAI and forest fire fuel modeling variables are also addressed. Our approach and applications develop methods that synergize point clouds from multiple scans and fuse that information with additional remote sensing techniques such as multispectral sensing. Currently, majority of aerial and terrestrial lidar analysis degrades the point cloud to a two dimensional image through rasterization, our techniques are evolving to utilize the three dimensional structure inherent in the lidar data and promise to deliver finally resolved parameters of forest structure that can compliment field observations and other methods of sampling. Part of our approach relies on an optimized terrestrial lidar sampling and field assessments to further enhance our understanding of lidar driven forest inventory protocols. Most critically, the research presented here is driven by forest industry needs in anticipation of the technological tools becoming more cost effective, with the goal of providing solutions to sustainable and thus profitable forest management. 2. Methods A general overview of the methodologies for utilizing aerial and terrestrial lidar for precision forestry applications developed by Precision Forestry Cooperative (PFC) is provided here. Species characterization is beyond the scope of this paper; however, all of the results presented here are species dependent. Species characterization for precision forestry applications can has
been addressed by Kim et al. (in press) and others (Brantberg 2007), and continues to be an active research area of Precision Forestry Cooperative. 2.1 Data 2.1.1 Aerial Lidar The research presented here relies on small diameter footprint, high density, discrete point aerial lidar data. Typical datasets consists of 4 returns per pulse with at least 4-20 and more pulses per m2. All aerial lidar data were acquired with a maximum scan angle of ± 10° from nadir. The scanner classified the lidar returns into 1st, 2nd, 3rd, and last, where the last return was the final return to break the instrument’s energy threshold. The impulse frequency for all data was 100 kHz and up. The aerial lidar data have been provided by various vendors using an array of aerial lidar scanners. Spatially, the data cover urban forest, such as the Washington State Arboretum just under a 100 ha with over 5000 species, managed and unmanaged forests in the Puget Sound Region of the State of Washington, dominated by Douglas-fir (Pseudotsuga menziesii), western red cedar (Thuja plicata) and big leaf maple (Acer sp.). Additional data were acquired over the Eastern Washington cascade ecoregion Ponderosa pine (Pinus ponderosa) and associated mixed mesic conifer forest including grand fir (Abies grandis), lodgepole pine (Pinus contorta), Engelmann spruce (Picea engalmanii) and western larch (Larix occidentalis). For some of the locations the lidar data have been matched with other aerial imagery such as color infrared digital photography. Fusion of lidar and imagery is a dynamic component of the research approach; however, we will not address this part of our research in this paper. The raw lidar data were processed using Fusion software’s ClipData feature (McGaughey, 2007) to normalize the vegetation heights above a constant ground elevation using a ground model previously developed from the lidar data. This produced a dataset where the height (z values) for each point represented the true elevation of that point above ground level. All aerial lidar acquisition datasets are matched with field forest inventories, and sometimes hemispherical photography, collected to coincide as closely as possible to the date of the lidar acquisition, in some cases a year or more has lapsed between the two data set collections. This mismatch of datasets significantly impacts the models and results presented later in the paper; however, this is a common issue with remote sensing research and will not be addressed or discussed further in this paper. 2.1.2 Terrestrial Lidar Leica Scan Station II 3D laser scanner was used to scan forest stands. The Scan Station II is a high-density scanning laser with emitting visible green light (532nm) laser pulses up to 1800 laser pulses per second. The maximum field-of-view is 360º and 270º in the horizontal and vertical direction respectively. The spot size is about 1mm at a distance of 50m. The unique dual-windows design allows it for efficient utilization of its 360º * 270º maximum field-of-view without re-orientation of the instrument. At each location at least one vantage point was established at the center or outside of plot. For some location multiple scans were acquired and reflective targets were used to combine the scans. The average resolution of the scan was no less than 2.5 cm at a 50 m plane. Simultaneously, GPS points were collected by using a surveying grade GPS Trimble Pro XR (Trimble Inc.). In some locations, because only one position was set up for scanning, some data information were lost due to self shadowing effect.
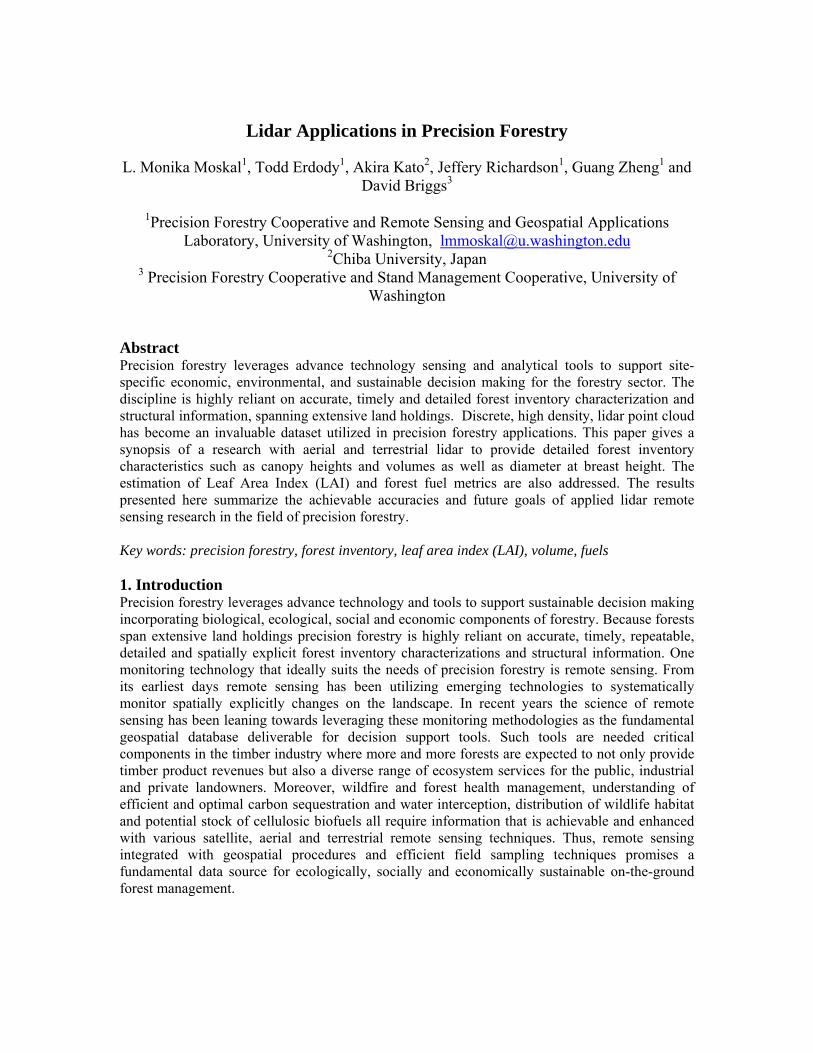
2.2 Analysis Similar to previous research (Andersen et al. 2006; Reutebuch et al. 2005; Lefsky et al. 2002; Popescu et al. 2002) our work relied on high quality surface and canopy height models, however, because the focus of this paper is on emergent techniques for aerial and terrestrial lidar applications in precision forestry, these and other widely known and used methods and results addressing canopy height will not be addressed here. The analysis focuses on forest inventory characterization of diameter at breast height (dbh) and canopy volume, two parameters rarely explored through remote sensing. Height of canopy fuels is addressed in the fuel metrics section. 2.2.1 Forest Inventory Characterization Dbh is one of the most important measurable parameter of a tree and serves as a basic and common parameter in tree allometry of basal area and volume estimation. Dbh has been widely measured not only in forest inventory, but also forest community ecology because the dbh distribution can provide valuable information about the stand structure, state of development, and in some extents the silvicultural method of forest stand management. In terms of the measurement of dbh aerial lidar is not suitable as the trunk is obscured by the crown from the sensor, however, terrestrial lidar is a suitable candidate for dbh measurement. Due to the side-scanning of terrestrial lidar and the shadow effect of tree itself, some information is missed during the process of scanning, which makes it hard to obtain the 360◦ horizontal view of a stem, thus, a slice at breast height is reconstructed to measure the dbh (Figure 1). Euclidean distance can be first calculated to predict the center point of the fittest circle to the point slice at breast height. The threshold is set up to exclude the outlier points and make sure that there are enough points to form a circle. The center point coordinates and radius can be used to generate the general equation. Pipe modeling can also achieve similar but continuous results for the trunk.
Figure 1. Forest inventory characterization from terrestrial lidar, including pipe modeling to
derive at dbh. Stem volume has been addressed in the past (Hyyppä et al. 2001), however, our approach at estimating canopy volume by wrapping the lidar data points with a mathematical envelope is achievable on aerial and terrestrial lidar, for single tree and stand canopies. The approach relies on radial basis functions (RBFs) which are an interpolation methods in three dimensional spaces, these methods can be applied to both aerial and terrestrial lidar data. General formula of RBFs is:
)()()(1
xxxxsN
ijii πλ +Φ= ∑
=
(1)
where )(xπ is a polynomial term for point is the Euclidian distance. 3ℜ∈x ji xxiλ is the weighting
coefficient. N is the number of initial points. The radial basis function used in this study is (linear) and is further described by Kato et al (in press). rr =Φ )(
For the purpose of wrapping we used fourth dimensional value to create a wrapping surface for the function of s(x). LIDAR data have three dimensional point locations; X, Y, and Z coordinates. The fourth dimension is a distance. The distance from any arbitrary point in the space to the closest point on the surface of tree crowns. The wrapped surface is then given by the set of points for which . For this study, the polynomial term of the equation (1) is zero, because resulting interpolated surface should go through all initial points.
0)( =xs
With only zero distance which is on the surface of tree crown, all coefficient iλ of the left hand side of the equation (1) are zero. We, therefore, generated additional points for the distance 1 and -1 and the total 3N points are used to solve the linear system. With the coefficients iλ given by 3N points, the distance of any arbitrary points in the space can be calculated the formula below: 3ℜ∈x
∑=
−=N
iii xxxs
3
1)( λ (2)
where x is any points in . This same approach can also be used to derive crown diameter and width in isolated trees.
3ℜ
2.2.2 Deriving Fire Fuel Metrics Canopy fuel metrics are needed as inputs to wildfire and smoke models but the raster layers for these metrics are too homogenous at coarse spatial resolutions. Lidar has been utilized for measuring various forest structure characteristics at high resolution. Canopy height (CH) is defined as the highest height at which the canopy fuel density within a stand is less than 0.012 kg/m³. Canopy base height (CBH) is defined as the lowest height at which the canopy fuel density within a stand is greater than 0.012 kg/m³. In terms of crown fire initiation CBH is the lowest height above the ground where there is enough canopy fuel to support a fire vertically through the canopy. Canopy bulk density (CBD) is defined as the maximum 5 ft running mean of canopy fuel density within a stand. In terms of crown fire initiation it is the mass per unit volume of canopy biomass that would burn in a crown fire (twigs and foliage <3mm diameter) (Reinhardt et al. 2002). Of the three, CBD is the most difficult to quantify due to multiple canopy layers (Perry et al. 2004) . One should also note that the term ‘canopy’ refers to the whole stand whereas ‘crown’ is a characteristic of an individual tree. Fuel metrics were extracted out of the field data using FuelCalc (Reinhardt et al. 2002). Regression models were built using R software. 2.2.3 Deriving LAI from Aerial Lidar The models examined by our research grouped into two categories: (1) methods based on simple biophysical measure of the trees such as canopy volume; and, (2) methods based on light extinction theory and Beer’s Law. Zheng and Moskal (2009) provide an extensive review of remote sensing LAI methods. The original methods mostly applied in our research can be found in (Lim et al, 2003; Riaño et al 2004; Morsdorf et al. 2006; Solberg et al. 2006).
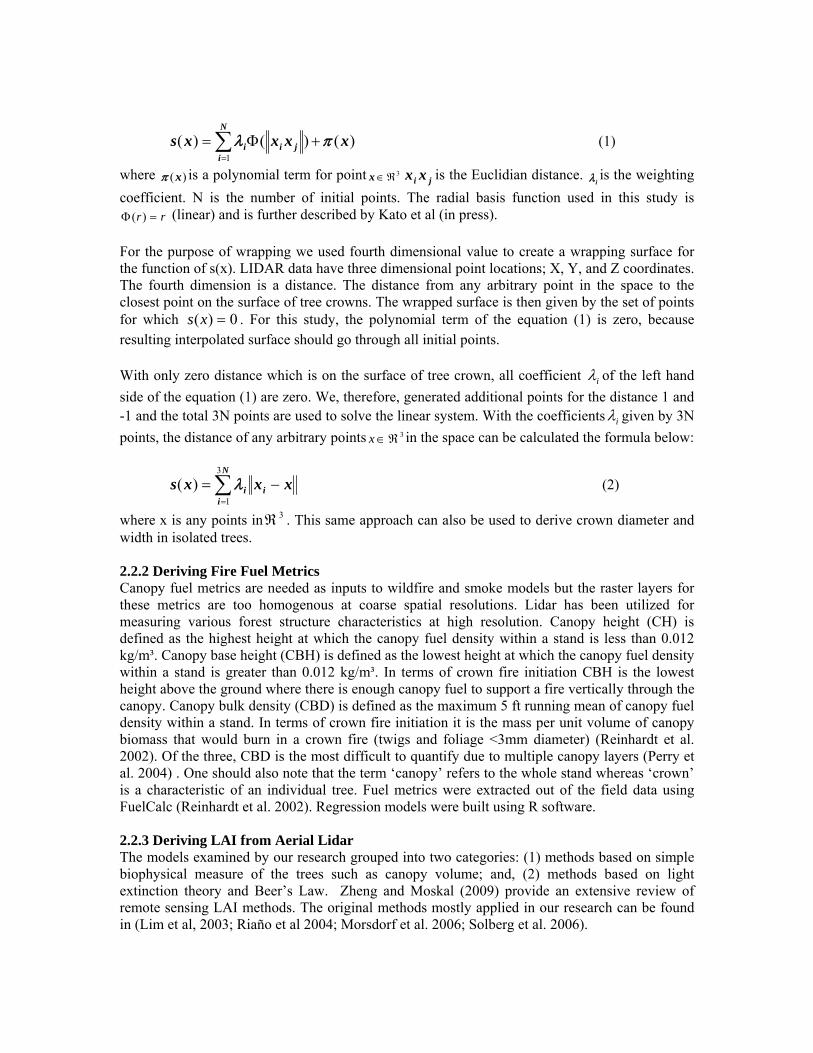
2.2.4 Deriving LAI from Terrestrial Lidar The non-random and complicated spatial and angular distribution of leaves within canopies requires one to obtain more details in order to retrieve the true LAI. In particular, terrestrial lidar makes it possible due to its high-density laser pulse returns. Based on the point cloud slicing algorithm in each slice plane, the dimension of each cell, which is a 3-D rectangular object, could be determined by the step (s) and threshold (t). After successfully slicing the point cloud data, the 3-D real space can be converted into the 2-D model space. Each voxel is coded with 1 if there is at least one point in that voxel and 0 if there is nothing in the cube. Empty voxels can be regarded as gaps within the canopy. In this work, the area of one side of rectangular cell was used to represent the area of partial leaf or plant surface area within the cube of intersected slice plane in Figure 2.
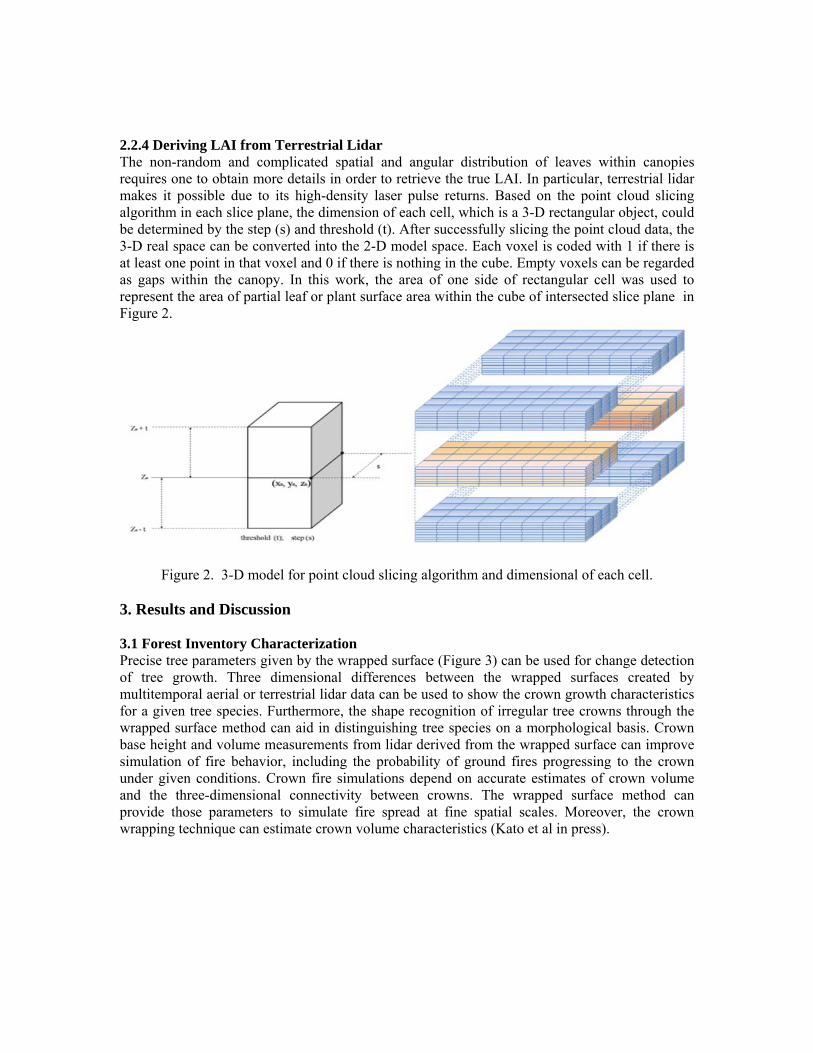
Figure 2. 3-D model for point cloud slicing algorithm and dimensional of each cell. 3. Results and Discussion 3.1 Forest Inventory Characterization Precise tree parameters given by the wrapped surface (Figure 3) can be used for change detection of tree growth. Three dimensional differences between the wrapped surfaces created by multitemporal aerial or terrestrial lidar data can be used to show the crown growth characteristics for a given tree species. Furthermore, the shape recognition of irregular tree crowns through the wrapped surface method can aid in distinguishing tree species on a morphological basis. Crown base height and volume measurements from lidar derived from the wrapped surface can improve simulation of fire behavior, including the probability of ground fires progressing to the crown under given conditions. Crown fire simulations depend on accurate estimates of crown volume and the three-dimensional connectivity between crowns. The wrapped surface method can provide those parameters to simulate fire spread at fine spatial scales. Moreover, the crown wrapping technique can estimate crown volume characteristics (Kato et al in press).
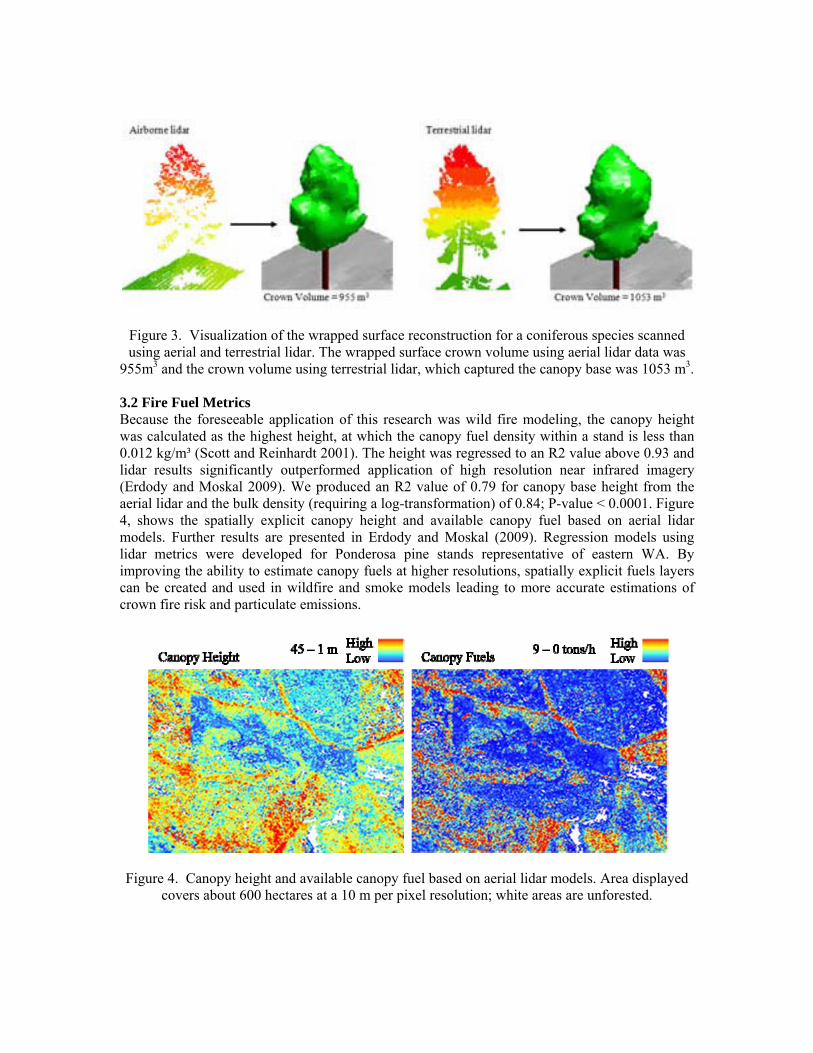
Figure 3. Visualization of the wrapped surface reconstruction for a coniferous species scanned using aerial and terrestrial lidar. The wrapped surface crown volume using aerial lidar data was
955m3 and the crown volume using terrestrial lidar, which captured the canopy base was 1053 m3. 3.2 Fire Fuel Metrics Because the foreseeable application of this research was wild fire modeling, the canopy height was calculated as the highest height, at which the canopy fuel density within a stand is less than 0.012 kg/m³ (Scott and Reinhardt 2001). The height was regressed to an R2 value above 0.93 and lidar results significantly outperformed application of high resolution near infrared imagery (Erdody and Moskal 2009). We produced an R2 value of 0.79 for canopy base height from the aerial lidar and the bulk density (requiring a log-transformation) of 0.84; P-value < 0.0001. Figure 4, shows the spatially explicit canopy height and available canopy fuel based on aerial lidar models. Further results are presented in Erdody and Moskal (2009). Regression models using lidar metrics were developed for Ponderosa pine stands representative of eastern WA. By improving the ability to estimate canopy fuels at higher resolutions, spatially explicit fuels layers can be created and used in wildfire and smoke models leading to more accurate estimations of crown fire risk and particulate emissions.
Figure 4. Canopy height and available canopy fuel based on aerial lidar models. Area displayed covers about 600 hectares at a 10 m per pixel resolution; white areas are unforested.
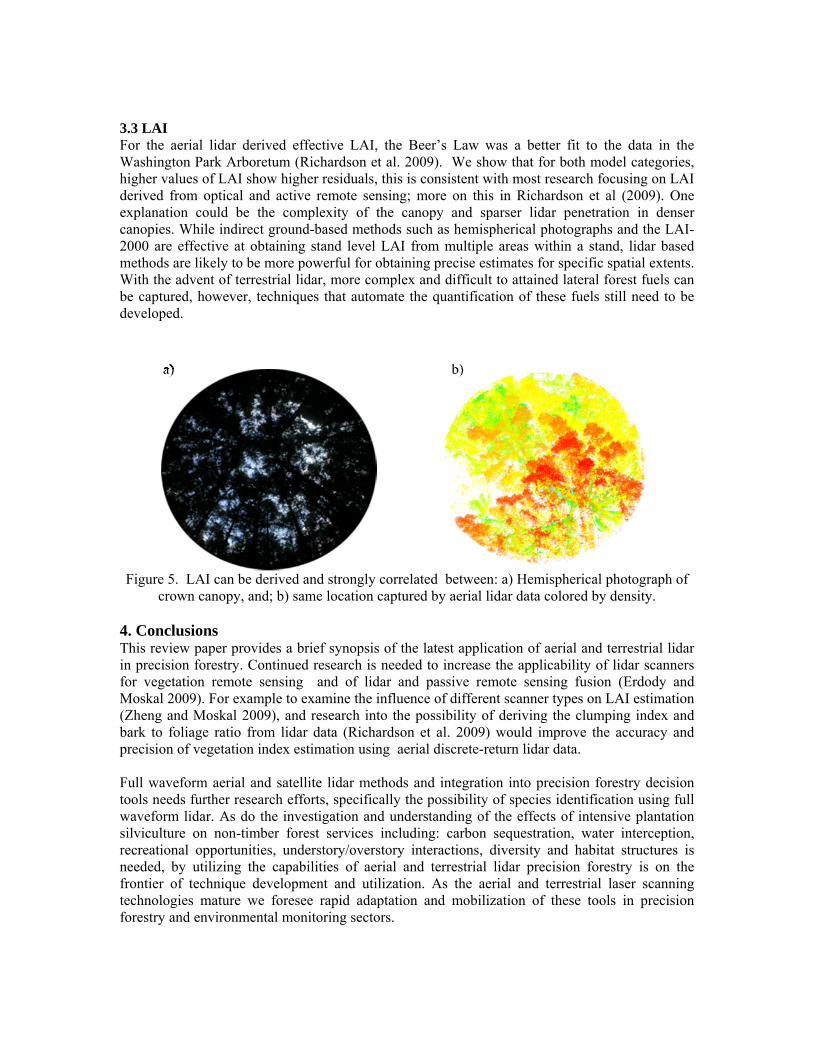
3.3 LAI For the aerial lidar derived effective LAI, the Beer’s Law was a better fit to the data in the Washington Park Arboretum (Richardson et al. 2009). We show that for both model categories, higher values of LAI show higher residuals, this is consistent with most research focusing on LAI derived from optical and active remote sensing; more on this in Richardson et al (2009). One explanation could be the complexity of the canopy and sparser lidar penetration in denser canopies. While indirect ground-based methods such as hemispherical photographs and the LAI-2000 are effective at obtaining stand level LAI from multiple areas within a stand, lidar based methods are likely to be more powerful for obtaining precise estimates for specific spatial extents. With the advent of terrestrial lidar, more complex and difficult to attained lateral forest fuels can be captured, however, techniques that automate the quantification of these fuels still need to be developed.
Figure 5. LAI can be derived and strongly correlated between: a) Hemispherical photograph of
crown canopy, and; b) same location captured by aerial lidar data colored by density. 4. Conclusions This review paper provides a brief synopsis of the latest application of aerial and terrestrial lidar in precision forestry. Continued research is needed to increase the applicability of lidar scanners for vegetation remote sensing and of lidar and passive remote sensing fusion (Erdody and Moskal 2009). For example to examine the influence of different scanner types on LAI estimation (Zheng and Moskal 2009), and research into the possibility of deriving the clumping index and bark to foliage ratio from lidar data (Richardson et al. 2009) would improve the accuracy and precision of vegetation index estimation using aerial discrete-return lidar data. Full waveform aerial and satellite lidar methods and integration into precision forestry decision tools needs further research efforts, specifically the possibility of species identification using full waveform lidar. As do the investigation and understanding of the effects of intensive plantation silviculture on non-timber forest services including: carbon sequestration, water interception, recreational opportunities, understory/overstory interactions, diversity and habitat structures is needed, by utilizing the capabilities of aerial and terrestrial lidar precision forestry is on the frontier of technique development and utilization. As the aerial and terrestrial laser scanning technologies mature we foresee rapid adaptation and mobilization of these tools in precision forestry and environmental monitoring sectors.
Acknowledgments We wish to acknowledge the Byron & Alice Lockwood Fellowship, Corkery Family Chair, Environmental Protection Agency's Science to Achieve Results (STAR) program, Washington Department of Natural Resources, Pacific Northwest Forest Service Station, Pack Forest Centre for Sustainable Forestry, Terrapoint USA, ImageTree Corporation, U.S., as well as many other students, faculty and industry partners affiliated with the Precision Forestry Cooperative at the University of Washington. References Andersen, H.; Reutebuch, S.E.; McGaughey, R.J, 2006. A rigorous assessment of tree height
measurements obtained using airborne lidar and conventional field methods. Canadian Journal of Remote Sensing. 32(5): 355-366.
Brantberg, T. 2007. Classifying individual tree species under leaf-off and leaf-on conditions using airborne lidar. ISPRS Journal of Photogrammetry and Remote Sensing, 61(5), 325-340.
Briggs, D.G. R. Kantavichai, E.C. Turnblom, 2008. Effect of pre-commercial thinning followed by a fertilization regime on branch diameter in coastal Douglas-fir plantations. Can. J. For. Res. 38:1564-1575.
Erdody, T.L. and L .M. Moskal, 2009. Fusion of lidar and Imagery for Estimating Canopy Fuel Metrics in Eastern Washington Forests, American Society for Photogrammetry & Remote Sensing 2009 Annual Conference, Baltimore, MD, March 2009.
Hyyppä, J., O. Kelle, M. Lehikoinen, and M. Inkinen, 200. A segmentation-based method to retrieve stem volume estimates from 3-D tree height models produced by laser scanners. IEEE Transactions on Geosceince and Remote Sensing, 39(5), 969-975.
Kato, A. Moskal L.M., Schiess, P. Swanson, M., Calhoun, D. and W. Stuetzle, in press. Capturing Tree Crown Formation through Implicit Surface Reconstruction using Airborne lidar Data, Remote Sensing of Environment.
Kim, S, R. McGaughey, H. Andersen and G. Schreuder, in press. Tree Species Differentiation using Intensity Data derived from Leaf-on and Leaf-off Airborne Laser Scanner Data, Remote Sensing of Environment.
Lefsky, M.A., Cohen, W.B., Parker, G.G. and Harding, D.J., 2002. lidar remote sensing for ecosystem studies. Bioscience, 52(1): 19-30.
Lim, K., Treitz, P., Baldwin, K., Morrison, I. and Green, J., 2003. lidar remote sensing of biophysical properties of tolerant northern hardwood forests. Canadian Journal of Remote Sensing, 29(5): 658-678.
McGaughey, R.J., 2004. Stand Visualization System, Version 3.3. USDA Forest Service, Pacific Northwest Research Station, Portland, OR. McGaughey, R.J., 2007. FUSION/LDV: software for LIDAR data analysis and visualization.
USDA Forest Service, Pacific Northwest Research Station, pp. 28-30. Morsdorf, F., Kotz, B., Meier, E., Itten, K.I. and Allgower, B., 2006. Estimation of LAI and
fractional cover from small footprint airborne laser scanning data based on gap fraction. Remote Sensing of Environment, 104(1): 50-61.
Moskal, L. M. and A. Kato, 2008. lidar tree Crown Segmentation. Proceedings of the 2008 annual American Society for Photogrammetry and Remote Sensing meeting in Portland OR, April-May 2008.
Moskal, L.M., M.D. Dunbar, M.E. Jakubauskas, 2004. Visualizing the forest: a forest inventory characterization in the Yellowstone National Park based on geostatistical models, in A
Message From the Tatras: Geographical Information Systems and Remote Sensing in Mountain Environmental Research, Widacki, W., Bytnerowicz, A. and Riebau, A. (eds). Institute of Geography and Spatial Management of the Jagiellonian University in Krakow and the USDA Forest Service: 219-232.
Murphy, G.E., 2008. Determining stand value and log product yields using terrestrial lidar and optimal bucking: a case study. Journal of Forestry 106(6): 317-324.
Mutlu, M., S.C. Popescu, C. Stripling, and T. Spencer, 2008. Assessing surface fuel models using lidar and multispectral data fusion. Remote Sensing of Environment 112(1): 274-285.
Perry, D., H. Jing, A. Youngblood, and D. Oetter, 2004. Forest structure and fire susceptibility in volcanic landscapes of the eastern High Cascades, Oregon. Conservation Biology 18:913–926.
Popescu, S. C., R. H. Wynne, and R.F.Nelson, 2002. Estimating plot-level tree heights with lidar: local filtering with a canopy-height based variable window size. Computers and Electronics in Agriculture, 37, 71-95.
Popescu, S. C., Wynne, R. H., & J. A. Scrivani, 2004. Fusion of small footprint lidar and multispectral data to estimate plot-level volume and biomass in deciduous and pine forests in Virginia, U.S.A. Forest Science 50(4), 551-565.
Reinhardt, E. D., R. E. Keane, and J. K. Brown, 2002. First order fire effects model: FOFEM 4.0, user’s guide. General technical report INT-GTR-344 (updated to Windows version 5.0). U.S. Department of Agriculture Forest Service Intermountain Research Station, Ogden, Utah.
Reutebuch, S.E. H.E Andersen, R.J. McGaughey, 2005. Light detection and ranging (LIDAR): An emerging tool for multiple resource inventory. Jour. For. Sept. pp 286-292.
Riaño, D., Valladares, F., Condes, S. and Chuvieco, E., 2004. Estimation of leaf area index and covered ground from airborne laser scanner (lidar) in two contrasting forests. Agricultural and Forest Meteorology, 124(3-4): 269-275.
Richardson, J., Moskal, L. M. and S. Kim, 2009. Modeling Approaches to Estimate Effective Leaf Area Index from Aerial Discrete-Return LIDAR, Agricultural and Forest Meteorology 149, 1152-1160.
Solberg, S., Naesset, E., Hanssen, K.H. and Christiansen, E., 2006. Mapping defoliation during a severe insect attack on Scots pine using airborne laser scanning. Remote Sensing of Environment, 102(3-4): 364-376.
Vose, J.M. and H.L. Allen, 1988. Leaf area, stemwood growth and nutrient relationships in loblolly pine. For. Sci. 34:547-563.
Zheng G. and L. M. Moskal, 2009. Retrieving Leaf Area Index (LAI) Using Remote Sensing: Theories, Methods and Sensors. Sensors; 9(4):2719-2745.