lidar-incorporated traffic sign detection from … · lidar-incorporated traffic sign detection...
TRANSCRIPT

LIDAR-INCORPORATED TRAFFIC SIGN DETECTION FROM VIDEO LOG IMAGESOF MOBILE MAPPING SYSTEM
Y. Lia , J.Fana, Y. Huanga,∗, Z. Chena
a School of Remote Sensing and Information Engineering, Wuhan University, 129 Luoyu Rd,Wuhan, China, 430079 -
(Liying1273, hycwhu, zychen)@whu.edu.cn,[email protected]
Commission I, WG I/Va
KEY WORDS: Traffic Sign Detection, Mobile Mapping System, RANSAC, Random Forest, Camshift, Kalman Filtering
ABSTRACT:
Mobile Mapping System (MMS) simultaneously collects the Lidar points and video log images in a scenario with the laser profiler anddigital camera. Besides the textural details of video log images, it also captures the 3D geometric shape of point cloud. It is widelyused to survey the street view and roadside transportation infrastructure, such as traffic sign, guardrail, etc., in many transportationagencies. Although many literature on traffic sign detection are available, they only focus on either Lidar or imagery data of traffic sign.Based on the well-calibrated extrinsic parameters of MMS, 3D Lidar points are, the first time, incorporated into 2D video log imagesto enhance the detection of traffic sign both physically and visually. Based on the local elevation, the 3D pavement area is first located.Within a certain distance and height of the pavement, points of the overhead and roadside traffic signs can be obtained according to thesetup specification of traffic signs in different transportation agencies. The 3D candidate planes of traffic signs are then fitted using theRANSAC plane-fitting of those points. By projecting the candidate planes onto the image, Regions of Interest (ROIs) of traffic signs arefound physically with the geometric constraints between laser profiling and camera imaging. The Random forest learning of the visualcolor and shape features of traffic signs is adopted to validate the sign ROIs from the video log images. The sequential occurrence of atraffic sign among consecutive video log images are defined by the geometric constraint of the imaging geometry and GPS movement.Candidate ROIs are predicted in this temporal context to double-check the salient traffic sign among video log images. The proposedalgorithm is tested on a diverse set of scenarios on the interstate highway G-4 near Beijing, China under varying lighting conditionsand occlusions. Experimental results show the proposed algorithm enhances the rate of detecting traffic signs with the incorporation ofthe 3D planar constraint of their Lidar points. It is promising for the robust and large-scale survey of most transportation infrastructurewith the application of MMS.
1. INTRODUCTION
The improvement of Intelligent Transportation System is not on-ly beneficial to our daily transportation but also gathering moreintelligence in predicting the possible risk of driving. Traffic signplays a significant role in regulating and controlling traffic ac-tivities, and ensures a safe and smooth traffic. The accurate de-tection and localization information of traffic signs are necessaryfor many intelligent transportation-related applications, like thosesystems of autonomous driving and driver assistance. As a result,automated traffic sign detection and recognition techniques arecrucial for the transportation agencies to update the traffic signinventory timely, and to improve the traffic quality and safetyquickly.
Traditionally, most of the traffic sign detections are based on tex-tual and color details of video log images. But only images canhardly achieve precise detection results. It is challenging to copewith the complex texture and color corruption in the urban envi-ronment. With the laser profiler and digital camera, mobile map-ping system (MMS) provides an effective way for acquiring verydense point clouds as well as road video log images in a scenari-o. Mobile laser scanning (MLS) has proven to be very efficientin acquiring very dense point clouds (over 800 points per squaremeter) along road corridors. Integrated in a mobile mapping sys-tem, the data acquired by laser scanners can be used to robustlycapture the geometry of the road environment and be the basis forthe recognition of a wide range of objects.∗Corresponding author
Traffic sign detection can be classified into color-based, shape-based, or both. Different color spaces have been used, for in-stance, HSI-HSV (Fleyeh, 2006, Gomez-Moreno et al., 2010),YUV (Shadeed et al., 2003) or Gaussian color model (Li et al.,2015) as a visual feature to define a traffic sign region. Shapefeatures have also been studied, such as Hough Transform (Bar-rile et al., 2008), Local Contour Pattern (Landesa-Vazquez et al.,2010), or Local Binary Patterns (Liu et al., 2014). There are manyintense efforts in computer vision (Heng et al., 2011, Crandall etal., 2011, Heng et al., 2011) focus on image-based 3D reconstruc-tion at large-scale internet imagery. For example, image-based3D point clouds and semantic texton forests are used to segmen-t and recognize the highway assets(Golparvar-Fard et al., 2012).The color-coded point clouds and the geo-registered video framesare integrated together which enables a user to conduct visualwalk through and query different categories of assets. Semantictexton forests and SVM (Support Vector Machine), proposed by(Golparvar-Fard et al., 2012, Yang et al., 2015) are used to rec-ognize the traffic signs. (Riveiro et al., 2015) is focused on thedetection and classification of retro-reflective vertical traffic sign-s for their function (danger, give way, prohibition/obligation, andindication) from mobile laser scanning data by considering ge-ometric and radiometric information. (Yu et al., 2016) achieverecognition task by using Gaussian-Bernoulli deep Boltzmannmachine-based hierarchical classifier on 2-D images. They fo-cus on the detection of vertical traffic signs in 3D point cloudsacquired by a LYNX Mobile Mapper system, comprised of laserscanning and RGB cameras (Soiln et al., 2016).
The International Archives of the Photogrammetry, Remote Sensing and Spatial Information Sciences, Volume XLI-B1, 2016 XXIII ISPRS Congress, 12–19 July 2016, Prague, Czech Republic
This contribution has been peer-reviewed. doi:10.5194/isprsarchives-XLI-B1-661-2016
661

However, to take full advantage of using MMS, they must beused in optimal applications. Unlike other literatures, the 3Dpoint cloud will play a special role in traffic sign detection. Inthis study, we focus on the detection and tracking of traffic signsusing 3D Lidar points and 2D video log images by consideringthe imaging geometry and GPS movement. The global strategyfor detection and tracking by filtering the noise point through set-ting distance and elevation thresholds, the rough area of trafficsign can be obtained. Then we project the candidate planes fit-ted by RANSAC onto the image, regions of Interest (ROIs) oftraffic signs are localized in the video log images. At this stage,Random Forest is adopted to detect the traffic signs among theseROIs. Finally, a tracking algorithm is proposed to analyze thistemporal context by combining the Camshift and Kalman filter-ing together.
2. TRAFFIC SIGN LOCALIZATION
The proposed traffic sign detection algorithm first focuses on us-ing the distance and elevation information to segment the trafficsigns from the point cloud. By filtering the noise point throughsetting distance and elevation thresholds, the rough area of trafficsign can be obtained. Then we project the candidate planes fittedby RANSAC onto the image, regions of Interest (ROIs) of trafficsigns are localized in the video log images.
2.1 Pre-processing
We need to handle laser point clouds to reduce the amounts ofdata to process or it will be time-consuming. The 3D data we ac-quire includes pavements, traffic signs, buildings, billboards, it isimportant to extract the local interest information instead of thewhole data. Those points consist mainly of two types: one is onthe ground such as traffic signs, billboards, trees and guardrail-s; the other is ground segments like pavements, lane markings.Considering the data of each photo contains the trajectory po-sition of the vehicle, the range containing the road as well asthe traffic sign can be located temporally from a large scenari-o. Within a certain distance and height of the pavement boundaryand plane respectively, points of the overhead and roadside traf-fic signs can then be obtained through the setup specification oftraffic signs.
Since the point cloud data contains huge information and involvesin thousands of pictures like Figure.3(a), we need to set valuesfor distance and elevation to obtain necessary points for singleimage. The classification starts with the distance from the 3Dpoints to the sensor is computed, and points further than 20 me-ters are filtered out. At this case, it is obvious that the remainingpoints contain a set of points that belong to traffic signs, but theystill include points on the floor, on lane markings and on near-by buildings, as Figure.3(b) Among the whole points, traffic signpoints are mostly in higher altitude compared to other belong-ings. According to the Chinese road traffic laws, the traffic signis placed on the edge of the road shoulder, and its height is 2 to2.5 meter away from the road. We reserve those points whoseelevation is 1.8 meters higher than the average, the general roadplane’s height. As we can see from the Figure.1(c), only the in-formation of the traffic sign where the MMS is traveling will bekept for further processing.
2.2 RANSAC
After the first pre-processing step, the remaining point cloudscontain mainly the road sign. The 3D candidate planes of traf-fic signs are then fitted using the RANSAC plane-fitting strategy
(a)
(b) (c)
Figure 1: Different results after pre-processing. (a) Original pointclouds; (b) The remaining points after certain distance is set;(c)Only the points around the traffic sign is reserved.
among those points.
The RANSAC algorithm is a learning technique to estimate pa-rameters of a mathematical model from a set of observed datacontains both inliers and outliers. Inliers can be explained by amodel with a particular set of parameter values, while outliersdo not fit that model in any circumstance. The voting schemeis used in RANSAC to find the optimal fitting result. The im-plementation of this voting scheme is based on two assumptions:the entire data we are observing consists of both inliers and out-liers, and a process which can optimally estimate the availableparameters of the chosen model from the inliers. The input to theRANSAC algorithm is a set of observed data values includingpoint clouds produced from previous step, a way of fitting somekind of model to the observations, and some confidence param-eters. The RANSAC algorithm is essentially composed of twosteps that are iteratively repeated:
• Firstly, a sample subset containing minimal data items israndomly selected from the input dataset. We can get thefitting model and the corresponding model parameters bycomputing the elements of this sample subset. The cardinal-ity of the sample subset is the smallest sufficient to deter-mine the model parameters.
• Secondly, for all the points in our data, the distance to thefitting model is computed. A data element will be consid-ered as an outlier if its distance is larger than the thresholdwe set before the procedure.
The set of inliers obtained for the fitting model is called consen-sus set. This procedure is repeated a fixed number of times, eachtime producing either a model which is rejected because too fewpoints are part of the consensus set, or a refined model togeth-er with a corresponding consensus set size. In the latter case, wekeep the refined model if its consensus set is larger than the previ-ously saved model. The estimated model which contains the mostinliers is considered as the optimal model, final figure is shownas Figure.2.
The International Archives of the Photogrammetry, Remote Sensing and Spatial Information Sciences, Volume XLI-B1, 2016 XXIII ISPRS Congress, 12–19 July 2016, Prague, Czech Republic
This contribution has been peer-reviewed. doi:10.5194/isprsarchives-XLI-B1-661-2016
662

An advantage of RANSAC is its ability to estimate the modelparameters robustly. But, RANSAC can only do the estimationof the parameter model we want for a particular data set, i.e. ifthe data contains traffic sign and greenbelts, the plane fitted byRANSAC may fail to find either one.
Figure 2: The plane result fitted by RANSAC.
2.3 Projection
During the third phase of our procedure, the projection of trafficsigns plane is accomplished by using co-linearity equation, viashooting rays from the image to the 3D geometry. Traditionalroad sign detection is carried out using 2D image only, this maywould not guarantee high accuracy. Also, the spatial resolutionof a point cloud is not enough to recognize traffic sign. The bestsource of information that the MMS provides for the recogni-tion task are RGB cameras, whose internal calibration and exter-nal orientation parameters with respect to the vehicle are known.The relative registration between laser point clouds and array C-CD images is achieved by using POS data and relative positionof each sensor.
Let x,y refer to a coordinate system with the x-axis and y-axisin the sensor plane. Denote the coordinates of the point P on theobject by xp, yp, zp, the coordinates of the image point of P onthe sensor plane by x and y and the coordinates of the projection(optical) center by x0, y0, z0. As a consequence of the projectionmethod there is the same fixed ratio between x−x0 and x0−xp, y − y0 and y0 − yp the distance of the projection center to thesensor plane z0 = c and zp − z0 . Hence:
x− x0 = −λ(xp − x0) (1)
y − y0 = −λ(yp − y0) (2)
c = λ(zp − z0) (3)
Solving for λ in the last equation and entering it in the othersyields:
x− x0 = −cxp − x0zp − z0
(4)
y − y0 = −cyp − y0zp − z0
(5)
The point P is normally given in some coordinate system ”out-side” the camera by the coordinates X , Y and Z, and the pro-jection center by X0, Y0, Z0. These coordinates may be trans-formed through a rotation and a translation to the system on thecamera. The translation doesn’t influence the differences of thecoordinates, and the rotation, often called camera transformation,is given by a 3×3-matrixR, transforming (X−X0, Y −Y0, Z−
(a) (b)
Figure 3: Projection result.
Z0)into:
xp−x0 = R11(X −X0)+R21(Y −Y0)+R31(Z −Z0) (6)
yp− y0 = R12(X −X0) +R22(Y − Y0) +R32(Z −Z0) (7)
and
zp − z0 = R13(X −X0) +R23(Y − Y0) +R33(Z −Z0) (8)
Substitution of these expressions, leads to a set of two equations,known as the collinearity equations:
x− x0 = −cR11(X −X0) +R21(Y − Y0) +R31(Z − Z0)
R13(X −X0) +R23(Y − Y0) +R33(Z − Z0)(9)
y − y0 = −cR12(X −X0) +R22(Y − Y0) +R32(Z − Z0)
R13(X −X0) +R23(Y − Y0) +R33(Z − Z0)(10)
The most obvious use of these equations is for images recordedby a camera. The projection process can be described by transfor-mations from object space (X,Y, Z) to image coordinates (x, y).It indicates that the image point (on the sensor plate of the cam-era), the observed point (on the object) and the projection centerof the camera were aligned when the picture was taken. Afterprojection, the candidate region is located shown as Figure.3(b)
3. TRAFFIC SIGN DETECTION
By projecting the candidate planes onto the image, Regions ofInterest (ROIs) of traffic signs are found physically with the ge-ometric constraints between laser profiling and camera imaging.At this stage, Random Forest is adopted to detect the traffic signsamong these ROIs.
Based on the blob feature of (Vicen-Bueno et al., 2005), a blobof 24*24 pixels for each component(R, G, and B) of each ROIof the video log image is sent to random forest classifier. Thetotal dimension of the input vector is 51 nodes. They consists of3 normalized average maximum pixel values, MR, MG and MB,24 inputs from the vertical histogram (vh) and 24 inputs from thehorizontal histogram(hh).
Random forests, introduced by Breiman and Cutler (Breiman,2001), are an ensemble learning method for classification. It isoperated by constructing a multiple of decision trees at trainingtime and outputting the class. Each tree in the ensemble is builtfrom a random sample of the original data with replacement fromthe original training data. The main steps of random forest are asfollows:
• Take a subset from the whole set of data (training set).
• The algorithm clusters the data in groups and subgroups. Ifyou would draw lines between the data points in a subgroup,
The International Archives of the Photogrammetry, Remote Sensing and Spatial Information Sciences, Volume XLI-B1, 2016 XXIII ISPRS Congress, 12–19 July 2016, Prague, Czech Republic
This contribution has been peer-reviewed. doi:10.5194/isprsarchives-XLI-B1-661-2016
663

and lines that connect subgroups into group etc. the struc-ture would look somewhat like a tree. This is called a deci-sion tree. At each split or node in this cluster/tree/dendrogramvariables are chosen at random by the program to judgewhether data points have a close relationship or not.
• The program makes multiple trees a.k.a. a forest. Each treeis different because for each split in a tree, variables are cho-sen at random.
• Then the rest of the dataset (not the training set) is used topredict which tree in the forests makes the best classificationof the data points (in the dataset the right classification isknown).
• The tree with the most predictive power is shown as outputby the algorithm.
The random forests achieve state-of-the-art performance in manymulti-class classification applications. A further advantage is thatthey are fast to build, easy to implement in a distributed comput-ing environment
4. TRAFFIC SIGN TRACKING
The sequential occurrence of a traffic sign among consecutivevideo log images are defined by the geometric constraint of theimaging geometry and GPS movement. Candidate ROIs are ana-lyzed in this temporal context to double-check the salient trafficsign among video log images. In this section, a tracking algo-rithm is proposed to analyze this temporal context by combiningthe Camshift and Kalman filtering together. Camshift can trackthe moving objects quickly and robustly, using the color charac-teristics. Kalman filtering can predict the most probable objectlocation in the next frame according to the geometric constraintsand the updated observations in the current frame.
4.1 Camshift
The Camshaft algorithm is based on the color probability distri-bution of the target, so the changes of the object shape would notaffect the result. By calculating similarity of the color probabilitydistribution, the moving target in the current frame image locationis taken as the initial location of the next frame. Its core algorithmis the Meanshift algorithm, a probability density estimation basedon rapid non-parametric pattern. Meanshift looks for the maximaof a density function and Camshift is the extension of it. The flowof the algorithm is as follows:
1. Set the size of the search window(s) in the color probabilitydistribution.
2. Calculate the zero moments:
M00 =∑x
∑y
I(x, y) (11)
M01 =∑x
∑y
yI(x, y) (12)
M10 =∑x
∑y
xI(x, y) (13)
Where, I(x, y) is the image element value of coordinates(x, y), and x and y change in the scope of the search win-dow.
3. Calculate the center of mass for the search window (Xc, Yc):
xc =M10
M00, yc =
M01
M00(14)
4. The size of the search window that is the function of a colorprobability distribution of the former search window can bere-installed as s.
5. Repeat steps 2, 3, 4 until they are constringent (the changeof the center of mass is less than the threshold value).
6. The major axis l, minor axis w and direction angle of thetarget can be obtained by calculating the second-order ma-trix.
M11 =∑x
∑y
xyI(x, y) (15)
M20 =∑x
∑y
x2I(x, y) (16)
M02 =∑x
∑y
y2I(x, y) (17)
l =
√(a+ c) +
√b2 + (a− c)2
2(18)
w =
√(a+ c)−
√b2 + (a− c)2
2(19)
θ =1
2arctan(
2b
a− c ) (20)
Where
a =M20
M00− xc2, b = 2(
M20
M00− xcyc), c =
M02
M00− yc2
(21)
Following the aforementioned procedures yields a window whichis very likely to contain the original target. However, if the occlu-sion or large-scale similar color interference occur during track-ing process, Camshift algorithm will fail. In order to deal withsuch problem, we improves the Camshift algorithm in two ways:background subtraction algorithm and kalman algorithm.
4.2 Kalman filter
Before we do Camshift method, we need to judge the effects ofbackground to the tracking. If the background color is too sim-ilar to the object, we need to use background subtraction first.It is a motion detection algorithm begins with the segmentationpart where foreground or moving objects are segmented from thebackground. The simplest way to implement this is to take theprevious image as background and take the current frames, de-noted by I to compare with the background image denoted by B.Here using simple arithmetic calculations, we can segment outthe objects simply by using image subtraction technique of com-puter vision meaning for each pixels in I, take the pixel valuedenoted by P [I] and subtract it with the corresponding pixels atthe same position on the background image denoted as P [B].
P [F ] = P [I]− P [B], (22)
Where the difference image denoted as P[F], which would onlyshow some intensity for the pixel locations which have changedbetween the two frames. Then the difference image will be sent toCamshift procedure for further processing. After that, the kalmanfilter is adopted here to estimate the parameters of the moving
The International Archives of the Photogrammetry, Remote Sensing and Spatial Information Sciences, Volume XLI-B1, 2016 XXIII ISPRS Congress, 12–19 July 2016, Prague, Czech Republic
This contribution has been peer-reviewed. doi:10.5194/isprsarchives-XLI-B1-661-2016
664

targets. The key of kalman filter is prediction and update. Thestate vector Xk = [x, y, Vx, Vy], measurement vector is Yk =[x, y]T , Where x and Vx are the target image in the horizontaldirection of the position and velocity; y and Vy are the targetimage in the vertical position and velocity. The state equation ofthe system is (23), and observation equation is (24).
Xk+1 = AkXk +Wk (23)
Yk+1 = HkXk + Vk (24)
Where Ak is state transition matrix. Yk is measurement state ofsystem. Hk is observation matrix. Wk is dynamic noise cor-responding to state vector, and Vk is measurement noise corre-sponding to observation vector. The equation of prediction andupdate are as follows:
Prediction-equation1:
Xk′ = F ∗Xk−1 (25)
Prediction-equation2:
Pk′ = F ·Pk−1·FT +Q (26)
Kalman-gain-equation:
Kk′ = Pk
′·HT ·(H·Pk′·HT +R)−1 (27)
Update-equation1:
Xk = Xk′ +Kk·(Zk −H·Xk
′) (28)
Update-equation2:
Pk = Pk′ −Kk·H·Pk
′ (29)
where F is state transition matrix , H is measurement matrix,Q represents process noise covariance matrix and measurementnoise covariance matrix is R.
The main steps are as follows:
• Whether the background color is similar to the object, if itis, we do background subtraction first.
• Initialize a search window.
• Search the target using CamShift algorithm in the estimatedrange to locate the possible position of target.
• Estimate the appearing position of target in the next momentby Kalman filter.
• If the diatance of Camshift predicted center and kalmanscenter is in the threshold, the search is seen as a success,and the observed value of Kalman filter will be regarded asthe next window position.
5. EXPERIMENTAL RESULTS
In this section, the proposed algorithm is tested for the accuracyof traffic sign detection using the video log images and 3D pointcloud of the MMS. The data is captured on May 19th 2013 inNingbo, China and provided by Leador Spatial company. All thedetection and tracking methods are programmed with VS2010and are executed on a PC of 2.3GHz Pentium 4 with 6GB RAMwith the Windows 64 bits operating system. The size of videoimage is 2448 × 2048.
The experiments demonstrated the detection and tracking of thetraffic sign. For most traffic sign which only appears in few im-ages, we project our 3D point cloud onto the first image involv-ing the traffic sign. After projecting the fitted planes onto theimage, regions of interest of traffic signs are localized in the im-age. Then we use random forest to detect our traffic sign, thealgorithm obtained a higher accuracy than traditional methods,which improves our detection efficiency quickly. Then we ini-tialize the search window for tracking according to the ROIs. Thebackground of the video log image is similar to what we need totrack, thus the search window we set is larger than ROIs but sharethe same center. By using Camshift and Kalman filter, our track-ing outputs are shown as Figure 4. In most cases, we can trackthe object successfully. One reason is the well-fused 3D pointcloud with the video log image, through which we can narrow thesearch region in our images and eliminate the noise interferenceeffectively. Besides, the RANSAC algorithm helps us screeningout some noise points by fitting a cluster of point into a plane of alimited tolerance. If we track the object on a consecutive imagessuccessfully, for instance, in the first four images, we can tack theobject in three or more images, a conclusion can be made that wedefinitely detect a traffic sign.
However, when traffic signs are mixed up together with trees, ourpre-processing sometimes may fail to localize the traffic sign, asshown in Figure.5. The traffic sign sits in the bush, our RANSACfitting of planes can not achieve high accuracy with the distur-bance of those points of trees, as shown in Figure.6. The con-trast between our traffic sign and background becomes low inFigure.7, where we can’t predict the right position and track thesign timely, as shown in Figure.8.
Figure 5: The traffic sign sits in the bush.
Figure 6: The pre-processing result.
The International Archives of the Photogrammetry, Remote Sensing and Spatial Information Sciences, Volume XLI-B1, 2016 XXIII ISPRS Congress, 12–19 July 2016, Prague, Czech Republic
This contribution has been peer-reviewed. doi:10.5194/isprsarchives-XLI-B1-661-2016
665
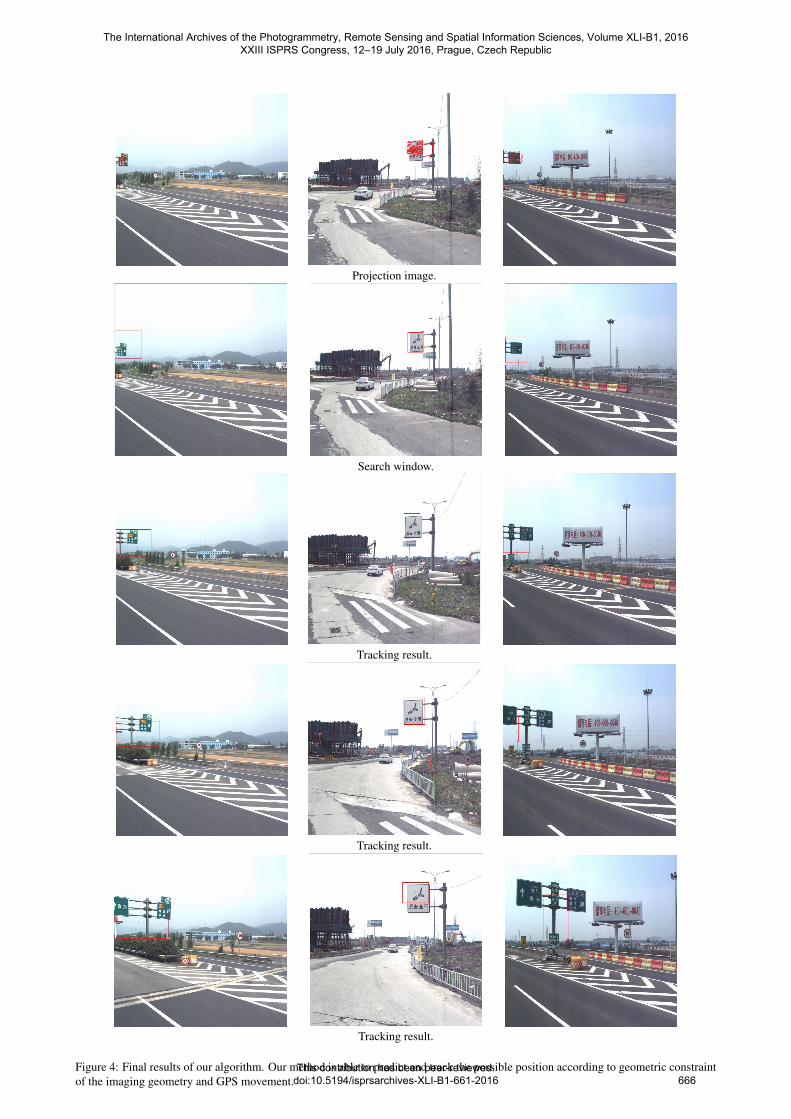
Projection image.
Search window.
Tracking result.
Tracking result.
Tracking result.
Figure 4: Final results of our algorithm. Our method is able to predict and track the possible position according to geometric constraintof the imaging geometry and GPS movement.
The International Archives of the Photogrammetry, Remote Sensing and Spatial Information Sciences, Volume XLI-B1, 2016 XXIII ISPRS Congress, 12–19 July 2016, Prague, Czech Republic
This contribution has been peer-reviewed. doi:10.5194/isprsarchives-XLI-B1-661-2016
666

Figure 7: The background of the video log image is similar towhat we need to track.
Figure 8: The predicted position of the traffic sign is deviatedfrom the right position.
6. CONCLUSION AND RECOMMENDATIONS
Mobile Mapping System (MMS) collects the Lidar points by thelaser profiler, as well as the video log images in a scenario withthe digital camera. However, most literature focuses on the textu-ral/color details of video log images and the 3D geometric shapeof point cloud separately. In this paper, 3D Lidar points are in-corporated into 2D video log images to enhance the detection oftraffic sign both physically and visually. By filtering the noisepoint through setting distance and elevation thresholds, the rougharea of traffic sign can be obtained. Then we project the candi-date planes fitted by RANSAC onto the image , regions of Inter-est (ROIs) of traffic signs are localized and sent to random forestclassifier. Candidate ROIs will be tracked using the Camshift andKalman filter among consecutive video log images. The proposedalgorithm is tested on video logs with the size of 2448 × 2048.Experimental results show the proposed algorithm can not onlydetect traffic signs but also track the next possible occurrence ofcandidate ROIs. It is promising for automatic identification oftraffic signs.
Although the proposed algorithm demonstrates its capability fortraffic sign detection, we recommend that:
• Reduce interference of billboards using the rule, which is lo-cated regularly alongside the pavement and larger than mostroad signs.
• Increase the exposure in areas with poor weather conditions,which will refine the candidate ROIs in tracking the similarcolor.
• Innovative formulation and application of such process asCamshift and Kalman filter.
ACKNOWLEDGEMENTS
The authors are grateful for the support of the program of Low-cost GNSS / INS Deep-coupling System of Surveying and Map-ping (Program NO 2015AA124001), State Key Technology Re-search and Development Program (863), China.This work wasalso jointly supported by the National Natural Science Founda-tion of China (No. 41271431), and the science and technologyplan of sichuan bureau of surveying, mapping and geoinforma-tion(No. J2014ZC02).
REFERENCES
Barrile, V., Meduri, G. M. and Cuzzocrea, D., 2008. Automaticrecognition of road signs by hough transform. Journal of EarthScience & Engineering.
Breiman, L., 2001. Random forests. Machine learning 45(1),pp. 5–32.
Crandall, D., Owens, A., Snavely, N. and Huttenlocher, D., 2011.Discrete-continuous optimization for large-scale structure frommotion. In: IEEE Conference on Computer Vision & PatternRecognition, pp. 3001–3008.
Fleyeh, H., 2006. Shadow and highlight invariant colour segmen-tation algorithm for traffic signs. In: Cybernetics and IntelligentSystems, 2006 IEEE Conference on, pp. 1–7.
Golparvar-Fard, M., Balali, V. and Garza, J. M. D. L., 2012. Seg-mentation and recognition of highway assets using image-based3d point clouds and semantic texton forests. Journal of Comput-ing in Civil Engineering.
Gomez-Moreno, H., Maldonado-Bascon, S., Gil-Jimenez, P. andLafuente-Arroyo, S., 2010. Goal evaluation of segmentation al-gorithms for traffic sign recognition. IEEE Transactions on Intel-ligent Transportation Systems 11(4), pp. 917 – 930.
Heng, L., Lee, G. H., Fraundorfer, F. and Pollefeys, M., 2011.Real-time photo-realistic 3d mapping for micro aerial vehicles.In: IEEE/RSJ International Conference on Intelligent Robot-s & Systems IEEE/RSJ International Conference on IntelligentRobots & Systems, pp. 4012–4019.
Landesa-Vazquez, I., Parada-Loira, F. and Alba-Castro, J., 2010.Fast real-time multiclass traffic sign detection based on novelshape and texture descriptors. In: Conference Record - IEEEConference on Intelligent Transportation Systems, pp. 1388–1395.
Li, H., Sun, F., Liu, L. and Wang, L., 2015. A novel traffic signdetection method via color segmentation and robust shape match-ing. Neurocomputing 169, pp. 77–88.
Liu, C., Chang, F. and Chen, Z., 2014. Rapid multiclass trafficsign detection in high-resolution images. IEEE Transactions onIntelligent Transportation Systems 15(6), pp. 2394–2403.
Riveiro, B., Diaz-Vilarino, L., Conde-Carnero, B. and Soilan, M.,2015. Automatic segmentation and shape-based classification ofretro-reflective traffic signs from mobile lidar data. IEEE Jour-nal of Selected Topics in Applied Earth Observations & RemoteSensing pp. 1–9.
The International Archives of the Photogrammetry, Remote Sensing and Spatial Information Sciences, Volume XLI-B1, 2016 XXIII ISPRS Congress, 12–19 July 2016, Prague, Czech Republic
This contribution has been peer-reviewed. doi:10.5194/isprsarchives-XLI-B1-661-2016
667

Shadeed, W. G., Abu-Al-Nadi, D. I. and Mismar, M. J., 2003.Road traffic sign detection in color images. In: Electronics, Cir-cuits and Systems, 2003. ICECS 2003. Proceedings of the 200310th IEEE International Conference on, pp. 890 – 893 Vol.2.
Soiln, M., Riveiro, B., Martłnez-Snchez, J. and Arias, P., 2016.Traffic sign detection in mls acquired point clouds for geometricand image-based semantic inventory. Isprs Journal of Photogram-metry & Remote Sensing 114, pp. 92–101.
Vicen-Bueno, R., Gil-Pita, R., Jarabo-Amores, M. and Lopez-Ferreras, F., 2005. Complexity reduction in neural networks ap-plied to traffic sign recognition tasks. In: Signal Processing Con-ference, 2005 13th European, IEEE, pp. 1–4.
Yang, M., Gu, X., Lu, H., Wang, C. and Ye, L., 2015. Panorama-based multilane recognition for advanced navigation map gener-ation. Mathematical Problems in Engineering 2015, pp. 1–14.
Yu, Y., Li, J., Wen, C., Guan, H., Luo, H. and Wang, C., 2016.Bag-of-visual-phrases and hierarchical deep models for trafficsign detection and recognition in mobile laser scanning data. Is-prs Journal of Photogrammetry & Remote Sensing 113, pp. 106–123.
The International Archives of the Photogrammetry, Remote Sensing and Spatial Information Sciences, Volume XLI-B1, 2016 XXIII ISPRS Congress, 12–19 July 2016, Prague, Czech Republic
This contribution has been peer-reviewed. doi:10.5194/isprsarchives-XLI-B1-661-2016
668