life cycle assessment of perovskite solar cells and...
TRANSCRIPT

Life cycle assessment of perovskite solar
cells and comparison to silicon solar cells Master’s Thesis within the Sustainable Energy Systems programme
JONAS STASIULIONIS
Department of Energy and Environment
Division of Environmental Systems Analysis
CHALMERS UNIVERSITY OF TECHNOLOGY
Gothenburg, Sweden 2015
Report no. 2015:7

REPORT NO. 2015:7
Life cycle assessment of perovskite solar cells and
comparison to silicon solar cells
Master’s Thesis within the Sustainable Energy Systems programme
JONAS STASIULIONIS
SUPERVISOR(S):
Rickard Arvidsson
EXAMINER
Björn Sandén
Department of Energy and Environment
Division of Environmental Systems Analysis
CHALMERS UNIVERSITY OF TECHNOLOGY
Gothenburg, Sweden

Life cycle assessment of perovskite solar cells and comparison to silicon solar cells
Master’s Thesis within the Sustainable Energy Systems programme
JONAS STASIULIONIS
© JONAS STASIULIONIS, 2015
Report no. 2015:7
Department of Energy and Environment
Division of Environmental Systems Analysis
Chalmers University of Technology
SE-412 96 Gothenburg
Sweden
Telephone: + 46 (0)31-772 1000
Cover:
Sunlight shining through a solar cell incorporating a vapour-deposited perovskite
absorbing layer. Picture credit: Phys.org
Chalmers Reproservice
Gothenburg, Sweden
I
Life cycle assessment of perovskite solar cells and comparison to silicon solar cells
Master’s Thesis in the Sustainable Energy Systems programme
JONAS STASIULIONIS
Department of Energy and Environment
Division of Environmental Systems Analysis
Chalmers University of Technology
ABSTRACT
The solar energy field has grown vastly in the past decades, and this trend seems to
continue also in the future. But there is still a lot of work to be done in order to make
solar energy competitive to other energy production systems. Because of this, there is
constant research toward improving existing solar energy systems, and to find new
materials to lower the initial cost and increase efficiency of energy producing units.
Recently, a material called perovskite has received a lot of attention from the solar
industry by potentially offering a cheap and efficient material for solar cell production.
With efficiency increasing every year, this could potentially be the next dominant
design for solar energy extraction. One of the main concerns brought up related to this
new technology is the lead content of the perovskite solar cell. Because of the toxic
nature of lead, and the potential of these cells to be produced in large quantities in the
future, the possible impacts of lead to the environment have to be assessed.
This thesis consists of life cycle assessment of a perovskite solar cell and comparison
to the currently most used common solar cell, which is the silicon solar cell. Several
parameters were varied in the study in order to see which processes that have the largest
influence to the environmental performance.
From the study, it was found that perovskite solar cells could be competitive with
silicon solar cells from an environmental point of view if produced on a large scale.
Management of lead use and emissions during the production process of perovskite
cells had the largest impact on the results. If all of the lead used would be supplied from
recycling, and emissions of lead from the cell itself during and after the use phase is
completely prevented, perovskite cells show better environmental performance than
silicon cells. Regarding manufacturing technology, the study showed that the blade
coating technology is environmentally preferable over spin coating for large scale
production of perovskite cells.
Key words: Life cycle assessment (LCA), lead, toxicity, energy use, impact assessment

II
Acknowledgments I would like to take this opportunity to thank all who helped to conduct this master’s
thesis. Special thanks goes to supervisor Rickard Arvidsson for always insightful
comments and always finding time to help solving problems that arise with the study.
Thanks goes to examiner Björn Sanden who gave helpful and useful comments on the
study. Big thanks goes to Kari Sveinbjörnsson from Uppsala University, for providing
some crucial information on perovskite solar cells.
Jonas Stasiulionis
Gothenburg, June 2015
1
Contents
CONTENTS 1
ABBREVIATIONS 3
1 INTRODUCTION 5
1.1 Background 5
1.2 Aim and research question 6
1.3 LCA method 6
2 TECHNICAL DESCRIPTION 7
2.1 Solar energy 7
2.2 Efficiency of a solar cell 7
2.3 Silicon-based solar cells 8 2.3.1 Working principle 9
2.4 Perovskite solar cells 12 2.4.1 Working principle 13
2.5 Tandem silicon-perovskite solar cells 15
2.6 Lead toxicity 16
3 GOAL AND SCOPE 18
3.1 Functional unit 18
3.2 System boundaries 18
3.3 Impact categories and impact assessment methods 19
3.4 Sources and software 20
4 LIFE CYCLE INVENTORY FOR SILICON CELLS 21
4.1 Initial flowchart of the process 21
4.2 Sand extraction 21
4.3 Production of silica sand 21
4.4 Production of metallurgical-grade silicon 22
4.5 Solar-grade, electric-grade, and off-grade silicon production 22
4.6 Production of polycrystalline silicon block 22
4.7 Production of silicon wafers 23
4.8 Production of solar cell 23
4.9 Transportation 23
4.10 Electricity production 25
2
5 LIFE CYCLE INVENTORY FOR PEROVSKITE SOLAR CELL 26
5.1 Initial flowchart for the process 27
5.2 Indium tin oxide-coated glass 28
5.3 Titanium dioxide 28
5.4 Perovskite layer 28
5.5 Hole transport layer 31
5.6 Back contact 31
5.7 Energy use 31
5.8 Transport 33
5.9 Electricity 33
6 IMPACT ASSESSMENT 34
6.1 Sensitivity analysis 34
6.2 Ecotoxicity 36
6.3 Human toxicity potential 39
6.4 Energy use 43
7 CONCLUDING DISCUSSION 45
8 REFERENCES 47

3
Abbreviations
Ag-Silver
Al2O3-Aluminium oxide
Al-Aluminium
As-Arsenic
B-Boron
CaO-Calcium oxide
Cu-Copper
Fe2O3-Iron (III) oxide
Ga-Gallium
In-Indium
ITO-Indium tin oxide
K2O-Potassium oxide
LCA-Life cycle assessment
MgO-Magnesium oxide
Mg-Magnesium
Na2O-Sodium oxide
Ni-Nickel
P-Phosphorous
Pb-Lead
Pd-Paladium
SO3-Sulfur trioxide
Sb-Antimony
SiO2-Silicon dioxide
Si-Silicon
Sn-Tin
TiO2-Titanium oxide
Ti-Titanium

4

5
1 Introduction
This chapter provides an overview of this study concerning its context, aim and main
questions to be answered. The method that will be used in this study is also presented.
1.1 Background
The global energy demand is increasing and with the current goal set by the European
Union (EU) to increase the share of the energy consumption from renewable energy
sources to 20% by the year 2020, as pointed out by EU’s Renewable energy directive
(European Commission, 2015), the interest of utilizing solar power has been increasing
(IPCC, 2007). Recently, a perovskite solar cell with lead-based absorber has received a
lot of attention from solar cell producers since it offers the promise of relatively cheap
and efficient solar cells (News Every day, 2015). In this study, the name perovskite
refers to a material that has a same crystal structure as calcium titanium oxide (CaTiO3),
which is known as a perovskite structure. Some of these materials can be used to replace
the current commercially used silicon in solar cells as an absorber of light, and as later
noted, also as a conductor. Methylammonium lead tri-iodide (CH3NH3PbI3) was the
first absorber with the perovskite structure that was investigated for potential use in a
solar cell (Peplow, 2014). Although relatively low efficiencies were achieved at the
start, after a few years, efficiency values were achieved which could rival the
commercially used silicon-based solar cells. The same production line as for silicon-
based solar cells can also be used for production of perovskite solar cells. This means
that some of the necessary manufacturing facilities are already in place, and thus brings
promises that cheap production costs could be achieved relatively fast.
Although considered to be more efficient and cheap than the currently more common
silicon-based solar cells in few years, the production of these cells could potentially be
more environmentally damaging because of the lead content of the cell. Lead is toxic
to humans and organisms in the environment, and its raw material acquisition has
considerable environmental impacts (U.S. Environmental Protection Agency, 1994).
Although the mass content of lead in a perovskite solar cell is not high compared to the
mass of the whole cell, if implemented on a large scale, the demand for lead would
grow and this could lead to high environmental impacts because of the high toxicity of
lead and the polluting nature of its extraction process.
It should be noted that it is not always that a toxic heavy metal with high environmental
impact in itself leads to similarly high life cycle impacts of products in which the metal
is a constituent. One example is mercury in fluorescent light bulbs. According to
Eckelman and colleges (2008), increased use of mercury-containing light bulbs does
result in increased emissions of this heavy metal to the environment due to brakeage,
incineration and subsequent evaporation. However, the use also leads to reduced
electricity demand. If the avoided electricity is coal power, this reduced electricity
demand results in avoided emissions from electricity production, where mercury is one
of the emissions. As pointed out by Eckelman and colleges (2008), it is a complex task
to assess and compare emissions of a particular substance from one application which
is associated to energy systems, and the total energy production mix has to be taken
into account. However, using energy-efficient light bulbs with mercury can lead to
reduced net life cycle emissions of mercury.
6
Another example is cadmium in cadmium telluride solar cells. Emissions of heavy
metals that occur throughout the life cycle of such solar cells have been shown to be
small compared to emissions that are avoided from electricity production when these
solar cell are integrated into the grid (Fthenakis et al., 2008). Whether the same
environmentally beneficial situation is present for lead-containing perovskite solar cells
has not been previously investigated.
1.2 Aim and research question
The aim of this study is to compare the environmental performance of perovskite solar
cells to that of silicon-based solar cells. This is done in order to reveal which of the two
solar cells that is more “environmentally friendly”, that is, has lower environmental
impacts. The comparison is made with the respect to the functional unit of the study
which is 1 kWh of produced electricity. The research question can be stated as: Which
of the two solar cells has lower environmental impact throughout its life cycle (cradle-
to-grave)?
1.3 LCA method
The life cycle assessment (LCA) method is used in this study to compare two different
solar cell technologies. This method is used to quantitatively assess the environmental
impacts of a product or service on the environment. It takes into account all the material
and energy flows throughout the lifecycle of a product (cradle-to-grave). The emissions
and resource use of all processes, from raw material acquisition to final disposal, are
included and then quantified in terms of a functional unit. Usually, LCA includes the
goal and scope definition, inventory analysis, impact assessment and interpretation
phases (Baumann and Tillman, 2004). There are several international standards for
LCA, and one of them, ISO 14040 (2006), defines LCA as a technique for assessing
the environmental aspects and potential impacts of a product by collecting data of all
inputs and outputs of the system, associating environmental impacts to those inputs and
outputs, and summarizing these impacts in accordance with the goal and scope of the
study (Baumann and Tillman, 2004). This method provides valuable information on
possible process modifications that can be made in order to make the product more
“environmentally friendly”. LCA is often used to compare two or more products, or
several options on how to produce or dispose of a product, in order to identify most
preferred option from an environmental point of view. LCA was also the method used
in the previously mentioned studies of the mercury-containing light bulb and the
cadmium-containing solar cell (Eckelman et al. 2008, Fthenakis et al. 2008).
7
2 Technical description
This chapter provides the background for the use of solar energy, covers the working
principle of solar cells and describes two different solar cells – silicon and perovskite
solar cells. It also describes environmental and health aspects of lead.
2.1 Solar energy
The amount of energy that reaches the Earth in a form of light would be more than
enough to supply all the electricity demand globally (IPCC, 2007). One way to utilize
this incoming energy is to use photovoltaic technology (PV) that converts light into
electric energy. The application of this technology is in the form of solar cells, where
different kinds of semi-conductive materials are used for the production of electric
power. This technology has a lot of applications, from small scale electric appliances,
watches, and laptops, to larger scale electricity production in solar photovoltaic plants.
However, the efficiencies of solar cells typically only reach 15-20%. Solar cells with
higher efficiency can be reached but they are currently only on laboratory scale and not
feasible for large scale production (NREL, 2015). To use it for large scale electricity
production, one has to take into account the possible environmental impacts that would
come from mass production of solar panels.
Because of the potential of being a relatively clean energy source, there is a constant
search for new ways to increase efficiency and production rates of solar photovoltaics.
In order to help this technology to develop further, governments are also involved, by
subsidizing solar photovoltaics to support the use of such non-fossil energy sources
(Hjalmarsson, 2014). This cooperation of researchers and governments can lead to an
increase use of photovoltaic technology, and help in meeting the constant rising energy
demands.
2.2 Efficiency of a solar cell
Not all light that reaches a solar cell can be used for electricity generation. The ability
to induce electric current in a solar cell depends on the wavelength of the sunlight and
the band-gap of the semiconductor material. The term band-gap here refers to the
amount of energy required to increase the energy of the electron and free it from its
valance position in the atom shell (Four Peaks Technologies, 2011). Photons with lower
energy than the band-gap will go through the cell without exciting any electrons.
Photons with higher energy levels than the band-gap will free an electron, but because
of the excess energy, the rest of the energy will be lost as a heat (Four Peaks
Technologies, 2011). The ratio of the light energy which is able to induce electric
current in the cell, with the total light energy that reaches the cell, is referred to as the
efficiency of a cell.
The first efficiency limit for the single junction silicon solar cell was calculated by
William Shockley and Hans Queisser in 1961 under so-called standard test conditions
(Four Peaks Technologies, 2011). It was called the Shockley-Queisser limit and had an
original value of 30%. Standard test conditions are the test conditions used to test and
compare different types of solar cells. These conditions are (Florida Solar Energy
Center, 2010):
8
- Solar irradiation of the surface: 1000 W/m2
- Temperature of the solar cell (not of the surrounding environment): 25 ± 2°C
- Air mass ratio: 1.5. The air mass ratio stands for the ratio of the actual distance
of the solar radiation to the surface, to the vertical distance that the radiation
travel to the sea level.
The current Shockley-Queisser limit for any type of single junction solar cell is 33.7 %
(Four Peaks Technologies, 2011). Four main assumptions were made to apply this
Shockley-Queisser limit to all types of solar cells (Florida Solar Energy Center, 2010):
- Only one semiconductor material in a solar cell
- Only one p-n junction
- The irradiance of the sun is dispersed unequally over the solar cell surface
- Photons that have a higher value than the semiconductors band-gap are
converted into heat.
There are few strategies suggested by Four Peaks Technologies (2011) to potentially
exceed the Shockley-Queisser limit:
- The use of several semiconductors in the cell
- Implementing more than one p-n junction
- To concentrate light to the solar cell
- Implementing combined electricity and heat generation.
2.3 Silicon-based solar cells
There are several types of solar cells, but the majority currently used are wafer based
crystalline silicon PV (Chu, 2011). This includes both single-crystalline and multi-
crystalline silicon cells. As reported by Chu (2011), other commonly used PV panels
are thin film panels, which include cadmium telluride (CdTe) and copper-indium-
gallium-diselenide (CIGS) panels. Since the silicon-based solar cells are the most
common type of cells being used today, this type of cell was chosen for comparison to
the perovskite solar cells in this study.
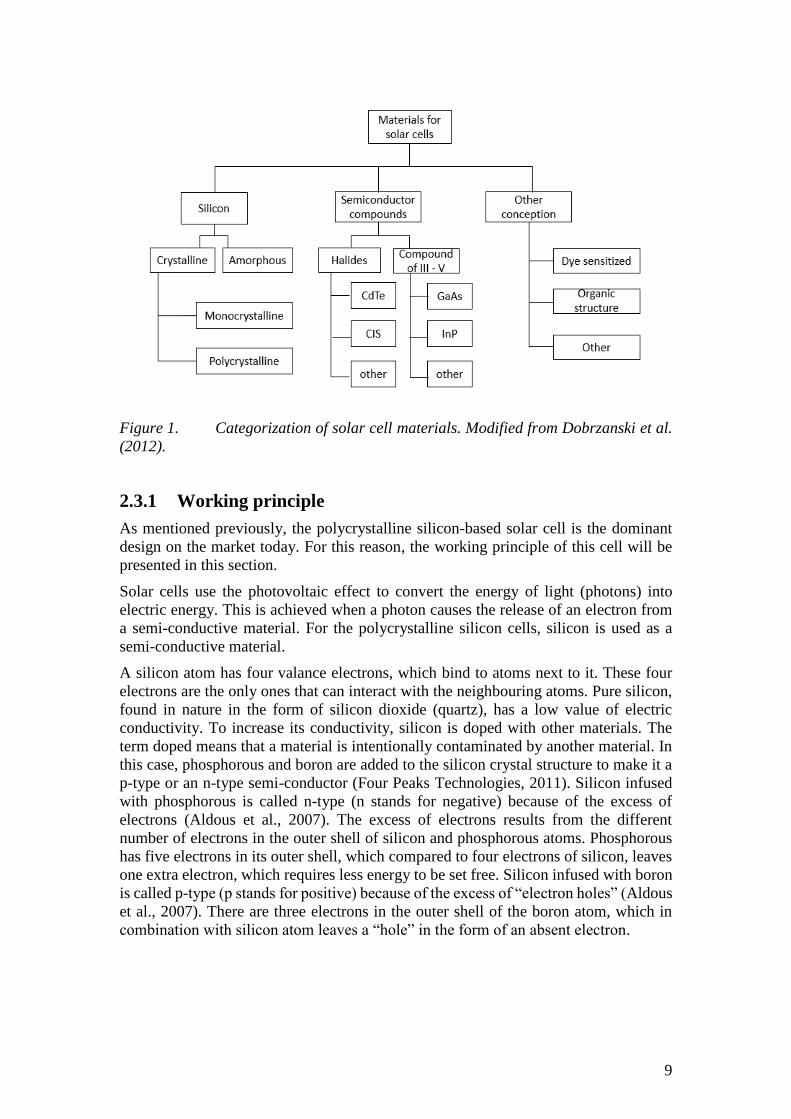
Figure 1 shows a categorization of solar cells based on the main active material.
Currently, the crystalline silicon material is dominating the market, with the largest
share coming from polycrystalline silicon (Dobrzanski et al., 2012). The solar cells
containing perovskites, which are studied in this thesis, are part of the organic structure
group of solar cells, which currently only holds a minor share of the market.
9
Figure 1. Categorization of solar cell materials. Modified from Dobrzanski et al.
(2012).
2.3.1 Working principle
As mentioned previously, the polycrystalline silicon-based solar cell is the dominant
design on the market today. For this reason, the working principle of this cell will be
presented in this section.
Solar cells use the photovoltaic effect to convert the energy of light (photons) into
electric energy. This is achieved when a photon causes the release of an electron from
a semi-conductive material. For the polycrystalline silicon cells, silicon is used as a
semi-conductive material.
A silicon atom has four valance electrons, which bind to atoms next to it. These four
electrons are the only ones that can interact with the neighbouring atoms. Pure silicon,
found in nature in the form of silicon dioxide (quartz), has a low value of electric
conductivity. To increase its conductivity, silicon is doped with other materials. The
term doped means that a material is intentionally contaminated by another material. In
this case, phosphorous and boron are added to the silicon crystal structure to make it a
p-type or an n-type semi-conductor (Four Peaks Technologies, 2011). Silicon infused
with phosphorous is called n-type (n stands for negative) because of the excess of
electrons (Aldous et al., 2007). The excess of electrons results from the different
number of electrons in the outer shell of silicon and phosphorous atoms. Phosphorous
has five electrons in its outer shell, which compared to four electrons of silicon, leaves
one extra electron, which requires less energy to be set free. Silicon infused with boron
is called p-type (p stands for positive) because of the excess of “electron holes” (Aldous
et al., 2007). There are three electrons in the outer shell of the boron atom, which in
combination with silicon atom leaves a “hole” in the form of an absent electron.
10
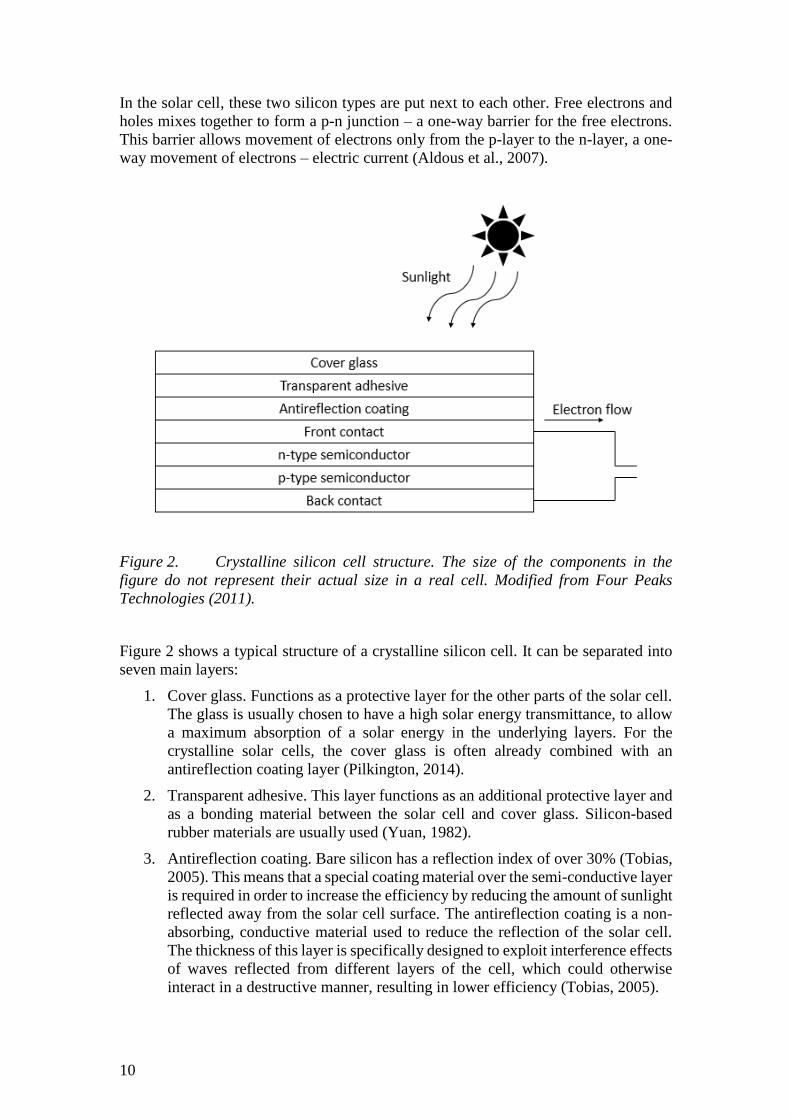
In the solar cell, these two silicon types are put next to each other. Free electrons and
holes mixes together to form a p-n junction – a one-way barrier for the free electrons.
This barrier allows movement of electrons only from the p-layer to the n-layer, a one-
way movement of electrons – electric current (Aldous et al., 2007).
Figure 2. Crystalline silicon cell structure. The size of the components in the
figure do not represent their actual size in a real cell. Modified from Four Peaks
Technologies (2011).
Figure 2 shows a typical structure of a crystalline silicon cell. It can be separated into
seven main layers:
1. Cover glass. Functions as a protective layer for the other parts of the solar cell.
The glass is usually chosen to have a high solar energy transmittance, to allow
a maximum absorption of a solar energy in the underlying layers. For the
crystalline solar cells, the cover glass is often already combined with an
antireflection coating layer (Pilkington, 2014).
2. Transparent adhesive. This layer functions as an additional protective layer and
as a bonding material between the solar cell and cover glass. Silicon-based
rubber materials are usually used (Yuan, 1982).
3. Antireflection coating. Bare silicon has a reflection index of over 30% (Tobias,
2005). This means that a special coating material over the semi-conductive layer
is required in order to increase the efficiency by reducing the amount of sunlight
reflected away from the solar cell surface. The antireflection coating is a non-
absorbing, conductive material used to reduce the reflection of the solar cell.
The thickness of this layer is specifically designed to exploit interference effects
of waves reflected from different layers of the cell, which could otherwise
interact in a destructive manner, resulting in lower efficiency (Tobias, 2005).
11
4. Front contact. Contacts are made of conductive and transparent materials, and
serve as connection materials between the solar cell and the external circuit. For
silicon cells, indium tin oxide (ITO) is usually used as front contact material
(Tobias, 2005).
5. N-type semiconductor. Silicon doped with phosphorous. This layer has an
excess of free electrons, because of a higher number of electrons in the outer
shell of phosphorous relative to silicon.
6. P-type semiconductor. Silicon doped with boron. This layer of the solar cell has
an excess of electron holes, because of a higher number of electrons in outer
shell of boron relative to silicon.
7. Back contact. Same as the front contact, the back contact functions as a
conductor of electric current and provides support for the structure of the solar
cell. Silver or gold can be used as the materials for the back contact.
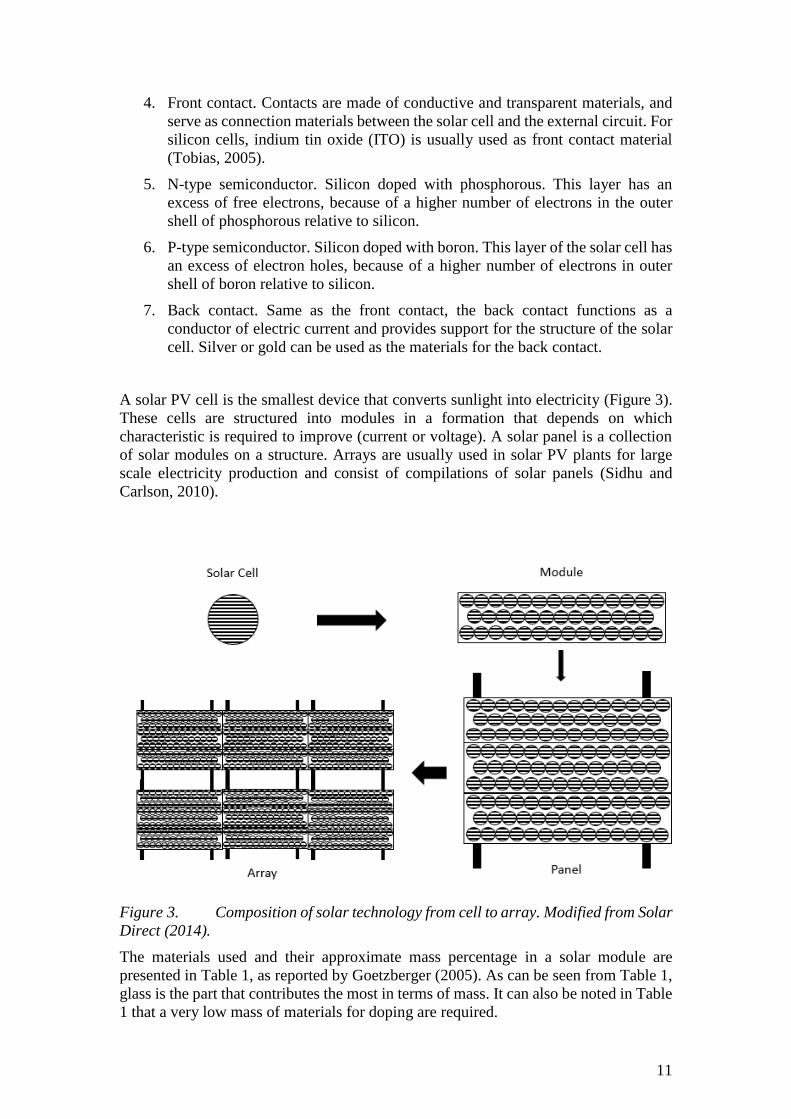
A solar PV cell is the smallest device that converts sunlight into electricity (Figure 3).
These cells are structured into modules in a formation that depends on which
characteristic is required to improve (current or voltage). A solar panel is a collection
of solar modules on a structure. Arrays are usually used in solar PV plants for large
scale electricity production and consist of compilations of solar panels (Sidhu and
Carlson, 2010).
Figure 3. Composition of solar technology from cell to array. Modified from Solar
Direct (2014).
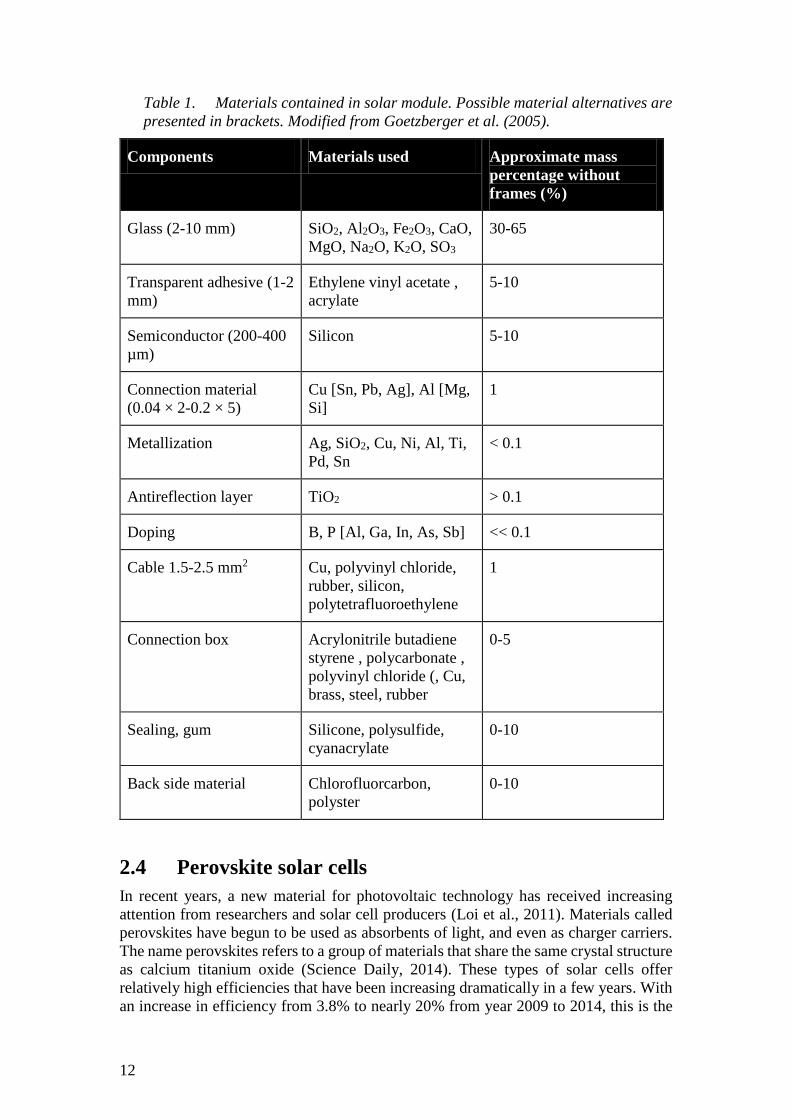
The materials used and their approximate mass percentage in a solar module are
presented in Table 1, as reported by Goetzberger (2005). As can be seen from Table 1,
glass is the part that contributes the most in terms of mass. It can also be noted in Table
1 that a very low mass of materials for doping are required.
12
Table 1. Materials contained in solar module. Possible material alternatives are
presented in brackets. Modified from Goetzberger et al. (2005).
Components Materials used Approximate mass
percentage without
frames (%)
Glass (2-10 mm) SiO2, Al2O3, Fe2O3, CaO,
MgO, Na2O, K2O, SO3
30-65
Transparent adhesive (1-2
mm)
Ethylene vinyl acetate ,
acrylate
5-10
Semiconductor (200-400
µm)
Silicon 5-10
Connection material
(0.04 × 2-0.2 × 5)
Cu [Sn, Pb, Ag], Al [Mg,
Si]
1
Metallization Ag, SiO2, Cu, Ni, Al, Ti,
Pd, Sn
< 0.1
Antireflection layer TiO2 > 0.1
Doping B, P [Al, Ga, In, As, Sb] << 0.1
Cable 1.5-2.5 mm2 Cu, polyvinyl chloride,
rubber, silicon,
polytetrafluoroethylene
1
Connection box Acrylonitrile butadiene
styrene , polycarbonate ,
polyvinyl chloride (, Cu,
brass, steel, rubber
0-5
Sealing, gum Silicone, polysulfide,
cyanacrylate
0-10
Back side material Chlorofluorcarbon,
polyster
0-10
2.4 Perovskite solar cells
In recent years, a new material for photovoltaic technology has received increasing
attention from researchers and solar cell producers (Loi et al., 2011). Materials called
perovskites have begun to be used as absorbents of light, and even as charger carriers.
The name perovskites refers to a group of materials that share the same crystal structure
as calcium titanium oxide (Science Daily, 2014). These types of solar cells offer
relatively high efficiencies that have been increasing dramatically in a few years. With
an increase in efficiency from 3.8% to nearly 20% from year 2009 to 2014, this is the
13
fastest growing solar cell technology today (NREL, 2014). The most notable drawbacks
of this technology is the lead content of the cell, and solar cell durability, which is
currently too short for large scale implementation.
2.4.1 Working principle
Most efficient perovskite solar cells today have a similar working principle as the thin
film solar cells. Currently, the most commonly used absorber in perovskite solar cells
is methylammonium lead trihalide (Peplow, 2014). For this reason, this study will focus
on this perovskite material.
The first models of perovskite solar cells were based on the structure of dye-sensitized
solar cells, where organic materials were deposited over a porous TiO2 layer (Loi et al.,
2013). Later studies showed that perovskite layers can also transport electrons and more
simple designs, based on the thin film solar cell structure, were developed (Loi et al.,
2013). Several studies trying to achieve higher efficiencies for both designs have been,
and are still being, conducted. Figure 4 shows two types of perovskite solar cell designs.
A dominant design with highest efficiency and best performance has not been
established yet (Jiandong et al, 2014).
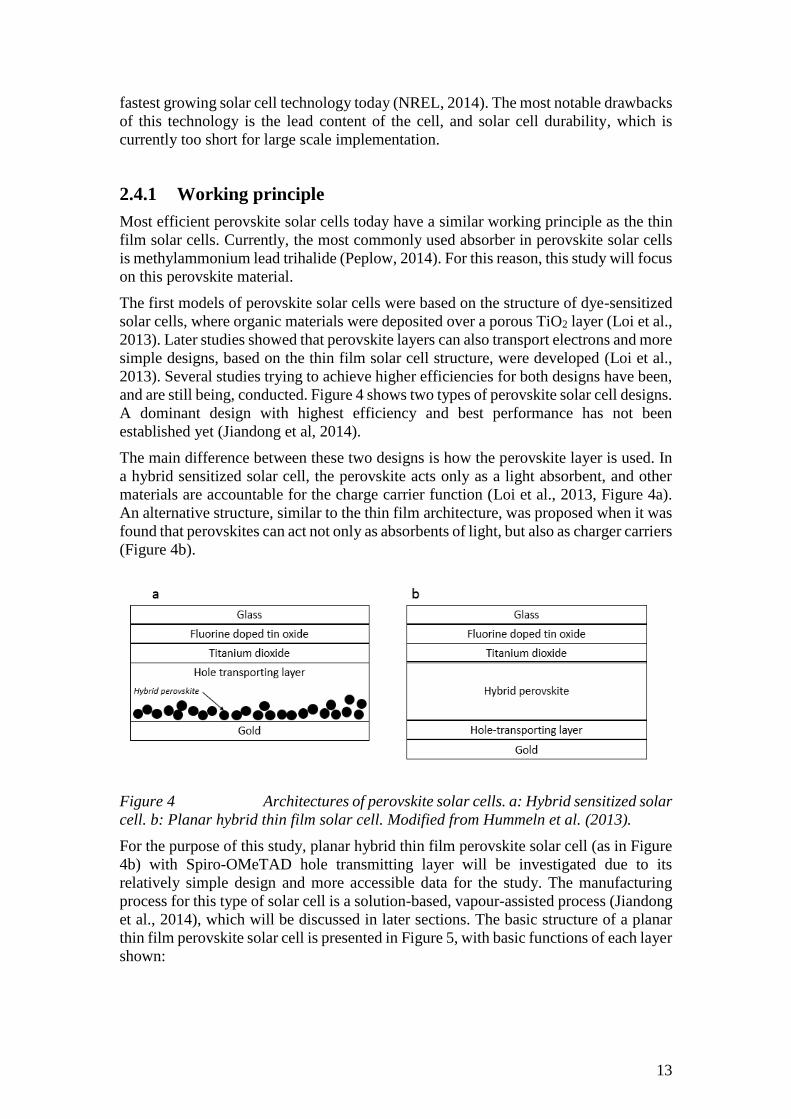
The main difference between these two designs is how the perovskite layer is used. In
a hybrid sensitized solar cell, the perovskite acts only as a light absorbent, and other
materials are accountable for the charge carrier function (Loi et al., 2013, Figure 4a).
An alternative structure, similar to the thin film architecture, was proposed when it was
found that perovskites can act not only as absorbents of light, but also as charger carriers
(Figure 4b).
Figure 4 Architectures of perovskite solar cells. a: Hybrid sensitized solar
cell. b: Planar hybrid thin film solar cell. Modified from Hummeln et al. (2013).
For the purpose of this study, planar hybrid thin film perovskite solar cell (as in Figure
4b) with Spiro-OMeTAD hole transmitting layer will be investigated due to its
relatively simple design and more accessible data for the study. The manufacturing
process for this type of solar cell is a solution-based, vapour-assisted process (Jiandong
et al., 2014), which will be discussed in later sections. The basic structure of a planar
thin film perovskite solar cell is presented in Figure 5, with basic functions of each layer
shown:
14
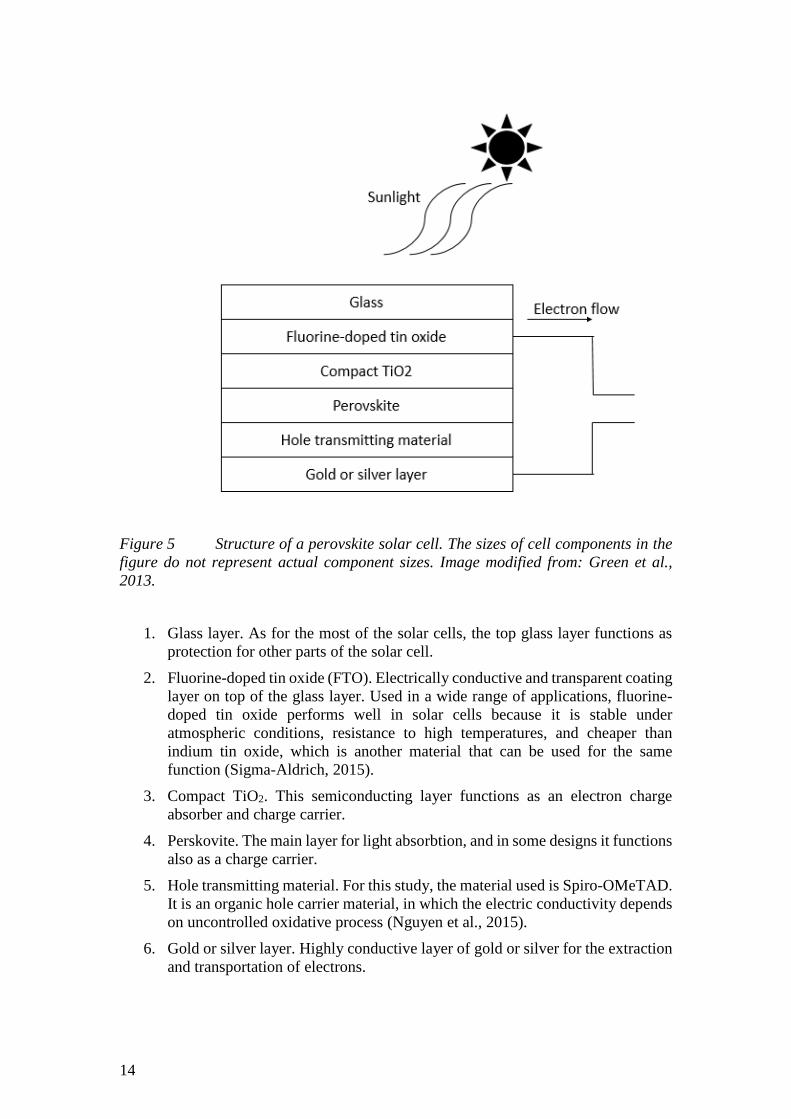
Figure 5 Structure of a perovskite solar cell. The sizes of cell components in the
figure do not represent actual component sizes. Image modified from: Green et al.,
2013.
1. Glass layer. As for the most of the solar cells, the top glass layer functions as
protection for other parts of the solar cell.
2. Fluorine-doped tin oxide (FTO). Electrically conductive and transparent coating
layer on top of the glass layer. Used in a wide range of applications, fluorine-
doped tin oxide performs well in solar cells because it is stable under
atmospheric conditions, resistance to high temperatures, and cheaper than
indium tin oxide, which is another material that can be used for the same
function (Sigma-Aldrich, 2015).
3. Compact TiO2. This semiconducting layer functions as an electron charge
absorber and charge carrier.
4. Perskovite. The main layer for light absorbtion, and in some designs it functions
also as a charge carrier.
5. Hole transmitting material. For this study, the material used is Spiro-OMeTAD.
It is an organic hole carrier material, in which the electric conductivity depends
on uncontrolled oxidative process (Nguyen et al., 2015).
6. Gold or silver layer. Highly conductive layer of gold or silver for the extraction
and transportation of electrons.
15
2.5 Tandem silicon-perovskite solar cells
As mentioned above, crystalline silicon solar cells are currently dominating the solar
cell market. While the production costs for these cells have been gradually decreasing,
the efficiency of these cells has remained constant at around 24% for more than ten
years (NREL, 2015). Because of already existing factories, relations between
manufacturers, implemented policies, and low production costs, it is hard for new
technologies to enter the market (Dobrzanski et al., 2012). For this reason, the
enhancement of the efficiency of the currently dominating silicon solar cell is of a great
interest.
One way to achieve this is the combination of two solar cells with different properties
in order to reach higher total efficiency of the whole solar cell. The main task to consider
when combining two solar cells is to choose materials with specific levels of band-gaps.
The target is to have a solar cell with a higher band-gap on the top in order to maximize
the light absorption (Bailie, 2014). A main barrier here is the lack of available materials
for the top part of the solar cell, which should have a high band-gap. However, with the
introduction of perovskite materials as photovoltaic technology, this has opened new
possibilities in the tandem solar cell field.
The increased efficiency of tandem solar cells compared to solar cells with only one
light-absorbing material can be explained by Figure 6. In a silicon solar cell, which has
a band-gap of approximately 1.4 eV, photons with equal and lower energy are absorbed
and converted into electricity. Photons with higher energy are also absorbed, but due to
their high energy, they are dispersed as heat in a cell. In a tandem solar cell, photons
with energy higher than 1.4 eV are absorbed and converted into electricity by the top
cell, which has a higher band-gap than the silicon one (around 1.6 eV). The photons
with equal or lower energy than 1.4 eV are absorbed and converted into electricity in
the bottom cell in the same way as for a silicon-only solar cell.
A combination of a silicon cell or a copper indium gallium diselenide cell with a hybrid
perovskite solar cell was proposed by Bailie et al (2014). According to them, the band-
gap of a top cell should preferably be 1.7-1.8 eV, which makes perovskite cell a good
candidate for the top cell, having a band-gap around 1.6 eV.

16
Figure 6 Photon absorption principle for single silicon solar cell (left) and for
tandem solar cell (right).
A combination of a silicon cell or a copper indium gallium diselenide cell with a hybrid
perovskite solar cell was proposed by Bailie et al (2014). According to them, the band-
gap of a top cell should be 1.7-1.8 eV, which makes perovskite cell a good candidate
for the top cell, having a band-gap around 1.6 eV.
2.6 Lead toxicity
Since one of the main barriers for implementing perovskite solar cells on a large scale
is uncertainty about environmental effects from the production, especially related to the
lead content, it is important to know and understand the consequences that high
exposure of lead can have for human health and the environment.
Although lead is a naturally occurring metal, most of the lead concentrated in the
environment comes from human activities (USDHHS, 2007). Such activities include
mining, burning of fossil fuels or municipal waste, combustion of fuel in vehicles and
disposal of car batteries without recycling. Once released into the environment, lead
cannot be degraded by natural means, only changed into other forms of lead (US DHHS,
2007).
According to the World Health Organization (WHO), there are several ways for humans
to be exposed to lead: breathing air containing lead particulates, drinking water and
eating food or accidentally swallowing dust with lead content. There is particularly high
risk for people living close to mining industries or high-intensity highways.
Children and pregnant women are the group with highest risk of effects from exposure
to lead, since the body of the child or infant is still forming and growing. The WHO has
set tolerable lead intake levels based on a scientific review conducted in 2010: 1 µg/dL
of lead in drinking water, and 0.5 µg/m3 lead in air (WHO, 2010). The US
Environmental Protection Agency has set up guideline values for lead exposure
according to Table 2.
17
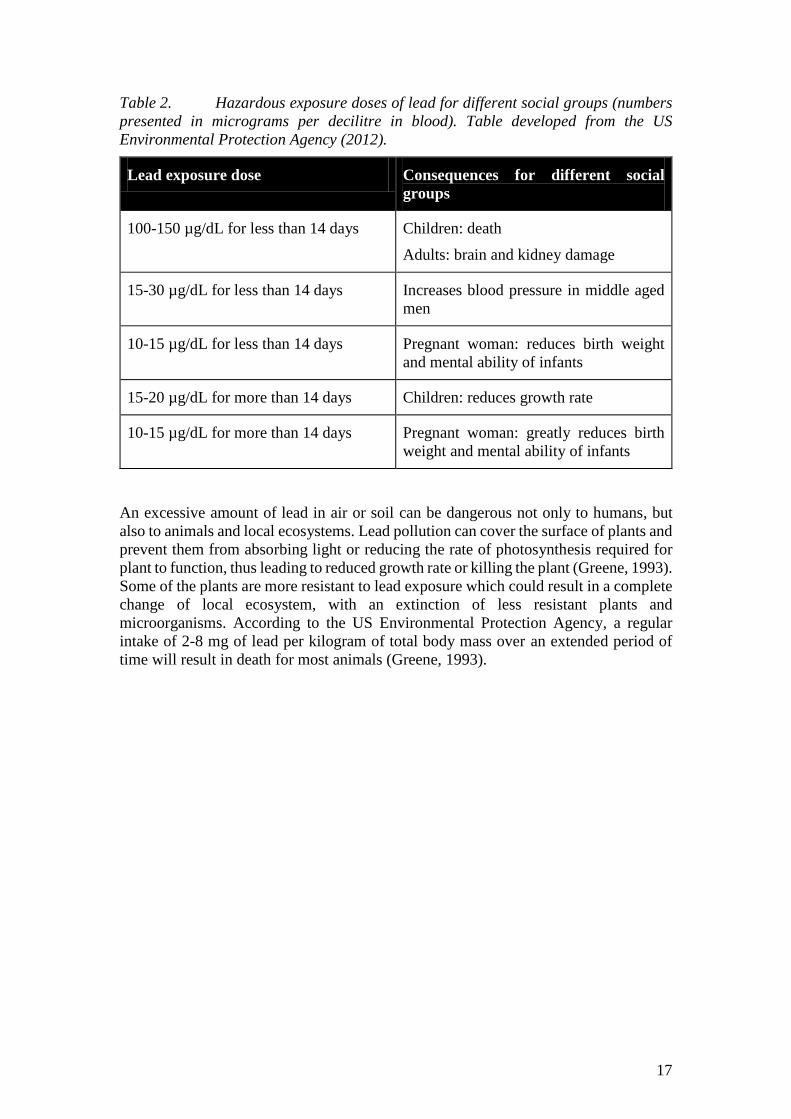
Table 2. Hazardous exposure doses of lead for different social groups (numbers
presented in micrograms per decilitre in blood). Table developed from the US
Environmental Protection Agency (2012).
Lead exposure dose Consequences for different social
groups
100-150 µg/dL for less than 14 days Children: death
Adults: brain and kidney damage
15-30 µg/dL for less than 14 days Increases blood pressure in middle aged
men
10-15 µg/dL for less than 14 days Pregnant woman: reduces birth weight
and mental ability of infants
15-20 µg/dL for more than 14 days Children: reduces growth rate
10-15 µg/dL for more than 14 days Pregnant woman: greatly reduces birth
weight and mental ability of infants
An excessive amount of lead in air or soil can be dangerous not only to humans, but
also to animals and local ecosystems. Lead pollution can cover the surface of plants and
prevent them from absorbing light or reducing the rate of photosynthesis required for
plant to function, thus leading to reduced growth rate or killing the plant (Greene, 1993).
Some of the plants are more resistant to lead exposure which could result in a complete
change of local ecosystem, with an extinction of less resistant plants and
microorganisms. According to the US Environmental Protection Agency, a regular
intake of 2-8 mg of lead per kilogram of total body mass over an extended period of
time will result in death for most animals (Greene, 1993).
18
3 Goal and scope
This chapter describes goal and scope definition, including definition of system
boundaries.
The goal of this study is to compare two types of photovoltaic solar cells – silicon-based
solar cells and perovskite solar cells, and to investigate which of the two that has the
lower impact to the environment throughout its life cycle. Since perovskite solar cells
is a new technology, which is not available on the market yet, this study is a prospective
LCA (Sandén and Karlström 2007). In that sense, it is similar in scope to other
conducted prospective LCA studies, for example Arvidsson et al. (2015).
3.1 Functional unit
The functional unit of this study is 1 kWh of produced electricity from the solar cells,
since the purpose of solar cells is to produce electricity. This functional unit has also
been used in previous LCA studies of solar cells (Jungbluth, 2005, Alvebratt and
Blidmark, 2014). Ideal condition for solar power production, which is 1000 W/m2 of
surface solar irradiation, is assumed in this study, which means that the solar cells
produce at maximum of its capacity.
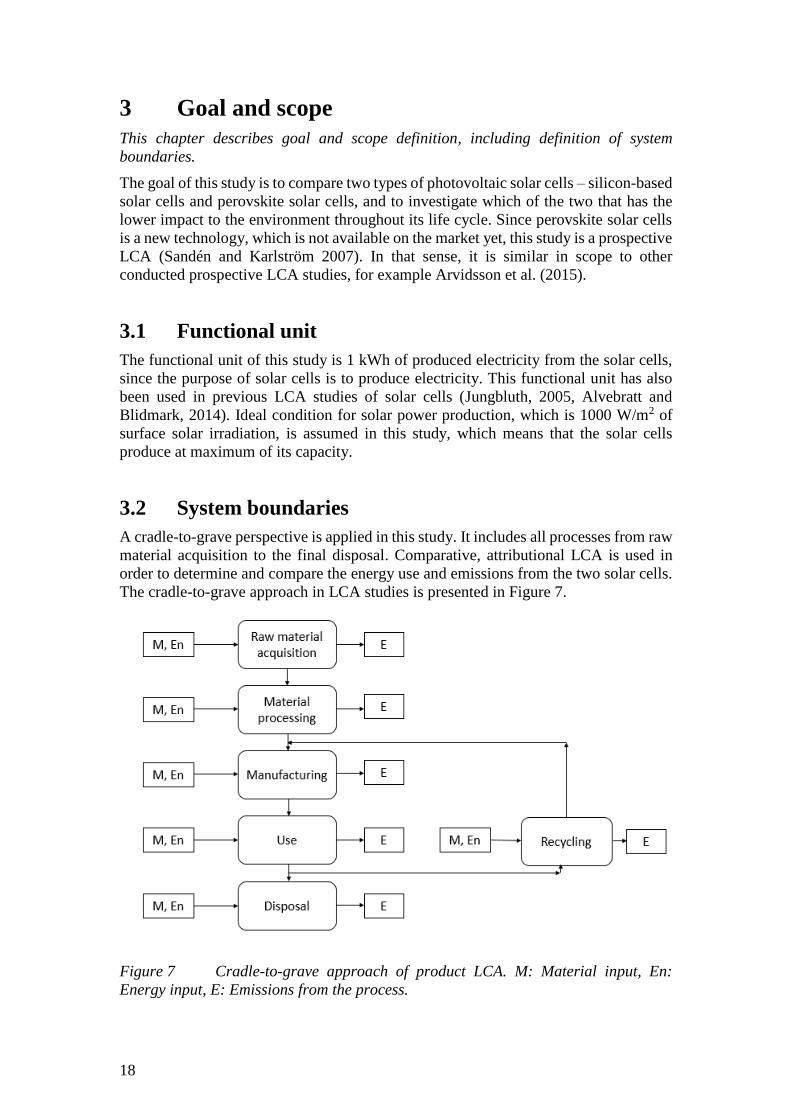
3.2 System boundaries
A cradle-to-grave perspective is applied in this study. It includes all processes from raw
material acquisition to the final disposal. Comparative, attributional LCA is used in
order to determine and compare the energy use and emissions from the two solar cells.
The cradle-to-grave approach in LCA studies is presented in Figure 7.
Figure 7 Cradle-to-grave approach of product LCA. M: Material input, En:
Energy input, E: Emissions from the process.
19
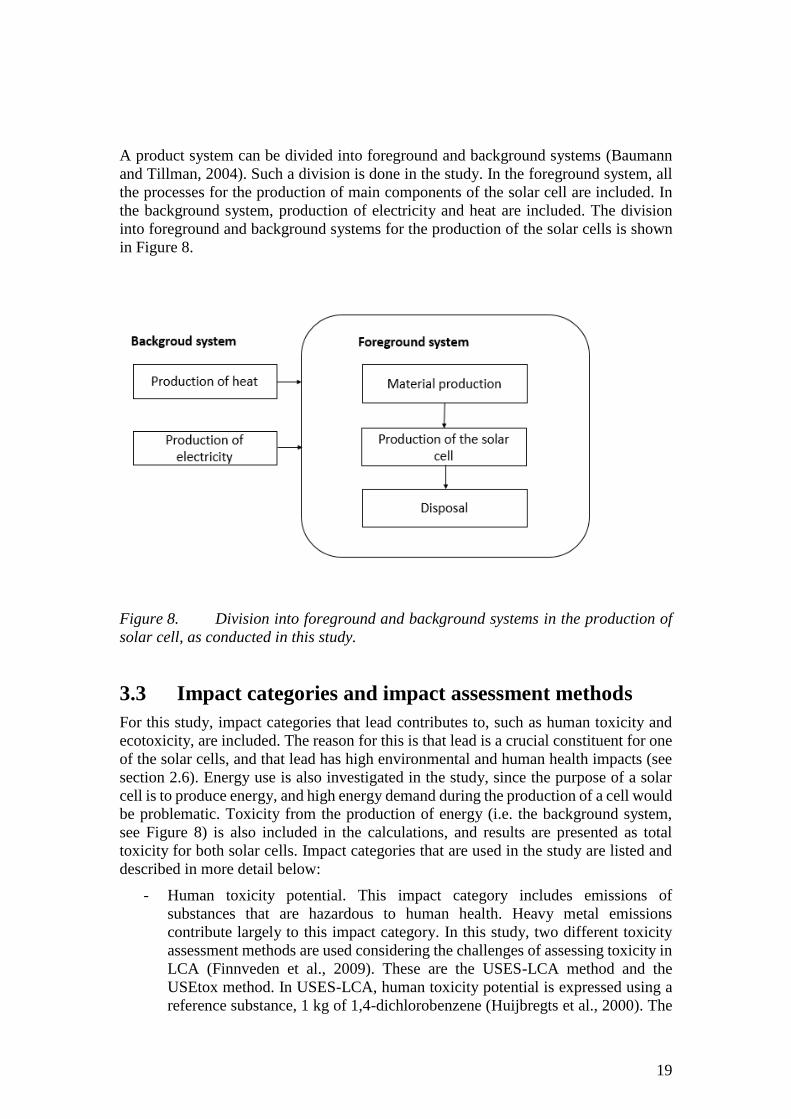
A product system can be divided into foreground and background systems (Baumann
and Tillman, 2004). Such a division is done in the study. In the foreground system, all
the processes for the production of main components of the solar cell are included. In
the background system, production of electricity and heat are included. The division
into foreground and background systems for the production of the solar cells is shown
in Figure 8.
Figure 8. Division into foreground and background systems in the production of
solar cell, as conducted in this study.
3.3 Impact categories and impact assessment methods
For this study, impact categories that lead contributes to, such as human toxicity and
ecotoxicity, are included. The reason for this is that lead is a crucial constituent for one
of the solar cells, and that lead has high environmental and human health impacts (see
section 2.6). Energy use is also investigated in the study, since the purpose of a solar
cell is to produce energy, and high energy demand during the production of a cell would
be problematic. Toxicity from the production of energy (i.e. the background system,
see Figure 8) is also included in the calculations, and results are presented as total
toxicity for both solar cells. Impact categories that are used in the study are listed and
described in more detail below:
- Human toxicity potential. This impact category includes emissions of
substances that are hazardous to human health. Heavy metal emissions
contribute largely to this impact category. In this study, two different toxicity
assessment methods are used considering the challenges of assessing toxicity in
LCA (Finnveden et al., 2009). These are the USES-LCA method and the
USEtox method. In USES-LCA, human toxicity potential is expressed using a
reference substance, 1 kg of 1,4-dichlorobenzene (Huijbregts et al., 2000). The

20
USES-LCA impact assessment method is used here because it is an established
method as a part of the ReCiPe impact assessment method (Goedkoop et al.,
2008). USEtox is chosen because it is the most recently developed consensus
model for toxicity assessment in LCA. The unit of measurement in USEtox is
comparative toxic units (CTUh), which describes the increased morbidity for the
human population per kg of chemical emitted (Hauschild et al, 2008). Two
impact assessment methods are chosen to compare and check the robustness of
results.
- Ecotoxicity. This impact category characterizes all emissions to air and water
that are hazardous to organisms in the environment. It includes emissions that
are associated with decreasing local biodiversity and wildlife. Again, two
different toxicity assessment methods are used: USE-LCA and USEtox. The
results from USES-LCA are expressed relative to 1 kg of 1,4-dichlorobenzene
(Huijbregts et al, 2000). In USEtox, results are expressed as cumulative toxic
units for the environment (CTUe), which translates to the change in potentially
affected fraction (PAF) of species for the change in chemical concentration
occurring due to the emission.
- Energy use. This impact category accounts for the use of energy. The unit of
kWh is chosen to match the functional unit, which is also expressed in kWh.
The total energy is divided into thermal energy (kWhth) and electrical energy
(kWhel). Such a separation of energy between heat and electricity was also
conducted by Kushnir and Sandén (2008) in order not to aggregate these two
entropically different types of energy.
3.4 Sources and software
Information about the production of silicon cells is obtained from two different LCA
studies – one by the International Energy Agency (Fthenakis et al., 2011) and one by
the Swiss Ecoinvent database (Jungbluth, 2004). Available process data for the
production of perovskite solar cells were collected from an article in the journal
Nanoscale Research Letters (Chen, 2013). Data for the processes is gathered from the
online Unit Process Data (UPD) database Ecoinvent version 2.2 (2010). For the toxicity
impact assessment, two sources describing the applied methods were used: Huijbregts
et al., 2000 for USES-LCA and Hauschild et al (2008) for USEtox.

21
4 Life cycle inventory for silicon cells
In this chapter, the inventory modelling and data collection for the silicon cell is
described. This data is subsequently used for impact assessment.
4.1 Initial flowchart of the process
Figure 9 shows the process flow chart for the production of silicon solar cells. The
production processes are described in more detail in subsequent sections.
Figure 9 Flowchart for production of silicon photovoltaic solar cell.
4.2 Sand extraction
Unit Process Raw data is obtained from the Ecoinvent database–“sand, at mine” (#478).
The process represents production in China and inputs to the process are electricity and
burning of the light fuel oil in industrial boiler. The land use for the mine and the
manufacturing of the operation machinery are excluded from the study.
4.3 Production of silica sand
Production of silica sand includes drying of the sand and removing impurities and other
materials to achieve high purity silica sand. The main energy input into process is heat
for the drying of the sand, produced by burning light fuel oil at industrial furnace. This
process is described in the Ecoinvent database “silica sand, at plant” (#479), and
relevant inventory data is available. The data represent production in China.
22
4.4 Production of metallurgical-grade silicon
The so-called carbothermal reduction process is used for the production of
metallurgical-grade silicon (MG silicon) from the silica sand (Jungbluth, 2005). The
process inputs consist of electricity input from the local grid, use of reducing agents
such as charcoal, petroleum coke, and hard coal, and some minor inputs of chemicals
such as liquefied oxygen and graphite. The production of reducing agents and
chemicals, which are used in the process, and the energy use for these processes, have
been taken into account. For the production of these products, electricity is the major
energy input, as specified by the Ecoinvent data set “MG-silicon, at plant” (#1112).
4.5 Solar-grade, electric-grade, and off-grade silicon
production
To be able to use silicon in photovoltaic technology, it has to be purified to a higher
level of purity than MG silicon. Three processes from the Ecoinvent database describe
this: “Silicon, solar grade, modified Siemens process, at plant” (#1194), “silicon,
electronic grade, at plant” (#1190), “silicon, electronic grade, off-grade, at plant”
(#1191).
The solar-grade silicon is produced using the so-called modified Siemens process,
which uses less electricity compared to usual Siemens process. In the Siemens process,
high-purity silicon is produced in a vacuum chamber using high temperature as the
nucleation state for silicon deposition (Aldous, 2007). This high-purity silicon is
deposited on thin polysilicon rods via vapour deposition process. The demand for
process electricity and heat is covered by natural gas-fired cogeneration plant.
Production of electric-grade and off-grade silicon share the same process input and
outputs as the solar-grade silicon. A silicon production mix consisting of all these three
products is used in the further production chain. For the production of 1 kg of silicon to
be used in solar cell production, 0.80 kg is of solar-grade silicon, 0.15 kg is electronic-
grade silicon, and 0.05 kg off-grade silicon, as stated in the Ecoinvent data set “Silicon,
production mix, photovoltaics, at plant” (#6874). The difference for these three
products is the purity of silicon, where electric-grade silicon has the highest purity.
4.6 Production of polycrystalline silicon block
At this point, the purity of the silicon is high enough for solar cell production. The next
step is the melting of the purified silicon and casting it into forming boxes. After the
right form is obtained, the edges of the silicon blocks are cut off and blocks are formed.
For this process, the only energy input is electricity. Other inputs consist of some
chemicals and ceramic tiles. The ceramic tiles are used to store and form the melted
silicon into block formation. Chemicals used in the process include liquid nitrogen and
argon. Emissions and energy use for production of these tiles are included in the process
“production of polycrystalline silicon block” (#1192) described in the Ecoinvent
database.
23
4.7 Production of silicon wafers
The silicon block is sawn into 240 µm thick and 156×156 mm2 size wafers. In the data
set from Ecoinvent, “multi-Si wafer, at plant” (#6826), the reference flow is 1 m2 of
wafer surface. Inputs to the process include electricity, water use and consumption of
some materials, which include some chemicals for cleaning and etching the wafers, as
well as wire drawing and steel for cutting the wafers.
4.8 Production of solar cell
Parameters for the produced solar cell are as follow: 156×156 mm2 size, 270-300 µm
thick solar cell, with an efficiency of 13.5% and 1.3 W power capacity. In the Ecoinvent
data set, “photovoltaic cell, multi-Si, at plant” (#6828), the reference flow is production
of 1 m2 solar cell. After purification and etching of the wafers, they are doped with n-
type and p-type materials. Thin layers of antireflection coating and transparent adhesive
are added in this process section. Due to their low contribution to the total mass of the
cell, and to the total emissions, these components are not represented separately in the
flow chart, but are included in process production of solar cell. Finally, the front and
back contacts are added to the cell. Production of the front and back contact paste have
electricity and heating from natural gas as a main inputs to the process. Inputs to the
process include electricity, chemicals and some additional components like
metallization paste for front and back contacts.
4.9 Transportation
Considering the prospective nature of this study, future production locations and
transportation distances cannot be known with certainty. In order to still investigate the
potential contribution to toxicity and energy use from transportation, a hypothetical
transport scenario was derived based on the Ecoinvent data and is presented in Table 3.
Transport distances by sea and road are calculated using SeaRates calculator
(www.SeaRates.com). In this source, the speed of ships from China to Europe is
reported to be approximately 14 knots, which is similar to the speed of large ship
according to the classification by Baumann and Tillman (2004).
For the land transportation, Euro 5 class medium sized distribution trucks are assumed.
Euro 5 class trucks are chosen because of the emission regulations that apply to
transportation, and Euro 5 class trucks are the most recent ones to satisfy these
regulations according to emission standards by European Union (TransportPolicy,
2014). The Euro 6 class is already existing, but implemented only recently.
24
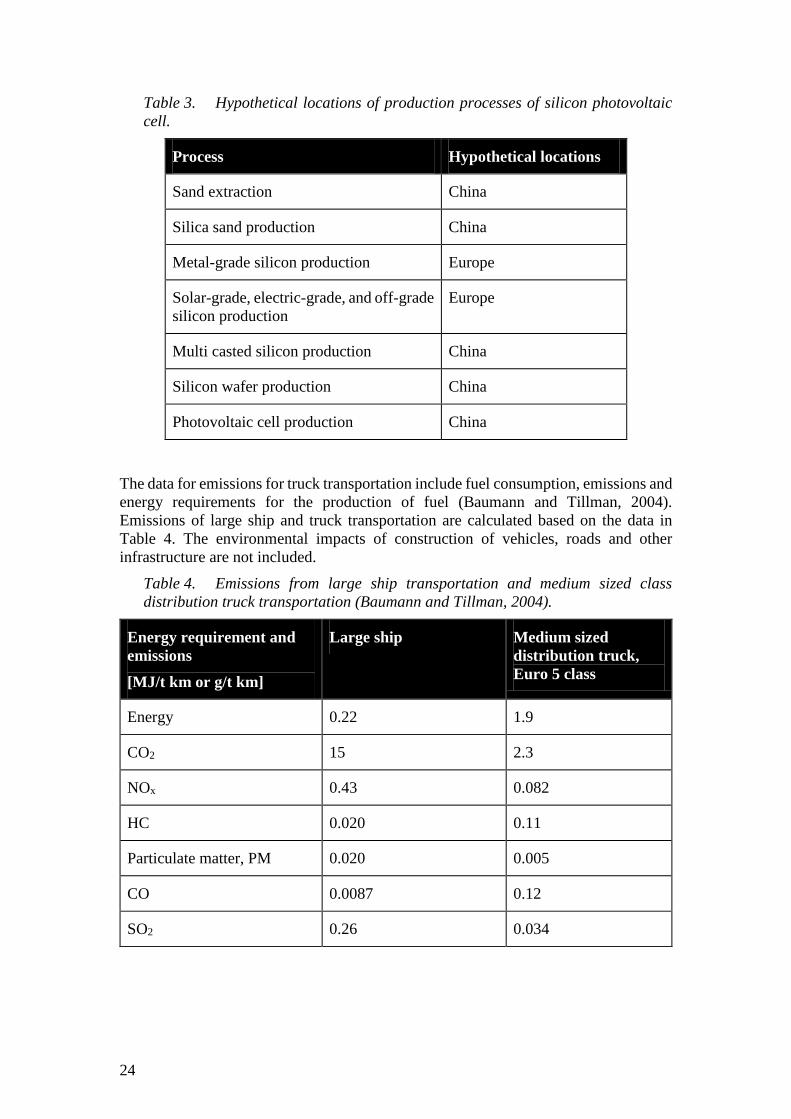
Table 3. Hypothetical locations of production processes of silicon photovoltaic
cell.
Process Hypothetical locations
Sand extraction China
Silica sand production China
Metal-grade silicon production Europe
Solar-grade, electric-grade, and off-grade
silicon production
Europe
Multi casted silicon production China
Silicon wafer production China
Photovoltaic cell production China
The data for emissions for truck transportation include fuel consumption, emissions and
energy requirements for the production of fuel (Baumann and Tillman, 2004).
Emissions of large ship and truck transportation are calculated based on the data in
Table 4. The environmental impacts of construction of vehicles, roads and other
infrastructure are not included.
Table 4. Emissions from large ship transportation and medium sized class
distribution truck transportation (Baumann and Tillman, 2004).
Energy requirement and
emissions
[MJ/t km or g/t km]
Large ship Medium sized
distribution truck,
Euro 5 class
Energy 0.22 1.9
CO2 15 2.3
NOx 0.43 0.082
HC 0.020 0.11
Particulate matter, PM 0.020 0.005
CO 0.0087 0.12
SO2 0.26 0.034

25
4.10 Electricity production
Since the object of this study is to compare two products, where one is not implemented
on the market yet, a general approach to electricity production was implemented in
order to account for future changes in electricity production and different potential
geographical locations. Electricity production was based not on the specific mixes
reported in the Ecoinvent database, but instead varied in the sensitivity analysis. For the
baseline scenario, the Swedish electricity mix was chosen, where approximately half of
the electricity is produced from nuclear power and the other half from hydro power.
This electricity mix represents one with low toxic emissions. One scenario with only
coal power, and one with half coal and half natural gas, were also assessed.

26
5 Life cycle inventory for perovskite solar cell
In this chapter, the inventory modelling and data collection for the perovskite cell is
described. This data is subsequently used for impact assessment.
There is limited data available for the production processes of perovskite solar cell. As
for most new emerging technologies, one dominant design in not established yet.
Several variations of the cell exist depending on perovskite material used, material for
hole transmitting material, and deposition method for the materials (Fan et al., 2014).
In this study, one specific design was chosen since it is a relatively new design (2014),
data is available, and the reported efficiency is close to the silicon solar cell described
in section 2.3. Technical details of this design are presented in Table 5. Compared to
the variations of material composition and production processes for perovskite solar
cell (presented in Table 1 in the article by Fan et al., 2014), the design chosen in the
study stands out from other designs in terms of the deposition method, where spin
coating is assisted by vapour deposition process. In most of the other designs, spin
coating is used for the deposition of both organic and inorganic parts of the cell (Fan et
al., 2014). For most of the recent designs, Spiro-OMeTAD has proven to be the optimal
hole transmitting material to achieve high efficiencies, and therefore this material is
used in the study. Note that there are some variants of perovskite solar cell compositions
that do not contain lead. However, in this study, in order to investigate the negative
effects of lead content in solar cells, a perovskite material containing lead content was
chosen.
Table 5. Material composition and performance summary of the studied
perovskite cell. Part of Table 1 from Fan et al. (2014).
Perovskite
material
Photoanode Deposition
method
Hole
transmitting
material
Area
(cm2)
Efficiency
CH3NH3PbI3 TiO2 (thin
film)
Spin coating
and vapour
deposition
Spiro-
OMeTAD
0.12 12.1%
Process data is collected from a research article published by Chen et al. (2014), in
which a spin-coated, vapour-assisted process was used for material deposition. Blade
coating technology, described by Hösel (2014), for layer deposition was also
investigated in this study. It has to be noted that currently, there is only a small scale
perovskite solar cell production and the up-scaling of these processes for large scale
solar cell production is done only theoretically for the purpose of this study. In the
future, for large-scale production of perovskite solar cells, these processes and material
inputs could change due to the continuous research that is ongoing to develop the
production of these cells.
Because of the lack of reliable data, some of the materials in the production process are
excluded from the study. These material have only a minor part in production, and their
impact, even in up-scaled production process, should be relatively low. These materials
27
are mostly various chemicals included in production of solar cell components, such as
some gases used in chemical processes (argon, nitrogen) or liquid chemicals (hydrogen,
ammonia) with low total mass input to the processes. Material inputs considered for the
production of one perovskite solar cell are presented in Table 6.
Table 6. Material inputs for the production of one perovskite solar cell.
Material: Mass (g)
Indium tin oxide coated glass 0.17
Titanium dioxide 0.0005
Perovskite 0.4
Hole transport layer 0.013
Back contact 0.005
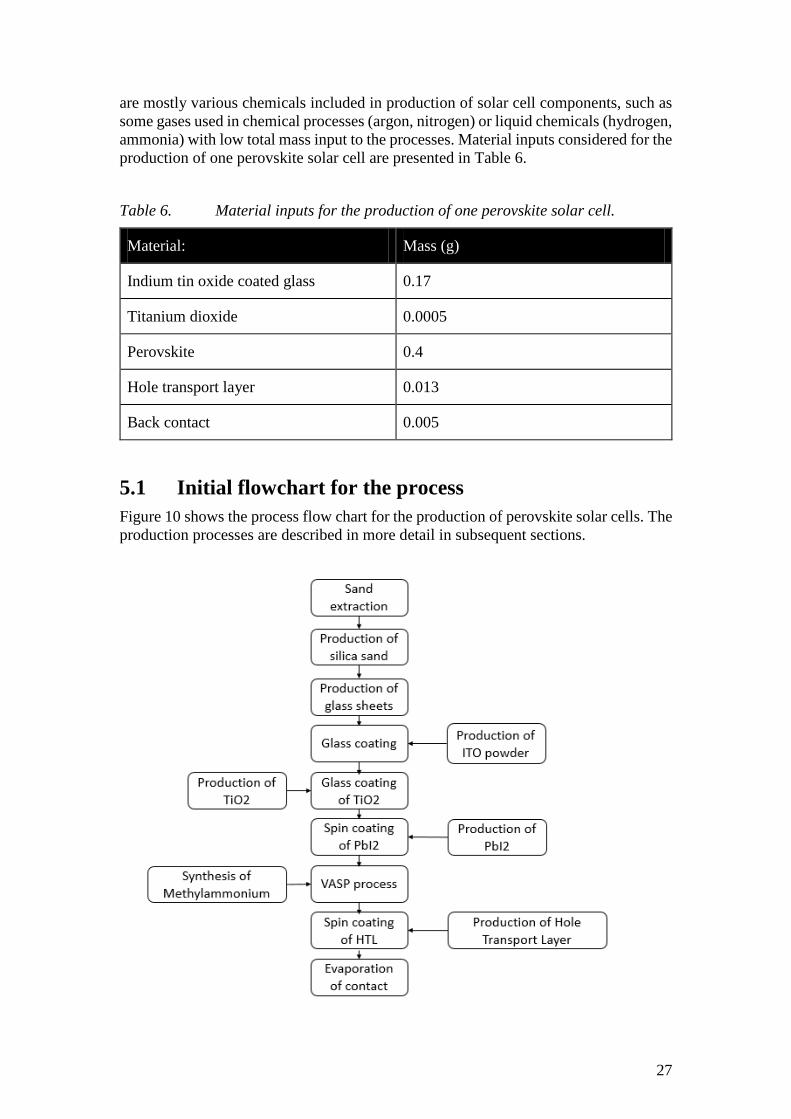
5.1 Initial flowchart for the process
Figure 10 shows the process flow chart for the production of perovskite solar cells. The
production processes are described in more detail in subsequent sections.
28
Figure 10. Flowchart for production of perovskite solar cell. In the chart, ITO
stands for indium tin oxide, TiO2 for titanium dioxide, PbI2 for lead (II) iodide, VASP
for vapor-assisted solution process, and HTL for hole transport layer.
5.2 Indium tin oxide-coated glass
Glass coated with electric conducting indium tin oxide film is used in this study (Chen
et al., 2014). As shown in Table 5, the total area of a perovskite cell is 0.12 cm2. From
this, we get the dimensions of required glass for one cell of about 3.5x3.5 mm. Data for
the production of glass sheet is available in the Ecoinvent database as production of
“flat glass, uncoated, at plant” (#806). Production data for indium tin oxide is also
available in Ecoinvent database as “ITO powder, for target production, at plant”
(#10142). There is a lack of data for the coating process of glass with indium tin oxide.
For this, the process “anti-reflex – coating, etching, solar glass” (#803) process data has
been chosen since the process is similar, and the only main difference is the input
material for the coating of the glass.
5.3 Titanium dioxide
Indium tin oxide-coated glass is covered by a thin titanium dioxide layer using
electricity and heat as energy inputs (Chen et al., 2014). Electricity and heat energy
inputs are summarized and discussed later in the Section 5.7. In this process, several
compounds are prepared and used separately and then mixed together using different
processes to form a titanium dioxide layer on the indium tin oxide-coated glass (Chen
et al., 2014). Due to lack of production data for these separate materials, an already
premixed titanium dioxide named “titanium dioxide, production mix, at plant” (#3550)
in the Ecoinvent database is used in this study.
5.4 Perovskite layer
The perovskite layer consists of two materials – methylammonium iodide (CH3NH3I)
and lead (II) iodide (PbI2) mixed together to form crystals. There are several
technologies to achieve this perovskite layer. One of the proposed technologies is to
premix the two main materials in a solution and to form a layer of perovskite (Fan et
al., 2014). But it was found out that this method results in an incomplete surface
coverage, which then results in lower performance of the cell and lower total efficiency
(Fan et al., 2014). Another proposed process by Fan et al. (2014) is to use spin coating
to cover the surface with lead iodide, and then to dip the film into an organic salt
solution.
During the spin coating with vapour assisted deposition, lead (II) iodide is deposited on
the film’s surface using the spin coating technology, and the methylamine is then
sprayed onto film via vapour assisted solution process (Chen et al., 2014).
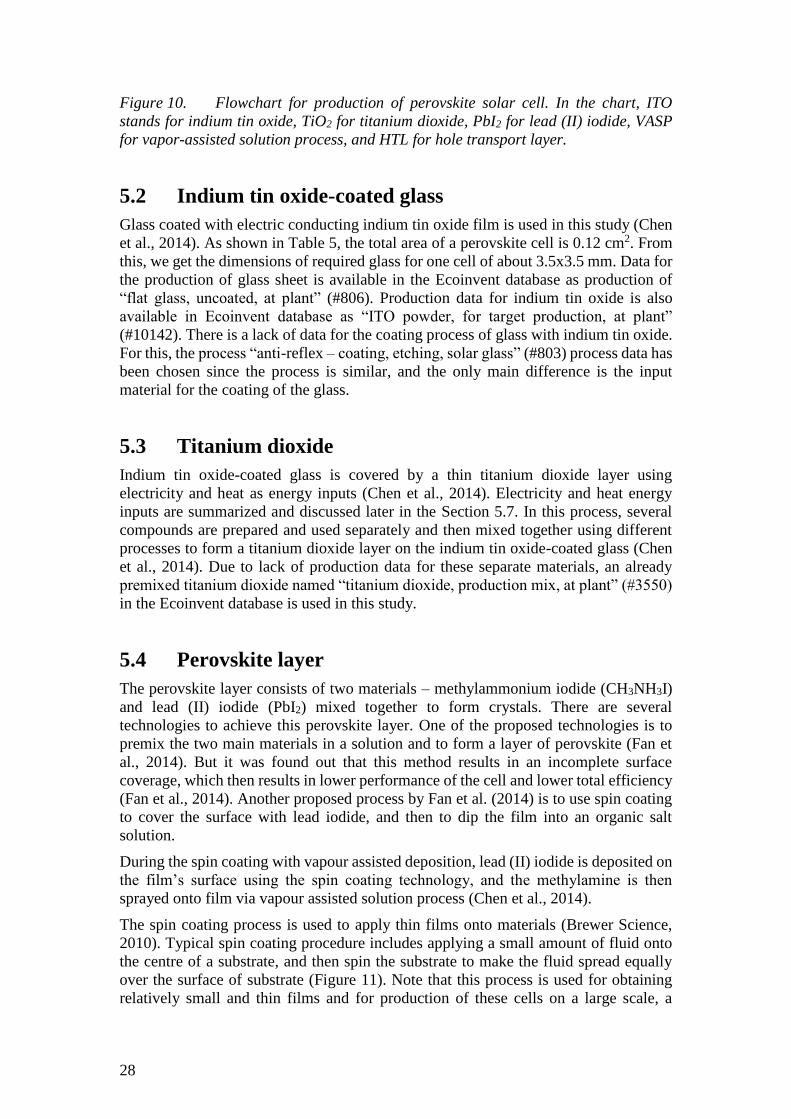
The spin coating process is used to apply thin films onto materials (Brewer Science,
2010). Typical spin coating procedure includes applying a small amount of fluid onto
the centre of a substrate, and then spin the substrate to make the fluid spread equally
over the surface of substrate (Figure 11). Note that this process is used for obtaining
relatively small and thin films and for production of these cells on a large scale, a
29
modified process or completely other process may be required. But considering a
prospective nature of this study and the lack of data for large scale production of
perovskite cells, this process with its energy and material use is investigated as one
scenario in this study.
Figure 11. Principle of spin coating process. Figure modified from Brewer Science
(2010).
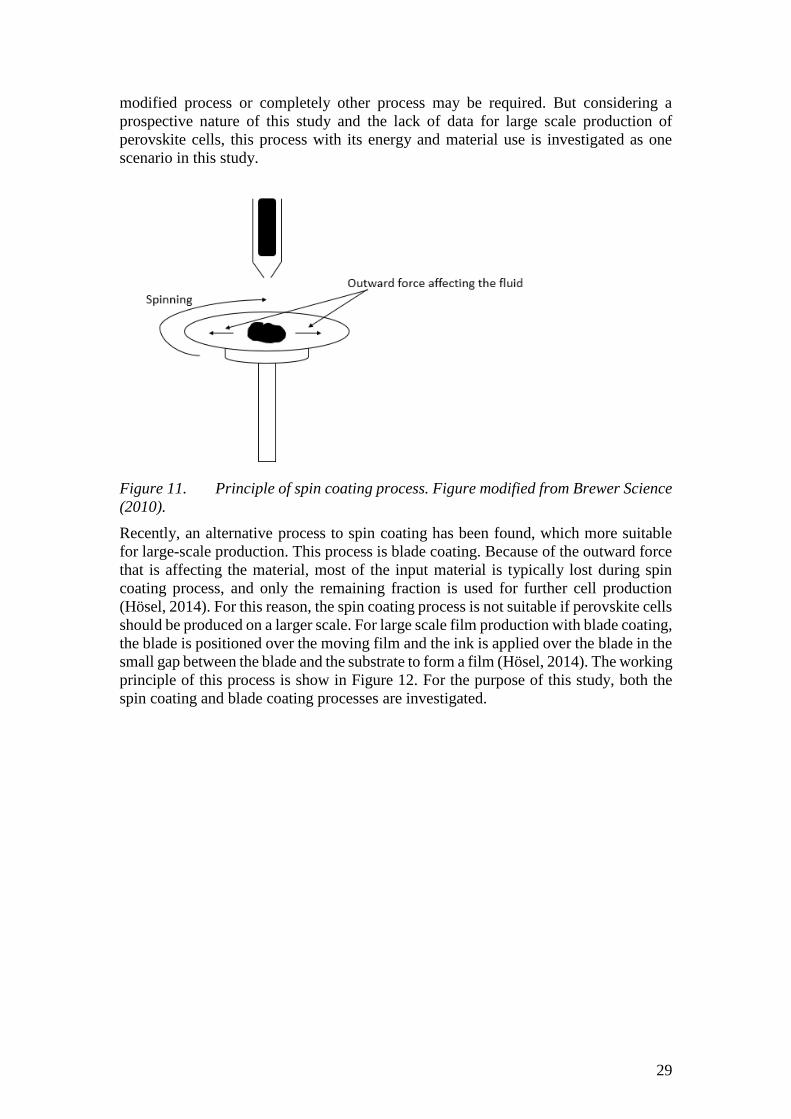
Recently, an alternative process to spin coating has been found, which more suitable
for large-scale production. This process is blade coating. Because of the outward force
that is affecting the material, most of the input material is typically lost during spin
coating process, and only the remaining fraction is used for further cell production
(Hösel, 2014). For this reason, the spin coating process is not suitable if perovskite cells
should be produced on a larger scale. For large scale film production with blade coating,
the blade is positioned over the moving film and the ink is applied over the blade in the
small gap between the blade and the substrate to form a film (Hösel, 2014). The working
principle of this process is show in Figure 12. For the purpose of this study, both the
spin coating and blade coating processes are investigated.
30
Figure 12. Principle of blade coating process. Figure modified from Hösel (2014).
Vapor-assisted solution deposition process gives several advantages compared to spin
coating and dipping, or depositing already premixed solution over the thin film (Fan et
al., 2014):
- Lower temperatures are required for the process, which results in lower energy
demands for the production
- Full coverage of the surface and low roughness of the surface. This leads to a
higher performance of the cell and an increased overall efficiency
- Thermodynamic stability of the perovskite crystals over the growth process,
yielding good grain structure.
Lead (II) iodide (PbI2) is acquired directly from the producer as described by Chen et
al. (2014). For this study, there was no data found for the production of this material
and the material had to be decomposed into main elements with respect to available
data in the Ecoinvent database. The main reaction to produce PbI2 is as given below
(Clark, 2004):
𝑃𝑏(𝑁𝑂3)2 + 2𝐾𝐼 → 𝑃𝑏𝐼2 + 2𝐾𝑁𝑂3
Data for potassium iodide (KI) was obtained from Ecoinvent (#50). Lead (II) nitrate
(Pb(NO3)2) had to be decomposed further in order to obtain data for the production of
materials (Clark, 2004):
𝑃𝑏 + 2𝑁𝑂3 → 𝑃𝑏(𝑁𝑂3)2
31
Lead (Pb) and nitric acid (NO3) were found available in the Ecoinvent database as
“Lead, at regional storage” (#1103) and “Nitric acid, 50% in H2O, at plant” (#299)
respectively.
Methylammonium iodide is produced via the reaction described by Chen et al (2014):
24 mL of methylamine and 10 mL of hydroiodic acid are mixed in a round flask for two
hours. Data for the components were found in the Ecoinvent database as “Methylamine,
at plant” (#11250). Because of no data in the Ecoinvent database, a similar process
regarding material and energy use was chosen instead of hydroiodic acid:
“Hydrochloric acid, 36% in H2O” (#6249). To account for the masses that are used in
the reactions, stoichiometry calculations based on molar masses were used to account
for the amount of hydrochloric acid that would be used instead of hydroiodic acid. The
reaction as described by Chen et al (2014) looks as follows:
𝐶𝐻3𝑁𝐻2 + 𝐻𝐼 → 𝐶𝐻3𝑁𝐻3𝐼
The resulting product was dissolved in ethanol (#6627) with a mixture of diethyl ether
(#6623), and after drying in the vacuum, the mixture is ready to be spread over the film
via vapor deposition process, as described by Chen et al (2014).
There are several suggestions for the mass ratio of the lead iodide and
methylammonium iodide parts of perovskite film (1:1, 1:3, 1:4) (Chen et al., 2014), but
for this study, a molar mass ratio of 1:1 was chosen.
5.5 Hole transport layer
The hole transport material (Spiro-OMeTAD) is deposited onto the perovskite layer
using the same spin coating technology as for lead iodide (Chen et al., 2014). Main
materials used here are 9 mg of chlorobenzene and 3.4 mg of acetonitrile to form hole
transport layer (Chen et al., 2014). Required components were available in the
Ecoinvent database as “Monochlorobenzene, at plant” (#6650) and “Acetonitrile, at
plant” (#6613). According to Fan et al. (2014), most of the recent high-efficiency
perovskite solar cells use this material as hole transport layer to achieve an as high
efficiency as possible.
5.6 Back contact
As the final layer, a silver back contact is added using thermal evaporation technique.
In the Ecoinvent database, the process named “Silver, at regional storage” (#10153) is
chosen as a process for silver production.
5.7 Energy use
For the deposition of each layer of the cell, different sources and amounts of energy are
required. In this study, the two main types of energy used in these processes are taken
into account: electricity used in the spin coating processes and heat used during drying
and heating. By knowing the exact power rating of the spin coating equipment and the
source of the heating supply (which for this study is assumed by the average heating
supply of the region), the electricity and heat requirement can be calculated (Table 7).
32
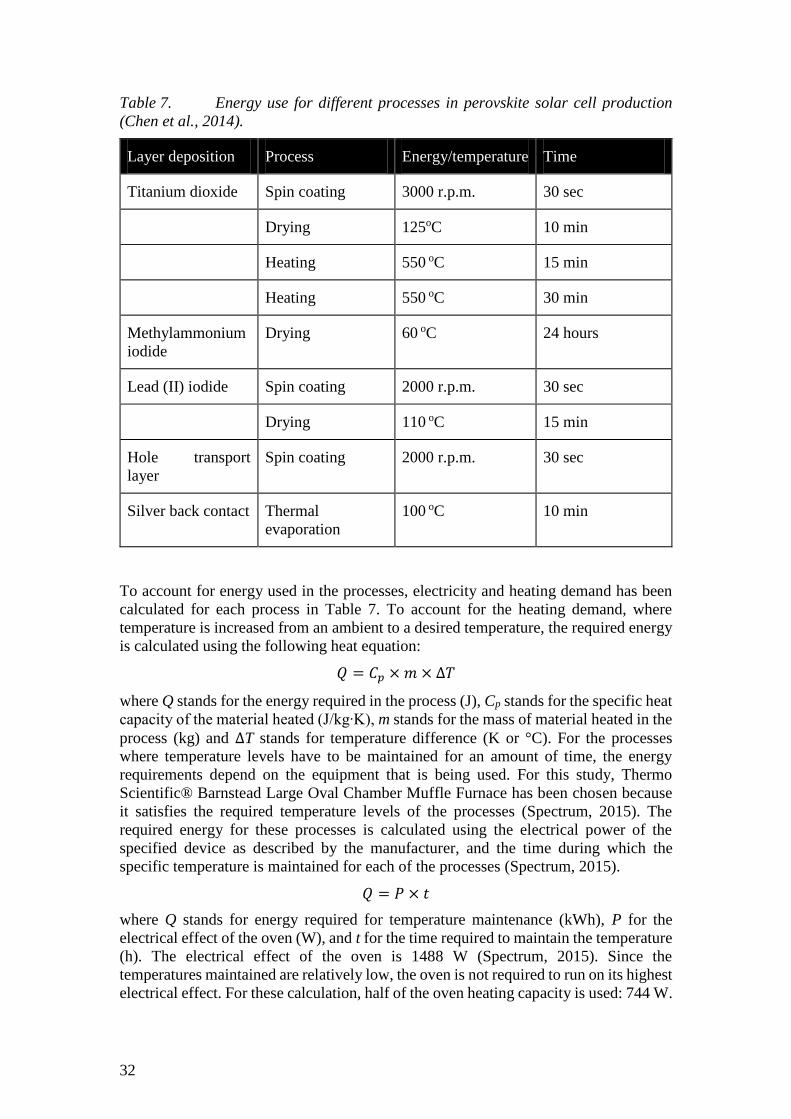
Table 7. Energy use for different processes in perovskite solar cell production
(Chen et al., 2014).
Layer deposition Process Energy/temperature Time
Titanium dioxide Spin coating 3000 r.p.m. 30 sec
Drying 125oC 10 min
Heating 550 oC 15 min
Heating 550 oC 30 min
Methylammonium
iodide
Drying 60 oC 24 hours
Lead (II) iodide Spin coating 2000 r.p.m. 30 sec
Drying 110 oC 15 min
Hole transport
layer
Spin coating 2000 r.p.m. 30 sec
Silver back contact Thermal
evaporation
100 oC 10 min
To account for energy used in the processes, electricity and heating demand has been
calculated for each process in Table 7. To account for the heating demand, where
temperature is increased from an ambient to a desired temperature, the required energy
is calculated using the following heat equation:
𝑄 = 𝐶𝑝 × 𝑚 × ∆𝑇
where Q stands for the energy required in the process (J), Cp stands for the specific heat
capacity of the material heated (J/kg∙K), m stands for the mass of material heated in the
process (kg) and ∆T stands for temperature difference (K or °C). For the processes
where temperature levels have to be maintained for an amount of time, the energy
requirements depend on the equipment that is being used. For this study, Thermo
Scientific® Barnstead Large Oval Chamber Muffle Furnace has been chosen because
it satisfies the required temperature levels of the processes (Spectrum, 2015). The
required energy for these processes is calculated using the electrical power of the
specified device as described by the manufacturer, and the time during which the
specific temperature is maintained for each of the processes (Spectrum, 2015).
𝑄 = 𝑃 × 𝑡
where Q stands for energy required for temperature maintenance (kWh), P for the
electrical effect of the oven (W), and t for the time required to maintain the temperature
(h). The electrical effect of the oven is 1488 W (Spectrum, 2015). Since the
temperatures maintained are relatively low, the oven is not required to run on its highest
electrical effect. For these calculation, half of the oven heating capacity is used: 744 W.
33
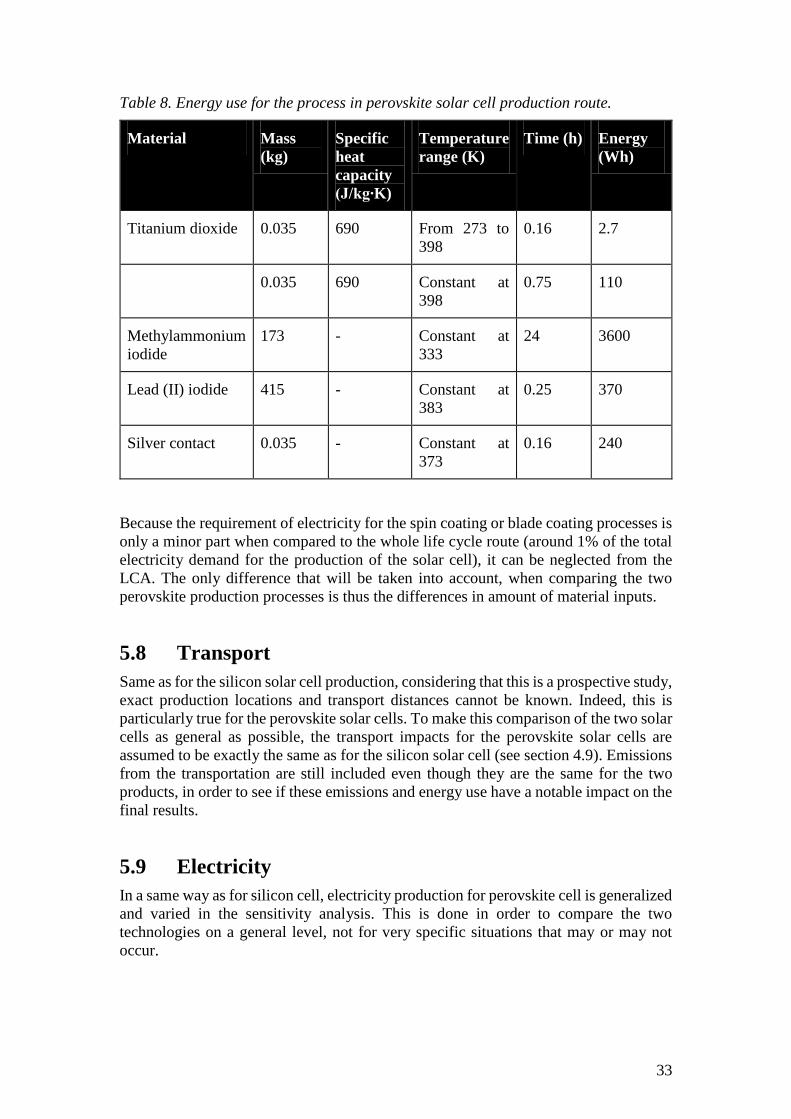
Table 8. Energy use for the process in perovskite solar cell production route.
Material Mass
(kg)
Specific
heat
capacity
(J/kg∙K)
Temperature
range (K)
Time (h) Energy
(Wh)
Titanium dioxide 0.035 690 From 273 to
398
0.16 2.7
0.035 690 Constant at
398
0.75 110
Methylammonium
iodide
173 - Constant at
333
24 3600
Lead (II) iodide 415 - Constant at
383
0.25 370
Silver contact 0.035 - Constant at
373
0.16 240
Because the requirement of electricity for the spin coating or blade coating processes is
only a minor part when compared to the whole life cycle route (around 1% of the total
electricity demand for the production of the solar cell), it can be neglected from the
LCA. The only difference that will be taken into account, when comparing the two
perovskite production processes is thus the differences in amount of material inputs.
5.8 Transport
Same as for the silicon solar cell production, considering that this is a prospective study,
exact production locations and transport distances cannot be known. Indeed, this is
particularly true for the perovskite solar cells. To make this comparison of the two solar
cells as general as possible, the transport impacts for the perovskite solar cells are
assumed to be exactly the same as for the silicon solar cell (see section 4.9). Emissions
from the transportation are still included even though they are the same for the two
products, in order to see if these emissions and energy use have a notable impact on the
final results.
5.9 Electricity
In a same way as for silicon cell, electricity production for perovskite cell is generalized
and varied in the sensitivity analysis. This is done in order to compare the two
technologies on a general level, not for very specific situations that may or may not
occur.
34
6 Impact assessment
This chapter demonstrates findings from the study and the sensitivity of different
parameters is assessed.
6.1 Sensitivity analysis
In order to compare the two solar cells thoroughly and transparently, the variation of
several parameters has to be considered. These parameters that are varied should have
a notable effect on the amount of emissions released or the energy used of the
production of solar cells. Because of the relatively low impact of the total emissions
from transportation (1.5-3% for toxicity and energy use, for both toxicity assessment
methods), transportation is not selected as one of the varied parameters. The parameters
that are varied for the sensitivity analysis are instead the ones presented below:
- Lead source for the production of perovskite solar cells. Since lead is one of
the main components for perovskite solar cells and one of the main topics of
this study, it is important to consider different options for obtaining this
material. Three different scenarios regarding lead origin are investigated in this
study. The first is that all of the lead required for the production of perovskite
solar cells comes directly from mining, meaning that the lead is pristine. The
second is that all of the lead required for the production comes from recycling.
The third is that half of the lead comes from mining processes and the other half
from recycling. This parameter can be varied using data from the Ecoinvent
database. The process “Lead, primary, at plant” (#10777) describes energy use
and emissions from the production of lead with sinter/blast furnace and direct
smelting process. This process uses lead concentrates that originates from
mining. For the second scenario, the data set “Lead, secondary, from electronic
scrap and recycling, at plant” (#8138) is used. This option represents a best case
scenario where all of the lead comes from recycling. If considering large-scale
production possibilities for the perovskite solar cells in the future, recycling as
a way of obtaining lead for the production, could be a too small a source,
considering different recycling rates in different regions of the world. The third
scenario combines the two previous sources of lead in a 1:1 mass ratio, meaning
that half of the lead comes from mining and the other half originates from
recycling.
- Electricity production mix. For this study, three scenarios of electricity
production mix were investigated in order to see how emissions from different
energy sources would influence the final results. In one scenario, all of the
electricity required for the production of both cells is supplied from coal-fired
power plants (representing high-emission electricity production in general). In
another scenario, half of the total electricity is supplied form coal-fired power
plants and the other half is produced in natural gas power plants (roughly
representing current central European electricity production). In a third
scenario, half of electricity is produced from nuclear power plants and the other
half coming from hydropower plants (roughly representing current electricity
production in Sweden, but also low-emission electricity production in general).
35
- Film production process. For this parameter, two scenarios are investigated.
The first is production of perovskite solar cells using only spin coating for the
deposition of film layers. The second is production of perovskite cells using
blade coating to deploy the film layers. The main consideration here is the use
of materials, where blade coating technology is more applicable for large scale
production since it has a lower material input. While the energy use is neglected
for these processes (see section 5.7 for motivation), the considerable difference
in amount of material input between the two processes has a large influence on
the impact of the perovskite life cycle. For this parameter, using spin coating
represents a worst case scenario and using blade coating represents a best case
scenario.
- Lead loss emissions. For this parameter, loss of lead to the environment during
two processes is considered. Several variations of this parameter are taken into
account. For one case, there is no lead emitted during the production of
perovskite solar cells, and no lead emitted during the use and recycling. Another
case investigates a scenario where all of the lead lost during production process
is emitted to the environment. Finally, in a third case, all of the lead that is
contained in perovskite solar cells is emitted to the environment (during the use
phase and/or recycling). This parameter should emphasize in which process it
is extra important to manage the loss of lead and avoid emissions to the
environment.
In this study, the parameters were varied in the following order: First, a possible future
best case scenario was created as a baseline scenario. This case includes the Swedish
electricity mix (half hydro and half nuclear), blade coating technology as the film
deposition process, the entire supply of lead for the production of perovskite cells comes
from recycling, and no lead loss emissions throughout the entire life cycle (neither
during production nor in the use phase and/or recycling). This case is referred to as
“best” in the following graphs.
Energy production parameters are changed next. “Gas/coal” represents half of the
electricity from coal and half from natural gas for both studied cells. The case “coal”
represents electricity production mix based entirely on coal-fired power plants.
This is followed up by changing the lead sources for the production of perovskite solar
cells. The case where half of lead is supplied from mining and the other half is supplied
from recycling is referred to as “50/50 lead recycled/mining” in the graphs. After this,
all of the lead from recycling is removed, and the supply of this material is considered
to be only from mining process, and referred to as “Lead mined”.
Next, the lead loss emissions are investigated. The case where all lead waste during the
production of solar cell is emitted to the environment, is presented as “lead production
loss”. And the other case, where all lead contained in the solar cell is emitted to the
environment either during the use phase or during recycling, is presented as “lead
content lost”.
Finally, the film deposition technology was changed from blade coating technology to
spin coating technology to represent energy use and emission differences between the
two processes. This is referred to as “Spin coating” in the following graphs.
36
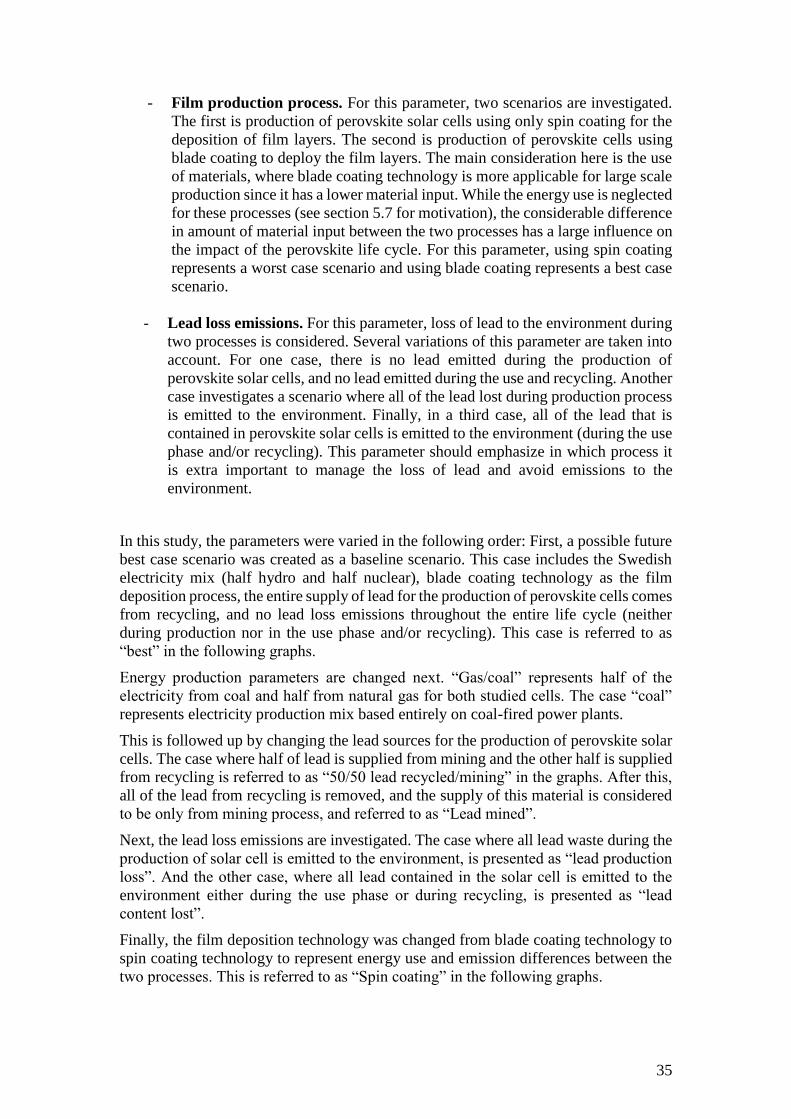
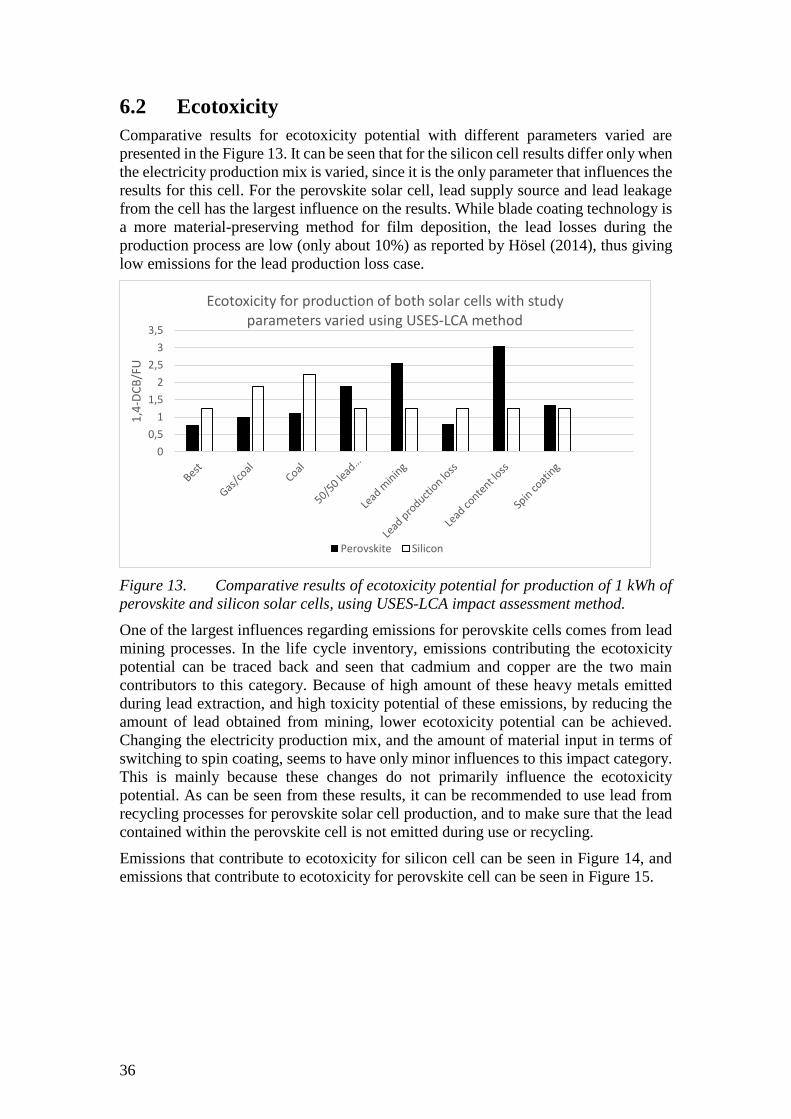
6.2 Ecotoxicity
Comparative results for ecotoxicity potential with different parameters varied are
presented in the Figure 13. It can be seen that for the silicon cell results differ only when
the electricity production mix is varied, since it is the only parameter that influences the
results for this cell. For the perovskite solar cell, lead supply source and lead leakage
from the cell has the largest influence on the results. While blade coating technology is
a more material-preserving method for film deposition, the lead losses during the
production process are low (only about 10%) as reported by Hösel (2014), thus giving
low emissions for the lead production loss case.
Figure 13. Comparative results of ecotoxicity potential for production of 1 kWh of
perovskite and silicon solar cells, using USES-LCA impact assessment method.
One of the largest influences regarding emissions for perovskite cells comes from lead
mining processes. In the life cycle inventory, emissions contributing the ecotoxicity
potential can be traced back and seen that cadmium and copper are the two main
contributors to this category. Because of high amount of these heavy metals emitted
during lead extraction, and high toxicity potential of these emissions, by reducing the
amount of lead obtained from mining, lower ecotoxicity potential can be achieved.
Changing the electricity production mix, and the amount of material input in terms of
switching to spin coating, seems to have only minor influences to this impact category.
This is mainly because these changes do not primarily influence the ecotoxicity
potential. As can be seen from these results, it can be recommended to use lead from
recycling processes for perovskite solar cell production, and to make sure that the lead
contained within the perovskite cell is not emitted during use or recycling.
Emissions that contribute to ecotoxicity for silicon cell can be seen in Figure 14, and
emissions that contribute to ecotoxicity for perovskite cell can be seen in Figure 15.
0
0,5
1
1,5
2
2,5
3
3,5
1,4
-DC
B/F
U
Ecotoxicity for production of both solar cells with study parameters varied using USES-LCA method
Perovskite Silicon

37
Figure 14. Emissions that contribute to ecotoxicity for silicon solar cell using the
USES-LCA impact assessment method for the best case scenario.
Figure 15. Emissions that contribute to ecotoxicity for perovskite solar cell using
the USES-LCA impact assessment method for the best case scenario.
Using the USEtox method for toxicity impact assessment gives results that emphasize
emissions from lead mining even more, as can be seen in Figure 16. This can be seen
from the case where half of lead to the production process of perovskite cell is supplied
from recycling. Notably, regardless of which impact assessment method is used, the
crucial parameters for the perovskite cell are the same, emphasizing the importance of
lead supply source and the importance of maintaining the lead in a cell during the use
and recycling phases of a cell’s life cycle.
0
0,2
0,4
0,6
0,8
1
1,2
1,4
1,61
,4-D
CB
/FU
Contributing emissions for ecotoxicity potential of silicon cell using USES-LCA
0
0,1
0,2
0,3
0,4
0,5
0,6
1,4
-DC
B/F
U
Contributing emissions for ecotoxicity potential of perovskite cell using USES-LCA
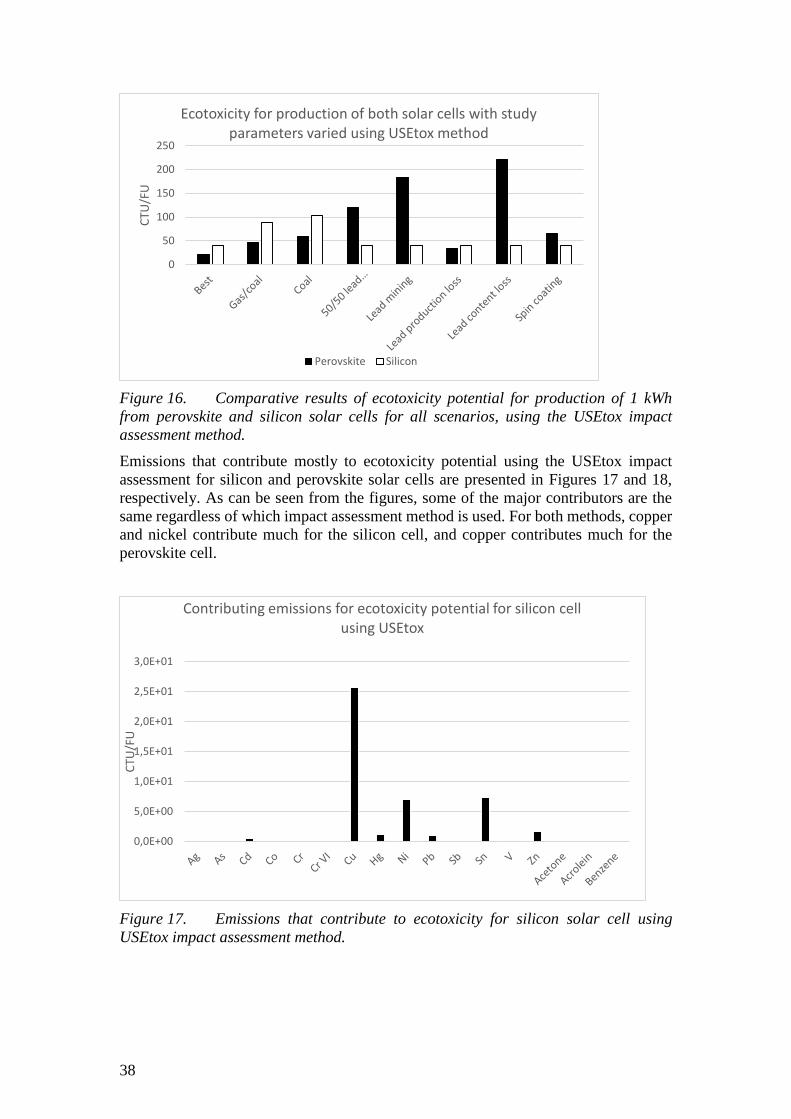
38
Figure 16. Comparative results of ecotoxicity potential for production of 1 kWh
from perovskite and silicon solar cells for all scenarios, using the USEtox impact
assessment method.
Emissions that contribute mostly to ecotoxicity potential using the USEtox impact
assessment for silicon and perovskite solar cells are presented in Figures 17 and 18,
respectively. As can be seen from the figures, some of the major contributors are the
same regardless of which impact assessment method is used. For both methods, copper
and nickel contribute much for the silicon cell, and copper contributes much for the
perovskite cell.
Figure 17. Emissions that contribute to ecotoxicity for silicon solar cell using
USEtox impact assessment method.
0
50
100
150
200
250C
TU/F
U
Ecotoxicity for production of both solar cells with study parameters varied using USEtox method
Perovskite Silicon
0,0E+00
5,0E+00
1,0E+01
1,5E+01
2,0E+01
2,5E+01
3,0E+01
CTU
/FU
Contributing emissions for ecotoxicity potential for silicon cell using USEtox

39
Figure 18. Emissions that contribute to the ecotoxicity of the perovskite solar cell
using the USEtox impact assessment method for the best case scenario.
6.3 Human toxicity potential
Comparative results for human toxicity potential for different scenarios are presented
in Figure 19. As seen from Figure 19, there are major differences for different scenarios
for the perovskite cell. Major contributors to this category can be traced back in life
cycle inventory and identified as arsenic and cadmium for perovskite solar cells. As for
the ecotoxicity impact category, most of these emissions come from lead mining
process. That is why changing the ratio of lead supplied by recycling has a major
influence on the final results. And because of higher characterization factors of arsenic
and cadmium for human toxicity than for ecotoxicity, these emissions have a more
profound contribution here.
Figure 19. Comparative results of human toxicity potential for production of 1 kWh
from perovskite and silicon solar cells using the USES-LCA impact assessment method
0
10
20
30
40
50
60
70
80
Ag As Ba Be Cd Co Cr CrVI
Cu Hg Mo Ni Pb Sb Se Sn Ti V Zn
CTU
/FU
Contributing emissions for ecotoxicity potential for perovskite cell using USEtox
0
50
100
150
200
250
300
350
400
1,4
-DC
B/F
U
Human toxicity potential for production of both solar cells with study parameters varied using USES-LCA method
Perovskite Silicon
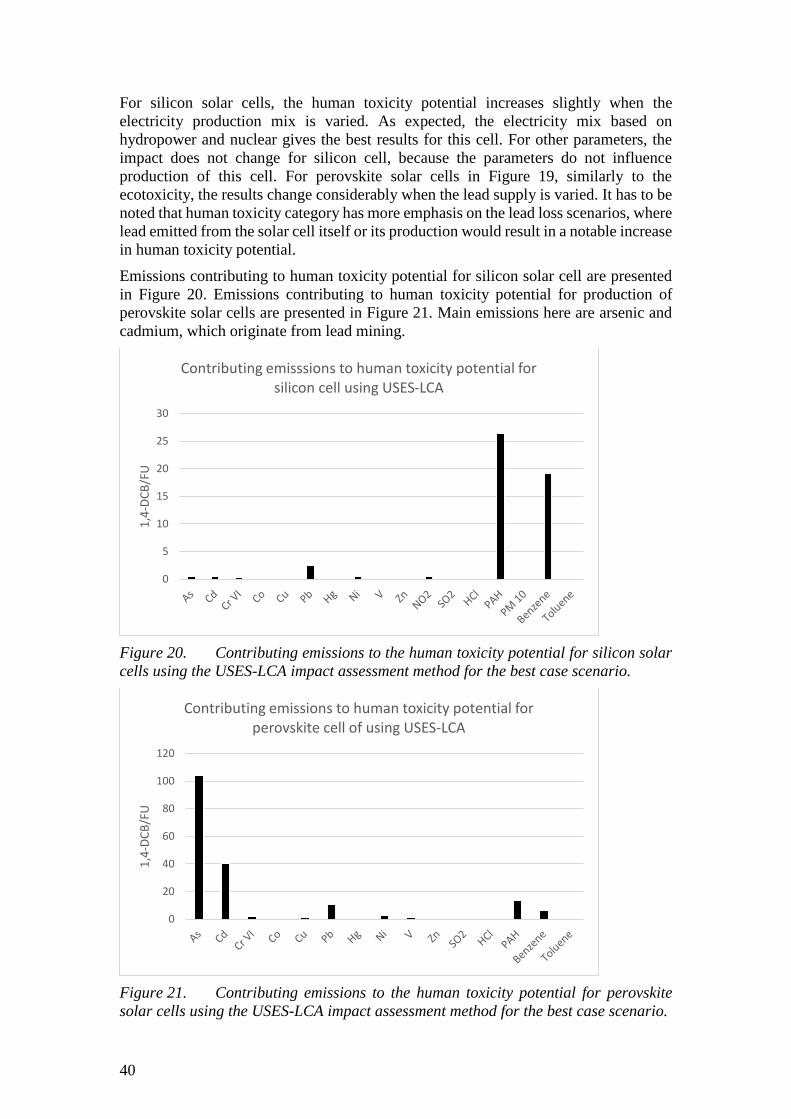
40
For silicon solar cells, the human toxicity potential increases slightly when the
electricity production mix is varied. As expected, the electricity mix based on
hydropower and nuclear gives the best results for this cell. For other parameters, the
impact does not change for silicon cell, because the parameters do not influence
production of this cell. For perovskite solar cells in Figure 19, similarly to the
ecotoxicity, the results change considerably when the lead supply is varied. It has to be
noted that human toxicity category has more emphasis on the lead loss scenarios, where
lead emitted from the solar cell itself or its production would result in a notable increase
in human toxicity potential.
Emissions contributing to human toxicity potential for silicon solar cell are presented
in Figure 20. Emissions contributing to human toxicity potential for production of
perovskite solar cells are presented in Figure 21. Main emissions here are arsenic and
cadmium, which originate from lead mining.
Figure 20. Contributing emissions to the human toxicity potential for silicon solar
cells using the USES-LCA impact assessment method for the best case scenario.
Figure 21. Contributing emissions to the human toxicity potential for perovskite
solar cells using the USES-LCA impact assessment method for the best case scenario.
0
5
10
15
20
25
30
1,4
-DC
B/F
U
Contributing emisssions to human toxicity potential for silicon cell using USES-LCA
0
20
40
60
80
100
120
1,4
-DC
B/F
U
Contributing emissions to human toxicity potential for perovskite cell of using USES-LCA
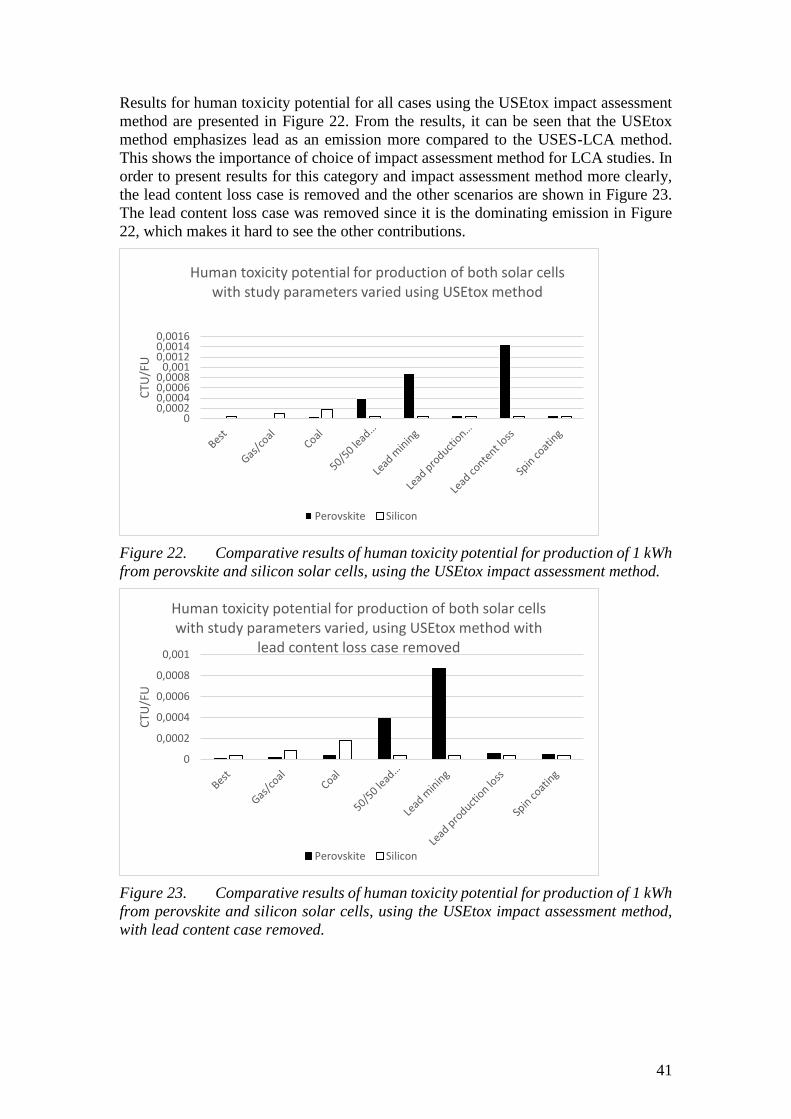
41
Results for human toxicity potential for all cases using the USEtox impact assessment
method are presented in Figure 22. From the results, it can be seen that the USEtox
method emphasizes lead as an emission more compared to the USES-LCA method.
This shows the importance of choice of impact assessment method for LCA studies. In
order to present results for this category and impact assessment method more clearly,
the lead content loss case is removed and the other scenarios are shown in Figure 23.
The lead content loss case was removed since it is the dominating emission in Figure
22, which makes it hard to see the other contributions.
Figure 22. Comparative results of human toxicity potential for production of 1 kWh
from perovskite and silicon solar cells, using the USEtox impact assessment method.
Figure 23. Comparative results of human toxicity potential for production of 1 kWh
from perovskite and silicon solar cells, using the USEtox impact assessment method,
with lead content case removed.
00,00020,00040,00060,0008
0,0010,00120,00140,0016
CTU
/FU
Human toxicity potential for production of both solar cells with study parameters varied using USEtox method
Perovskite Silicon
0
0,0002
0,0004
0,0006
0,0008
0,001
CTU
/FU
Human toxicity potential for production of both solar cells with study parameters varied, using USEtox method with
lead content loss case removed
Perovskite Silicon
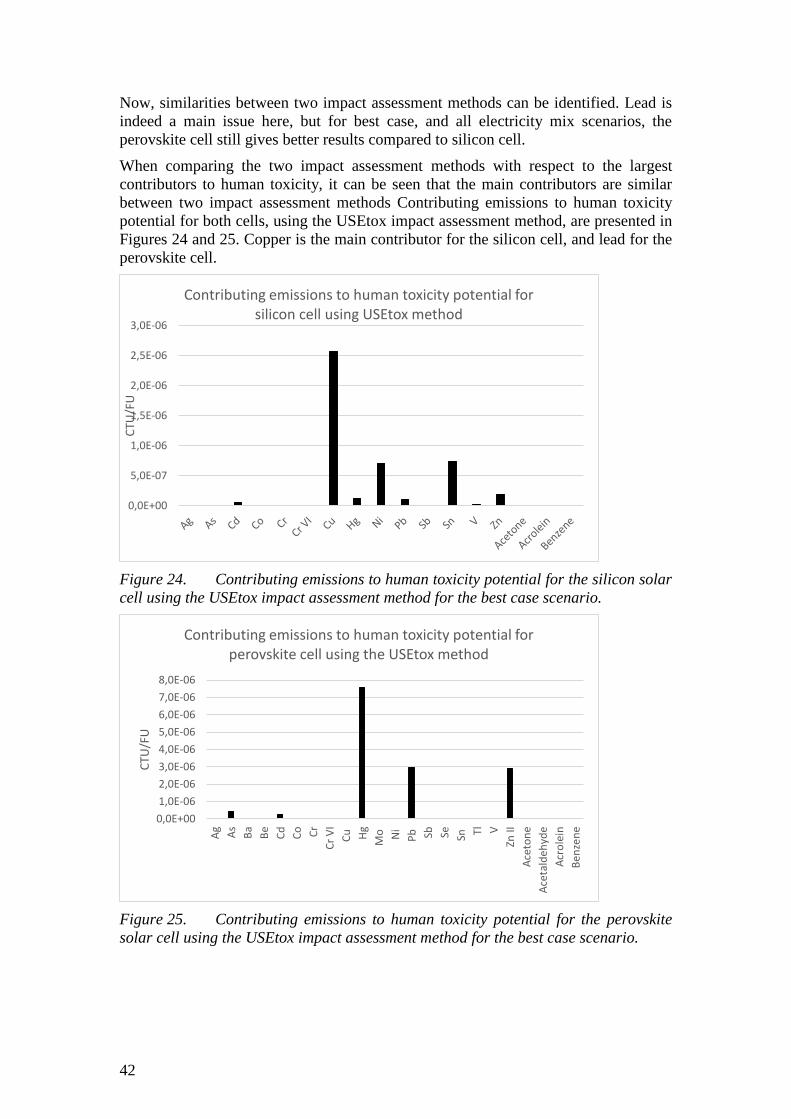
42
Now, similarities between two impact assessment methods can be identified. Lead is
indeed a main issue here, but for best case, and all electricity mix scenarios, the
perovskite cell still gives better results compared to silicon cell.
When comparing the two impact assessment methods with respect to the largest
contributors to human toxicity, it can be seen that the main contributors are similar
between two impact assessment methods Contributing emissions to human toxicity
potential for both cells, using the USEtox impact assessment method, are presented in
Figures 24 and 25. Copper is the main contributor for the silicon cell, and lead for the
perovskite cell.
Figure 24. Contributing emissions to human toxicity potential for the silicon solar
cell using the USEtox impact assessment method for the best case scenario.
Figure 25. Contributing emissions to human toxicity potential for the perovskite
solar cell using the USEtox impact assessment method for the best case scenario.
0,0E+00
5,0E-07
1,0E-06
1,5E-06
2,0E-06
2,5E-06
3,0E-06
CTU
/FU
Contributing emissions to human toxicity potential for silicon cell using USEtox method
0,0E+00
1,0E-06
2,0E-06
3,0E-06
4,0E-06
5,0E-06
6,0E-06
7,0E-06
8,0E-06
Ag As
Ba
Be
Cd
Co Cr
Cr
VI
Cu Hg
Mo Ni
Pb Sb Se Sn Tl V
Zn II
Ace
ton
e
Ace
tald
ehyd
e
Acr
ole
in
Ben
zen
e
CTU
/FU
Contributing emissions to human toxicity potential for perovskite cell using the USEtox method

43
6.4 Energy use
For this impact category, total energy demand is separated into thermal energy and
electric energy. Demand for thermal energy for all cases is presented in Figure 26.
Because there are no parameters that are changed in the sensitivity analysis that would
affect the demand of heat or electricity for silicon solar cell, there are no changes in this
energy use for this cell and thus the result for this cell is presented only once in Figure
26. For the perovskite cell, most of the heat energy is required for lead mining, and
reducing the amount of lead from the mining in favor of recycled lead results in lower
demand for thermal energy. Also, using the blade coating technology instead of spin
coating results in lower material input and thus also in lower thermal energy demand
Figure 26. Total thermal energy demand for production of silicon and perovskite
solar cells, for all scenarios.
It can be seen that for the best case and all electricity mix scenarios, the thermal energy
demand for the perovskite cell is slightly lower than for the silicon cell, but increases
largely when some other parameters are changed. This can be explained that for
production of perovskite cells, mostly chemical processes where the demand for
thermal energy is high are used, for example for mixing of the chemicals and
maintaining temperatures at specific levels.
As for the thermal energy demand, there are no changes of electric energy demand for
the silicon solar cell between scenarios, because no parameters that would influence
that have been changed throughout the scenarios. Again, for the simplicity, the result
for silicon solar cell is presented only once in Figure 27, and is the same throughout all
scenarios. Electricity demand for both solar cells, and for all scenarios, is presented in
Figure 27. As can be seen from Figure 27, the electric energy demand for silicon solar
cells is higher than for perovskite solar cells for all scenarios. From the life cycle
inventory, processes that are most energy intensive can be identified. Production of high
purity solar grade silicon is the most energy demanding regarding electric energy. As
mentioned in section 4.5, this process uses the modified Siemens technology, which is
less energy demanding than usual Siemens process. Electric energy demand would be
even higher if the older technology would be used for the production of silicon solar
cells. For the perovskite solar cell, the most electricity-intensive process is production
0
200
400
600
800
1000
1200
1400
kWh
of
hea
t/FU
Total thermal energy demand for production of 1 kWh of silicon and perovskite cells
Perovskite Silicon

44
of lead (II) iodide, where various chemical processes and lead mining require much
electricity. However, by using different material deposition technologies (blade instead
of spin coating), the required amount of material input can be reduced, and thus also
the electric energy demand.
Figure 27. Total electric energy demand for production of silicon and perovskite
solar cells, for all scenarios.
0200400600800
10001200140016001800
kWh
of
elec
tric
ity/
FU
Total electric energy demand for production of 1 kWh of silicon and perovskite solar cells
Perovskite Silicon
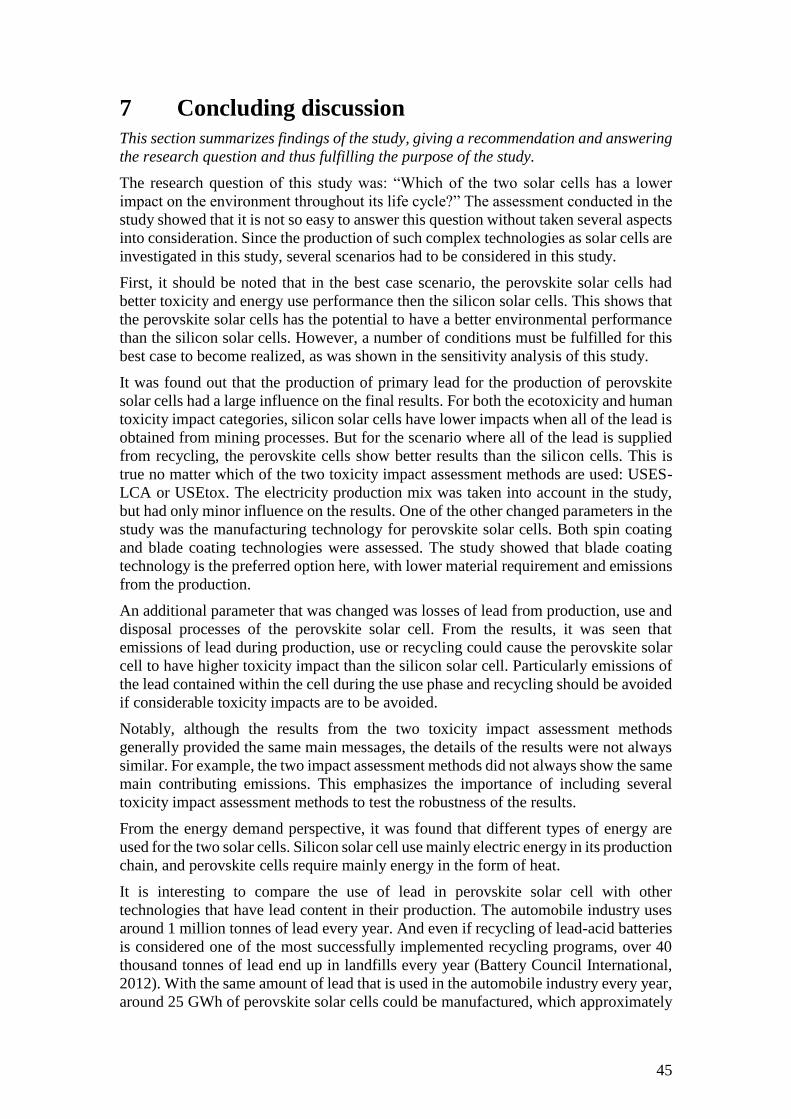
45
7 Concluding discussion
This section summarizes findings of the study, giving a recommendation and answering
the research question and thus fulfilling the purpose of the study.
The research question of this study was: “Which of the two solar cells has a lower
impact on the environment throughout its life cycle?” The assessment conducted in the
study showed that it is not so easy to answer this question without taken several aspects
into consideration. Since the production of such complex technologies as solar cells are
investigated in this study, several scenarios had to be considered in this study.
First, it should be noted that in the best case scenario, the perovskite solar cells had
better toxicity and energy use performance then the silicon solar cells. This shows that
the perovskite solar cells has the potential to have a better environmental performance
than the silicon solar cells. However, a number of conditions must be fulfilled for this
best case to become realized, as was shown in the sensitivity analysis of this study.
It was found out that the production of primary lead for the production of perovskite
solar cells had a large influence on the final results. For both the ecotoxicity and human
toxicity impact categories, silicon solar cells have lower impacts when all of the lead is
obtained from mining processes. But for the scenario where all of the lead is supplied
from recycling, the perovskite cells show better results than the silicon cells. This is
true no matter which of the two toxicity impact assessment methods are used: USES-
LCA or USEtox. The electricity production mix was taken into account in the study,
but had only minor influence on the results. One of the other changed parameters in the
study was the manufacturing technology for perovskite solar cells. Both spin coating
and blade coating technologies were assessed. The study showed that blade coating
technology is the preferred option here, with lower material requirement and emissions
from the production.
An additional parameter that was changed was losses of lead from production, use and
disposal processes of the perovskite solar cell. From the results, it was seen that
emissions of lead during production, use or recycling could cause the perovskite solar
cell to have higher toxicity impact than the silicon solar cell. Particularly emissions of
the lead contained within the cell during the use phase and recycling should be avoided
if considerable toxicity impacts are to be avoided.
Notably, although the results from the two toxicity impact assessment methods
generally provided the same main messages, the details of the results were not always
similar. For example, the two impact assessment methods did not always show the same
main contributing emissions. This emphasizes the importance of including several
toxicity impact assessment methods to test the robustness of the results.
From the energy demand perspective, it was found that different types of energy are
used for the two solar cells. Silicon solar cell use mainly electric energy in its production
chain, and perovskite cells require mainly energy in the form of heat.
It is interesting to compare the use of lead in perovskite solar cell with other
technologies that have lead content in their production. The automobile industry uses
around 1 million tonnes of lead every year. And even if recycling of lead-acid batteries
is considered one of the most successfully implemented recycling programs, over 40
thousand tonnes of lead end up in landfills every year (Battery Council International,
2012). With the same amount of lead that is used in the automobile industry every year,
around 25 GWh of perovskite solar cells could be manufactured, which approximately

46
equals the total electricity production from solar cells globally in the year 2009 (IEA,
2012). If this same amount, 1 million tonnes of lead, would indeed be used for
production of solar cells, over 60 thousand tonnes of lead would be wasted from
production (although not necessarily emitted), provided that the more efficient blade
coating technology was used. This is slightly higher than the 40 thousand tonnes for car
batteries. However, since recycling of car batteries is considered a successful recycling
program with low amounts of waste, it could be that similarly successful recycling
schemes could be implemented for perovskite solar cells, hopefully creating closed loop
systems with no net waste of lead.
In conclusion, it can be said that perovskite solar cells have potential to rival the
curently dominating silicon solar cells from an environmental perspective. If to be
produced on a large scale, and this better environmental performance is to be realized,
there are two main issues to consider: (1) the supply of lead should preferably be from
recycled lead, and (2) emissions of lead from the perovskite solar cells itself should be
avoided.
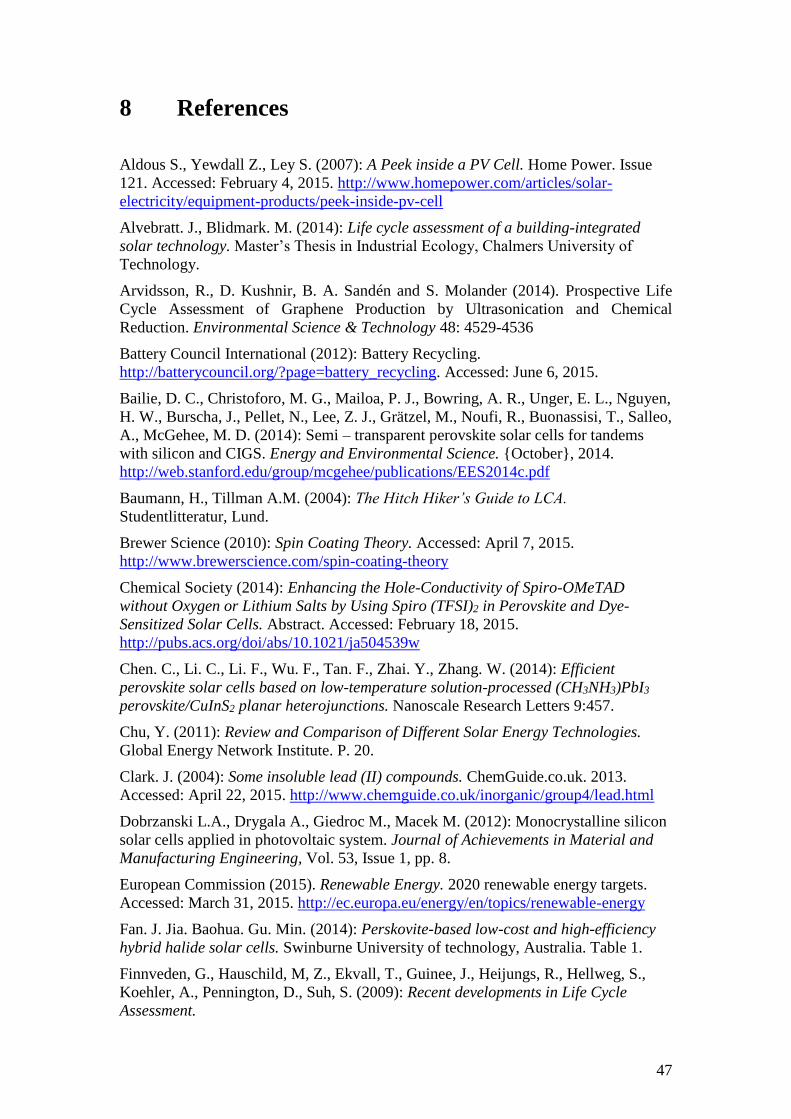
47
8 References
Aldous S., Yewdall Z., Ley S. (2007): A Peek inside a PV Cell. Home Power. Issue
121. Accessed: February 4, 2015. http://www.homepower.com/articles/solar-
electricity/equipment-products/peek-inside-pv-cell
Alvebratt. J., Blidmark. M. (2014): Life cycle assessment of a building-integrated
solar technology. Master’s Thesis in Industrial Ecology, Chalmers University of
Technology.
Arvidsson, R., D. Kushnir, B. A. Sandén and S. Molander (2014). Prospective Life
Cycle Assessment of Graphene Production by Ultrasonication and Chemical
Reduction. Environmental Science & Technology 48: 4529-4536
Battery Council International (2012): Battery Recycling.
http://batterycouncil.org/?page=battery_recycling. Accessed: June 6, 2015.
Bailie, D. C., Christoforo, M. G., Mailoa, P. J., Bowring, A. R., Unger, E. L., Nguyen,
H. W., Burscha, J., Pellet, N., Lee, Z. J., Grätzel, M., Noufi, R., Buonassisi, T., Salleo,
A., McGehee, M. D. (2014): Semi – transparent perovskite solar cells for tandems
with silicon and CIGS. Energy and Environmental Science. {October}, 2014.
http://web.stanford.edu/group/mcgehee/publications/EES2014c.pdf
Baumann, H., Tillman A.M. (2004): The Hitch Hiker’s Guide to LCA.
Studentlitteratur, Lund.
Brewer Science (2010): Spin Coating Theory. Accessed: April 7, 2015.
http://www.brewerscience.com/spin-coating-theory
Chemical Society (2014): Enhancing the Hole-Conductivity of Spiro-OMeTAD
without Oxygen or Lithium Salts by Using Spiro (TFSI)2 in Perovskite and Dye-
Sensitized Solar Cells. Abstract. Accessed: February 18, 2015.
http://pubs.acs.org/doi/abs/10.1021/ja504539w
Chen. C., Li. C., Li. F., Wu. F., Tan. F., Zhai. Y., Zhang. W. (2014): Efficient
perovskite solar cells based on low-temperature solution-processed (CH3NH3)PbI3
perovskite/CuInS2 planar heterojunctions. Nanoscale Research Letters 9:457.
Chu, Y. (2011): Review and Comparison of Different Solar Energy Technologies.
Global Energy Network Institute. P. 20.
Clark. J. (2004): Some insoluble lead (II) compounds. ChemGuide.co.uk. 2013.
Accessed: April 22, 2015. http://www.chemguide.co.uk/inorganic/group4/lead.html
Dobrzanski L.A., Drygala A., Giedroc M., Macek M. (2012): Monocrystalline silicon
solar cells applied in photovoltaic system. Journal of Achievements in Material and
Manufacturing Engineering, Vol. 53, Issue 1, pp. 8.
European Commission (2015). Renewable Energy. 2020 renewable energy targets.
Accessed: March 31, 2015. http://ec.europa.eu/energy/en/topics/renewable-energy
Fan. J. Jia. Baohua. Gu. Min. (2014): Perskovite-based low-cost and high-efficiency
hybrid halide solar cells. Swinburne University of technology, Australia. Table 1.
Finnveden, G., Hauschild, M, Z., Ekvall, T., Guinee, J., Heijungs, R., Hellweg, S.,
Koehler, A., Pennington, D., Suh, S. (2009): Recent developments in Life Cycle
Assessment.

48
Florida Solar Energy Center (2010): Test Method for Photovoltaic Module Power
Rating. FSEC Standard, 2010.
http://www.fsec.ucf.edu/en/publications/pdf/standards/FSECstd_202-10.pdf
Four Peaks Technologies, Inc. (2011): Solar In-Depth. Solar Cell Central. Accessed:
February 4, 2015. http://solarcellcentral.com/solar_page.html
Fthenakis, V., Hyung, C.K., Frischknecht, R., Raugei, M., Sinha, P., Stucki, M.
(2011): Life Cycle Inventories and Life Cycle Assessments of Photovoltaics Systems.
International Energy Agency. {October}, 2011.
Goedkoop, M., R. Heijungs, M. Huijbregts, A. De Schryver, J. Struijs and R. van Zelm
(2013). ReCiPe 2008. A life cycle impact assessment method which comprises
harmonised category indicators at the midpoint and endpoint level. The Hague, the
Netherlands: Dutch Ministry of Housing, Spatial Planning and Environment (VROM).
Goetzberger, A., Hoffmann, V.U. (2005): Photovoltaic Solar Energy Generation.
Springer Series in Optical Sciences, Vol. 112. Page 143, Table 9.4.
Greene. D. (1993): Effects of lead on the environment. Lead Action News. Volume 1,
Number 2. 1993. http://www.lead.org.au/lanv1n2/lanv1n2-8.html
Hauschild. M. Z., Huijbregts. M., Jolliet. O., Macleod. M., Margni. M., Meent. D.,
Rosenbaum. R.K., Mckone. T.E. (2008): Building a Model Based on Scientific
Consensus for Life Cycle Impact Assessment of Chemicals: The Search for Harmony
and Parsimony. Environmental Science and Technology, 2008.
Hjalmarsson, E., Sanden, J. (2014): Potential areas of success for Northern European
firms in the PV industry. {Master Thesis}. Chalmers University of Technology,
Gothenburg, 2014. Page 1.
Huijbregts, M. A. J., U. Thissen, J. B. Guinée, T. Jager, D. Kalf, D. Van De Meent, A.
M. J. Ragas, A. Wegener Sleeswijk and L. Reijnders (2000). Priority assessment of
toxic substances in life cycle assessment. Part I: Calculation of toxicity potentials for
181 substances with the nested multi-media fate, exposure and effects model USES-
LCA. Chemosphere 41(4): 541-573.
Hösel. M. (2014): Large scale roll-to-roll fabrication of organic solar cells for energy
production. 2014, Denmark.
International Energy Agency (2013): Energy Policies of IEA Countries. Sweden. Key
data for electricity demand and supply.
IPCC. (2007): Climate change 2007. New York: Cambridge University Press.
Accessed: April 1, 2015.
Yuan S.W. (1982): Energy, Resources and Environment. Proceedings of the First
U.S. – China Conference. Pergamon Press. Page 482.
Jungbluth, N. (2005): Life Cycle Assessment of Crystalline Photovoltaics in the Swiss
Ecoinvent Database. Broader Perspectives.
Kushnir. D., Sanden. B. A. (2008): Energy Requirments of Carbon Nanoparticle
Production. Research and Analysis, 2008.
Loi, M. A., Hummeln, J. C. (2013): Perovskites under the Sun. Nature Materials,
Volume 12, {December} 2013.
49
Matthew J. Eckelman, Paul T. Anastas, Julie B. Zimmerman. (2008): Spatial
Assessment of Net Mercury Emissions from the Use of Fluorescent Bulbs.
Mbraun (2015): MB-SC-200. Product specifications. Accessed: April 27, 2015.
http://mbraun.de/products/coating-equipment/spin-coating/mb-sc-200/#specifications
News Every day (2014): Cheap and Super-Efficient Solar Power Can Be Found in
Perovskite Solar Cells. (2015). Accessed: April 1, 2015.
Nguyen, H. W., Bailie, D. C., Unger, E. L., McGehee, M. D. (2014): Enchanting the
Hole – Conductivity of spiro – OMeTAD without Oxygen of Lithium Salts by Using
Spiro (TFSI)2 in Perovskite and Dye – Sensitized Solar Cells. Journal of the American
Chemical Society.
NREL (National Renewable Energy Laboratory). Best Research – Cell Efficiencies.
Chart accessed: February 18, 2015.
Peplow, M. (2014): Perovskite Is the New Black in the Solar World. IEEE
SPECTRUM. Accessed: February 2, 2015. http://spectrum.ieee.org/green-
tech/solar/perovskite-is-the-new-black-in-the-solar-world
Pilkington, (2014): Pilkington SunplusTM Features &benefits. NSG Group. Accessed:
February 9, 2015.
http://www.pilkington.com/products/bp/bybenefit/solarenergy/sunplus/featuresandben
efits.htm
Sandén, B. A. and M. Karlström (2007). Positive and negative feedback in
consequential life-cycle assessment. Journal of Cleaner Production 15(15): 1469-1481.
Science Daily (2014): LEDs made from ‘wonder material’ perovskite. University of
Cambridge (2014). Accessed: April 1, 2015.
http://www.sciencedaily.com/releases/2014/08/140805132140.htm
Sidhu. R., Carlson. D.E. (2010): Crystalline Silicon Solar Cell Technology. Bp Solar.
http://www.lesker.com/newweb/news/jpg/bpsolarsidhu_4-13-2010.pdf
Sigma – Aldrich, (2015): Fluorine doped Tin Oxide (FTO) Glass. Accessed: February
18, 2015. http://www.sigmaaldrich.com/materials-science/material-science-
products.html?TablePage=106837645
Solar Direct, (2014): Solar Electric Photovoltaic Modules. Accessed: February 9,
2015. http://www.solardirect.com/pv/pvlist/pvlist.htm
Spectrum. Chemical MFG Corp. (2015): Thermo Scientific® Barnstead Large Oval
Chamber Muffle Furnace. Accessed: April 24, 2015.
https://www.spectrumchemical.com/OA_HTML/lab-supplies-products_Hearth-tray-
339-47467_302969.jsp?minisite=10020&respid=22372
Taylor, P., Lavagne, O., Trudeau, N., Francoeur. M. (2008): Energy efficiency
indicators for public electricity production from fossil fuels. IEA Information Paper.
{July}, 2008.
Tobias, I., del Canizo, C., Alonso J. (2005): Crystalline Silicon Solar Cells and
Modules. Handbook of Photovoltaic Science and Engineering. Published Online: 28
January, 2005. Page 268.
TransportPolicy.net (2014): EU: Heavy-duty: Emissions. Accessed: April 22, 2015.
http://transportpolicy.net/index.php?title=EU:_Heavy-duty:_Emissions

50
U.S. Environmental Protection Agency (1994): Extraction and Beneficiation of ores
and minerals. Lead – Zinc. {June} 1994.
U.S. Environmental Protection Agency (2012): Lead factsheet.
http://www.epa.gov/osw/hazard/wastemin/minimize/factshts/lead.pdf
U.S. Department of Health and Human Services (2007): Toxicological Profile for
Lead. Agency of Toxic Substances and Disease registry, Atlanta (2007).
Vasilis M. Fthenakis, Hyung Chul Kim, Erik Alsema. (2008): Emissions from
Photovoltaic Life Cycles. Environmental Science and Technology 2008.
World Health Organization (2010): Preventing disease through healthy environments.
Exposure to lead: A Major Public Health Concern. Switzerland, 2010. Pg. 3.
World Nuclear Association (2011): Comparison of Lifecycle Greenhouse Gas
Emissions of Various Electricity Generation Sources. http://www.world-
nuclear.org/uploadedFiles/org/WNA/Publications/Working_Group_Reports/comparis
on_of_lifecycle.pdf