life cycle cost analysis for short and medium span bridges
TRANSCRIPT

LIFE CYCLE COST ANALYSIS FOR SHORT AND MEDIUM SPAN BRIDGESJTRP RESEARCH STUDY SPR-3914
SPR RESEARCH COMMITTEE:
TIMOTHY WELLS (CHAIR)
JEREMY HUNTER
RON McCASLIN
EDWARD SPAHR
ROAD SCHOOL 2018
1

OUTLINE
2
• INTRODUCTION AND MOTIVATION
• OBJECTIVES
• BRIDGE LIFE CYCLE COST ANALYSIS (BLCCA)
– Design program
– Deterioration factors
– Cost allocation
– Blcca implementation
• CONCLUDING REMARKS AND FUTURE WORK

INTRODUCTION AND MOTIVATION
3
• Life cycle cost analysis (LCCA):
Method used to assess the total cost of aproject. LCC is particularly useful when a singleproject has different alternatives that fulfillthe original requirements

INTRODUCTION AND MOTIVATION
4
• Bridge life cycle cost analysis (BLCCA): Initial costs:
Number of substructure elements
Deck span
Thickness for the superstructure
Span length
Material properties
Contractors experience

INTRODUCTION AND MOTIVATION
5
• Bridge life cycle cost analysis (BLCCA):Long term costs:
Repair or rehab of the bridge deck
Repair of collision-damaged girders
Re-painting steel bridge
Replace of the deck
Routine maintenance
Miscellaneous minor repairs such as spot painting or concrete patching

Mostly focused in scheduling and modeling.
Potential impact in decision makers.
Frangopol and Soliman (2016) BLCCA and other LCCAresearch efforts are not often use in practice.
INTRODUCTION AND MOTIVATION
6
• BLCCA in the literature:

OBJECTIVES
7
The main goal of this study is to identify themost cost effective bridge design solutions fordifferent span ranges and span configurationsbased on the Life Cycle Cost Analysis instead ofthe first cost approach currently used.

TASKS
8
1. Evaluate different design solutions for different spanarrangements in terms of its cost-effectiveness using BridgeLife Cycle Cost Analysis.
2. Identify the most effective bridge solutions in differentspan ranges.
3. Propose maintenance and work actions schedule fordifferent superstructure types.
4. Identify the most cost-effective major work actions foreach design option from the LCCA stand point.

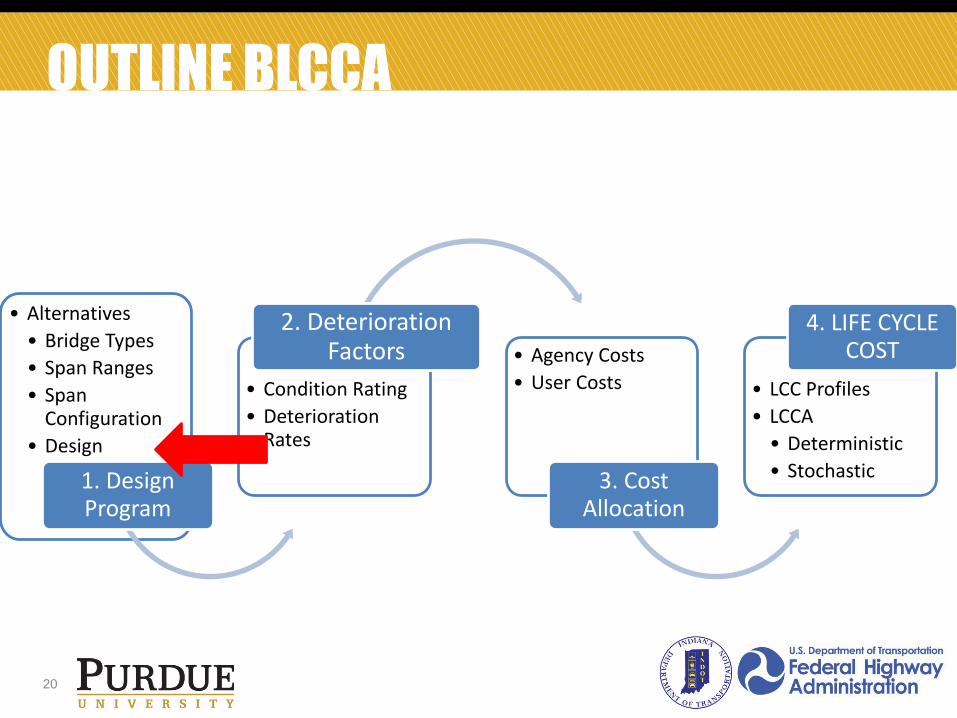
OUTLINE BLCCA
9
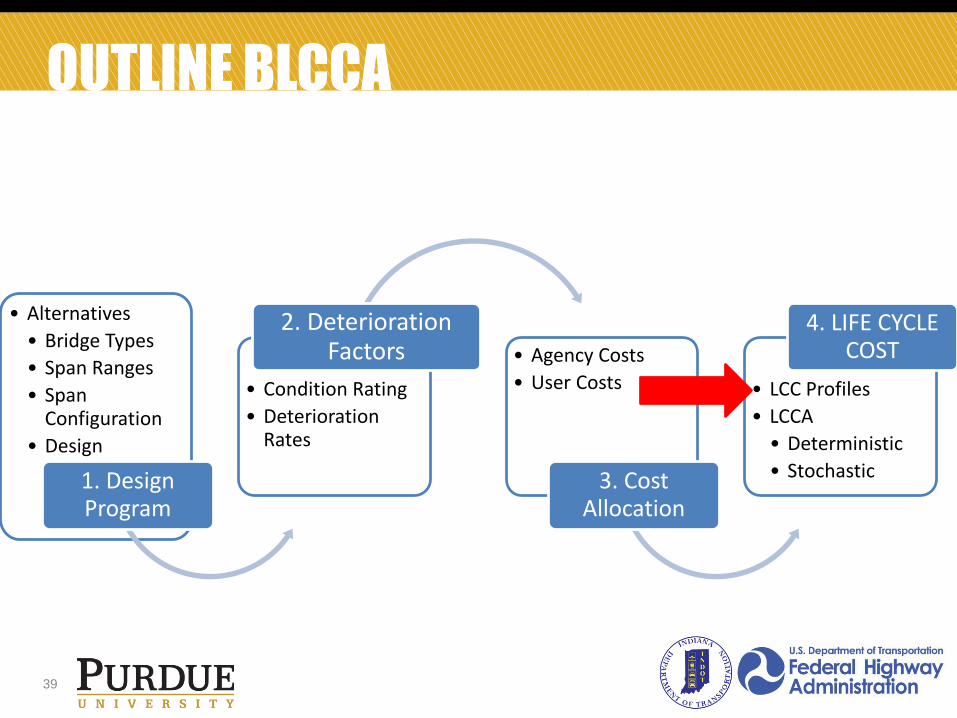
• Alternatives
• Bridge Types
• Span Ranges
• Span Configuration
• Design
1. Design Program
• Condition Rating
• Deterioration Rates
2. Deterioration Factors • Agency Costs
• User Costs
3. Cost Allocation
• LCC Profiles
• LCCA
• Deterministic
• Stochastic
4. LIFE CYCLE COST

1. DESIGN PROGRAM
10
1.1 Bridge alternatives:Summary Material Types INDIANA
Material ID % Quantity
1,2 Concrete 29.11% 5573
3,4 Steel 27.01% 5172
5,6 Prestressed 38.28% 7328
7, up Other 5.60% 1072
TOTAL 19145 Concrete29%
Steel27%
Prestressed38%
Other6%
STRUCTURAL TYPES (NBI DATABASE)
1. DESIGN PROGRAM
11
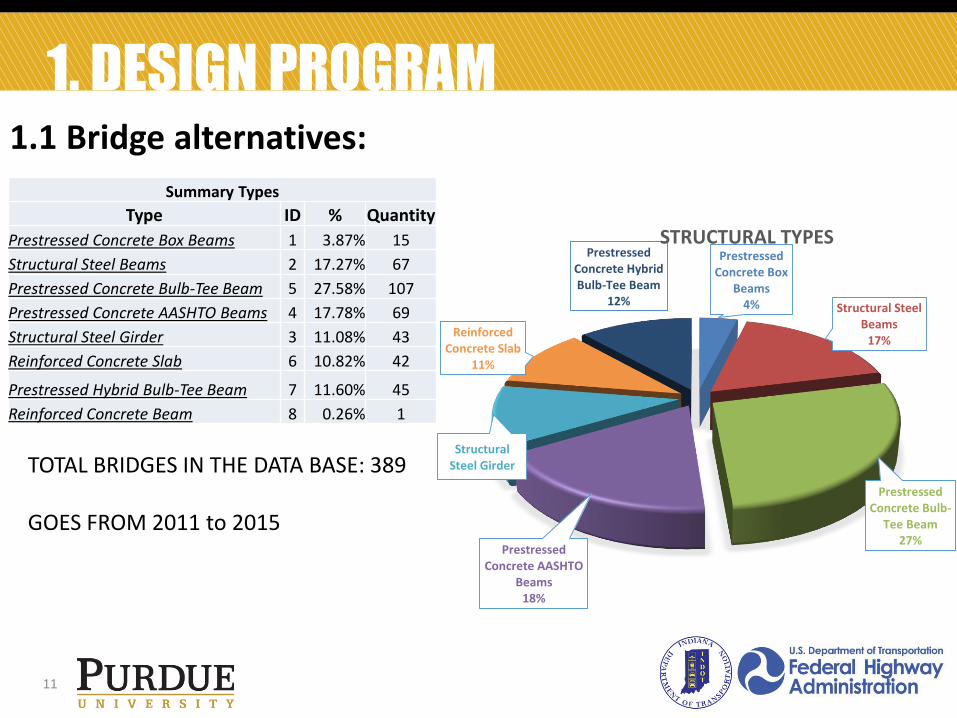
1.1 Bridge alternatives:
Prestressed Concrete Box
Beams4% Structural Steel
Beams17%
Prestressed Concrete Bulb-
Tee Beam27%
Prestressed Concrete AASHTO
Beams18%
Structural Steel Girder
Reinforced Concrete Slab
11%
Prestressed Concrete Hybrid Bulb-Tee Beam
12%
STRUCTURAL TYPES
TOTAL BRIDGES IN THE DATA BASE: 389
GOES FROM 2011 to 2015
Summary Types
Type ID % Quantity
Prestressed Concrete Box Beams 1 3.87% 15
Structural Steel Beams 2 17.27% 67
Prestressed Concrete Bulb-Tee Beam 5 27.58% 107
Prestressed Concrete AASHTO Beams 4 17.78% 69
Structural Steel Girder 3 11.08% 43
Reinforced Concrete Slab 6 10.82% 42
Prestressed Hybrid Bulb-Tee Beam 7 11.60% 45
Reinforced Concrete Beam 8 0.26% 1

1. DESIGN PROGRAM
12
1.1 Bridge alternatives:
Concrete Options
Slab bridges
Prestressed concrete box beams
Prestressed concrete AASHTO beams
Prestressed concrete Bulb tees and hybrid bulb tees
Steel Options
Structural steel beams
Steel plate girders
Structural steel folded plate beams
SDCL beams

1. DESIGN PROGRAM
13
1.1 Bridge alternatives:Steel folded plate beams
Standard shapes built from bending flat steel plates using a break press.
According to the Short Span Steel Bridge Alliance (SSSBA) a maximum span of 60ft.
Narendra Taly and Gangarao (1979)
Barth et al (2015)
Civjan et al (2016)
Pavlich et al (2008)

1. DESIGN PROGRAM
14
1.1 Bridge alternatives:SDCL
Simple spans steel members at the early construction stages (Dead Load)
Concrete diaphragm during construction create a continuous structural system (Live Load)
Azizinamini (2005)
Hoorpah at al (2015)
Zanon et al (2015)
Indiana Experience:
2011 Project SR 246
80ft max span. 6 Spans

OUTLINE BLCCA
15
• Alternatives
• Bridge Types
• Span Ranges
• Span Configuration
• Design
1. Design Program
• Condition Rating
• Deterioration Rates
2. Deterioration Factors • Agency Costs
• User Costs
3. Cost Allocation
• LCC Profiles
• LCCA
• Deterministic
• Stochastic
4. LIFE CYCLE COST

1. DESIGN PROGRAM
16
1.2 Span Ranges:Summary Ranges
Ranges IDSpan
% QuantityMinimum Maximum
0 Culverts LESS THAN 20 FT 5.8% 1113
1 Range 1 30 60 41.6% 7960
2 Range 2 60 90 17.3% 3315
3 Range 3 90 130 6.1% 1164
4 Range 4 130 200 2.2% 430
N/A N/A 20 30 27.0% 5163
100.00% 19145
TOTAL BRIDGES INVENTORY: 19,145 (NBI DATA 2016)97% (18,073) of Total INDIANA Inventory are concrete and steel
65% of Total INDIANA Inventory

OUTLINE BLCCA
17
• Alternatives
• Bridge Types
• Span Ranges
• Span Configuration
• Design
1. Design Program
• Condition Rating
• Deterioration Rates
2. Deterioration Factors • Agency Costs
• User Costs
3. Cost Allocation
• LCC Profiles
• LCCA
• Deterministic
• Stochastic
4. LIFE CYCLE COST

1. DESIGN PROGRAM
18
1.3 Span Configuration
Summary Spans
SPANS ID % Quantity
1 1 SPAN 49.6% 9487
2 2 SPANS 10.1% 1941
3 3 SPANS 32.1% 6139
4 4 SPANS 4.3% 818
5 MORE THAN 5 SPANS 4.0% 760
TOTAL 19145
1 SPAN50%
2 SPANS10%
3 SPANS32%
4 SPANS4%
MORE THAN 5 SPANS
4%
Span Ranges

1. DESIGN PROGRAM
19
1.3 Span Configuration
0.45~0.50
0.35
0.50 0.50
0.32 0.36 0.32
SPAN RANGE 1 and 2
SPAN RANGE 3
OUTLINE BLCCA
20
• Alternatives
• Bridge Types
• Span Ranges
• Span Configuration
• Design
1. Design Program
• Condition Rating
• Deterioration Rates
2. Deterioration Factors • Agency Costs
• User Costs
3. Cost Allocation
• LCC Profiles
• LCCA
• Deterministic
• Stochastic
4. LIFE CYCLE COST

1. DESIGN PROGRAM
21
1.4 Design Standard Values:
• Width: 43'
• Lanes: 2 (12' wide with 8' wide shoulders)
• Railings: New Jersey according to drawing E706-BRSF INDOT
• Skew: 0° (average skew=20°)
• Moderate AADT
• Concrete deck of 8 in, min long reinf. 5/8”
• Max rebar spac 8 in.

1. DESIGN PROGRAM
22
1.4 Design Standard Values:
• Structural steel ASTM A709 Gr 50. E: 29,000ksi, Fy: 50ksi Fu: 65ksi
• Reinf steel AASHTO A615 Gr 60. E: 29,000ksi, Fy: 60ksi Fu: 80ksi
• PS Strands: Low relax strands. E: 28,500ksi, Fy: 243ksi Fu: 270ksi
• Slab concrete f’c: 4ksi, E: 3,834ksi
• Concrete PS beams f’c: 7ksi. E: 5,072ksi. Conditions at transfer may vary.

1. DESIGN PROGRAM
23
1.4 Design Standard Values:

1. DESIGN PROGRAM
24
FINAL DESIGN PLAN SIMPLY SUPPORTED BRIDGES
SR 1 SR 1 SR 1 - 2 SR 2 SR 2-3 SR 3
30 45 60 75 90 130
X X
X X X X X X
X X X X X
X X X X X X
X X X
X X X
X X X X
X X
Span Range (SP)
PS Concrete Beam
Folded Steel Plate
PS Concrete Box
PSC Bulb Tee
Steel Girders
SUPERSTRUCTURE
TYPE
Span
Slab Bridge
Steel beam (5B)
Steel beam (4B)
1. DESIGN PROGRAM
25
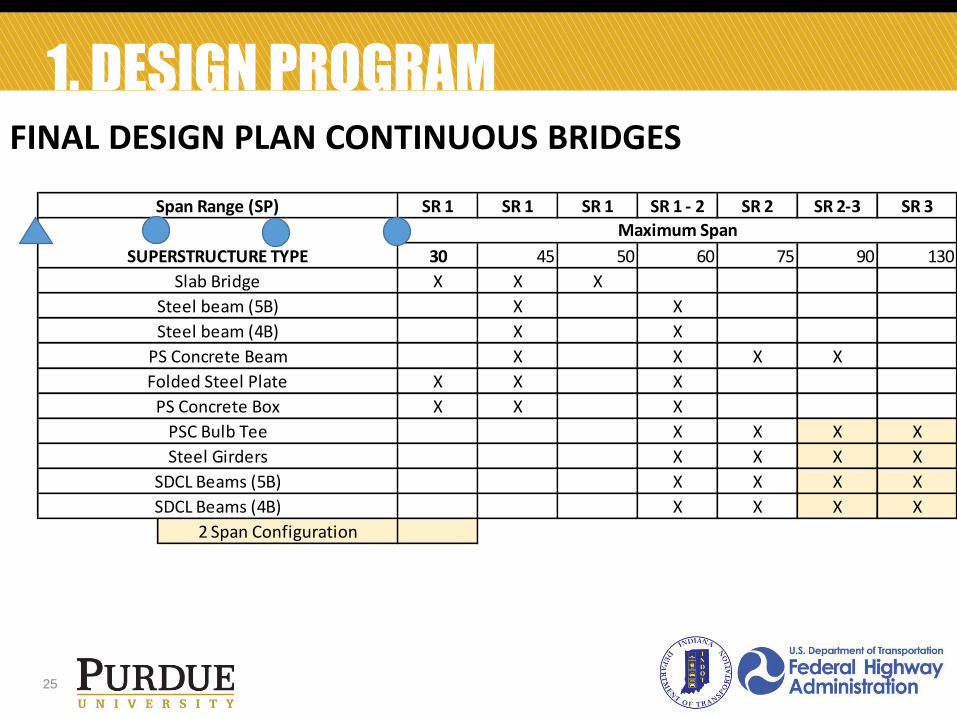
FINAL DESIGN PLAN CONTINUOUS BRIDGES
SR 1 SR 1 SR 1 SR 1 - 2 SR 2 SR 2-3 SR 3
30 45 50 60 75 90 130
X X X
X X
X X
X X X X
X X X
X X X
X X X X
X X X X
X X X X
X X X X
SDCL Beams (5B)
SDCL Beams (4B)
2 Span Configuration
Span Range (SP)
Slab Bridge
Steel beam (5B)
Steel beam (4B)
SUPERSTRUCTURE TYPE
PS Concrete Beam
Folded Steel Plate
PS Concrete Box
PSC Bulb Tee
Maximum Span
Steel Girders

OUTLINE BLCCA
26
• Alternatives
• Bridge Types
• Span Ranges
• Span Configuration
• Design
1. Design Program
• Condition Rating
• Deterioration Rates
2. Deterioration Factors • Agency Costs
• User Costs
3. Cost Allocation
• LCC Profiles
• LCCA
• Deterministic
• Stochastic
4. LIFE CYCLE COST

2. DETERIORATION CURVES
27
2.1 Condition Ratings:
National Bridge Inventory (data since 1992)
STATE DESCRIPTION
N Not Applicable
9 Excellent Condition
8 Very Good Condition - No problems noted
7 Good Condition - Some minor problems
6 Satisfactory Condition
5 Fair Condition
4 Poor Condition
3 Serious Condition
2 Critical Condition
1 "Imminent" Failure Condition
0 Failed Condition
a) Deterministic models
b) Stochastic Models
Definition:
Predicting the future condition of infrastructure assets.

2. DETERIORATION CURVES
28
2.1 Condition Ratings:
• 2.1.1 Deterministic Analysis:
• The output obtained is commonly expressed by deterministic values that represent the average predicted condition.
– Extrapolations
– Regressions or
– Curve-fitting techniques.
𝑦 =
123…𝑛
𝑦 = 𝐶1𝑥𝑛 + 𝐶2𝑥
𝑛−1 +⋯+ 𝐶𝑛−2𝑥2 +
𝐶𝑛−1𝑥 + 𝐶𝑛
Nebraska DOT, Morcous (2007, 2011 and 2015)Some research using Indiana assets

2. DETERIORATION CURVES
29
2.1 Condition Ratings:
Nebraska DOT, Morcous (2011)Some research using Indiana assets
• 2.1.2 Stochastic Analysis:
• Deterioration progression is set as one or more stochastic variables that capture the uncertainty of the process
– Markov Chains
» Time based
» State based.
𝑦 =
123…𝑛
𝑇𝑃𝑀 =1 ⋯ 𝑝(𝑥)𝑛1⋮ ⋱ ⋮
𝑝(𝑥)1𝑛 ⋯ 1
𝐶𝑅 = 𝐶𝑅0𝑇𝑃𝑀𝐴𝑔𝑒

2. DETERIORATION CURVES
30
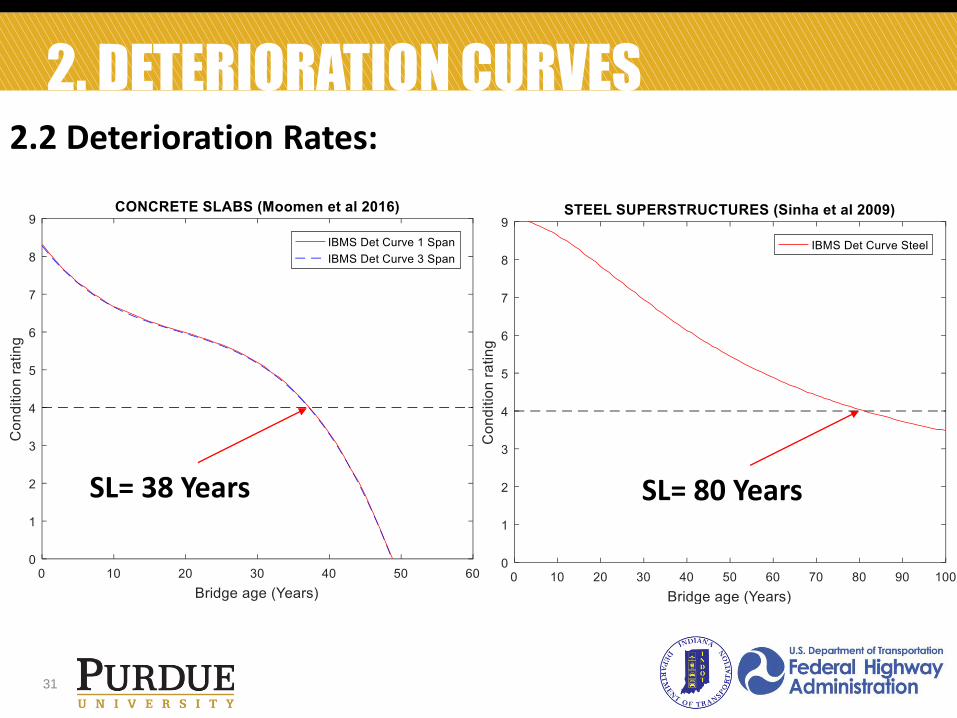
2.2 Deterioration Rates:
• Two sources:
1. M. Moomen, Y. Qiao, B. R. Agbelie, S. Labi, and K. C. Sinha, Bridge Deterioration Models to Support Indiana’s Bridge Management System. 2016.• Deterministic approach based on curve fitting techniques and NBI
condition rating database (SPR 3828) (Concrete options)
2. Kepaptsoglou, K., and Sinha, K.C., 2002. IBMS Technical Manual 2002• Continuous regression models (SPR 3013) (Steel options)
2. DETERIORATION CURVES
31
2.2 Deterioration Rates:
SL= 80 YearsSL= 38 Years

2. DETERIORATION CURVES
32
2.2 Deterioration Rates:
SL= 65 Years
SL= 60 Years

OUTLINE BLCCA
33
• Alternatives
• Bridge Types
• Span Ranges
• Span Configuration
• Design
1. Design Program
• Condition Rating
• Deterioration Rates
2. Deterioration Factors • Agency Costs
• User Costs
3. Cost Allocation
• LCC Profiles
• LCCA
• Deterministic
• Stochastic
4. LIFE CYCLE COST

3. COST ALLOCATION
34
• Variation of concrete price through different time periods (Average values).
– 2011 to 2016:
• All = $621/yd3
• Concrete = $591/yd3
• Steel = $698/yd3
– 2016 only:
• All = $802/yd3
• Concrete = $829/yd3
• Steel = $786/yd3 VARIABLE CONCRETE UNIT PRICE DEPENDING ON THE STRUCTURE TYPE IS NOT A FACTOR.
3.1 Agency costs:

3. COST ALLOCATION
35
3.1 Agency costs:
Maximum Minimum Average
Concrete C Superstructure yd3 1,662.96$ 346.96$ 621.52$ 579.27$ 389.00
Concrete C Concrete All Configurations yd3 1,662.96$ 346.96$ 591.08$ 555.60$ 279.00
Concrete C Steel All Configurations yd3 1,465.63$ 410.44$ 698.70$ 632.36$ 110.00
Concrete C All Types Simply Supported yd3 995.55$ 415.74$ 581.71$ 564.87$ 108.00
Concrete C Concrete Simply Supported yd3 995.55$ 415.74$ 566.88$ 547.70$ 97.00
Concrete C Steel Simply Supported yd3 942.97$ 539.79$ 712.50$ 680.30$ 11.00
Concrete C All Types Continuous yd3 1,662.96$ 346.96$ 636.81$ 581.80$ 281.00
Concrete C Concrete Continuous yd3 1,662.96$ 346.96$ 603.98$ 557.43$ 182.00
Concrete C Steel Continuous yd3 1,465.63$ 410.44$ 697.17$ 629.14$ 99.00
Concrete C All Types 3 Spans yd3 1,662.96$ 346.96$ 646.78$ 600.59$ 143.00
Concrete C Concrete 3 Spans yd3 1,662.96$ 346.96$ 631.19$ 593.71$ 100.00
Concrete C Steel 3 Spans yd3 1,465.63$ 410.44$ 684.85$ 616.04$ 38.00
DataINDOT
ITEM UNIT Weighted
ҧ𝑥𝑤𝑒𝑖𝑔ℎ𝑡𝑒𝑑 =σ𝑖=1𝑛 𝑤𝑖𝑥𝑖σ𝑖=1𝑛 𝑤𝑖
ҧ𝑥 =1
𝑛
𝑖=1
𝑛
𝑥𝑖

3. COST ALLOCATION
36
3.1 Agency costs:
𝛼𝑆𝑙𝑎𝑏 =𝐶𝑜𝑛𝑐𝑟𝑒𝑡𝑒𝑆𝑙𝑎𝑏𝐶𝑜𝑛𝑐𝑟𝑒𝑡𝑒𝑇𝑜𝑡𝑎𝑙
=237𝑚3
270𝑚3= 88%
𝛼𝐷𝑖𝑎𝑝ℎ =𝐶𝑜𝑛𝑐𝑟𝑒𝑡𝑒𝐷𝑖𝑎𝑝ℎ
𝐶𝑜𝑛𝑐𝑟𝑒𝑡𝑒𝑇𝑜𝑡𝑎𝑙=
33𝑚3
270𝑚3= 12%
ҧ𝑥𝑤𝑒𝑖𝑔ℎ𝑡𝑒𝑑 =σ𝑖=1𝑛 𝑤𝑖𝑥𝑖σ𝑖=1𝑛 𝑤𝑖
𝑃𝑇𝑜𝑡𝑎𝑙 =σ𝑖=1𝑛 𝑤𝑖𝑥𝑖σ𝑖=1𝑛 𝑤𝑖
= 𝛼𝑆𝑙𝑎𝑏𝑃𝑆𝑙𝑎𝑏 + 𝛼𝐷𝑖𝑎𝑝ℎ𝑃𝐷𝑖𝑎𝑝ℎ = 88% Τ$529.27 𝑦𝑑3 + 12%𝑃𝐷𝑖𝑎𝑝ℎ = Τ$600.59 𝑦𝑑3
𝑃𝑆𝑙𝑎𝑏 = Τ$579.27 𝑦𝑑3
𝑃𝑇𝑜𝑡𝑎𝑙 = Τ$600.59 𝑦𝑑3 3 spans Configuration
• Percentage slab Concrete:– Price Slab= Simply Supported Price
• Percentage Diaphragm Concrete
𝑷𝑫𝒊𝒂𝒑𝒉 = Τ$𝟏𝟏𝟐𝟑. 𝟔𝟎 𝒚𝒅𝟑
• Prestressed concrete AASTHO continuous beams• Prestressed concrete Bulb tees• SDCL beam system• Closing pours for prefabricated options

3. COST ALLOCATION
37
3.1 Agency costs:

3. COST ALLOCATION
38
3.1 Agency costs:
OUTLINE BLCCA
39
• Alternatives
• Bridge Types
• Span Ranges
• Span Configuration
• Design
1. Design Program
• Condition Rating
• Deterioration Rates
2. Deterioration Factors • Agency Costs
• User Costs
3. Cost Allocation
• LCC Profiles
• LCCA
• Deterministic
• Stochastic
4. LIFE CYCLE COST

4. LCCA
40
4.1 LCC Profiles:
• Graphical representations of actions needed during the life span of the asset
– Life cycle length
» Material type
» Type of superstructure
– Working actions
» Maintenance
» Preventive
» ReplacementCleaning/washing
0 10 20 30 40 50 58
Bridge Construction
Bridge Reconstruction
Deck overlay
Sealing and Cleaning Sealing and Cleaning

4. LCCA
41
4.1 LCC Profiles:
Cleaning/washing
0 10 20 30 40 50 58
Bridge Construction
Bridge Reconstruction
Deck overlay
Sealing and Cleaning Sealing and Cleaning
Condition rating jumps due to rehabilitation, repair or replacement
Superstructure TypeNHS Bridges
(Unit)
# Bridges with
Jumps > 3 rat.% Reconstruction Action Repair Actions
Steel structures 1736 61 4% 22Superstructure
replacement39
Collision Damage repair
Localized section stregnthening
Superstreucture jacking elevation
Prestressed beams 748 13 2% 10Superstructure
replacement3
Partial Replacement
Beam ends Repair
Prestressed boxes320 10
3%10
Superstructure
replacement0
Slab bridges 1014 35 3% 27Superstructure
replacement8
Partial depth
External pos tensioning
Superstreucture jacking elevation
Total 3818 119 3% 69 50
4. LCCA
42
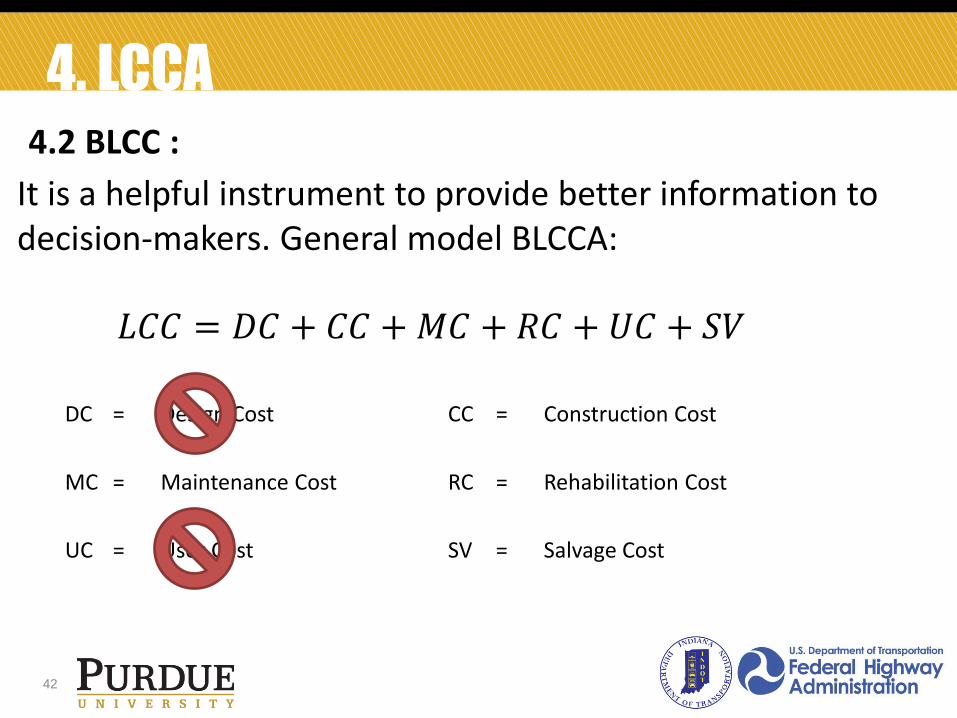
4.2 BLCC :
It is a helpful instrument to provide better information to decision-makers. General model BLCCA:
𝐿𝐶𝐶 = 𝐷𝐶 + 𝐶𝐶 +𝑀𝐶 + 𝑅𝐶 + 𝑈𝐶 + 𝑆𝑉
DC = Design Cost CC = Construction Cost
MC = Maintenance Cost RC = Rehabilitation Cost
UC = User Cost SV = Salvage Cost

4. LCCA
43
4.2 BLCC :
Different service life depending on the superstructure and material type.
P = Life Cycle Cost
i = Discount rate
SL = Service Life
𝑃𝑝 =𝑃
1 + 𝑖 𝑆𝐿 − 1
Present worth of life cycle in Perpetuity:

4. LCCA
44
4.2 BLCC :
4. LCCA
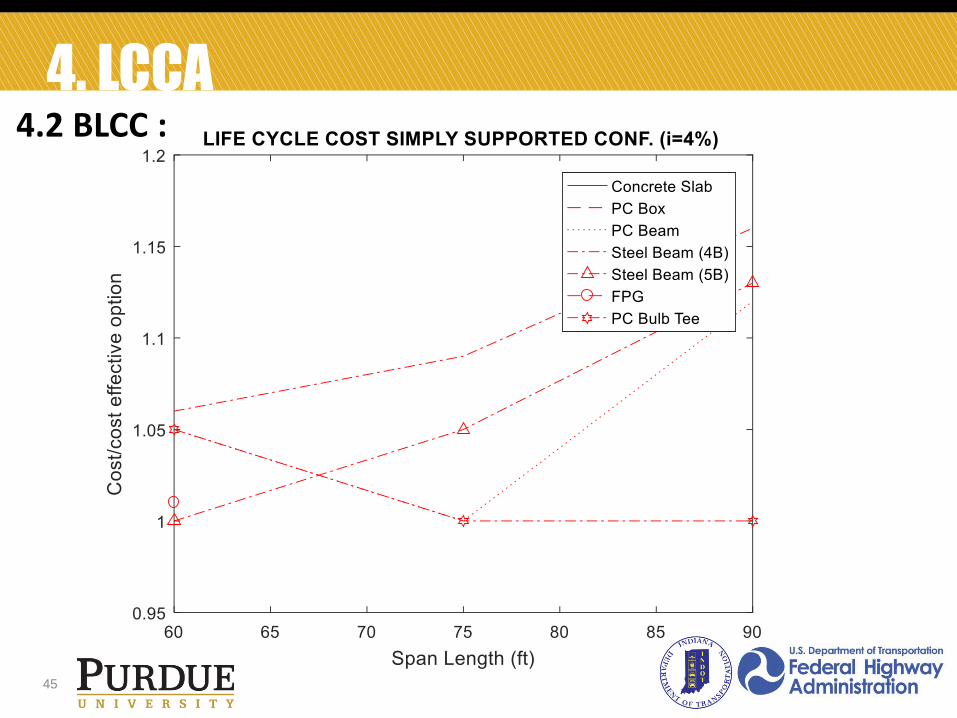
45
4.2 BLCC :
CONCLUDING REMARKS
46
• Deterioration rate and its usage in the estimation of service life has an important role into the LCCA.
• Cost allocation and work actions scheduling affect significantly the outcome of the LCCA.
• Consideration of long term cost changes the cost-effectiveness of the superstructure design alternative.
• Based on current data, concrete superstructures for simply supported structures are most cost-effective for span lengths greater than 75ft. However, steel options are more attractive for spans ranging from 50ft to 65ft.

FUTURE WORK
47
• Finalize design program and initial cost estimation
• Implement stochastic methodology into LCCA
– Identify probabilistic distributions for the different parametersused in BLCCA
• Make recommendations to designers of cost effectivesuperstructures depending on span range based on LCCA

48
THANK YOU! QUESTIONS?