life cycle evaluation and economic considerations of the pyrolysis … · life cycle evaluation and...
TRANSCRIPT
Life cycle evaluation and economic considerations of the pyrolysis-gasification of municipal solid waste in Singapore
H. H. Khoo, R. B. H. Tan, S. Salim & Y. M. Wu Institute of Chemical and Engineering Sciences, Jurong Island, Singapore
Abstract
Due to limited territory for landfills in Singapore, incineration is given top priority for the treatment of wastes that are not recovered, reused or recycled. Unfortunately, incineration emissions contain gases which possess high polluting characteristics that can severely affect human health in the long run. In this paper, a pyrolysis-gasification technology is introduced and compared with an existing incinerator operating in Singapore. Pyrolysis-Gasification technologies have received increasing attention because the process can produce high quality fuels, such as Syngas.
A life cycle assessment approach was employed to study the stream of MSW – from generation to its final conversion. The economic considerations, including social costs of air emissions associated with the stream of MSW at each stage, as well as, the economic values of the final products (electricity or Syngas), was evaluated.
It was projected that the existing incineration and proposed plants’ annual values (PTotal) were nearly similar – approximately 70 million/year without considering the social or economic costs of pollution. When the costs of air emissions were taken into account, the new pyrolysis-gasification technology displayed a significant advantage over Incineration. Sensitivity analysis demonstrated that the time to “pay back” the capital expenditure for the proposed plant changed considerably with fluctuations in the amount of Syngas produced and operating costs, but less with capital costs. Keywords: municipal solid waste (MSW), incineration, pyrolysis-gasification, life cycle approach, cost and economic considerations.
www.witpress.com, ISSN 1743-3541 (on-line)
© 2006 WIT PressWIT Transactions on Ecology and the Environment, Vol 98,
Environmental Economics and Investment Assessment 43
doi:10.2495/EEIA060051

1 Introduction
Singapore is a small island city-state with large population, rapid industrialization and economic development. For the past decade, Singapore has seen a tremendous increase in municipal solid waste (MSW) generation. The yearly disposed MSW increased from 0.74 million tons in 1972 to 2.80 million tons in 2000 [1]. The nation is faced with limited land for the dumping of wastes and the only available landfill site is constructed offshore (Semakau Landfill). Waste management in Singapore is administered by the National Environmental Agency (NEA) which gives top priority (90%) to the incineration of all incinerable wastes that are not recovered, reused or recycled [2]. There are four incineration plants in Singapore with the biggest plant operating with a capacity of 3000 tons per day (tpd).
Unfortunately, incinerators are viewed unfavourably in many countries due to their limited efficiencies of generating heat or electricity from wastes, large generation of air emissions, and the levels of ash produced. Incinerators are found to be one of main sources of airborne metal pollution in Singapore [3]. Most often, the energy gained from the incineration of MSW is outweighed by the environmental and health hazards coming from the incinerators [1].
Apart from the need to maintain air quality, Singapore is also subjected to other environmental and economical constraints. The small island city-state lacks natural resources, and has an over reliance on the import of fossil fuels.
2 Proposed pyrolysis-gasification MSW treatment system
Pyrolysis is the thermal decomposition of waste material at elevated temperatures in the absence of air or oxygen. Gasification is a process that converts carbonaceous materials into carbon monoxide and hydrogen. When MSW is burnt in a modern incinerator the only practical product is energy (electricity), whereas fuels and petro-chemicals can be produced from combined pyrolysis-gasification technologies.
Combined pyrolysis-gasification technologies involve thermally converting MSW to simple chemical building blocks which can be transformed to fuels and gaseous products. These processes, which require heat, generate a mixture of combustible gases, primarily methane, complex hydrocarbons, hydrogen, carbon monoxide, liquids and solid residues [4, 5]. Both pyrolysis and gasification technologies have received increasing attention overseas because the process conditions can be monitored to produce high-density pyrolytic oils or hydrogen rich gases (Syngas) [6].
Presently there is no commercial pyrolysis-gasification plant operating in the country. The final economic value of a proposed pyrolysis-gasification system depend on operating costs, the system’s efficiency in converting waste to the final product, the amount of residues generated, plant scale, etc [7]. The time taken – number of years – to recover the capital expenditures is also highly dependent on the costing consideration of both plants. Proposed new technologies for waste treatment need to be considered on a case-by-case basis to
www.witpress.com, ISSN 1743-3541 (on-line)
© 2006 WIT PressWIT Transactions on Ecology and the Environment, Vol 98,
44 Environmental Economics and Investment Assessment

determine whether the economics are viable. A complete life cycle study is proposed to verify that these advanced waste treatment technologies can be commercially feasible for Singapore.
3 Life cycle approach
Standard methods for assessing the environmental impacts of waste management systems are needed to underpin the development and implementation of sustainable waste management practices. Life Cycle Assessment (LCA) is a scientific tool for ensuring such assessments are comprehensive and covers all the impacts associated with various waste treatment options [1]. Environmentalists and decision makers have given increasing attention to LCA techniques associated with the downstream study of products [8].
In this paper the economic assessments of MSW, based on an LCA approach, is a technique proposed to estimate the overall costs of the waste stream – from generation to its final conversion into a useful product. Founded on the principles of LCA, the same assessment procedures are employed, except that the results are displayed in economic values instead of environmental impact scores [9].
The incineration system that will be used as a platform for comparison is the Tuas South Incineration plant which has a capacity of 3000 tpy. The capital and construction costs of the plant are reported to be 900 million Singapore Dollars (SGD) [2]. For this waste treatment option, mixed MSW is first collected and separated, after which 90% is sent for incineration and the rest (non-incinerable waste) is sent to the offshore landfill by barge. The amount of electricity generated from 1 ton of MSW is approximately 550 kWh (kilowatt-hour) [1]. The Tipping Fee for the plant is 80 SGD/ton of waste and the Disposal Fee to the landfill is 77 SGD/ton of waste disposed.
The entire system – for the starting waste stream of 1 ton MSW – is illustrated in fig. 1. The MSW mixture and contents are based on data provided by NEA [2]. The main emissions generated from the system are known to be CO2, CO, SO2, NOx, dioxins and furans and heavy metals. The transport pollutions from truck and barges are HC, VOC, CO, CO2 and acidic gases [1].
HC VOC PM
Transportation By CO CO2 SOX/NOX
0.3 ton by truck BargeNon-incienrable material 0.44 ton
CO2 CO PM SO2 NOX
HC VOC PM Dioxins/furans, Heavy metalsCO CO2 SOX/NOX
Ash Disposal at1 ton Collection and 0.7 Transportation 0.7 Incineration 20% = 0.14 ton Collection Offshoremixed MSW Separation ton by truck ton Plant Landfill
ElectricityEstimated Tipping Fee 80/ton Disposal cost 77/ton
Electricity 0.12 kWh/ton 0.23 m3/ton 560 kWh/tonProcess cost 10/ton natural gas (Available for market)
Electricity Input70 kWh/ton
Figure 1: Present MSW incineration system.
www.witpress.com, ISSN 1743-3541 (on-line)
© 2006 WIT PressWIT Transactions on Ecology and the Environment, Vol 98,
Environmental Economics and Investment Assessment 45

The proposed pyrolysis-gasification plant, known as Thermoselect, is based on a plant operating in Europe with the same capacity [10]. The technology is reported to be able to accept a wide mixture of MSW, thereby eliminating the need for the Separation process. Also, less waste (5% residues) is required to be sent to the landfill. The capital and construction expenditure for this technology is calculated to be 725 million SGD. It was reported that up to 890 kg of Syngas can be produced. The proposed system is illustrated in fig. 2.
As with any life cycle studies, data is required to support the investigation of the two systems. Table 1 provides a summary of the capital expenditures and other costing issues as well as the input-output data for the existing incineration plant and proposed pyrolysis-gasification plant.
HC VOC PM
By CO CO2 SOX/NOX
Barge0.05 ton
HC VOC PM CO PM SO2 NOXCO CO2 SOX/NOX Dioxins/furans, Heavy metals
Pyrolysis Ash Disposal at1 ton Collection Transportation 1 /Gasification 5% = 0.05 tons Collection Offshoremixed MSW By Truck ton Plant Landfill
ProductEstimated Tipping Fee 80/ton 890 kg/ton Syngas Disposal cost 77/ton
(300 kg methanol equivalent)
34.6 m3/ton Electricity inputnatural gas 302 kWh/ton
Figure 2: Proposed MSW pyrolysis-gasification system.
Table 1: Costing and operating information for incinerator and proposed pyrolysis-gasification plant.
Waste Treatment Technology Costs and operating conditions Incinerator Pyrolysis-Gasification
Capacity (tpd) 3000 3000 Type of material processed Mixed MSW Mixed MSW
Main useful product Electricity (~ 550 kWh/ton)
Syngas (~ 890 kg/ton)*
Capital and construction costs in millions SGD 900 725
Operating costs in SGD/ton 70 100
Tipping fee in SGD/ton 80 80
Disposal cost to landfill in SGD/ton 77 77
Electricity input (kWh/ton) 70 302 Natural gas input (m3/ton) 0.23 34.6
Residues/ash Up to 20% Up to 5% *Equivalent to 300kg methanol.
www.witpress.com, ISSN 1743-3541 (on-line)
© 2006 WIT PressWIT Transactions on Ecology and the Environment, Vol 98,
46 Environmental Economics and Investment Assessment
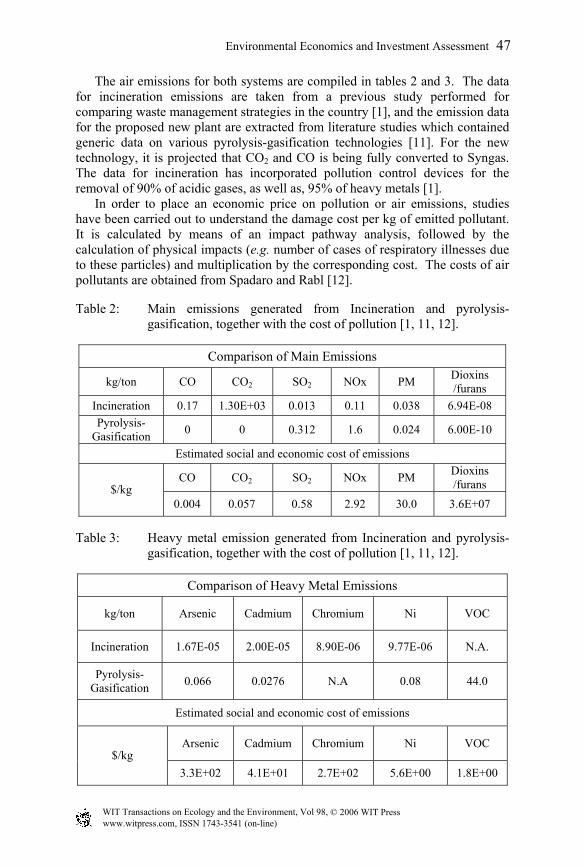
The air emissions for both systems are compiled in tables 2 and 3. The data for incineration emissions are taken from a previous study performed for comparing waste management strategies in the country [1], and the emission data for the proposed new plant are extracted from literature studies which contained generic data on various pyrolysis-gasification technologies [11]. For the new technology, it is projected that CO2 and CO is being fully converted to Syngas. The data for incineration has incorporated pollution control devices for the removal of 90% of acidic gases, as well as, 95% of heavy metals [1].
In order to place an economic price on pollution or air emissions, studies have been carried out to understand the damage cost per kg of emitted pollutant. It is calculated by means of an impact pathway analysis, followed by the calculation of physical impacts (e.g. number of cases of respiratory illnesses due to these particles) and multiplication by the corresponding cost. The costs of air pollutants are obtained from Spadaro and Rabl [12].
Table 2: Main emissions generated from Incineration and pyrolysis-gasification, together with the cost of pollution [1, 11, 12].
Comparison of Main Emissions
kg/ton CO CO2 SO2 NOx PM Dioxins /furans
Incineration 0.17 1.30E+03 0.013 0.11 0.038 6.94E-08 Pyrolysis-
Gasification 0 0 0.312 1.6 0.024 6.00E-10
Estimated social and economic cost of emissions
CO CO2 SO2 NOx PM Dioxins /furans $/kg
0.004 0.057 0.58 2.92 30.0 3.6E+07
Table 3: Heavy metal emission generated from Incineration and pyrolysis-gasification, together with the cost of pollution [1, 11, 12].
Comparison of Heavy Metal Emissions
kg/ton Arsenic Cadmium Chromium Ni VOC
Incineration 1.67E-05 2.00E-05 8.90E-06 9.77E-06 N.A.
Pyrolysis-Gasification 0.066 0.0276 N.A 0.08 44.0
Estimated social and economic cost of emissions
Arsenic Cadmium Chromium Ni VOC $/kg
3.3E+02 4.1E+01 2.7E+02 5.6E+00 1.8E+00
www.witpress.com, ISSN 1743-3541 (on-line)
© 2006 WIT PressWIT Transactions on Ecology and the Environment, Vol 98,
Environmental Economics and Investment Assessment 47

4 Calculations, results and discussions
A wide range of life cycle costing studies have focused on the economics associated with the commissioning, installation, construction, maintenance, etc of a new facility, e.g. cradle-to-grave study of a building or infrastructure. It should be highlighted that for this paper, the life cycle approach is employed in rather different manner. LCA is used to track the costs considerations for the stream of MSW going through each stage, from beginning (generation) to end (final product produced).
The breakdown of the cost results for each stage is shown in figures 3 (Incineration) and 4 (proposed plant). Both graphs are generated based on a 3000 tpd plant, that is, a total annual waste stream of 1,095,000 tons of MSW entering each system.
It can be observed from figure 3 that the two highest peaks (costs incurred) are from Incineration Emissions and Operating/Processing. Incinerator emissions are known to contain high levels of CO2 and acidic gases, as well as heavy metals which can be transported for considerable distances downwind from the incinerator facilities and have become major environmental and social concerns [3]. A broad range of health effects have been associated with living near incinerators as well as with working with these installations. Consequently, incinerators are being viewed rather unfavourably in many European countries [1]. Transportation costs are also rather high due to the larger amount of wastes that has to be sent to the offshore landfill. The inverted peaks (negative costs) display the revenues made from Tipping Fees and generation of Electricity.
Total estimated costs associated with the Incineration of
Mixed MSW for one year (including social costs of pollution)
-100.0
-80.0-60.0
-40.0
-20.00.0
20.0
40.060.0
80.0
Pret
reat
men
t-Se
para
tion
Truc
k tra
nspo
rtatio
npo
llutio
n
Ope
ratin
g/Pr
oces
sing
Inci
nera
tion
emis
sion
s
Dis
posa
l to
Offs
hore
Land
fill
Mar
ine
trans
porta
tion
pollu
tion
Tipp
ing
Fees
Tota
l wor
th o
f Use
ful
Elec
trici
ty
Mill
ions
of S
GD
Figure 3: Break-down of costs for each stage for the Incineration of MSW.
www.witpress.com, ISSN 1743-3541 (on-line)
© 2006 WIT PressWIT Transactions on Ecology and the Environment, Vol 98,
48 Environmental Economics and Investment Assessment

Total estimated costs associated with Pyrolysis-Gasification of Mixed MSW for one year (including social costs of pollution)
-140.0
-110.0
-80.0
-50.0
-20.0
10.0
40.0
70.0
100.0
130.0
Pret
reat
men
t
Truc
k tra
nspo
rtatio
npo
llutio
n
Ope
ratin
g/Pr
oces
sing
Inci
nera
tion
emis
sion
s
Dis
posa
l to
Offs
hore
Land
fill
Mar
ine
trans
porta
tion
pollu
tion
Tipp
ing
Fees
Tota
l wor
th o
fSy
ngas
Mill
ions
of S
GD
Figure 4: Break-down of costs for each stage for the pyrolysis-gasification of MSW.
As for figure 4, the highest peak is solely generated from the Operating/Processing costs of the pyrolysis-gasification plant. The results for transport pollution and process emissions are rather insignificant. The proposed thermal treatment for MSW uses controlled amount of oxygen in its process thereby generating less air emissions [10, 11]. In terms of economical value, Syngas is worth more than electricity as it can be sold as a chemical feedstock to produce highly valuable gases such as methanol or hydrogen [13]. Another advantage is that the amount of residues produced is appreciably less.
The overall annual value for each system is calculated in the following manner:
PTotal = PE/S(value) + PTF
(value) – CPT(processing fee)
– COP(operation fee) – COL
(disposal fee)
– SCTP(total sum) – SCPE
(total sum)
where
PTotal = Total value of system PE/S
(value) = Total revenue made from worth of Product (Electricity/Syngas)
PTF(value) = Total revenue made from Tipping Fees
CPT(processing fee) = Total costs for Pre-Treatment of MSW
COP(operation fee) = Total costs of Operating
Incineration plant/Pyrolysis-gasifier COL
(disposal fee) = Total costs for disposal to Offshore Landfill
www.witpress.com, ISSN 1743-3541 (on-line)
© 2006 WIT PressWIT Transactions on Ecology and the Environment, Vol 98,
Environmental Economics and Investment Assessment 49
(1)
and SCTP
(total sum) = total social/economical costs of Transport Pollution = ∑ VOC(total in kg)*CVOC
($/kg) + CO2(total
in kg)*CCO2($/kg) + HC(total in kg)*CHC
($/kg) + …
SCPE(total sum) = total social/economical costs of Plant
Emissions = ∑ CO(total in kg)*CCO
($/kg) + CO2(total in
kg)*CCO2($/kg) + SO2(total in kg)*CSO2
($/kg) + … where CVOC/HC/SO2... is the unit cost per pollutant
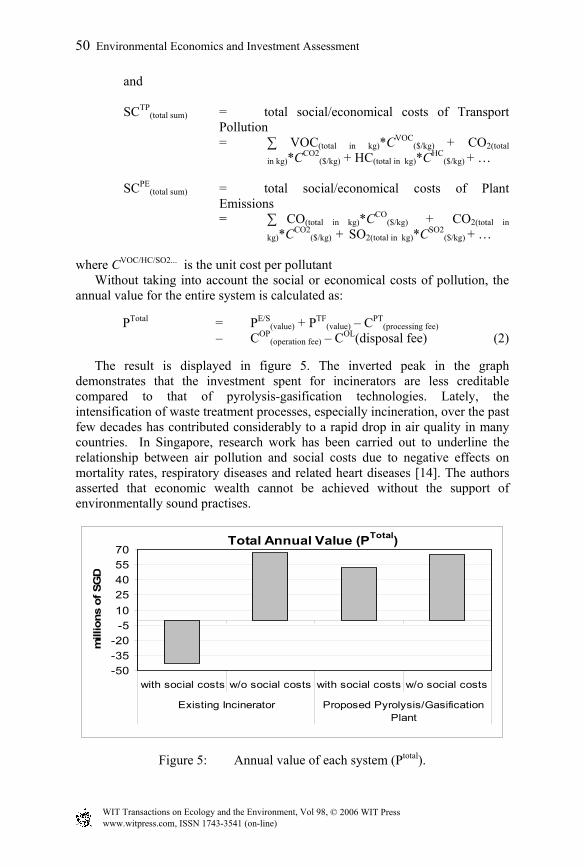
Without taking into account the social or economical costs of pollution, the annual value for the entire system is calculated as:
PTotal = PE/S(value) + PTF
(value) – CPT(processing fee)
– COP(operation fee) – COL(disposal fee) (2)
The result is displayed in figure 5. The inverted peak in the graph
demonstrates that the investment spent for incinerators are less creditable compared to that of pyrolysis-gasification technologies. Lately, the intensification of waste treatment processes, especially incineration, over the past few decades has contributed considerably to a rapid drop in air quality in many countries. In Singapore, research work has been carried out to underline the relationship between air pollution and social costs due to negative effects on mortality rates, respiratory diseases and related heart diseases [14]. The authors asserted that economic wealth cannot be achieved without the support of environmentally sound practises.
Total Annual Value (PTotal)
-50-35-20
-51025405570
with social costs w/o social costs with social costs w/o social costs
Existing Incinerator Proposed Pyrolysis/GasificationPlant
mill
ions
of S
GD
Figure 5: Annual value of each system (Ptotal).
www.witpress.com, ISSN 1743-3541 (on-line)
© 2006 WIT PressWIT Transactions on Ecology and the Environment, Vol 98,
50 Environmental Economics and Investment Assessment

It can be observed that without considering the social costs of pollution or air emissions, the PTotal for both existing and proposed systems are essentially comparable, that is, nearly 70 million/year.
4.1 Sensitivity analysis
The same calculations are performed for the pyrolysis-gasification plant with 10% changes for the amount of Syngas produced and operating costs. Due to the small number and limited scale of existing pyrolysis-gasification plants, the economics of a commercial scale unit can only be estimated [7]. The following simplified equation for measuring the time to recover investment (or “pay back” time) will be used:
Years taken to recover investment = PTotal / Total Capital (3)
4.1.1 Varying Syngas production levels Figure 6 shows the results for PTotal for different amounts of Syngas produced. The value for PTotal dropped to about 40 million/year (with the consideration of social costs) and 55 million/year (without the consideration of social costs) when the production of Syngas was reduced by 10%. On the contrary, the annual value of the plant increased from about 50 to over 60 million/year (without considering cost of emissions) and from about 65 to nearly 80 million (with the consideration of cost of emissions) with higher Syngas production. The time taken to “pay back” the expenditures for setting up the new plant spans from 9.5-11.5 years (for higher Syngas production level), and 13.5-17.5 years (for lower Syngas productivity).
Differences in PTotal (and time taken to recover investment) for Proposed Pyrolysis/Gasification Plant -
based on varying amounts of Syngas produced
010
203040
5060
7080
with socialcosts
w/o socialcosts
with socialcosts
w/o socialcosts
with socialcosts
w/o socialcosts
Syngas production reduce by10%
Syngas production 890kg/toninput
Syngas production increaseby 10%
mill
ion
SGD
* Years taken to recover investment money
*11 yrs
*14 yrs
*9.5 yrs*11.5 yrs
*13.5 yrs
*17.5 yrs
Figure 6: Results of PTotal according to varying Syngas production levels.
www.witpress.com, ISSN 1743-3541 (on-line)
© 2006 WIT PressWIT Transactions on Ecology and the Environment, Vol 98,
Environmental Economics and Investment Assessment 51

4.1.2 Varying operating costs The results for PTotal for Operating Costs of 90, 100 and 110 SGD per ton are displayed in figure 7. As expected, that the peaks fluctuate in nearly the same manner previous graph. This time, the highest peak for PTotal reached an economic value of approximately 75 million/year (without considering social costs) and to over 60 million/year (including social costs). The “pay back” time spans from 9.5 years, for a lower operating costs of 90 SGD/ton without considering costs of pollution, to as long as 17.5 years for a plant with the operating costs of 110 SGD/ton, with the costs of pollution considered.
Differences in PTotal (and time taken to recover investment) for Proposed Pyrolysis/Gasification Plant -
based on varying operating costs
010
203040
5060
7080
with socialcosts
w/o socialcosts
with socialcosts
w/o socialcosts
with socialcosts
w/o socialcosts
Capital 725 Million;Operating costs 90 /ton
Capital 725 Million;Operating costs 100 /ton
Capital 725 Million;Operating costs 110 /ton
mill
ion
SGD
* Years taken to recover investment money
*11 yrs
*14 yrs *13.3 yrs
*17.5 yrs
*9.5 yrs*11.5 yrs
Figure 7: Results of PTotal according to Operating Costs of 90, 100 and 110 SGD/ton.
4.1.3 Time to recover capital expenditure Changes in capital costs will not affect PTotal (eqns. (1) and (2)), but will have an effect on “payback time” (eqn. (3)). Figure 8 displays the varying “pay back” time for the percentage changes in capital costs, operating and capital costs. As expected, the time taken to recover the capital expenditures display exact opposite responses for both varying Syngas production and operating costs. The “pay back” time is less responsive towards fluctuating capital costs. The “pay back” time varies from approximately less than 11 years to 12 years.
5 Concluding remarks
Economic development and industrialization are often accompanied by the generation of large amounts of wastes that must be recovered or disposed off. Environmental burdens of MSW systems (energy consumption, pollution of air, land, loss of nature) have become increasingly important to private citizens,
www.witpress.com, ISSN 1743-3541 (on-line)
© 2006 WIT PressWIT Transactions on Ecology and the Environment, Vol 98,
52 Environmental Economics and Investment Assessment

businesses and the government. Due to the shortage of territories for landfills, the present practice in Singapore is to incinerate 90% of MSW that are not recycled, reused or recovered. However, incinerators have been reported to cause more problems than it professes to remedy. A recent study comparing waste management options revealed that although some amount of energy can be derived from the incineration of wastes, these benefits are outweighed by the air pollution that incinerators produce [1]. Specific chemicals discharged from incinerators along with harmful air emissions can cause severe consequences for human health and the environment [15].
Sensitivity Analysis for "Pay Back" time comparing Syngas production, Capital Costs and Operating Costs
8
9
10
11
12
13
14
-10% -5% 0% 5% 10%Percentage changes
Tim
e to
"Pa
y Ba
ck"
in y
ears
SyngasProduction
CapitalCosts
OperatingCosts
Figure 8: Varying “Pay back” time with percentage changes in Syngas production, capital costs and operating costs.
Pyrolysis-gasification technologies are not only proven to be a more environmentally sound option compared to traditional mass-burning incinerators, they are also capable of producing a valuable product, Syngas [5, 6]. Moreover, the proposed system has the potential to reduce greenhouse gases as well as the amount of wastes sent to landfills.
In an economic cost assessment of air pollution in Singapore, Quah and Boon [14] have asserted that economic development and good air quality are mutually supporting goals. Economic wealth cannot be enjoyed fully in a polluted environment, and vice versa.
References
[1] Tan, R.B.H Tan & Khoo, H.H., Impact Assessment of Waste Management Options in Singapore. Journal of Air & Waste Management Association, 56, pp. 244-254, 2006.
[2] Waste Management Department, National Environmental Agency, http://app.nea.gov.sg/
www.witpress.com, ISSN 1743-3541 (on-line)
© 2006 WIT PressWIT Transactions on Ecology and the Environment, Vol 98,
Environmental Economics and Investment Assessment 53

[3] Balasubramanian, R. & Qian, W.B., Characterization and source identification of airborne trace metals in Singapore. Journal of Environmental Monitoring, 6, pp. 813-818, 2004.
[4] Demirbaş, A., Gaseous products from biomass by pyrolysis and gasification: effects of catalyst on hydrogen yield. Energy Conversion and Management, 43, pp. 897-909, 2002.
[5] Filippis, P.D., Borgianni, C., Paolucci, M. & Pochetti, F. Prediction of syngas quality for two-stage gasification of selected waste feedstocks. Waste Management. 24, pp. 633-639, 2004.
[6] Chaudhari, S.T., Bej, S.K., Bakhshi, N.N. & Dalai, A.K., Steam Gasification of Biomass-Derived Char for the Production of Carbon Monoxide-Rich Synthesis Gas. Energy & Fuels, 15, pp. 736-742, 2001.
[7] Murphy, J.D. & McKeogh, E., Technical, Economical and environmental analysis of energy production from Municipal Solid Waste. Renewable Energy, 29, pp. 1043-1057, 2004.
[8] Walls, M. & Palmer, K., Upstream pollution, Downstream Waste Disposal, and the Design of Comprehensive Environmental Policies. Journal of Environmental Economics and Management, 41, pp. 94 – 108, 2001.
[9] Senthil K., Durairaj, S.K., Ong, Andrew Y.C.N. & Tan, R.B.H., Evaluation of Life Cycle Cost Analysis Methodologies. Corporate Environmental Strategy, 9, pp. 30-39, 2002.
[10] Niessen, W.R., Marks, C.H., & Sommerlad, R.E., Evaluation of Gasification and Novel Thermal Processes for the Treatment of Municipal Solid Waste. National Renewable Energy Laboratory (NREL), Report No. NREL/TP-430-21612, 1996.
[11] Enviros Consulting Ltd., Review of Environmental and Health Effects of Waste Management: Municipal Solid Waste and Similar Wastes. Department for Environment, Food and Rural Affairs, Defra Publications, 2004.
[12] Spadaro, J.V. & Rabl, A., Air pollution damage estimates: the cost per kilogram of pollutant. International Journal of Risk Assessment and Management, 3, pp. 75-98, 2002.
[13] Yaman, S., Pyrolysis of biomass to produce fuels and chemical feedstocks. Energy Conversion and Management, 45, pp. 651-671, 2004.
[14] Quah, E. & Boon, T.L., The economic cost of particulate air pollution on health in Singapore. Journal of Asian Economics, 14, pp. 73-90, 2003.
[15] Astrup, T., Rosenblad, C., Trapp, S. & Christen, T.H., Chromium release from waste incineration air-pollution-control residues. Environmental Science and Technology, 1, pp. 21-9, 2005.
www.witpress.com, ISSN 1743-3541 (on-line)
© 2006 WIT PressWIT Transactions on Ecology and the Environment, Vol 98,
54 Environmental Economics and Investment Assessment