lima campus by college, rank, and sex autumn...
TRANSCRIPT
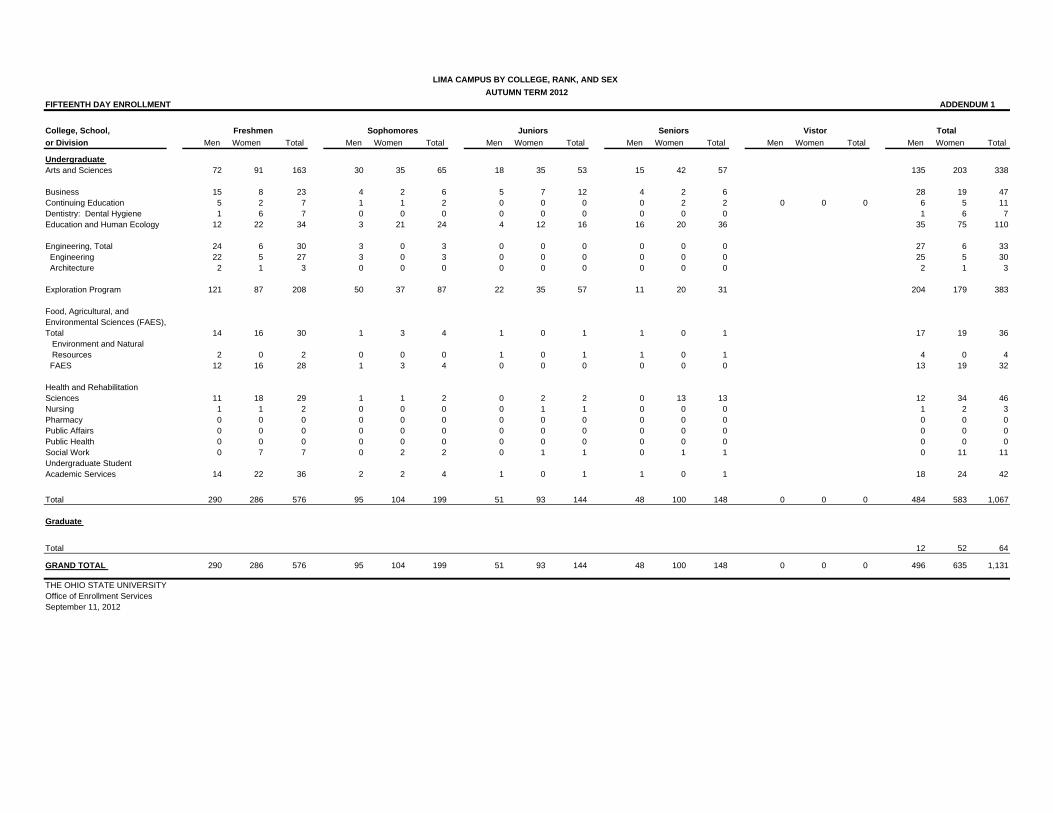
LIMA CAMPUS BY COLLEGE, RANK, AND SEX AUTUMN TERM 2012
FIFTEENTH DAY ENROLLMENT ADDENDUM 1 College, School, Freshmen Sophomores Juniors Seniors Vistor Total or Division Men Women Total Men Women Total Men Women Total Men Women Total Men Women Total Men Women Total
Undergraduate Arts and Sciences 72 91 163 30 35 65 18 35 53 15 42 57 135 203 338
Business 15 8 23 4 2 6 5 7 12 4 2 6 28 19 47Continuing Education 5 2 7 1 1 2 0 0 0 0 2 2 0 0 0 6 5 11Dentistry: Dental Hygiene 1 6 7 0 0 0 0 0 0 0 0 0 1 6 7Education and Human Ecology 12 22 34 3 21 24 4 12 16 16 20 36 35 75 110
Engineering, Total 24 6 30 3 0 3 0 0 0 0 0 0 27 6 33 Engineering 22 5 27 3 0 3 0 0 0 0 0 0 25 5 30 Architecture 2 1 3 0 0 0 0 0 0 0 0 0 2 1 3
Exploration Program 121 87 208 50 37 87 22 35 57 11 20 31 204 179 383
Food, Agricultural, and Environmental Sciences (FAES),Total 14 16 30 1 3 4 1 0 1 1 0 1 17 19 36
Environment and Natural Resources 2 0 2 0 0 0 1 0 1 1 0 1 4 0 4
FAES 12 16 28 1 3 4 0 0 0 0 0 0 13 19 32
Health and Rehabilitation Sciences 11 18 29 1 1 2 0 2 2 0 13 13 12 34 46Nursing 1 1 2 0 0 0 0 1 1 0 0 0 1 2 3Pharmacy 0 0 0 0 0 0 0 0 0 0 0 0 0 0 0Public Affairs 0 0 0 0 0 0 0 0 0 0 0 0 0 0 0Public Health 0 0 0 0 0 0 0 0 0 0 0 0 0 0 0Social Work 0 7 7 0 2 2 0 1 1 0 1 1 0 11 11Undergraduate Student Academic Services 14 22 36 2 2 4 1 0 1 1 0 1 18 24 42
Total 290 286 576 95 104 199 51 93 144 48 100 148 0 0 0 484 583 1,067
Graduate
Total 12 52 64
GRAND TOTAL 290 286 576 95 104 199 51 93 144 48 100 148 0 0 0 496 635 1,131
THE OHIO STATE UNIVERSITY Office of Enrollment ServicesSeptember 11, 2012

MANSFIELD CAMPUS BY COLLEGE, RANK, AND SEX AUTUMN TERM 2012
FIFTEENTH DAY ENROLLMENT ADDENDUM 2 College, School, Freshmen Sophomores Juniors Seniors Vistor Total or Division Men Women Total Men Women Total Men Women Total Men Women Total Men Women Total Men Women Total
Undergraduate Arts and Sciences 90 104 194 43 46 89 22 37 59 34 58 92 189 245 434
Business 8 8 16 9 2 11 6 4 10 12 11 23 35 25 60Continuing Education 7 5 12 1 0 1 0 0 0 0 2 2 0 0 0 8 7 15Dentistry: Dental Hygiene 0 5 5 0 1 1 0 1 1 0 0 0 0 7 7Education and Human Ecology 14 42 56 7 22 29 6 22 28 15 27 42 42 113 155
Engineering, Total 37 4 41 3 0 3 1 1 2 0 0 0 41 5 46 Engineering 33 3 36 3 0 3 1 1 2 0 0 0 37 4 41 Architecture 4 1 5 0 0 0 0 0 0 0 0 0 4 1 5
Exploration Program 137 103 240 31 35 66 11 9 20 5 6 11 184 153 337
Food, Agricultural, and Environmental Sciences (FAES),Total 7 8 15 3 5 8 1 2 3 0 0 0 11 15 26
Environment and Natural Resources 2 2 4 1 0 1 0 1 1 0 0 0 3 3 6
FAES 5 6 11 2 5 7 1 1 2 0 0 0 8 12 20
Health and Rehabilitation Sciences 15 15 30 5 3 8 0 0 0 0 2 2 20 20 40Nursing 1 2 3 0 1 1 1 2 3 0 4 4 2 9 11Pharmacy 0 0 0 0 0 0 0 0 0 0 0 0 0 0 0Public Affairs 0 0 0 0 0 0 0 0 0 0 0 0 0 0 0Public Health 0 0 0 0 0 0 0 0 0 0 0 0 0 0 0Social Work 6 13 19 1 5 6 2 6 8 2 2 4 11 26 37Undergraduate Student Academic Services 15 19 34 0 1 1 1 0 1 0 0 0 16 20 36
Total 337 328 665 103 121 224 51 84 135 68 112 180 0 0 0 559 645 1,204
Graduate
Total 9 52 61
GRAND TOTAL 337 328 665 103 121 224 51 84 135 68 112 180 0 0 0 568 697 1,265
THE OHIO STATE UNIVERSITY Office of Enrollment ServicesSeptember 11, 2012

MARION CAMPUS BY COLLEGE, RANK, AND SEX AUTUMN TERM 2012
FIFTEENTH DAY ENROLLMENT ADDENDUM 3 College, School, Freshmen Sophomores Juniors Seniors Vistor Total or Division Men Women Total Men Women Total Men Women Total Men Women Total Men Women Total Men Women Total
Undergraduate Arts and Sciences 78 68 146 42 38 80 32 42 74 20 46 66 172 194 366
Business 18 6 24 6 5 11 4 2 6 8 6 14 36 19 55Continuing Education 1 3 4 0 0 0 0 0 0 0 5 5 1 0 1 2 8 10Dentistry: Dental Hygiene 0 3 3 0 0 0 0 0 0 0 0 0 0 3 3Education and Human Ecology 8 44 52 12 30 42 7 31 38 11 53 64 38 158 196
Engineering, Total 32 3 35 7 1 8 14 1 15 4 2 6 57 7 64 Engineering 28 3 31 7 1 8 14 1 15 4 2 6 53 7 60 Architecture 4 0 4 0 0 0 0 0 0 0 0 0 4 0 4
Exploration Program 127 99 226 36 33 69 8 8 16 6 10 16 177 150 327
Food, Agricultural, and Environmental Sciences (FAES),Total 17 11 28 4 7 11 3 2 5 0 2 2 24 22 46
Environment and Natural Resources 6 2 8 0 1 1 2 0 2 0 0 0 8 3 11
FAES 11 9 20 4 6 10 1 2 3 0 2 2 16 19 35
Health and Rehabilitation Sciences 11 10 21 2 2 4 1 2 3 0 0 0 14 14 28Nursing 0 12 12 0 3 3 0 0 0 1 1 2 1 16 17Pharmacy 0 0 0 0 0 0 0 0 0 0 0 0 0 0 0Public Affairs 1 0 1 0 0 0 0 0 0 0 0 0 1 0 1Public Health 0 0 0 0 0 0 0 0 0 0 0 0 0 0 0Social Work 0 12 12 1 9 10 0 3 3 0 3 3 1 27 28Undergraduate Student Academic Services 17 18 35 9 12 21 6 9 15 4 8 12 36 47 83
Total 310 289 599 119 140 259 75 100 175 54 136 190 1 0 1 559 665 1,224
Graduate
Total 11 38 49
GRAND TOTAL 310 289 599 119 140 259 75 100 175 54 136 190 1 0 1 570 703 1,273
THE OHIO STATE UNIVERSITY Office of Enrollment ServicesSeptember 11, 2012
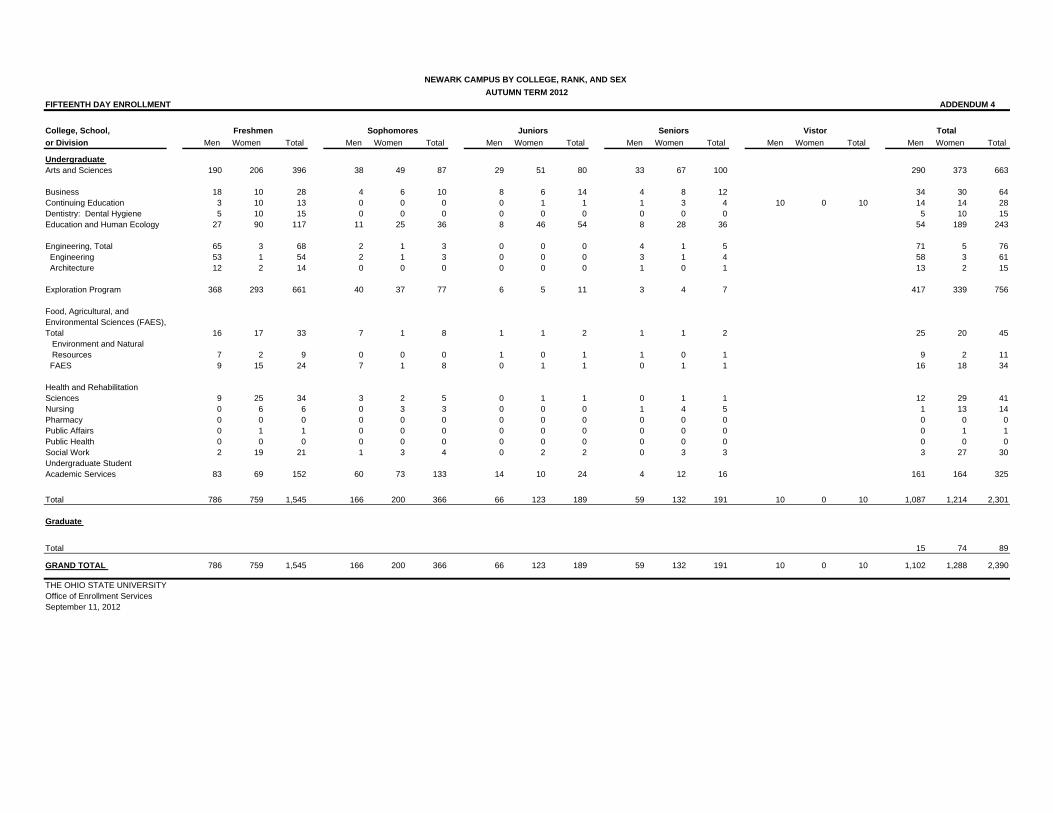
NEWARK CAMPUS BY COLLEGE, RANK, AND SEX AUTUMN TERM 2012
FIFTEENTH DAY ENROLLMENT ADDENDUM 4 College, School, Freshmen Sophomores Juniors Seniors Vistor Total or Division Men Women Total Men Women Total Men Women Total Men Women Total Men Women Total Men Women Total
Undergraduate Arts and Sciences 190 206 396 38 49 87 29 51 80 33 67 100 290 373 663
Business 18 10 28 4 6 10 8 6 14 4 8 12 34 30 64Continuing Education 3 10 13 0 0 0 0 1 1 1 3 4 10 0 10 14 14 28Dentistry: Dental Hygiene 5 10 15 0 0 0 0 0 0 0 0 0 5 10 15Education and Human Ecology 27 90 117 11 25 36 8 46 54 8 28 36 54 189 243
Engineering, Total 65 3 68 2 1 3 0 0 0 4 1 5 71 5 76 Engineering 53 1 54 2 1 3 0 0 0 3 1 4 58 3 61 Architecture 12 2 14 0 0 0 0 0 0 1 0 1 13 2 15
Exploration Program 368 293 661 40 37 77 6 5 11 3 4 7 417 339 756
Food, Agricultural, and Environmental Sciences (FAES),Total 16 17 33 7 1 8 1 1 2 1 1 2 25 20 45
Environment and Natural Resources 7 2 9 0 0 0 1 0 1 1 0 1 9 2 11
FAES 9 15 24 7 1 8 0 1 1 0 1 1 16 18 34
Health and Rehabilitation Sciences 9 25 34 3 2 5 0 1 1 0 1 1 12 29 41Nursing 0 6 6 0 3 3 0 0 0 1 4 5 1 13 14Pharmacy 0 0 0 0 0 0 0 0 0 0 0 0 0 0 0Public Affairs 0 1 1 0 0 0 0 0 0 0 0 0 0 1 1Public Health 0 0 0 0 0 0 0 0 0 0 0 0 0 0 0Social Work 2 19 21 1 3 4 0 2 2 0 3 3 3 27 30Undergraduate Student Academic Services 83 69 152 60 73 133 14 10 24 4 12 16 161 164 325
Total 786 759 1,545 166 200 366 66 123 189 59 132 191 10 0 10 1,087 1,214 2,301
Graduate
Total 15 74 89
GRAND TOTAL 786 759 1,545 166 200 366 66 123 189 59 132 191 10 0 10 1,102 1,288 2,390
THE OHIO STATE UNIVERSITY Office of Enrollment ServicesSeptember 11, 2012
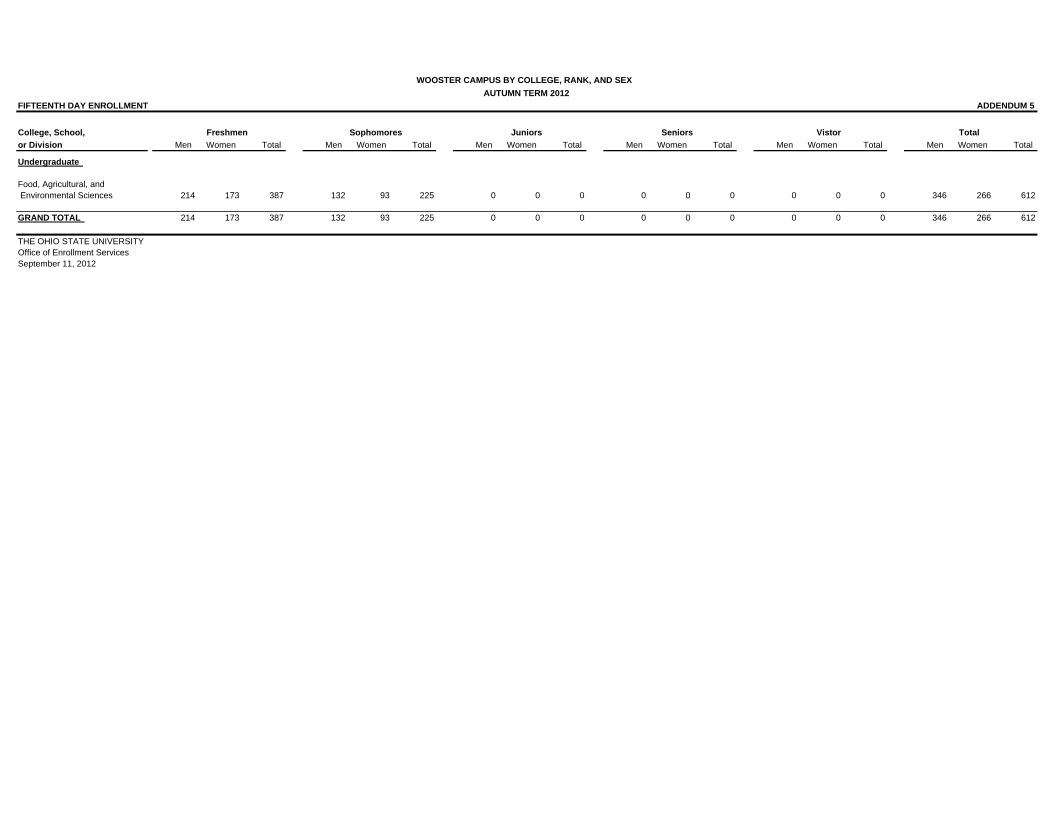
WOOSTER CAMPUS BY COLLEGE, RANK, AND SEX AUTUMN TERM 2012
FIFTEENTH DAY ENROLLMENT ADDENDUM 5 College, School, Freshmen Sophomores Juniors Seniors Vistor Total or Division Men Women Total Men Women Total Men Women Total Men Women Total Men Women Total Men Women Total
Undergraduate
Food, Agricultural, and Environmental Sciences 214 173 387 132 93 225 0 0 0 0 0 0 0 0 0 346 266 612
GRAND TOTAL 214 173 387 132 93 225 0 0 0 0 0 0 0 0 0 346 266 612
THE OHIO STATE UNIVERSITY Office of Enrollment ServicesSeptember 11, 2012
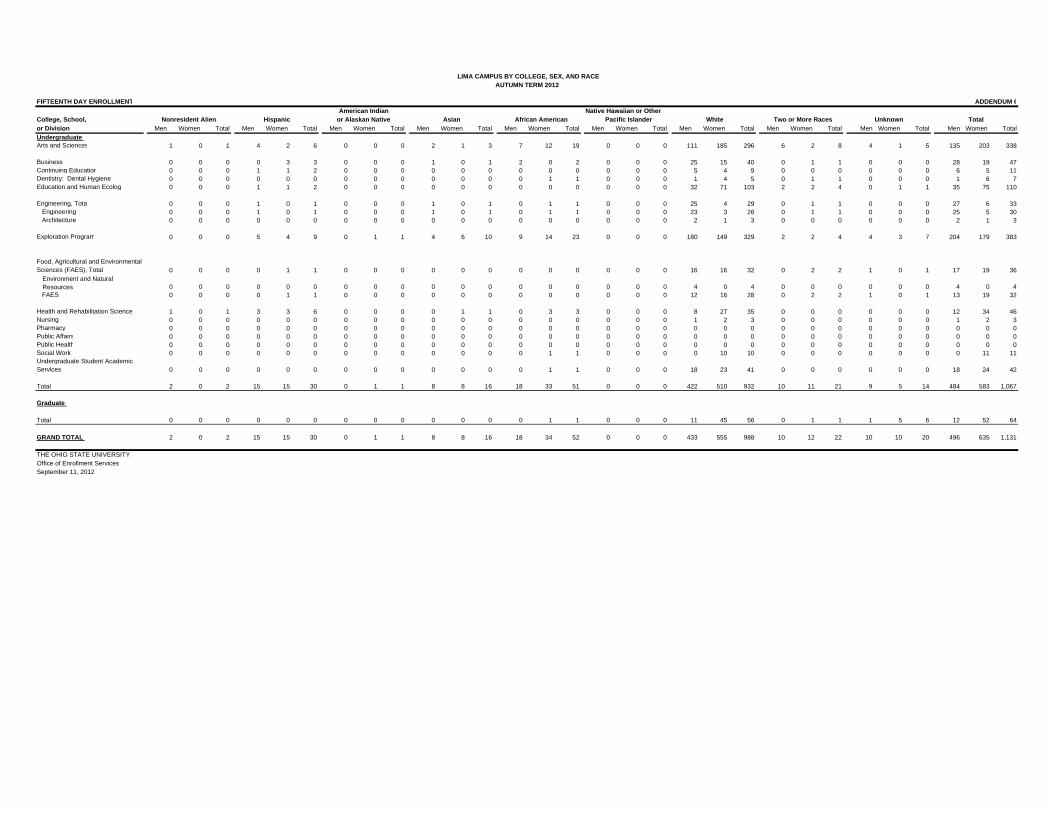
LIMA CAMPUS BY COLLEGE, SEX, AND RACEAUTUMN TERM 2012
FIFTEENTH DAY ENROLLMENT ADDENDUM 6 American Indian Native Hawaiian or Other College, School, Nonresident Alien Hispanic or Alaskan Native Asian African American Pacific Islander White Two or More Races Unknown Totalor Division Men Women Total Men Women Total Men Women Total Men Women Total Men Women Total Men Women Total Men Women Total Men Women Total Men Women Total Men Women TotalUndergraduate Arts and Sciences 1 0 1 4 2 6 0 0 0 2 1 3 7 12 19 0 0 0 111 185 296 6 2 8 4 1 5 135 203 338 Business 0 0 0 0 3 3 0 0 0 1 0 1 2 0 2 0 0 0 25 15 40 0 1 1 0 0 0 28 19 47Continuing Education 0 0 0 1 1 2 0 0 0 0 0 0 0 0 0 0 0 0 5 4 9 0 0 0 0 0 0 6 5 11Dentistry: Dental Hygiene 0 0 0 0 0 0 0 0 0 0 0 0 0 1 1 0 0 0 1 4 5 0 1 1 0 0 0 1 6 7Education and Human Ecology 0 0 0 1 1 2 0 0 0 0 0 0 0 0 0 0 0 0 32 71 103 2 2 4 0 1 1 35 75 110
Engineering, Tota 0 0 0 1 0 1 0 0 0 1 0 1 0 1 1 0 0 0 25 4 29 0 1 1 0 0 0 27 6 33 Engineering 0 0 0 1 0 1 0 0 0 1 0 1 0 1 1 0 0 0 23 3 26 0 1 1 0 0 0 25 5 30 Architecture 0 0 0 0 0 0 0 0 0 0 0 0 0 0 0 0 0 0 2 1 3 0 0 0 0 0 0 2 1 3
Exploration Program 0 0 0 5 4 9 0 1 1 4 6 10 9 14 23 0 0 0 180 149 329 2 2 4 4 3 7 204 179 383
Food, Agricultural and Environmental Sciences (FAES), Total 0 0 0 0 1 1 0 0 0 0 0 0 0 0 0 0 0 0 16 16 32 0 2 2 1 0 1 17 19 36
Environment and Natural Resources 0 0 0 0 0 0 0 0 0 0 0 0 0 0 0 0 0 0 4 0 4 0 0 0 0 0 0 4 0 4
FAES 0 0 0 0 1 1 0 0 0 0 0 0 0 0 0 0 0 0 12 16 28 0 2 2 1 0 1 13 19 32
Health and Rehabilitation Sciences 1 0 1 3 3 6 0 0 0 0 1 1 0 3 3 0 0 0 8 27 35 0 0 0 0 0 0 12 34 46Nursing 0 0 0 0 0 0 0 0 0 0 0 0 0 0 0 0 0 0 1 2 3 0 0 0 0 0 0 1 2 3Pharmacy 0 0 0 0 0 0 0 0 0 0 0 0 0 0 0 0 0 0 0 0 0 0 0 0 0 0 0 0 0 0Public Affairs 0 0 0 0 0 0 0 0 0 0 0 0 0 0 0 0 0 0 0 0 0 0 0 0 0 0 0 0 0 0Public Health 0 0 0 0 0 0 0 0 0 0 0 0 0 0 0 0 0 0 0 0 0 0 0 0 0 0 0 0 0 0Social Work 0 0 0 0 0 0 0 0 0 0 0 0 0 1 1 0 0 0 0 10 10 0 0 0 0 0 0 0 11 11Undergraduate Student AcademicServices 0 0 0 0 0 0 0 0 0 0 0 0 0 1 1 0 0 0 18 23 41 0 0 0 0 0 0 18 24 42 Total 2 0 2 15 15 30 0 1 1 8 8 16 18 33 51 0 0 0 422 510 932 10 11 21 9 5 14 484 583 1,067
Graduate
Total 0 0 0 0 0 0 0 0 0 0 0 0 0 1 1 0 0 0 11 45 56 0 1 1 1 5 6 12 52 64
GRAND TOTAL 2 0 2 15 15 30 0 1 1 8 8 16 18 34 52 0 0 0 433 555 988 10 12 22 10 10 20 496 635 1,131
THE OHIO STATE UNIVERSITY Office of Enrollment ServicesSeptember 11, 2012

MANSFIELD CAMPUS BY COLLEGE, SEX, AND RACEAUTUMN TERM 2012
FIFTEENTH DAY ENROLLMENT ADDENDUM 7 American Indian Native Hawaiian or Other College, School, Nonresident Alien Hispanic or Alaskan Native Asian African American Pacific Islander White Two or More Races Unknown Totalor Division Men Women Total Men Women Total Men Women Total Men Women Total Men Women Total Men Women Total Men Women Total Men Women Total Men Women Total Men Women TotalUndergraduate Arts and Sciences 0 0 0 3 6 9 1 0 1 2 4 6 13 22 35 0 0 0 161 202 363 5 6 11 4 5 9 189 245 434 Business 0 0 0 2 0 2 0 0 0 1 0 1 0 3 3 0 0 0 32 22 54 0 0 0 0 0 0 35 25 60Continuing Education 0 0 0 0 0 0 0 0 0 0 0 0 0 0 0 0 0 0 8 7 15 0 0 0 0 0 0 8 7 15Dentistry: Dental Hygiene 0 0 0 0 0 0 0 0 0 0 0 0 0 1 1 0 0 0 0 6 6 0 0 0 0 0 0 0 7 7Education and Human Ecology 0 0 0 0 1 1 0 0 0 0 1 1 2 4 6 0 0 0 39 106 145 0 0 0 1 1 2 42 113 155
Engineering, Tota 0 0 0 2 0 2 0 0 0 1 0 1 0 0 0 0 0 0 37 3 40 1 0 1 0 2 2 41 5 46 Engineering 0 0 0 2 0 2 0 0 0 1 0 1 0 0 0 0 0 0 33 2 35 1 0 1 0 2 2 37 4 41 Architecture 0 0 0 0 0 0 0 0 0 0 0 0 0 0 0 0 0 0 4 1 5 0 0 0 0 0 0 4 1 5
Exploration Program 1 0 1 5 3 8 1 1 2 2 1 3 14 19 33 0 0 0 151 121 272 4 4 8 6 4 10 184 153 337
Food, Agricultural and Environmental Sciences (FAES), Total 0 0 0 0 1 1 0 0 0 0 0 0 0 1 1 0 0 0 11 13 24 0 0 0 0 0 0 11 15 26
Environment and Natural Resources 0 0 0 0 0 0 0 0 0 0 0 0 0 1 1 0 0 0 3 2 5 0 0 0 0 0 0 3 3 6
FAES 0 0 0 0 1 1 0 0 0 0 0 0 0 0 0 0 0 0 8 11 19 0 0 0 0 0 0 8 12 20
Health and Rehabilitation Sciences 0 0 0 0 0 0 0 0 0 0 1 1 4 2 6 0 0 0 15 16 31 0 0 0 1 1 2 20 20 40Nursing 0 0 0 1 0 1 0 0 0 0 0 0 0 0 0 0 0 0 1 9 10 0 0 0 0 0 0 2 9 11Pharmacy 0 0 0 0 0 0 0 0 0 0 0 0 0 0 0 0 0 0 0 0 0 0 0 0 0 0 0 0 0 0Public Affairs 0 0 0 0 0 0 0 0 0 0 0 0 0 0 0 0 0 0 0 0 0 0 0 0 0 0 0 0 0 0Public Health 0 0 0 0 0 0 0 0 0 0 0 0 0 0 0 0 0 0 0 0 0 0 0 0 0 0 0 0 0 0Social Work 0 0 0 0 1 1 0 0 0 0 0 0 3 2 5 0 0 0 8 21 29 0 0 0 0 2 2 11 26 37Undergraduate Student AcademicServices 0 0 0 0 0 0 0 0 0 0 2 2 0 0 0 0 0 0 16 17 33 0 1 1 0 0 0 16 20 36 Total 1 0 1 13 12 25 2 1 3 6 9 15 36 54 90 0 0 0 479 543 1,022 10 11 21 12 15 27 559 645 1,204
Graduate
Total 0 0 0 0 0 0 0 0 0 0 0 0 0 0 0 0 0 0 9 50 59 0 0 0 0 2 2 9 52 61
GRAND TOTAL 1 0 1 13 12 25 2 1 3 6 9 15 36 54 90 0 0 0 488 593 1,081 10 11 21 12 17 29 568 697 1,265
THE OHIO STATE UNIVERSITY Office of Enrollment ServicesSeptember 11, 2012

MARION CAMPUS BY COLLEGE, SEX, AND RACEAUTUMN TERM 2012
FIFTEENTH DAY ENROLLMENT ADDENDUM 8 American Indian Native Hawaiian or Other College, School, Nonresident Alien Hispanic or Alaskan Native Asian African American Pacific Islander White Two or More Races Unknown Totalor Division Men Women Total Men Women Total Men Women Total Men Women Total Men Women Total Men Women Total Men Women Total Men Women Total Men Women Total Men Women TotalUndergraduate Arts and Sciences 0 1 1 4 6 10 1 2 3 9 8 17 15 6 21 0 0 0 138 166 304 2 3 5 3 2 5 172 194 366 Business 0 0 0 2 0 2 0 0 0 1 1 2 1 0 1 0 0 0 31 18 49 1 0 1 0 0 0 36 19 55Continuing Education 0 0 0 0 0 0 0 0 0 0 0 0 0 0 0 0 0 0 2 7 9 0 0 0 0 1 1 2 8 10Dentistry: Dental Hygiene 0 0 0 0 0 0 0 0 0 0 0 0 0 0 0 0 0 0 0 2 2 0 1 1 0 0 0 0 3 3Education and Human Ecology 0 0 0 0 2 2 0 1 1 0 1 1 2 1 3 0 0 0 36 151 187 0 0 0 0 2 2 38 158 196
Engineering, Tota 0 0 0 0 0 0 0 0 0 6 1 7 1 1 2 0 0 0 47 4 51 2 1 3 1 0 1 57 7 64 Engineering 0 0 0 0 0 0 0 0 0 6 1 7 1 1 2 0 0 0 44 4 48 1 1 2 1 0 1 53 7 60 Architecture 0 0 0 0 0 0 0 0 0 0 0 0 0 0 0 0 0 0 3 0 3 1 0 1 0 0 0 4 0 4
Exploration Program 0 0 0 6 3 9 1 0 1 8 6 14 17 17 34 1 0 1 139 117 256 3 6 9 2 1 3 177 150 327
Food, Agricultural and Environmental Sciences (FAES), Total 0 0 0 0 1 1 0 0 0 0 0 0 0 0 0 0 0 0 22 20 42 1 0 1 1 1 2 24 22 46
Environment and Natural Resources 0 0 0 0 0 0 0 0 0 0 0 0 0 0 0 0 0 0 7 2 9 1 0 1 0 1 1 8 3 11
FAES 0 0 0 0 1 1 0 0 0 0 0 0 0 0 0 0 0 0 15 18 33 0 0 0 1 0 1 16 19 35
Health and Rehabilitation Sciences 0 0 0 0 1 1 0 0 0 1 0 1 2 3 5 0 0 0 10 10 20 0 0 0 1 0 1 14 14 28Nursing 0 0 0 0 2 2 0 0 0 0 2 2 0 1 1 0 0 0 1 11 12 0 0 0 0 0 0 1 16 17Pharmacy 0 0 0 0 0 0 0 0 0 0 0 0 0 0 0 0 0 0 0 0 0 0 0 0 0 0 0 0 0 0Public Affairs 0 0 0 0 0 0 0 0 0 0 0 0 0 0 0 0 0 0 1 0 1 0 0 0 0 0 0 1 0 1Public Health 0 0 0 0 0 0 0 0 0 0 0 0 0 0 0 0 0 0 0 0 0 0 0 0 0 0 0 0 0 0Social Work 0 0 0 0 0 0 0 0 0 0 0 0 0 3 3 0 0 0 1 23 24 0 1 1 0 0 0 1 27 28Undergraduate Student AcademicServices 0 0 0 2 0 2 0 0 0 0 0 0 2 4 6 0 1 1 32 38 70 0 3 3 0 1 1 36 47 83 Total 0 1 1 14 15 29 2 3 5 25 19 44 40 36 76 1 1 2 460 567 1,027 9 15 24 8 8 16 559 665 1,224
Graduate
Total 0 0 0 0 1 1 0 0 0 0 1 1 0 0 0 0 0 0 11 36 47 0 0 0 0 0 0 11 38 49
GRAND TOTAL 0 1 1 14 16 30 2 3 5 25 20 45 40 36 76 1 1 2 471 603 1,074 9 15 24 8 8 16 570 703 1,273
THE OHIO STATE UNIVERSITY Office of Enrollment ServicesSeptember 11, 2012
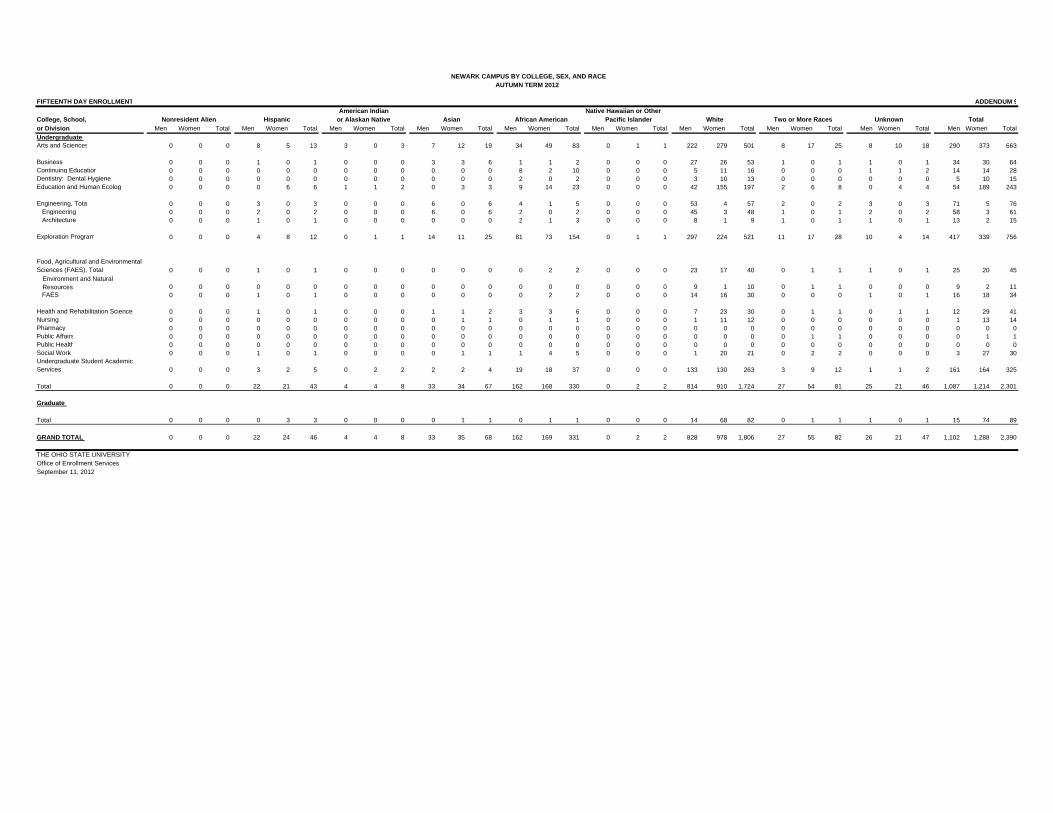
NEWARK CAMPUS BY COLLEGE, SEX, AND RACEAUTUMN TERM 2012
FIFTEENTH DAY ENROLLMENT ADDENDUM 9 American Indian Native Hawaiian or Other College, School, Nonresident Alien Hispanic or Alaskan Native Asian African American Pacific Islander White Two or More Races Unknown Totalor Division Men Women Total Men Women Total Men Women Total Men Women Total Men Women Total Men Women Total Men Women Total Men Women Total Men Women Total Men Women TotalUndergraduate Arts and Sciences 0 0 0 8 5 13 3 0 3 7 12 19 34 49 83 0 1 1 222 279 501 8 17 25 8 10 18 290 373 663 Business 0 0 0 1 0 1 0 0 0 3 3 6 1 1 2 0 0 0 27 26 53 1 0 1 1 0 1 34 30 64Continuing Education 0 0 0 0 0 0 0 0 0 0 0 0 8 2 10 0 0 0 5 11 16 0 0 0 1 1 2 14 14 28Dentistry: Dental Hygiene 0 0 0 0 0 0 0 0 0 0 0 0 2 0 2 0 0 0 3 10 13 0 0 0 0 0 0 5 10 15Education and Human Ecology 0 0 0 0 6 6 1 1 2 0 3 3 9 14 23 0 0 0 42 155 197 2 6 8 0 4 4 54 189 243
Engineering, Tota 0 0 0 3 0 3 0 0 0 6 0 6 4 1 5 0 0 0 53 4 57 2 0 2 3 0 3 71 5 76 Engineering 0 0 0 2 0 2 0 0 0 6 0 6 2 0 2 0 0 0 45 3 48 1 0 1 2 0 2 58 3 61 Architecture 0 0 0 1 0 1 0 0 0 0 0 0 2 1 3 0 0 0 8 1 9 1 0 1 1 0 1 13 2 15
Exploration Program 0 0 0 4 8 12 0 1 1 14 11 25 81 73 154 0 1 1 297 224 521 11 17 28 10 4 14 417 339 756
Food, Agricultural and Environmental Sciences (FAES), Total 0 0 0 1 0 1 0 0 0 0 0 0 0 2 2 0 0 0 23 17 40 0 1 1 1 0 1 25 20 45
Environment and Natural Resources 0 0 0 0 0 0 0 0 0 0 0 0 0 0 0 0 0 0 9 1 10 0 1 1 0 0 0 9 2 11
FAES 0 0 0 1 0 1 0 0 0 0 0 0 0 2 2 0 0 0 14 16 30 0 0 0 1 0 1 16 18 34
Health and Rehabilitation Sciences 0 0 0 1 0 1 0 0 0 1 1 2 3 3 6 0 0 0 7 23 30 0 1 1 0 1 1 12 29 41Nursing 0 0 0 0 0 0 0 0 0 0 1 1 0 1 1 0 0 0 1 11 12 0 0 0 0 0 0 1 13 14Pharmacy 0 0 0 0 0 0 0 0 0 0 0 0 0 0 0 0 0 0 0 0 0 0 0 0 0 0 0 0 0 0Public Affairs 0 0 0 0 0 0 0 0 0 0 0 0 0 0 0 0 0 0 0 0 0 0 1 1 0 0 0 0 1 1Public Health 0 0 0 0 0 0 0 0 0 0 0 0 0 0 0 0 0 0 0 0 0 0 0 0 0 0 0 0 0 0Social Work 0 0 0 1 0 1 0 0 0 0 1 1 1 4 5 0 0 0 1 20 21 0 2 2 0 0 0 3 27 30Undergraduate Student AcademicServices 0 0 0 3 2 5 0 2 2 2 2 4 19 18 37 0 0 0 133 130 263 3 9 12 1 1 2 161 164 325 Total 0 0 0 22 21 43 4 4 8 33 34 67 162 168 330 0 2 2 814 910 1,724 27 54 81 25 21 46 1,087 1,214 2,301
Graduate
Total 0 0 0 0 3 3 0 0 0 0 1 1 0 1 1 0 0 0 14 68 82 0 1 1 1 0 1 15 74 89
GRAND TOTAL 0 0 0 22 24 46 4 4 8 33 35 68 162 169 331 0 2 2 828 978 1,806 27 55 82 26 21 47 1,102 1,288 2,390
THE OHIO STATE UNIVERSITY Office of Enrollment ServicesSeptember 11, 2012

WOOSTER CAMPUS BY COLLEGE, SEX, AND RACEAUTUMN TERM 2012
FIFTEENTH DAY ENROLLMENT ADDENDUM 10 American Indian Native Hawaiian or Other College, School, Nonresident Alien Hispanic or Alaskan Native Asian African American Pacific Islander White Two or More Races Unknown Totalor Division Men Women Total Men Women Total Men Women Total Men Women Total Men Women Total Men Women Total Men Women Total Men Women Total Men Women Total Men Women Total
Undergraduate
Food, Agricultural, and Environmental Sciences 0 0 0 6 2 8 1 1 2 2 1 3 2 2 4 0 0 0 324 250 574 2 4 6 9 6 15 346 266 612 GRAND TOTAL 0 0 0 6 2 8 1 1 2 2 1 3 2 2 4 0 0 0 324 250 574 2 4 6 9 6 15 346 266 612
THE OHIO STATE UNIVERSITY Office of Enrollment ServicesSeptember 11, 2012
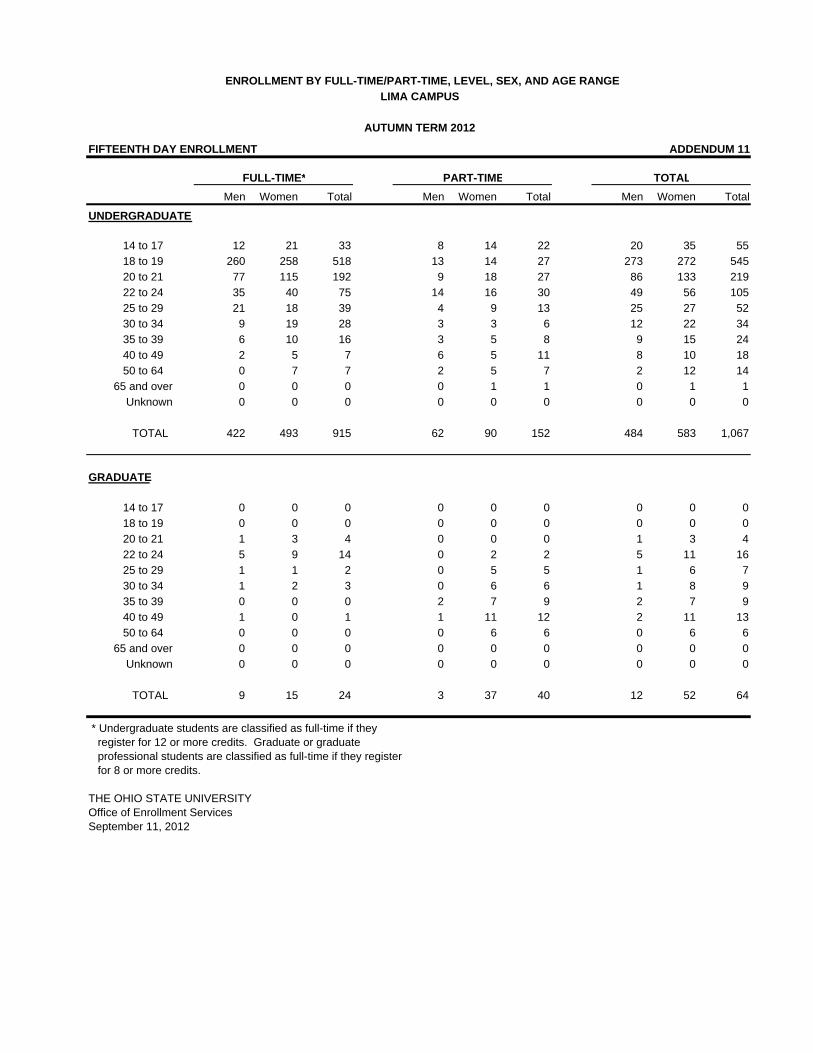
ENROLLMENT BY FULL-TIME/PART-TIME, LEVEL, SEX, AND AGE RANGELIMA CAMPUS
AUTUMN TERM 2012
FIFTEENTH DAY ENROLLMENT ADDENDUM 11
FULL-TIME* PART-TIME TOTAL Men Women Total Men Women Total Men Women Total
UNDERGRADUATE 14 to 17 12 21 33 8 14 22 20 35 55 18 to 19 260 258 518 13 14 27 273 272 545 20 to 21 77 115 192 9 18 27 86 133 219 22 to 24 35 40 75 14 16 30 49 56 105 25 to 29 21 18 39 4 9 13 25 27 52 30 to 34 9 19 28 3 3 6 12 22 34 35 to 39 6 10 16 3 5 8 9 15 24 40 to 49 2 5 7 6 5 11 8 10 18 50 to 64 0 7 7 2 5 7 2 12 14 65 and over 0 0 0 0 1 1 0 1 1 Unknown 0 0 0 0 0 0 0 0 0 TOTAL 422 493 915 62 90 152 484 583 1,067
GRADUATE 14 to 17 0 0 0 0 0 0 0 0 0 18 to 19 0 0 0 0 0 0 0 0 0 20 to 21 1 3 4 0 0 0 1 3 4 22 to 24 5 9 14 0 2 2 5 11 16 25 to 29 1 1 2 0 5 5 1 6 7 30 to 34 1 2 3 0 6 6 1 8 9 35 to 39 0 0 0 2 7 9 2 7 9 40 to 49 1 0 1 1 11 12 2 11 13 50 to 64 0 0 0 0 6 6 0 6 6 65 and over 0 0 0 0 0 0 0 0 0 Unknown 0 0 0 0 0 0 0 0 0 TOTAL 9 15 24 3 37 40 12 52 64
* Undergraduate students are classified as full-time if they register for 12 or more credits. Graduate or graduate professional students are classified as full-time if they register for 8 or more credits. THE OHIO STATE UNIVERSITY Office of Enrollment ServicesSeptember 11, 2012
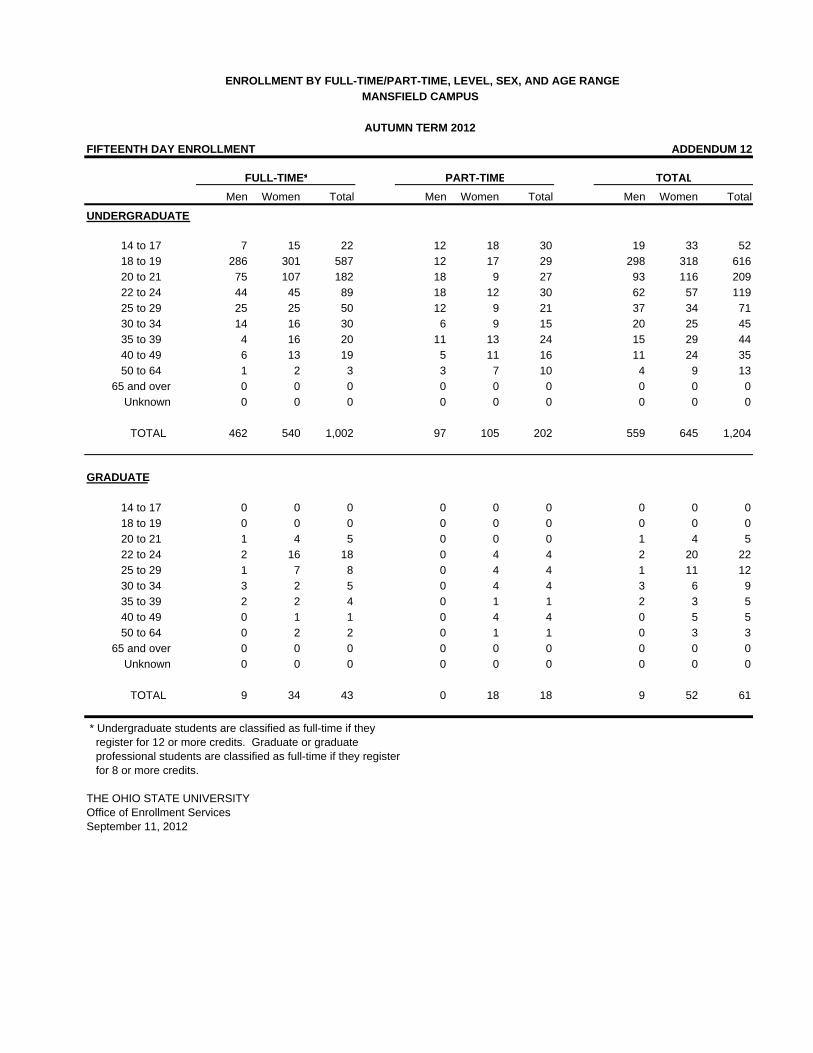
ENROLLMENT BY FULL-TIME/PART-TIME, LEVEL, SEX, AND AGE RANGEMANSFIELD CAMPUS
AUTUMN TERM 2012
FIFTEENTH DAY ENROLLMENT ADDENDUM 12
FULL-TIME* PART-TIME TOTAL Men Women Total Men Women Total Men Women Total
UNDERGRADUATE 14 to 17 7 15 22 12 18 30 19 33 52 18 to 19 286 301 587 12 17 29 298 318 616 20 to 21 75 107 182 18 9 27 93 116 209 22 to 24 44 45 89 18 12 30 62 57 119 25 to 29 25 25 50 12 9 21 37 34 71 30 to 34 14 16 30 6 9 15 20 25 45 35 to 39 4 16 20 11 13 24 15 29 44 40 to 49 6 13 19 5 11 16 11 24 35 50 to 64 1 2 3 3 7 10 4 9 13 65 and over 0 0 0 0 0 0 0 0 0 Unknown 0 0 0 0 0 0 0 0 0 TOTAL 462 540 1,002 97 105 202 559 645 1,204
GRADUATE 14 to 17 0 0 0 0 0 0 0 0 0 18 to 19 0 0 0 0 0 0 0 0 0 20 to 21 1 4 5 0 0 0 1 4 5 22 to 24 2 16 18 0 4 4 2 20 22 25 to 29 1 7 8 0 4 4 1 11 12 30 to 34 3 2 5 0 4 4 3 6 9 35 to 39 2 2 4 0 1 1 2 3 5 40 to 49 0 1 1 0 4 4 0 5 5 50 to 64 0 2 2 0 1 1 0 3 3 65 and over 0 0 0 0 0 0 0 0 0 Unknown 0 0 0 0 0 0 0 0 0 TOTAL 9 34 43 0 18 18 9 52 61
* Undergraduate students are classified as full-time if they register for 12 or more credits. Graduate or graduate professional students are classified as full-time if they register for 8 or more credits. THE OHIO STATE UNIVERSITY Office of Enrollment ServicesSeptember 11, 2012
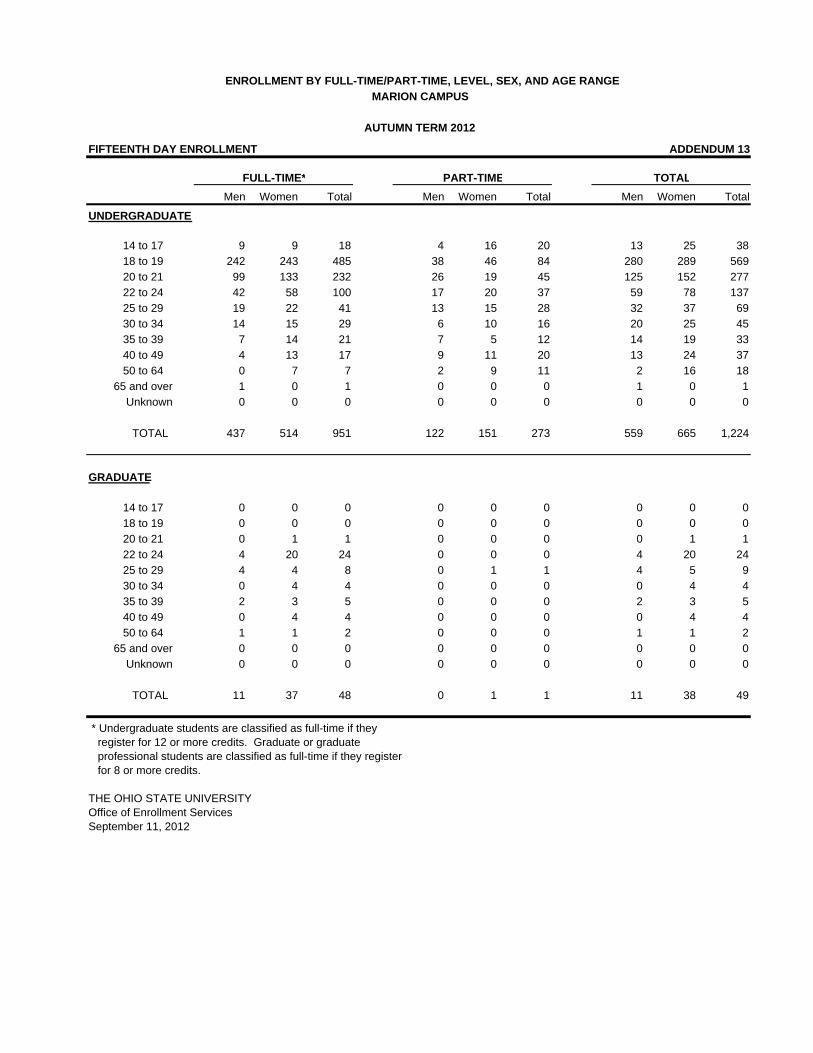
ENROLLMENT BY FULL-TIME/PART-TIME, LEVEL, SEX, AND AGE RANGEMARION CAMPUS
AUTUMN TERM 2012
FIFTEENTH DAY ENROLLMENT ADDENDUM 13
FULL-TIME* PART-TIME TOTAL Men Women Total Men Women Total Men Women Total
UNDERGRADUATE 14 to 17 9 9 18 4 16 20 13 25 38 18 to 19 242 243 485 38 46 84 280 289 569 20 to 21 99 133 232 26 19 45 125 152 277 22 to 24 42 58 100 17 20 37 59 78 137 25 to 29 19 22 41 13 15 28 32 37 69 30 to 34 14 15 29 6 10 16 20 25 45 35 to 39 7 14 21 7 5 12 14 19 33 40 to 49 4 13 17 9 11 20 13 24 37 50 to 64 0 7 7 2 9 11 2 16 18 65 and over 1 0 1 0 0 0 1 0 1 Unknown 0 0 0 0 0 0 0 0 0 TOTAL 437 514 951 122 151 273 559 665 1,224
GRADUATE 14 to 17 0 0 0 0 0 0 0 0 0 18 to 19 0 0 0 0 0 0 0 0 0 20 to 21 0 1 1 0 0 0 0 1 1 22 to 24 4 20 24 0 0 0 4 20 24 25 to 29 4 4 8 0 1 1 4 5 9 30 to 34 0 4 4 0 0 0 0 4 4 35 to 39 2 3 5 0 0 0 2 3 5 40 to 49 0 4 4 0 0 0 0 4 4 50 to 64 1 1 2 0 0 0 1 1 2 65 and over 0 0 0 0 0 0 0 0 0 Unknown 0 0 0 0 0 0 0 0 0 TOTAL 11 37 48 0 1 1 11 38 49
* Undergraduate students are classified as full-time if they register for 12 or more credits. Graduate or graduate professional students are classified as full-time if they register for 8 or more credits. THE OHIO STATE UNIVERSITY Office of Enrollment ServicesSeptember 11, 2012

ENROLLMENT BY FULL-TIME/PART-TIME, LEVEL, SEX, AND AGE RANGENEWARK CAMPUS
AUTUMN TERM 2012
FIFTEENTH DAY ENROLLMENT ADDENDUM 14
FULL-TIME* PART-TIME TOTAL Men Women Total Men Women Total Men Women Total
UNDERGRADUATE 14 to 17 36 56 92 14 24 38 50 80 130 18 to 19 647 630 1,277 37 53 90 684 683 1,367 20 to 21 136 169 305 30 31 61 166 200 366 22 to 24 54 53 107 28 36 64 82 89 171 25 to 29 36 37 73 23 23 46 59 60 119 30 to 34 8 16 24 10 20 30 18 36 54 35 to 39 5 14 19 6 11 17 11 25 36 40 to 49 4 14 18 9 18 27 13 32 45 50 to 64 0 3 3 4 6 10 4 9 13 65 and over 0 0 0 0 0 0 0 0 0 Unknown 0 0 0 0 0 0 0 0 0 TOTAL 926 992 1,918 161 222 383 1,087 1,214 2,301
GRADUATE 14 to 17 0 0 0 0 0 0 0 0 0 18 to 19 0 0 0 0 0 0 0 0 0 20 to 21 0 0 0 0 0 0 0 0 0 22 to 24 2 25 27 1 2 3 3 27 30 25 to 29 5 8 13 0 7 7 5 15 20 30 to 34 2 9 11 1 5 6 3 14 17 35 to 39 0 4 4 1 1 2 1 5 6 40 to 49 1 4 5 2 3 5 3 7 10 50 to 64 0 1 1 0 5 5 0 6 6 65 and over 0 0 0 0 0 0 0 0 0 Unknown 0 0 0 0 0 0 0 0 0 TOTAL 10 51 61 5 23 28 15 74 89
* Undergraduate students are classified as full-time if they register for 12 or more credits. Graduate or graduate professional students are classified as full-time if they register for 8 or more credits. THE OHIO STATE UNIVERSITY Office of Enrollment ServicesSeptember 11, 2012
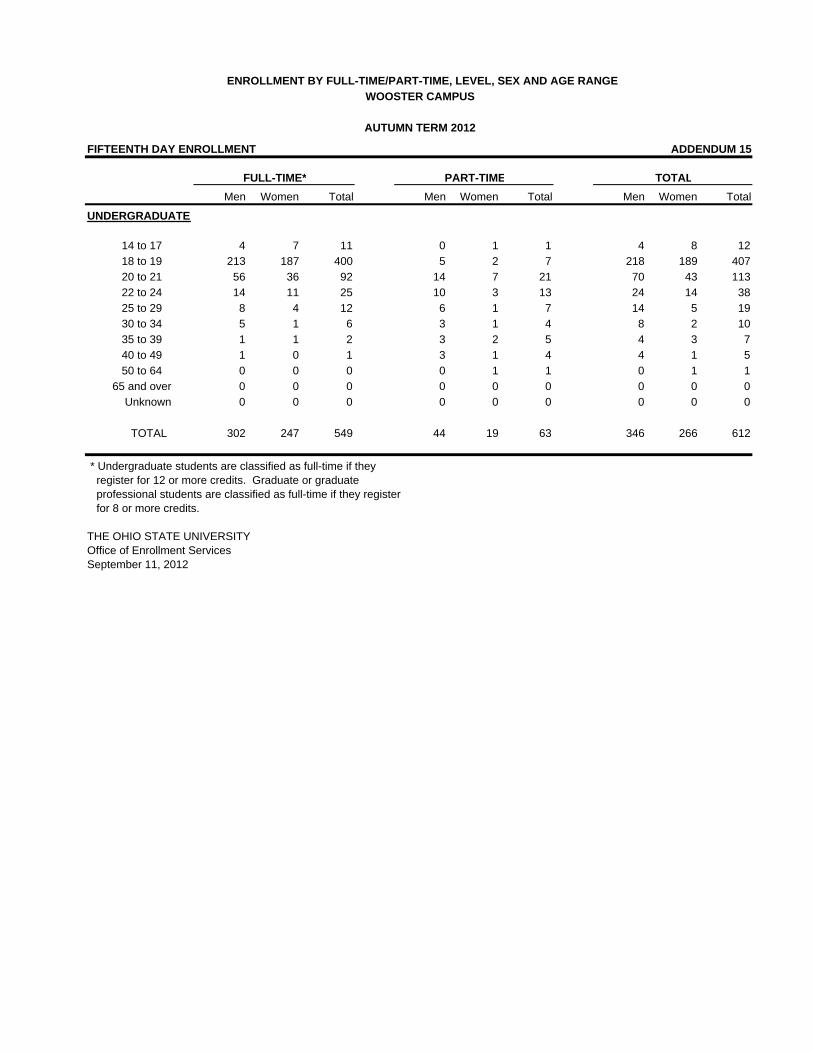
ENROLLMENT BY FULL-TIME/PART-TIME, LEVEL, SEX AND AGE RANGEWOOSTER CAMPUS
AUTUMN TERM 2012
FIFTEENTH DAY ENROLLMENT ADDENDUM 15
FULL-TIME* PART-TIME TOTAL Men Women Total Men Women Total Men Women Total
UNDERGRADUATE 14 to 17 4 7 11 0 1 1 4 8 12 18 to 19 213 187 400 5 2 7 218 189 407 20 to 21 56 36 92 14 7 21 70 43 113 22 to 24 14 11 25 10 3 13 24 14 38 25 to 29 8 4 12 6 1 7 14 5 19 30 to 34 5 1 6 3 1 4 8 2 10 35 to 39 1 1 2 3 2 5 4 3 7 40 to 49 1 0 1 3 1 4 4 1 5 50 to 64 0 0 0 0 1 1 0 1 1 65 and over 0 0 0 0 0 0 0 0 0 Unknown 0 0 0 0 0 0 0 0 0 TOTAL 302 247 549 44 19 63 346 266 612
* Undergraduate students are classified as full-time if they register for 12 or more credits. Graduate or graduate professional students are classified as full-time if they register for 8 or more credits. THE OHIO STATE UNIVERSITY Office of Enrollment ServicesSeptember 11, 2012
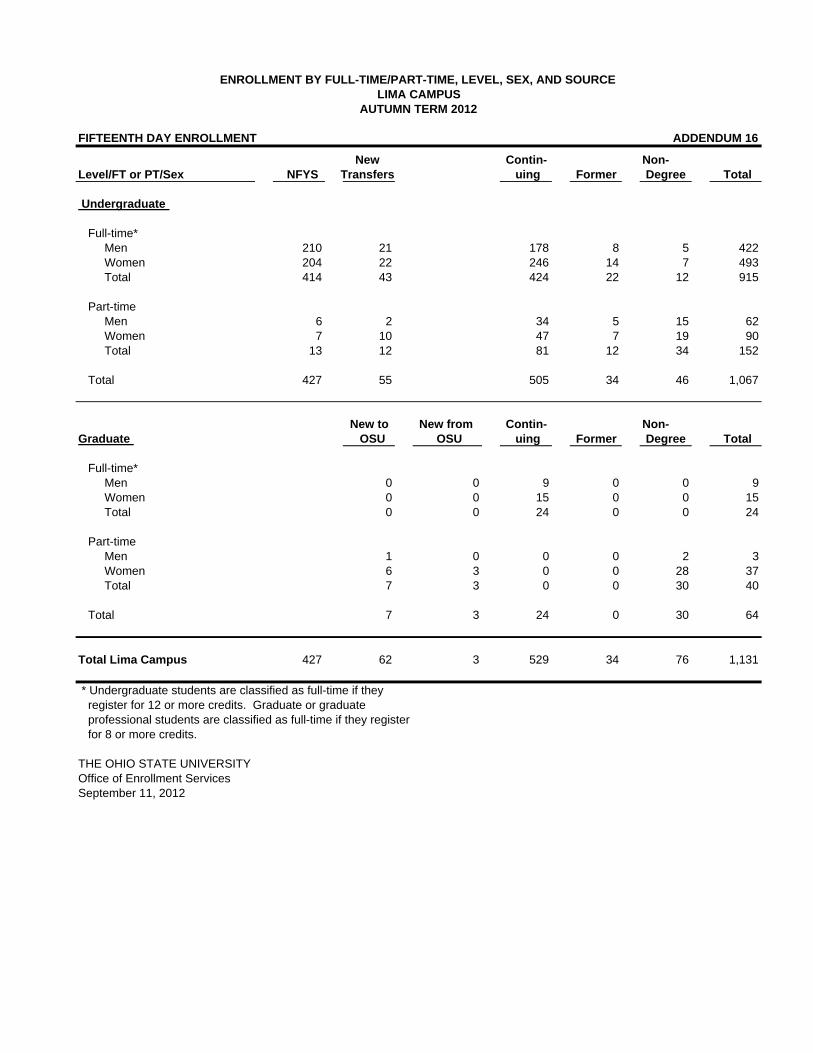
ENROLLMENT BY FULL-TIME/PART-TIME, LEVEL, SEX, AND SOURCELIMA CAMPUS
AUTUMN TERM 2012
FIFTEENTH DAY ENROLLMENT ADDENDUM 16
New Contin- Non- Level/FT or PT/Sex NFYS Transfers uing Former Degree Total
Undergraduate
Full-time* Men 210 21 178 8 5 422 Women 204 22 246 14 7 493 Total 414 43 424 22 12 915 Part-time Men 6 2 34 5 15 62 Women 7 10 47 7 19 90 Total 13 12 81 12 34 152 Total 427 55 505 34 46 1,067
New to New from Contin- Non- Graduate OSU OSU uing Former Degree Total
Full-time* Men 0 0 9 0 0 9 Women 0 0 15 0 0 15 Total 0 0 24 0 0 24 Part-time Men 1 0 0 0 2 3 Women 6 3 0 0 28 37 Total 7 3 0 0 30 40 Total 7 3 24 0 30 64
Total Lima Campus 427 62 3 529 34 76 1,131
* Undergraduate students are classified as full-time if they register for 12 or more credits. Graduate or graduate professional students are classified as full-time if they register for 8 or more credits.
THE OHIO STATE UNIVERSITY Office of Enrollment ServicesSeptember 11, 2012

ENROLLMENT BY FULL-TIME/PART-TIME, LEVEL, SEX, AND SOURCEMANSFIELD CAMPUSAUTUMN TERM 2012
FIFTEENTH DAY ENROLLMENT ADDENDUM 17
New Contin- Non- Level/FT or PT/Sex NFYS Transfers uing Former Degree Total
Undergraduate
Full-time* Men 240 25 182 15 0 462 Women 230 33 263 12 2 540 Total 470 58 445 27 2 1,002 Part-time Men 6 7 52 9 23 97 Women 9 7 55 10 24 105 Total 15 14 107 19 47 202 Total 485 72 552 46 49 1,204
New to New from Contin- Non- Graduate OSU OSU uing Former Degree Total
Full-time* Men 0 2 7 0 0 9 Women 0 17 17 0 0 34 Total 0 19 24 0 0 43 Part-time Men 0 0 0 0 0 0 Women 3 4 9 1 1 18 Total 3 4 9 1 1 18 Total 3 23 33 1 1 61
Total Mansfield Campus 485 75 23 585 47 50 1,265
* Undergraduate students are classified as full-time if they register for 12 or more credits. Graduate or graduate professional students are classified as full-time if they register for 8 or more credits.
THE OHIO STATE UNIVERSITY Office of Enrollment ServicesSeptember 11, 2012

ENROLLMENT BY FULL-TIME/PART-TIME, LEVEL, SEX, AND SOURCEMARION CAMPUS
AUTUMN TERM 2012
FIFTEENTH DAY ENROLLMENT ADDENDUM 18
New Contin- Non- Level/FT or PT/Sex NFYS Transfers uing Former Degree Total
Undergraduate
Full-time* Men 187 21 210 15 4 437 Women 166 35 295 15 3 514 Total 353 56 505 30 7 951 Part-time Men 26 7 67 16 6 122 Women 30 14 70 19 18 151 Total 56 21 137 35 24 273 Total 409 77 642 65 31 1,224
New to New from Contin- Non-Graduate OSU OSU uing Former Degree Total
Full-time* Men 0 4 7 0 0 11 Women 0 11 26 0 0 37 Total 0 15 33 0 0 48 Part-time Men 0 0 0 0 0 0 Women 0 0 1 0 0 1 Total 0 0 1 0 0 1 Total 0 15 34 0 0 49
Total Marion Campus 409 77 15 676 65 31 1,273
* Undergraduate students are classified as full-time if they register for 12 or more credits. Graduate or graduate professional students are classified as full-time if they register for 8 or more credits.
THE OHIO STATE UNIVERSITY Office of Enrollment ServicesSeptember 11, 2012

ENROLLMENT BY FULL-TIME/PART-TIME, LEVEL, SEX, AND SOURCENEWARK CAMPUS
AUTUMN TERM 2012
FIFTEENTH DAY ENROLLMENT ADDENDUM 19
New Contin- Non- Level/FT or PT/Sex NFYS Transfers uing Former Degree Total
Undergraduate
Full-time* Men 566 39 290 26 5 926 Women 524 53 398 12 5 992 Total 1,090 92 688 38 10 1,918 Part-time Men 20 12 85 18 26 161 Women 26 11 128 22 35 222 Total 46 23 213 40 61 383 Total 1,136 115 901 78 71 2,301
New to New from Contin- Non-Graduate OSU OSU uing Former Degree Total
Full-time* Men 0 2 8 0 0 10 Women 1 8 40 0 2 51 Total 1 10 48 0 2 61 Part-time Men 0 0 2 0 3 5 Women 4 4 5 3 7 23 Total 4 4 7 3 10 28 Total 5 14 55 3 12 89
Total Newark Campus 1,136 120 14 956 81 83 2,390
* Undergraduate students are classified as full-time if they register for 12 or more credits. Graduate or graduate professional students are classified as full-time if they register for 8 or more credits.
THE OHIO STATE UNIVERSITY Office of Enrollment ServicesSeptember 11, 2012

ENROLLMENT BY FULL-TIME/PART-TIME, LEVEL, SEX, AND SOURCEWOOSTER CAMPUSAUTUMN TERM 2012
FIFTEENTH DAY ENROLLMENT ADDENDUM 20
New Contin- Non- Level/FT or PT/Sex NFYS Transfers uing Former Degree Total
Undergraduate
Full-time* Men 164 16 118 4 0 302 Women 140 14 90 3 0 247 Total 304 30 208 7 0 549 Part-time Men 2 3 31 6 2 44 Women 0 2 11 3 3 19 Total 2 5 42 9 5 63 Total 306 35 250 16 5 612
Total Wooster Campus 306 35 250 16 5 612
* Undergraduate students are classified as full-time if they register for 12 or more credits. Graduate or graduate professional students are classified as full-time if they register for 8 or more credits.
THE OHIO STATE UNIVERSITY Office of Enrollment ServicesSeptember 11, 2012

HEADCOUNT, CREDITS, AND CREDITS PER STUDENT BY LEVELEXTENDED CAMPUSES
AUTUMN TERM 2012FIFTEENTH DAY ENROLLMENT ADDENDUM 21
FULL-TIME* PART-TIME TOTAL Credits Credits Credits Head- per Head- per Head- per UNDERGRADUATE count Credits Student count Credits Student count Credits Student Lima 915 13,176.0 14.40 152 1,107.5 7.29 1,067 14,283.5 13.39 (FTE) 878 74 952 Mansfield 1,002 14,594.0 14.56 202 1,322.5 6.55 1,204 15,916.5 13.22 (FTE) 973 88 1,061 Marion 951 13,618.0 14.32 273 1,871.5 6.86 1,224 15,489.5 12.65 (FTE) 908 125 1,033 Newark 1,918 27,831.5 14.51 383 2,661.5 6.95 2,301 30,493.0 13.25 (FTE) 1,855 177 2,033 Wooster 549 8,250.5 15.03 63 398.0 6.32 612 8,648.5 14.13 (FTE) 550 27 577 Total Extended Campuses 5,335 77,470.0 14.52 1,073 7,361.0 6.86 6,408 84,831.0 13.24 (FTE) 5,165 491 5,655
FULL-TIME* PART-TIME TOTAL Credits Credits Credits Head- per Head- per Head- per GRADUATE count Credits Student count Credits Student count Credits Student Lima 24 372.0 15.50 40 150.0 3.75 64 522.0 8.16 (FTE) 25 10 35 Mansfield 43 526.0 12.23 18 85.0 4.72 61 611.0 10.02 (FTE) 35 6 41 Marion 48 758.0 15.79 1 2.0 2.00 49 760.0 15.51 (FTE) 51 0 51 Newark 61 852.0 13.97 28 130.0 4.64 89 982.0 11.03 (FTE) 57 9 65 Total Extended Campuses 176 2,508.0 14.25 87 367.0 4.22 263 2,875.0 10.93 (FTE) 167 24 192
Full-time equivalency can be determined by dividing th number of credits by 15. THE OHIO STATE UNIVERSITY Office of Enrollment Services
September 11, 2012
* Undergraduate students are classified as full-time if they register for 12 or more credits. Graduate or graduate professional students are classified as full-time if they register for 8 or more credits.