linkedin_handout_web
TRANSCRIPT

COVER PAGE
Intro paragraph
Connectivity is essential for small cities to succeed and grow. The Regional Australia Institute and LinkedIn have teamed up
to shine a spotlight on 5 key regional cities to examine the strength and stretch of their networks of LinkedIn members.
REGIONALCONNECTIONSSKILLS, PEOPLE & PLACES

TOWNSVILLE
SUNSHINE COAST – NOOSA
GREATER NEWCASTLE
WOLLONGONG
LAUNCESTON
CONNECTIVITYis essential for small cities to succeed and grow.
295K+ members in these cities, ~30% of the working population
WORKING AGE POPULATION: 132,393 (39,000 LinkedIn members)
KEY FACTSPost-mining boom transition to a more diverse economyLargest employers: Health, public admin and safety, and retail
WORKING AGE POPULATION: 211,067 (82,000 LinkedIn members)
KEY FACTSLifestyle destinationRebuilding itself as a Smart CityLargest employers: Health, retail and construction
WORKING AGE POPULATION: 364,087 (105,000 LinkedIn members)
KEY FACTS5 Local Government Areas (LGAs)Previously industrialShifting to a service economyLargest employers: Health, retail and manufacturing
WORKING AGE POPULATION: 180,451 (53,000 LinkedIn members)
KEY FACTSHistorically known for steel and coalShifting to a service economyLargest employers: Manufacturing, retail and health
WORKING AGE POPULATION: 57,886 (16,000 LinkedIn members)
KEY FACTSTransitioning from manufacturing to a more diverse economyLargest employers: Health, education and training, and retail
92 avg. connections per member in Australia
% = percentage of connections to the specified area
% = percentage of people connected to others inside and outside of the specified area
29%connections in the region
20%international connections
CONNECTIONS
CONNECTIONS
17%connections in the region
25%international connections
connections in the region
CONNECTIONS
31%
18%international connections
CONNECTIONS
21%connections in the region
22%international connections
CONNECTIONS
75
90
87
86
6724%
connections in the region
20%international connections
TOP 5 CONNECTION LOCATIONS1. Townsville Area (28.9%)2. Brisbane Area (16.3%)3. Sydney Area (6.9%)4. Melbourne Area (5.5%)5. Queensland (4.7%)
TOP INTERNATIONAL13. Papua New Guinea (0.9%)
TOP 5 CONNECTION LOCATIONS1. Brisbane Area (25.3%)2. Queensland (17.5%)3. Sydney (10.8%)4. Melbourne Area (7.8%)5. Perth Area (2.7%)
TOP INTERNATIONAL9. London, United Kingdom (1.2%)
TOP 5 CONNECTION LOCATIONS1. Newcastle Area (31.0%)2. Sydney Area (25.2%)3. Melbourne Area (6.3%)4. Brisbane Area (6.1%)5. New South Wales (2.9%)
TOP INTERNATIONAL11. London, United Kingdom (0.9%)
TOP 5 CONNECTION LOCATIONS1. Sydney Area (51.1%)2. Melbourne Area (6.8%)3. Brisbane Area (4.5%)4. Wollongong Area (3.7%)5. Perth Area (1.9%)
TOP INTERNATIONAL10. London, United Kingdom (1.1%)
TOP 5 CONNECTION LOCATIONS1. Launceston (24.3%)2. Tasmania - other (15.8%)3. Melbourne Area (12.2%)4. Sydney Area (7.8%)5. Brisbane Area (4.9%)
TOP INTERNATIONAL10. London, United Kingdom (0.9%)
TOP 5 CONNECTED INDUSTRIES
Mining & Metals
Construction Financial Services
IT Real Estate
IT
TOP 5 CONNECTED INDUSTRIES
Mining & Metals
Construction Financial Services
Real Estate
Financial Services
TOP 5 CONNECTED INDUSTRIES
Construction ITReal Estate
Health &Wellness
TOP 5 CONNECTED INDUSTRIES
ConstructionFinancial Services
Marketing& Advertising
Mining & Metals
IT
Marketing& Advertising
TOP 5 CONNECTED INDUSTRIES
ConstructionFinancial Services
IT Real Estate
PER MEMBER
PER MEMBER
PER MEMBER
PER MEMBER
PER MEMBER
TOWNSVILLE
SUNSHINE COAST – NOOSA
GREATERNEWCASTLE
WOLLONGONG
LAUNCESTON
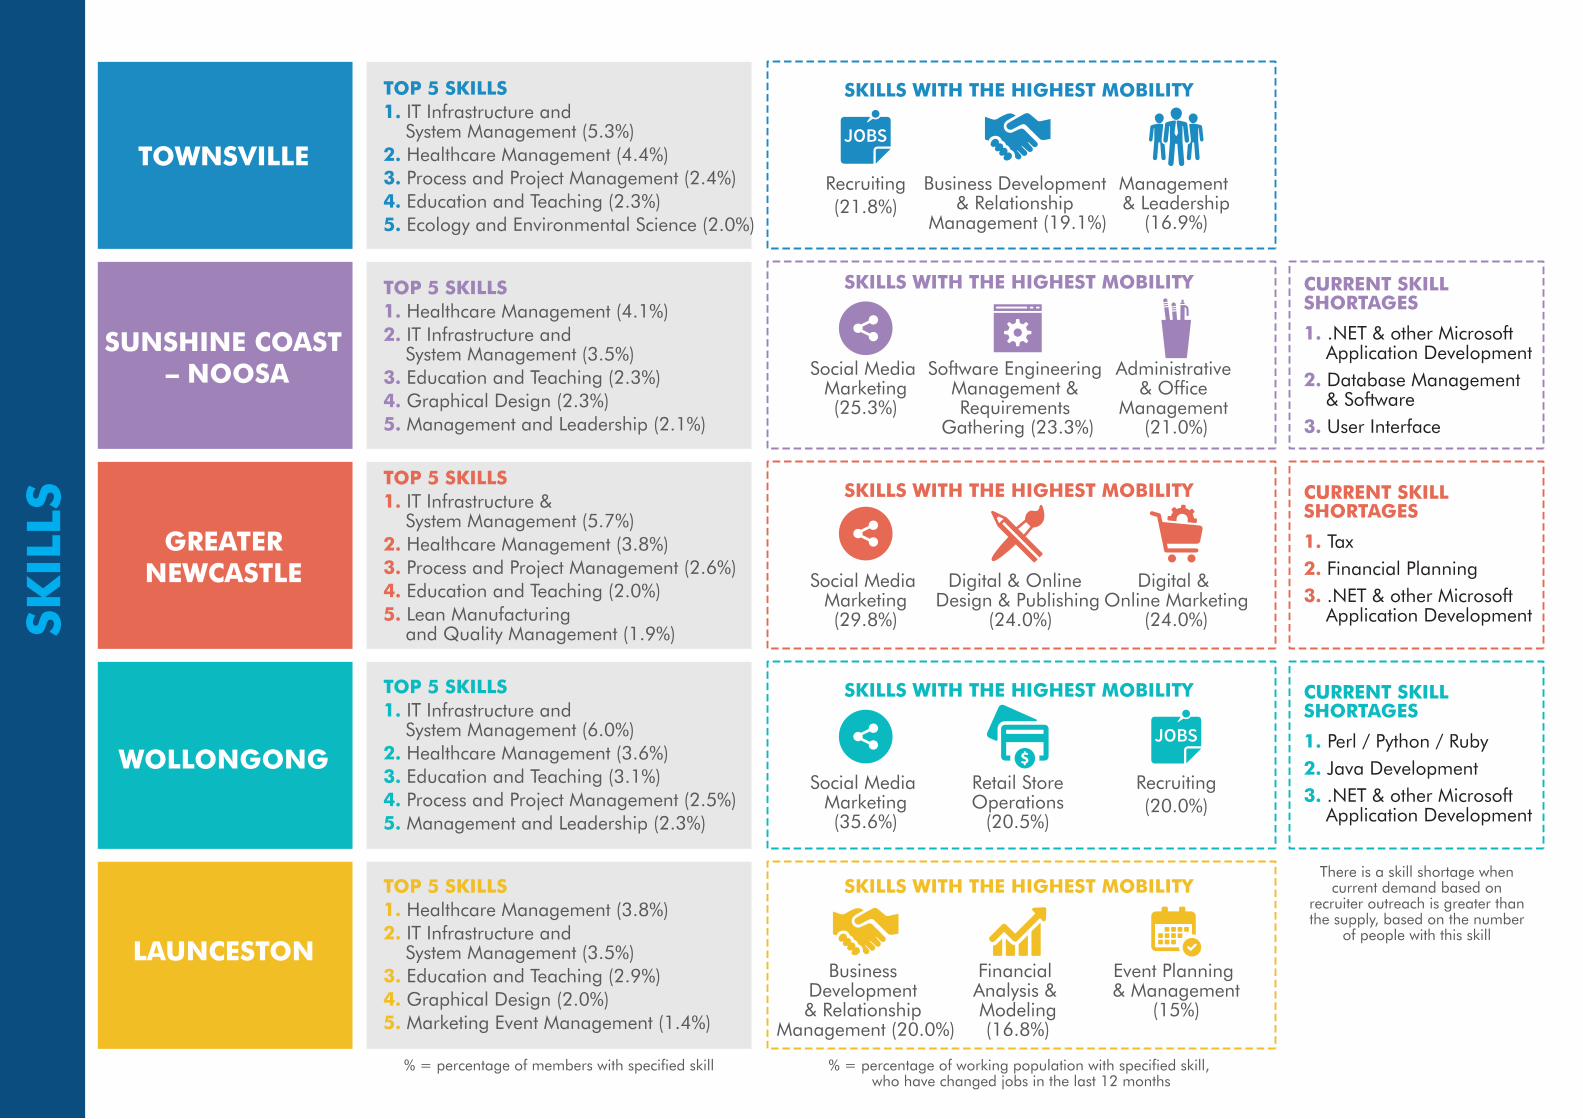
TOP 5 SKILLS1. IT Infrastructure and System Management (5.3%)2. Healthcare Management (4.4%)3. Process and Project Management (2.4%)4. Education and Teaching (2.3%)5. Ecology and Environmental Science (2.0%)
TOP 5 SKILLS1. Healthcare Management (4.1%)2. IT Infrastructure and System Management (3.5%)3. Education and Teaching (2.3%)4. Graphical Design (2.3%)5. Management and Leadership (2.1%)
CURRENT SKILL SHORTAGES
TOP 5 SKILLS1. IT Infrastructure & System Management (5.7%)2. Healthcare Management (3.8%)3. Process and Project Management (2.6%)4. Education and Teaching (2.0%)5. Lean Manufacturing and Quality Management (1.9%)
TOP 5 SKILLS1. IT Infrastructure and System Management (6.0%)2. Healthcare Management (3.6%)3. Education and Teaching (3.1%)4. Process and Project Management (2.5%)5. Management and Leadership (2.3%)
TOP 5 SKILLS1. Healthcare Management (3.8%)2. IT Infrastructure and System Management (3.5%)3. Education and Teaching (2.9%)4. Graphical Design (2.0%)5. Marketing Event Management (1.4%)
SKILLS WITH THE HIGHEST MOBILITY
SKILLS WITH THE HIGHEST MOBILITY
SKILLS WITH THE HIGHEST MOBILITY
SKILLS WITH THE HIGHEST MOBILITY
SKILLS WITH THE HIGHEST MOBILITY
Recruiting(21.8%)
Recruiting(20.0%)
Business Development & Relationship
Management (19.1%)
Management & Leadership
(16.9%)
Social Media Marketing(25.3%)
Software Engineering Management & Requirements
Gathering (23.3%)
Administrative & Office
Management (21.0%)
Social Media Marketing(29.8%)
Social Media Marketing(35.6%)
Digital & Online Design & Publishing
(24.0%)
Digital & Online Marketing
(24.0%)
Retail StoreOperations
(20.5%)
Business Development & Relationship
Management (20.0%)
Event Planning & Management
(15%)
Financial Analysis & Modeling(16.8%)
1. .NET & other Microsoft Application Development2. Database Management & Software3. User Interface
CURRENT SKILL SHORTAGES
1. Tax2. Financial Planning3. .NET & other Microsoft Application Development
CURRENT SKILL SHORTAGES
1. Perl / Python / Ruby2. Java Development3. .NET & other Microsoft Application Development
% = percentage of members with specified skill
% = percentage of working population with specified skill, who have changed jobs in the last 12 months
SKIL
LS
There is a skill shortage when current demand based on
recruiter outreach is greater than the supply, based on the number
of people with this skill