liquefaction analysis for a single piled foundation by dr. lu chihwei moh and associates, inc. date:...
TRANSCRIPT

Liquefaction Analysis For a Single Piled Foundation
By
Dr. Lu ChihweiMoh and Associates, Inc.
Date: 11/3/2003

Back ground
During earthquake
Structural damage
Pile foundationUpper structure
Large bending moments
Inertia moment Kinematic moment
Liquefaction
Pile
U.S.-Taiwan Workshop on Soil Liquefaction, 11/3/2003
Lu Chihwei

U.S.-Taiwan Workshop on Soil Liquefaction, 11/3/2003
Lu Chihwei

U.S.-Taiwan Workshop on Soil Liquefaction, 11/3/2003
Lu Chihwei

U.S.-Taiwan Workshop on Soil Liquefaction, 11/3/2003
Lu Chihwei

Guidelines for Foundation Design in Japan (2001)
• Before Liquefaction ー Upper Structure
• After Liquefaction ー Upper Structure and Ground Deformation
• Flow Failure ー Ground Deformation due to Lateral Flow
U.S.-Taiwan Workshop on Soil Liquefaction, 11/3/2003
Lu Chihwei

Damage to piles
Damage on upper structure
Earthquake
Progressive damage
Waves de-amplified
Occurrence of liquefaction
Displacement
Liquefied layer
Unliquefied layer
Lateral flow of ground
Large displacementBefore Liquefaction
Illustration of the interaction between soils and a pile foundation
U.S.-Taiwan Workshop on Soil Liquefaction, 11/3/2003
Lu Chihwei

Key points
•Nonlinear behavior of soils (A cyclic elasto-plastic model for sand and a
cyclic elasto-viscoplastic model for clay)
•Nonlinear behavior of piles (Axial Force Dependent Model)
•3-Dimensional liquefaction analysis
•A series of calculations on a single-pile foundation installed in a 2-layer ground (san
d layer+clay layer)
U.S.-Taiwan Workshop on Soil Liquefaction, 11/3/2003
Lu Chihwei

-My
-Mc
Φc Φy Φ u
Mc
My
Mu
-Φc-Φy
-My
-Mc
Φc Φy Φ u
Mc
My
Mu
-Φc-Φy
M- relation (Conventional way)
Axial force on M- relation has to be neglected.
U.S.-Taiwan Workshop on Soil Liquefaction, 11/3/2003
Lu Chihwei

Young’s Modulus of concrete Ec (kN/m2) 2.5E7 Poisson’s Ratio of concrete c 0.25 Diameter of pile D (m) 1.5 Compressive strength of concrete fc (kN/m2) 36000.00 Tensile strength of concrete ft (kN/m2) 3000.00 Parameter of concrete 0.50 Parameter of concrete 4.00 Parameter of concrete 4.00 Parameter of concrete c 0.50 Degrading parameter of concrete c 0.20690 Young’s Modulus of steel E (kN/m2) 2.1E8 Poisson’s Ratio of steel s 0.20 Diameter of reinforcement d (m) 0.029 Number of reinforcement N 24 Overburden of concrete dc (m) 0.150 Yielding strength of steel Ys (kN/m2) 3.8E5 Degrading parameter of steel s 0.80 Density of steel s (t/m
3) 7.80 Density of concrete c (t/m
3) 2.50
Axial force (kN)The pile used in the simulation
M- relation of the pile
Dead load of the pile head in single pile foundation is 1250KN and in the group pile foundation is 1753 KN
0
1800
3600
5400
7200
9000
0 0.003 0.006 0.009 0.012 0.015
0-1500-3000
-4500-1162-1753.3
Mom
ent (
KN
*m)
Curvature (1/m)
Ceacking stage Yeilding stageElastic
22
2
nL
EIPc
=68131 kNBuckling
k
U.S.-Taiwan Workshop on Soil Liquefaction, 11/3/2003
Lu Chihwei

Sand layer
Clay layer
Dense, Loose & Medium dense sand, Reclaimed soil
Two-Layer ground
A cyclic elasto-plastic model (Oka, 1999)based on a nonlinear kinematic hardening rule
A cyclic elasto-viscoplastic model (Oka, 1992) based on a nonlinear kinematic hardening rule
Clay layer
Sand layer
U.S.-Taiwan Workshop on Soil Liquefaction, 11/3/2003
Lu Chihwei

Constitutive law of sands based on finite deformation theory
Cyclic Elasto-plastic constitutive model by Oka et al.(1992, 1999)
Ⅰ Non-linear kinematic hardening rule
Ⅱ Non-associated flow rule
Ⅲ Overconsolidation boundary surface
Ⅳ Generalized flow rule
Ⅴ Consideration of strain dependency of shear stiffness
U.S.-Taiwan Workshop on Soil Liquefaction, 11/3/2003
Lu Chihwei

The soils used in the simulation
Dense Sand Medium Dense Sand Loose Sand Reclaimed Soil Soft Clay
Density (t/m3) 2.0 2.0 2.0 2.0 1.7
Void Ratio e0 0.6 0.8 0.8 0.420 1.4
Coefficient of permeability k (m/s) 1.5x10⁻⁵ 3.0 x 10⁻⁵ 3.0 x 10⁻⁵ 2.0 x 10⁻⁴ 1.0x10⁻⁹
Compression Index 0.020 0.03 0.03 0.01 0.100
Swelling index 0.002 0.002 0.003 0.001 0.020
Stress Ratio of Failure State M*f 1.10 1.00 0.80 1.19 1.31
Stress Ratio at Maximum Compression M*m 0.85 0.80 0.70 0.91 1.28
Normalized Shear Modulus G0 /’m0 1980.0 1060.0 500.0 2140.0 300.0
Hardening Parameter B0*, B1
*, Cf for sand
B0*, Bs
*, Bt* for clay
8500, 85, 0 4000, 400, 0 2500, 25, 0 5500, 55, 0 500, 50, 0
Shear Wave Velocity Vs (m/s) 180
(’0=102 KN/m2)
134
(’0=102 KN/m2)
92
(’0=102 KN/m2)
190
(’0=102 KN/m2)
127
(’0=138 KN/m2)
Sand
Control parameter of anisotropy Cd 2000 2000 2000 2000 -
Parameter of Dilatancy D0, n 1.0, 2.5 1.0, 2.0 1.0, 1.0 1.0, 4.0 -
Reference Value of Plastic Strain Pr 0.008 0.003 0.001 0.002 -
Reference Value of Elastic StrainEr 0.09 0.035 0.005 0.01 -
Clay
Viscoplastic Parameter C01 (1/s) - - - - 5.5x10⁻⁶
Viscoplastic Parameter C02 (1/s) - - - - 7.8x10⁻⁷
Viscoplastic Parameter m0’ - - - - 14
U.S.-Taiwan Workshop on Soil Liquefaction, 11/3/2003
Lu Chihwei

1 10 1000.1
0.2
0.3
0.4
Dense sandLoose sand
Medium sandReclaimed soil
Number of cycles
Str
ess
rati
o (
/' m
o)
Liquefaction strength curves of different sandy soils
Dr=50% Toyoura Sand: N=20, Stress Ratio=0.13(Oka 2001)
U.S.-Taiwan Workshop on Soil Liquefaction, 11/3/2003
Lu Chihwei

The Governing Equation
Based on Biot’s soil-water coupling theory
u-p formulation
Momentum equation
Continuity equation
Constitutive equation
Definition of effective stress
: Density of total phase : Nominal stress tensor
: Acceleration vector : Body force vector
: Density of fluid phase : Unit weight of water
: Coefficient of permeability : Pore water pressure
'ijij
'ijd D
U.S.-Taiwan Workshop on Soil Liquefaction, 11/3/2003
Lu Chihwei

Discretization of Governing Equations
Space discretization
Time discretization
u-p formulation
FEM
Newmark’s β method
U.S.-Taiwan Workshop on Soil Liquefaction, 11/3/2003
Lu Chihwei

U.S.-Taiwan Workshop on Soil Liquefaction, 11/3/2003
Lu Chihwei

Shaking direction
x y
z
o
-8
-4
0
4
8
0 2 4 6 8 10
Acc
eler
atio
n (m
/sec
2 )
Time (sec)
Input wave
U.S.-Taiwan Workshop on Soil Liquefaction, 11/3/2003
Lu Chihwei

-1
-0.5
0
0.5
1
0 2 4 6 8 10
Loose sandMedium sand
Dense sandReclaimed soil
E.S.D
.R (1-'
v/'
v0)
Time (sec)
-0.1
0
0.1
0.2
0.3
0.4
0 2 4 6 8 10
Loose sandMedium sand
Dense sandReclaimed soil
Excess Pore Water Pressure Ratio (u/'
m)
Time (sec)
11111111
A
m
11111111
A
m
11111111
A
v
Effective Stress Decreasing Ratio
(a) At the center of sand soil (b) At the center of clay layer
Liquefaction takes place completely
Sand
Clay
)''
(-1≡m0
mσ
σESDR
Excess Pore Water Pressure Ratio
Effective Stress Decreasing Ratio
Excess Pore Water Pressure Ratiov'
uEPWPR
U.S.-Taiwan Workshop on Soil Liquefaction, 11/3/2003
Lu Chihwei

Acceleration responses
-15
-10
-5
0
5
10
15
0 2 4 6 8 10
Dense sandMedium sand
Loose sandReclaimed soils
Acc
lera
tion
(m/s
ec2 )
Time (sec)
-15
-10
-5
0
5
10
15
0 2 4 6 8 10
Dense sandMedium sand
Loose sandReclaimed soils
Acc
lera
tion
(m/s
ec2 )
Time (sec)(a) Top of the pier (b) Ground surface
Loose sand
Medium sand and reclaimed soil
Sand
Clay
Top of pierSurface
U.S.-Taiwan Workshop on Soil Liquefaction, 11/3/2003
Lu Chihwei

Displacement responses
-0.8
-0.4
0
0.4
0.8
0 2 4 6 8 10
Dense sandMedium sand
Loose sandReclaimed soils
Dis
plac
emen
t (m
)
Time (sec)
-0.8
-0.4
0
0.4
0.8
0 2 4 6 8 10
Dense sandMedium sand
Loose sandReclaimed soils
Dis
plac
emen
t (m
)
Time (sec)(a) Top of the pier (b) Ground surface
Loose sand
Medium sand and reclaimed soil
Sand
Clay
Top of pierSurface
U.S.-Taiwan Workshop on Soil Liquefaction, 11/3/2003
Lu Chihwei

-9000
-4500
0
4500
9000
0 2 4 6 8 10
Dense sandMedium sand
Loose sandReclaimed soils
Ben
ding
mom
ent (
KN
*m)
Time (sec)
-9000
-4500
0
4500
9000
0 2 4 6 8 10
Dense sandMedium sand
Loose sandReclaimed soils
Ben
ding
mom
ent (
KN
*m)
Time (sec)
(a) At pile heads (b) Lower segment (b7)
Bending moments
Loose sand
Medium sand and reclaimed soil
Sand
Clay
Pile head
b7
U.S.-Taiwan Workshop on Soil Liquefaction, 11/3/2003
Lu Chihwei

-5000 0 5000 1 10420
15
10
5
0
Dense
Medium
Loose
Reclaimed
Bending Moment (KN-m)
Dep
th (
m)
Clay Layer
Sand Layer
Distributions of sectional forces at the time when the maximum bending moment occurred at the bottom of pier
-1200 -600 0 600 120020
15
10
5
0
Dense
Medium
Loose
Reclaimed
Shear Force (KN)
Dep
th (
m)
Clay Layer
Sand Layer
Bending moment (kN*m) Shear force (kN)
U.S.-Taiwan Workshop on Soil Liquefaction, 11/3/2003
Lu Chihwei

Distributions of sectional forces of the end of seismic event (t=10 sec)
-4500 -2250 0 2250 450020
15
10
5
0
DenseMedium
LooseReclaimed
Bending Moment (KN m)
Dep
th (
m)
Clay Layer
Sand Layer
.-600 -300 0 300 600
20
15
10
5
0
Dense
Medium
Loose
Reclaimed
Bending Moment (KN-m)
Dep
th (
m)
Clay Layer
Sand Layer
Shear force (kN)Bending moment (kN*m)
U.S.-Taiwan Workshop on Soil Liquefaction, 11/3/2003
Lu Chihwei
-700 -350 0 350 70020
15
10
5
0
t=3.16 sect=4.14 sect=5.21 sect=10 sec
Shear Force (KN)
Dep
th (
m)
Clay Layer
Sand Layer
a:b:c:d:
ESDR= 0.25
ESDR=0.72
ESDR=1.00
ESDR=1.00
-6000 -3000 0 3000 600020
15
10
5
0
t=3.16 sect=4.14 sect=5.21 sect=10 sec
Bending Moment (KN*m)
Dep
th (
m)
Clay Layer
Sand Layer
a:b:c:d:
ESDR= 0.25
ESDR=0.72
ESDR=1.00
ESDR=1.00
-6000 -3000 0 3000 600020
15
10
5
0
t=3.34 sect=6.94 sect=7.71 sect=10 sec
Bending Moment (KN*m)
Dep
th (
m)
Clay Layer
Sand Layer
a:b:c:d:
ESDR= -0.22
ESDR=0.90
ESDR=0.92
ESDR=0.97
-700 -350 0 350 70020
15
10
5
0
t=3.34 sect=6.94 sect=7.71 sect=10 sec
Shear Force (KN)
Dep
th (
m)
Clay Layer
Sand Layer
a:b:c:d:
ESDR= -0.22
ESDR=0.90
ESDR=0.92
ESDR=0.97
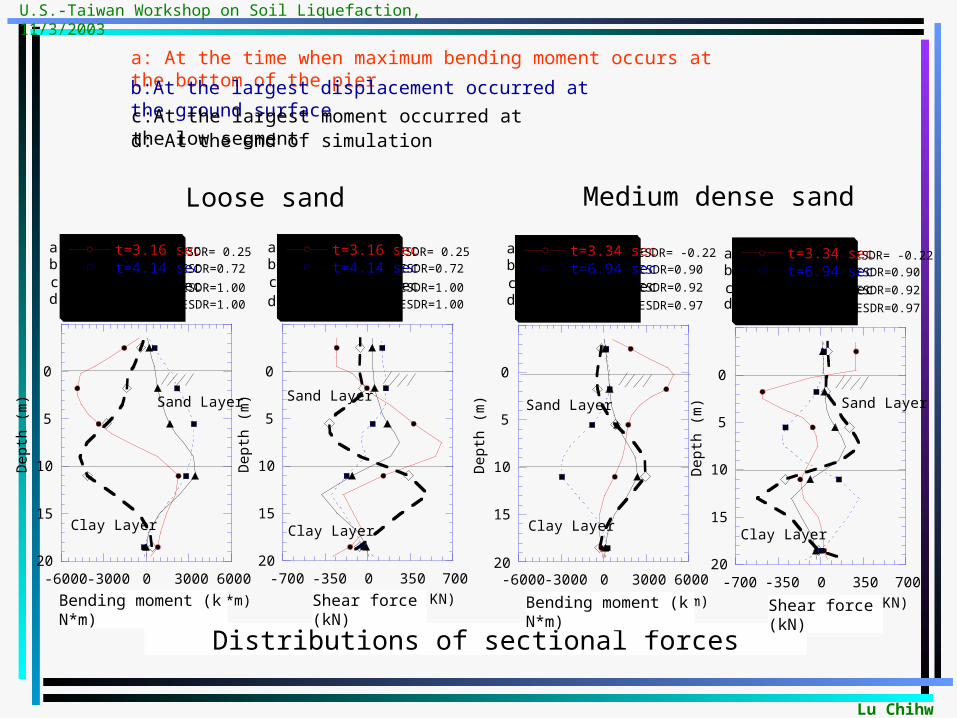
Loose sand Medium dense sand
Distributions of sectional forces
a: At the time when maximum bending moment occurs at the bottom of the pierb:At the largest displacement occurred at the ground surface
c:At the largest moment occurred at the low segment d: At the end of simulation
Bending moment (kN*m) Bending moment (kN*m)Shear force (kN) Shear force (kN)
U.S.-Taiwan Workshop on Soil Liquefaction, 11/3/2003
Lu Chihwei

Reclaimed soils case Dense sand case
-700 -350 0 350 70020
15
10
5
0
t=3.25 sect=6.90 sect=7.71 sect=10 sec
Shear Force (KN)
Dep
th (
m)
Clay Layer
Sand Layer
a:b:c:d:
ESDR= -0.28
ESDR=0.88
ESDR=0.90
ESDR=0.96
-6000 -3000 0 3000 600020
15
10
5
0
t=3.25 sect=6.90 sect=7.71 sect=10 sec
Bending Moment (KN*m)
Dep
th (
m)
Clay Layer
Sand Layer
a:b:c:d:
ESDR= -0.28
ESDR=0.88
ESDR=0.90
ESDR=0.96
-5000 0 5000 1 104 1.5 10420
15
10
5
0
t=3.25 sect=6.31 sect=10 sec
Bending Moment (KN*m)
Dep
th (
m)
Clay Layer
Sand Layer
e:a:d:
-1500 -1000 -500 0 50020
15
10
5
0
t=3.25 sect=6.55 sect=10 sec
Shear Force (KN)
Dep
th (
m)
Clay Layer
Sand Layer
e:a:d:
Distributions of sectional forces
a: At the time when maximum bending moment occurs at the bottom of the pierb:At the largest displacement occurred at the ground surface
c:At the largest moment occurred at the low segment d:At the end of simulation
e:At the time maximum acceleration occurred at the ground surface
Bending moment (kN*m) Bending moment (kN*m)Shear force (kN) Shear force (kN)
U.S.-Taiwan Workshop on Soil Liquefaction, 11/3/2003
Lu Chihwei

Conclusions
Reason After
Liquefaction Time (sec)
Bending moments on
Pile head
The inertia force from upper structure
Decreases
Bending moments on Segment at interface
Kinematic bending moment due to ground deformation and inertia
bending moment
Increases
After the peak of seismic waves,
before the completion of liquefaction
U.S.-Taiwan Workshop on Soil Liquefaction, 11/3/2003
Lu Chihwei

U.S.-Taiwan Workshop on Soil Liquefaction, 11/3/2003
In engineering practice:
1. How to feed back soil springs for structural design?
2. The ground line for design of superstructure shall be lowered when ground liquefies.
3. The damping of waves on the ground surface due to liquefaction
4. Sectional force at the interface --- Relative stiffness between 2 layers--- How to apply them?
5. The damage due to lateral spread
Lu Chihwei

Thank you very much for your attention
Dr. Lu Chihwei
Moh and Associates, Inc.
U.S.-Taiwan Workshop on Soil Liquefaction, 11/3/2003