liquid metal coolants for high power heat transport systems
TRANSCRIPT

Liquid Metal coolants for high power heat transport systems
P. Hosemann,
Contribution from:
David Frazer; Cristian Cionea; Stephen Parker; C. Rose Miroslav Popovic; Ouliana Panova; Mark Asta;
University of California Berkeley
M. De Caro, S.A. Maloy, F. Rubio
Los Alamos National Laboratory
K. Lambrinou SCK CEN
MatISSE/JPNM workshop Nov 25th 2015

OUTLINE
•Introduction; Engineering applications utilizing liquid metals. •Introduction; Selected issues using heavy liquid metals. •Results on stainless steel in static and flowing Lead Bismuth Eutectic at medium temperature •Results of Fe-Cr-Al steels in flowing and static LM at medium and high temperature. •Evaluating the adhesion of oxides on the substrate. •Experimental approach on evaluating the effects of radiation on corrosion.
•Summary

Why Liquid metal technology
Issues with liquid metal technology
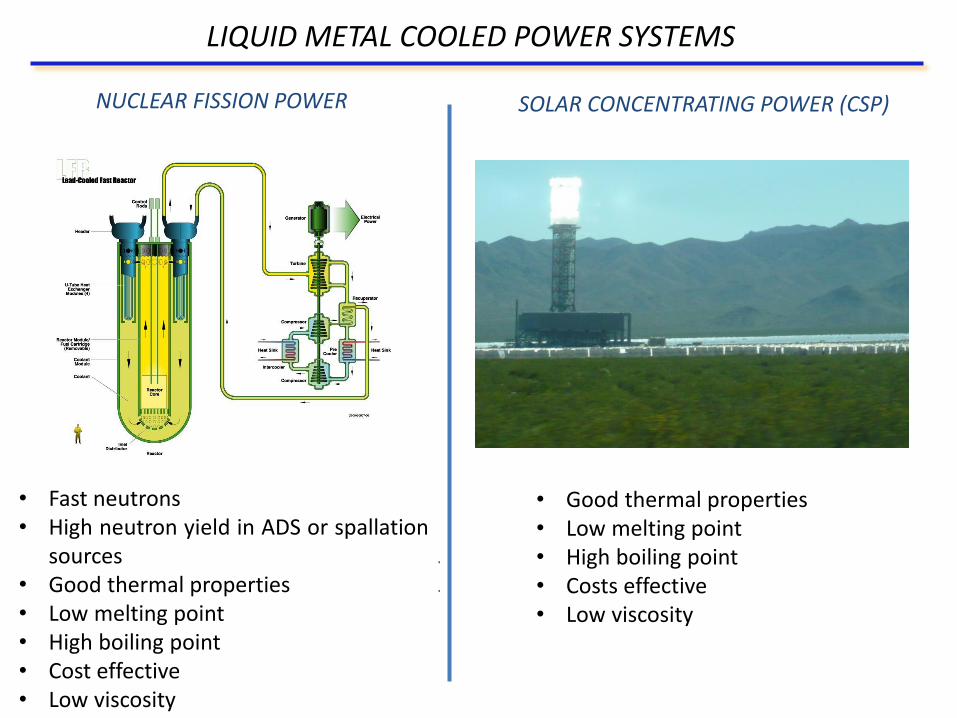
LIQUID METAL COOLED POWER SYSTEMS
NUCLEAR FISSION POWER SOLAR CONCENTRATING POWER (CSP)
~0 carbon emission Advanced reactors can close the nuclear fuel cycle and reduce the urge for nuclear fuel storage High power density.
~0 carbon emission Large scale plants feasible (Ivanpah plan in CA) ~130MW/unit
• Fast neutrons • High neutron yield in ADS or spallation
sources • Good thermal properties • Low melting point • High boiling point • Cost effective • Low viscosity
• Good thermal properties • Low melting point • High boiling point • Costs effective • Low viscosity

LM AS FILLER FOR FUEL RODS
Conventional UO2 and He gap have limited thermal properties leading to very high temperatures in the fuel centerline. Other fuel concepts might be considered bypassing some of these issues.
pellet stack
Cladding
He LM
Spring He
gap
UO2 U-ZrH1.6
Conventional fuel rod
Proposed fuel rod
D. Olander, M. Balooch, K. Terrani, P. Hosemann
hydride hydride oxide
characteristic He bond LM bond He bond
pellet OD, mm 10 10 10
LHR, W/cm 375 375 375
fuel centerline, oC 680 555 1505
Tfuel 170 170 995
Tgap (35 m) oC 125 1 125
Tclad oC 46 46 46
Tfluid oC 39 39 39
coolant, oC 300 300 300

OTHER LIQUID METAL APPLICATIONS
NUCLEAR FUSION POWER
Good thermal properties Low melting point High boiling point Fire hazard of Li can be reduced Tritium breeding See Konys talk
ADDITIONAL TECHNOLOGICAL APPLICATIONS OF LIQUID METALS
Liquid metal used to obtain plasma for EUV light
Well controlled cooling rate for gas turbine blades
A. Kermanpur MSE-B 2000
AJ. M. Algots lithography 2005

LIQUID METALS IN NUCLEAR APPLICATIONS
LM’s in nuclear applications have been well established.
Staring in the 50’s several liquid lead bismuth cooled submarines were build
and commissioned
Clementine reactor first fast reactor 1946-1949 Los Alamos, Mercury cooled 25kW
Several sodium cooled reactors have been realized
BOR 60
BN 600

WHY NEW CSP HEAT TRANSPORT FLUIDS?
• Power transported in CSP is f(T,cp,V/t)
• Hydrogen production and process heat generation requires high temperatures.
• High temperatures and high cp allow for thermal storage over night.
Push the temperature, of the solar
concentrator units to >700C! New heat transport fluids are required and proposed Liquid Salt currently temp limited 100 - 550°C nitrate salts Fluoride salts 450 - 1000C Liquid metal 100C ->1000C
Many liquid metals have a low melting point
Liquid metals have excellent heat conduction
Liquid metals have low viscosity
Many decades of experience with various liquid
metals for other applications.
Large facilities have been build and
successfully operated in the past

REVIEW OF POSSIBLE ELEMENTS FOR LM IN CSP Melting point, cost, toxicity, boiling points
Na, K, Mg, Ca, Cu, Zn, Al, Sn, Pb, Sb, Bi
Based on cost, melting temperature and non-toxicity:
Melting point below 350oC Melting point above 350oC
Group 1
Group 2

LIGHT AND HEAVY LIQUID METALS
Group 1 light elements: Large scale facilities have been realized. (Na) Low melting point. Little corrosion issues High vapor pressure at high temperatures. REACTIVE! Group 2 heavy elements: Large scale facilities have been realized Low melting point (with alloying) Not reactive with water Low vapor pressure Corrosion issues exist!!
Almeria solar plant accident, Spain!!
Monju NPP
Thorium NPP India 500MW 2014
Russian alpha class submarines; MHYRRA reactor Belgium

WHAT ARE THE CORROSION ISSUES IN HEAVY METALS (EXAMPLE LBE)? DISSOLUTION
Many metals have a solubility in many heavy liquids. In loop systems, this leads to enhance and uncontrolled corrosion if steps are not taken to prevent it.
-4
-3.5
-3
-2.5
-2
-1.5
-1
-0.5
0
0.5
1
0 500 1000 1500
Fe
Cr
Ni
Temperature [°C]
Lo
g C
S [
wt%
]
-4
-3.5
-3
-2.5
-2
-1.5
-1
-0.5
0
0.5
1
0 500 1000 1500
Fe
Cr
Ni
Material testing
temperature range
Loop saturated with corrosion products cannot
work due to the temperature gradient in the
loop!

WHAT ARE THE CORROSION ISSUES IN HEAVY METALS ? FORMATION OF NEW PHASES
Fe-Cr-Ni in Pb and Bi
Fe-Pb Cr-Pb Ni-Pb
Fe-Bi Cr-Bi Ni-Bi
Pb and Bi form few intermetallic phases with steel elements only solubility issues
ASM phase diagram database

Fe-Sn Cr-Sn Ni-Sn
Fe-Zn Cr-Zn Ni-Zn
WHAT ARE THE CORROSION ISSUES IN HEAVY METALS ? FORMATION OF NEW PHASES
Sn and Zn form a large number of intermetallic phases High corrosion rates may be anticipated danger of clogging due to high temp melting phases
ASM phase diagram database

CORROSION MITIGATION STRATEGY
-8
-7
-6
-5
-4
-3
-2
-1
0
1
0 500 1000 1500 2000
Temperature [K]
Lo
g (
CS)[
wt%
]
Melting point of Pb
Melting point of LBE
Loop operating range
Addition of oxygen allows the formation of a protective film

Not sufficient oxygen available to form an Fe3O4 layer
Fully saturated LBE More oxygen is not soluble
CONSIDERATIONS FOR OPTIMAL OXYGEN CONTENT
D. Frazer, E. Stergar, C. Cionea, P. Hosemann; SolarPACES 2013, energy procedia

Detailed experiments in LBE

LBE corrosion automatic control 700°C 250h
CORROSION TESTING OF CANDIDATE MATERIALS in static envrionment
Static corrosion testing Example UCB
Flowing corrosion testing Example LANL
DELTA Loop

PREVIOUS EXPERIENCE WITH AUSTENTITCS STAINLESS STEEL 3000h AT 550C (FLOWING) IN LBE (SEM)
TEM sample
location prepared
by FIB
EDX Line scan
D9 3000 hr (duplex oxide) all elements
0
10
20
30
40
50
60
70
80
0 5 10 15 20 25 30 35 40
um
wt%
Iron
Silicon
Oxygen
Manganese
Nickel
Chromium
Composition [wt%]
3000h sample
Outer oxide
layer
Inner oxide
layer
Steel
Ni
Cr
O
Fe
others
Composition: Cr 13.5-14.5 %, Ni:14.5-15.5% , Mo 2%, Mn 1.65-2.35%, Si:0.5 -0.75% , C 0.035 - 0.05% P. Hosemann, R Dickerson, P Dickerson, N Li, SA Maloy, Transmission Electron Microscopy (TEM) on Oxide Layers formed on D9 stainless steel in Lead Bismuth Eutectic (LBE), Corr Scie. 66, (2013), 196–202

• Results on D9
Steel
Inner layer 4
Outer Layer 2
Outer Layer 1 Surface
Row 6
Row 7
Row 8
Row 9
Row 10
Row 11
Row 12
Row 13
8.2
pores
indents
-50nm
50nm Height scale
Row 2
Row 3
Row 4
Row 5
Row 6
Row 7
Row 8
Row 9
11.5
Steel
Steel
Inner layer 4
Inner layer 3
Outer layer 2
Outer layer 1
-8.7V
8.7 V
Magnetic signal scale
0nm
Outer layer 1
Outer layer 2
Inner layer 3
Inner layer 4
Outer layer 1
Outer layer 2
Inner layer 3
Inner layer 4 -25 nm
25 nm 2V
-2V
AFM MFM MEASUREMENTS ON D9 3000h, 550C, 10-6wt% O2
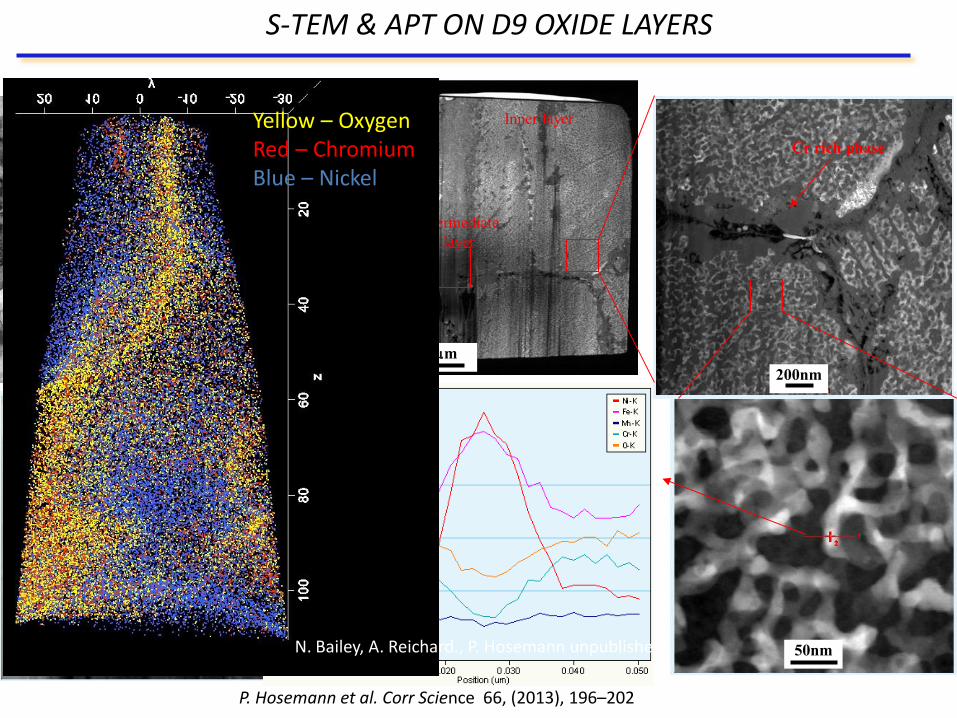
S-TEM & APT ON D9 OXIDE LAYERS
Inner layer Outer layer
Intermediate
layer
500nm 2m
Cr rich phase
200nm
50nm 200nm
P. Hosemann et al. Corr Science 66, (2013), 196–202
N. Bailey, A. Reichard., P. Hosemann unpublished
Yellow – Oxygen Red – Chromium Blue – Nickel
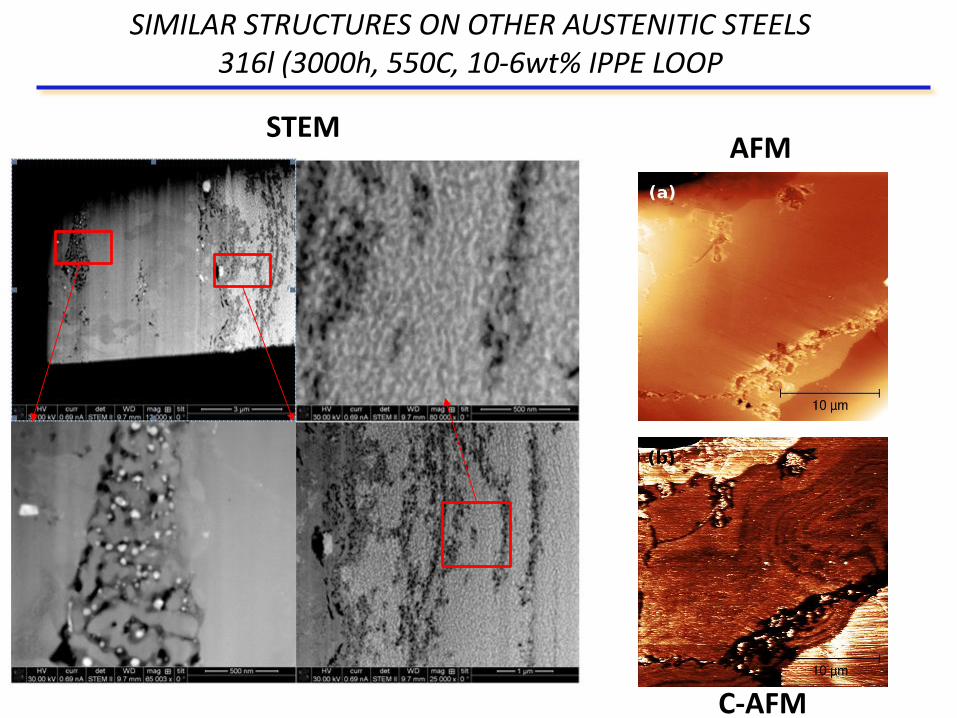
SIMILAR STRUCTURES ON OTHER AUSTENITIC STEELS 316l (3000h, 550C, 10-6wt% IPPE LOOP
STEM AFM
C-AFM

MATERIALS TESTING AT 700°C FOR 300h at 10-5wt% OXYGEN (STATIC) 316l
O Cr
Fe Ni
Pb Bi LBE penetration follows the
oxide penetration.
Fast diffusion at high temperature.
rapid progress of LM
penetration

SEM/EDX ON FERRITIC STEELS HT-9 (0.1C, 8.3Cr, 0.43Si, 0.95Mo) 3000h 550C, 10-6wt% (IPPE LOOP)
Back scattered SEM image (a) and EDX mapping of the same
location on HT-9 exposed to 550C LBE for 3000h.

TEM ON OXIDE LAYERS FORMED ON HT-9
0
2000
4000
6000
8000
1 104
1.2 104
1.4 104
0 5 10-8
1 10-7
1.5 10-7
2 10-7
Cr-K
Ni-KO-K
Fe-K
Cou
nts
Distance [nm]
0
1000
2000
3000
4000
5000
6000
7000
8000
0 5 10-8
1 10-7
1.5 10-7
2 10-7
Cr-K
Si-K
O-KFe-K
Co
un
ts
Distance [m]
0
2000
4000
6000
8000
1 104
0 200 400 600 800 1000 1200 1400 1600
Cr KSi K
O KFe K
C KNi K
Coun
tsDistance [nm]
0
1000
2000
3000
4000
5000
6000
0 10 20 30 40 50
Cr KSi K
O K
Fe K C K
Ni K
Coun
ts
Dsitance [nm]
B
A
A
B
Cr Fe Si O
Cr Fe Si O
Cr Fe Si O
Cr Fe Si O

Characterization of oxide layers formed under oxygen starvation
T-EBSD

26
FIB PROCESSING ON LBE PENETRATED SAMPE; SCK SAMPLE
Standard FIB based lift out and slice and dice can be deployed in order to obtain the best location for a TEM sample. 316l, 450C, 1000h <<10-8wt%
20 m
thin foil location
(a)
5 m
0.5 m
end of LBE
penetration
deformation
twin boundaries
(d) 3 m (c)
2 m
ferritized micro-volumes between twin boundaries
(b) Pt strip
cavities

Orientation map Y FCC
450C 1000h IN LOW OXYGEN LBE 316l SS T-EBSD; SCK SAMPLE
Phase map (red fcc, blue bcc)
In collaboration with K. Lambrinou SCK-CEN P. Hosemann, Submitted.
59.94 degrees
Austenitic matrix (fcc)
LBE
twin boundaries
200 nm 2 m
deformation twin boundaries
Phase transformation fccbcc and LM expansion upon freezing leads to stresses and crack formation

PUSHING THE LIMIT FOR CSP SYSTEMS WITH TEMPERATURE
High temperature; >700C High Flow velocity,
High temperature corrosion even more of an issue in LM
High temperature oxidation on the air side
High temperature creep/strength issues Liquid metal creep issues?
New structural materials selection is needed
Best passivation film formation on common steels is Al containing steels Fe-Cr-Al alloys MA956, PM2000 ODS alloys with 4.5-5.5 wt%Al Kanthal steel series with 3-6wt%Al.
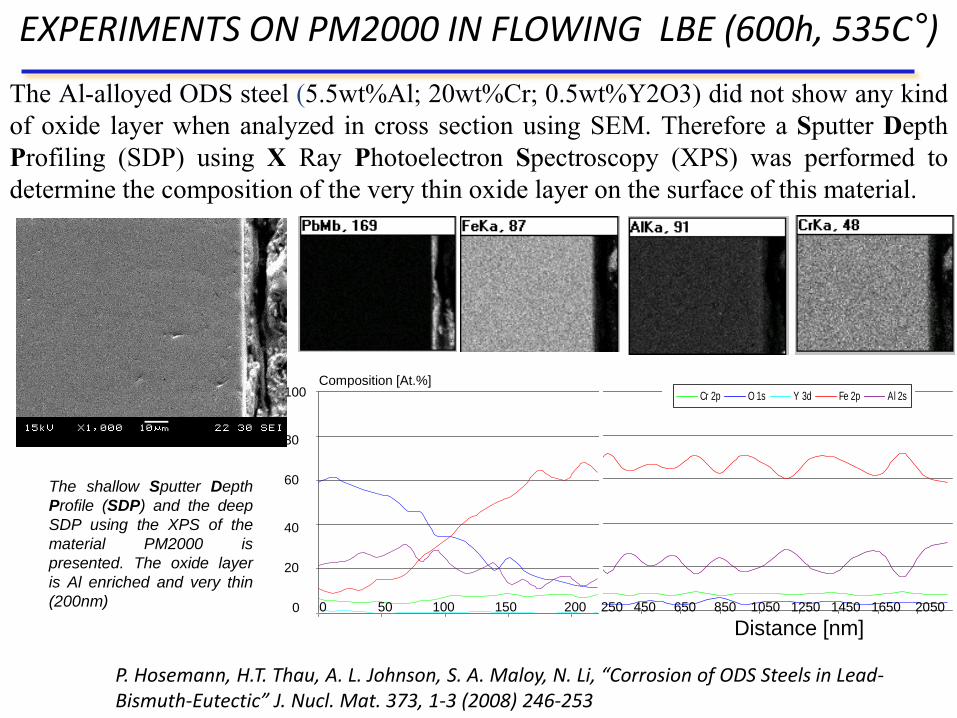
EXPERIMENTS ON PM2000 IN FLOWING LBE (600h, 535C°)
0
20
40
60
80
100
0 50 100 150 200 250
Cr
O
Y
Fe
Al
0
20
40
60
80
100
450 650 850 1050 1250 1450 1650 1850 2050
Cr 2p
O 1s
Y 3d
Fe 2p
Al 2s
80
60
40
20
0
100
0
10
20
30
40
50
60
70
80
90
100
450 650 850 1050 1250 1450 1650 1850 2050
Cr 2p O 1s Y 3d Fe 2p Al 2s
0 50 100 150 200 250 450 650 850 1050 1250 1450 1650 2050
The shallow Sputter Depth
Profile (SDP) and the deep
SDP using the XPS of the
material PM2000 is
presented. The oxide layer
is Al enriched and very thin
(200nm)
Composition [At.%]
Distance [nm]
The Al-alloyed ODS steel (5.5wt%Al; 20wt%Cr; 0.5wt%Y2O3) did not show any kind
of oxide layer when analyzed in cross section using SEM. Therefore a Sputter Depth
Profiling (SDP) using X Ray Photoelectron Spectroscopy (XPS) was performed to
determine the composition of the very thin oxide layer on the surface of this material.
P. Hosemann, H.T. Thau, A. L. Johnson, S. A. Maloy, N. Li, “Corrosion of ODS Steels in Lead-Bismuth-Eutectic” J. Nucl. Mat. 373, 1-3 (2008) 246-253

CORROSION TESTING OF CANDIDATE MATERIALS AT HIGH TEMPERTURE
Materials selected for corrosion testing
Sample Cr Al Fe Ni
316l 16-18 - Bal 10-14
ALK 14-16 4.3 Bal -
APM 20-23 5.8 Bal 5.8

316L steel
LBE
oxide
ALK steel
LBE
oxide
APM steel
LBE
oxide
16-18% Cr, 10-14% Ni; 14-16% Cr, 4.3% Al 20-23% Cr, 5.8% Al
Bi
O
Cr
Fe
Ni
Typical double layer was found on 316l as reported in the literature
Thin Al and O rich surface near region was formed as expected. APM has too thin of a layer to detect the passivation film
CORROSION TEST RESULTS 600°C 10-7
at% 500h
O
Cr Bi
Al
Fe

Test 4: 750°C for 200 h 10-7 wt%
316L steel
LBE
oxide
ALK steel
LBE
oxide
APM steel
LBE
oxide
CORROSION TEST RESULTS IN LBE 750°C FOR 200h 10-7wt%
Bi Al
Pb O
Fe Cr
Passivation layer formed on 316l is not protective any more under this condition. Passivation layer on Al containing steels appears to be sufficient.

STRAIN UNDERNEATH THE OXIDE LAYER AFTER COOLING THE SAMPLE STUDIED USING LAUE MICRO DIFFRACTION
Strain map
Peak shape change as a function of location
Unstrained lattice Strained lattice
inte
nsi
ty
2Θ
Kanthal ALK 700°C 500h

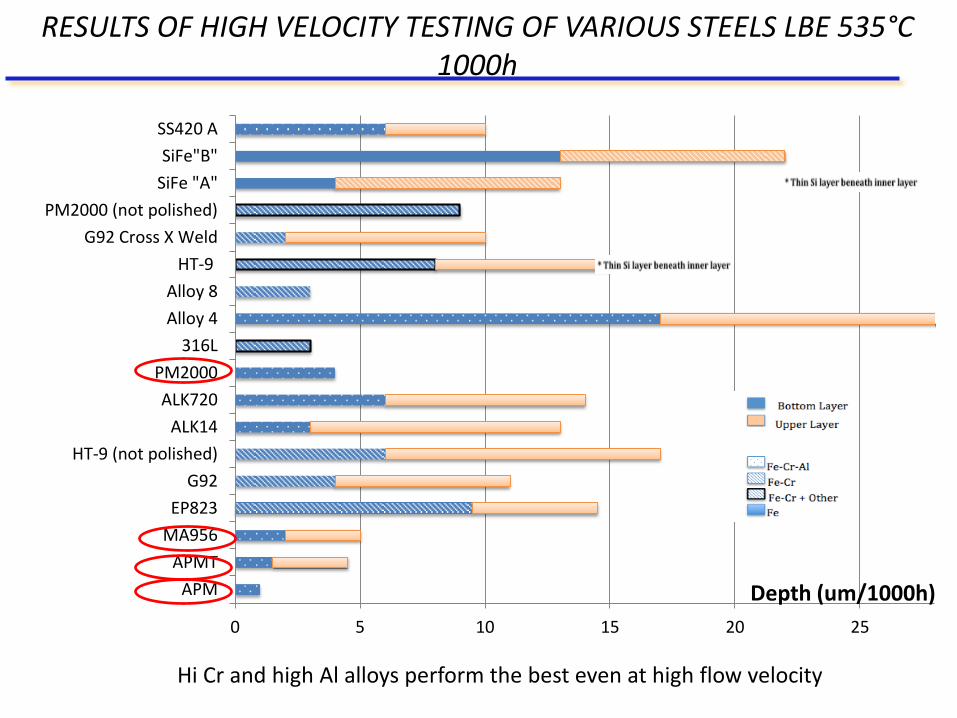
Flow conditions
T [C] 488
Velocity [m/s] 3.5
Oxygen concentration [wt%] 3.2 x 10⁻⁵
Samples Oxide thickness
APM 1 μm
APMT 5 μm
MA956 5 μm
EP823 10 μm
G92 10 μm
HT-9 (not polished) 20 μm
ALK14 15 μm
ALK720 10 μm
PM2000 1 μm
316L 3 μm
Alloy 8 5.5 μm
HT-9 18 μm
G92 Cross X Weld 12 μm
PM2000 (not polished) 12 μm
SiFe "A" 13 μm
SiFe"B" 20 μm
SS420 A 12 μm
Alloy 4
HIGH VELOCITY FLOW EXPERIMENT AT LANL (LBE)
The DELTA Loop
We were able to provide samples for the LANL corrosion loop
M. De Caro, S.A. Maloy, F. Rubio Los Alamos National Laboratory
0 5 10 15 20 25
APM
APMT
MA956
EP823
G92
HT-9 (not polished)
ALK14
ALK720
PM2000
316L
Alloy 4
Alloy 8
HT-9
G92 Cross X Weld
PM2000 (not polished)
SiFe "A"
SiFe"B"
SS420 A
Depth (um/1000h)
RESULTS OF HIGH VELOCITY TESTING OF VARIOUS STEELS LBE 535°C 1000h
Hi Cr and high Al alloys perform the best even at high flow velocity

Investigating the strengths of the passive layers. A parameter of mechanical adherence

MECHANICAL STABILITY OF PASSIVE LAYERS FORMED IN LBE
In-situ testing in the SEM using a Hysitron PI85 picoindenter
The PI 85 software package includes integrated test setup,
data analysis, sample positioning, and synchronization of
mechanical data with SEM video. Automated routines are also
incorporated for the tip/sample approach and for hands-off
execution of indent arrays.
PI 85 SEM PicoIndenter®
PI 85 SEM PicoIndenter
Quantitative nanomechanical testing interfaced with your SEM.
The PI 85 is a depth-sensing indenter that can be interfaced
with a scanning electron microscope (SEM). With this system
it is possible to perform quantitative nanomechanical testing
while simultaneously imaging with the SEM. Coupling these
two techniques allows the researcher to position the probe
extremely accurately and to image the deformation process
throughout the test.
This system is designed for exceptional performance in the
electron microscope, with a vacuum-compatible transducer and
an electrically conductive probe. With Hysitron’s capacitive
transducer, force is applied electrostatically and displacement
is measured capacitively. This low-current design provides low
thermal drift and industry-leading stability and sensitivity.
The PI 85 system is ideal for characterizing fracture onset and
crack propagation, delamination, and pile-up. Also, time-sensitive
phenomena such as viscoelastic behavior can be observed in
real time. The pairing of these two high-resolution techniques
provides unique insight into the mechanisms responsible for
materials behavior.
Designed for Performance
With the compact design of Hysitron’s capacitive transducer,
the PI 85 can be mounted directly onto the SEM stage without
platform of the instrument allows for maximum stage tilt and
minimum working distance for imaging during testing. The
system is designed to accommodate samples up to 10 mm
thick, with XYZ translation stages to provide precise sample
positioning with >3 mm range in three dimensions.
The PI 85 instrument is driven by the newly designed
performech™ DSP-embedded controller, which boasts an
addition, the mechanical coupling of the sample stage and the
transducer provides a stable, rigid platform for nanomechanical
testing.
Mechanical data from the PI 85 is fully synchronized with the SEM video, providing
a complete understanding of the deformation process.
PI-SERIES
9 6 2 5 W EST 76 TH ST. M IN N EA PO LIS, M N 5 5 3 4 4 TEL: 1 -9 5 2 -8 3 5 -6 3 6 6 FA X: 1 -9 5 2 -8 3 5 -6 1 6 6 W W W . H YSITRO N . C O M
Indenter Tip Sample Holder Transducer
Indenter Tip
Bend bar
Additional questions raised: Mechanical strength of the oxide layers? Interface strength between steel and passive layers? Fracture surface and fracture mode of the passive layers? Initial experiments were designed to evaluate the questions above.
M. D. Abad et al; Oxid. Met. 2015

Fe3O
4
FeC
r 2O
4
Micro Cantilevers milled at the University of California, Berkeley Milled using a FEI Quanta 3D FEG Focused Ion beam instrument Ferritic/martensitic steel HCM12A after exposure to LBE. Sample provided by K. Kikuchi
INVESTIGATING MECHANICAL STABILITY OF PASSIVE FILMS, BRITTLE FRACTURE

IN-SITU FRACTURE TEST C cantilever 1 = 1423 MPa
C cantilever 3 = 1046 MPa
0
500
1000
1500
0 0.002 0.004 0.006 0.008 0.01
Stre
ss [
MP
a]
Strain [-]
Cross Section cross section # 7
Cross section # 6
Cross section # 5
0
200
400
600
800
1000
1200
1400
1600
1800
0 0.002 0.004 0.006 0.008 0.01 0.012 0.014
Stre
ss [
MP
a]
Strain [-]
Inner Oxide inner oxide # 4
inner oxide #3
inner oxide # 2
Inner layer outer layer

POST FRACTURE ANALYSIS
Fracture Surface
Fe O
Cr
Steel Diffusion zone
oxide
High porosity region Fracture region
Fracture occurs in the porous area not directly at the interface!
M. D. Abad et al; Oxid. Met. 2015

Other liquid metals may be considered for CSP

0 5 10 15 20 250.4
0.5
0.6
0.7
0.8
0.9
1.0
EM
F [
V]
wt% Sn
550 C
600 C
650 C
700 C
750 C
800 C
Sn in Bi-Pb
(Bi:Pb = 2:1)
SMALL AMOUNTS OF ADDITIONAL ELEMENTS AFFECT OXYGEN POTENTALS.
Pb-Bi-Sn phase diagram: 96C melting point

The irradiation and corrosion experiment (ICE)

Beam: 5 MeV protons, 0.5 µA current, 80 hour run Target: Concaved HT-9 foil, 40 um at the center, 350 ºC Damage level: 0.3 to 1.4 dpa LBE chemistry control: no oxygen sensor Corrosion rate change due to irradiation is not important/noticeable
Hosemann et al. , J. Nucl. Mat. 376 (2008) 392.
THE IRRADIATION AND CORROSION EXPERIMENT (ICE) DESIGN

Specimen concave shape allows to hold the pressure of the corrosive medium
Sample cross section
77 m thick
Preparation of HT-9 concave specimens requires thinning of disks
Dose profile shows maximum value at the edges of the specimen
(T. Wynn, 2011)
Schematic machining:
SPECIMEN DESIGN AND FACILITY

LBE Side on HT-9
~60 hours 430C, 2.5dpa
INITIAL INVESTIGATION OF ICE SAMPLE

Out of the beam spot
In the beam spot
STEM ON ICE SPECIMEN (HT-9)
steel
oxide
The ion beam irradiation enhances the oxidation significantly and leaves lesser dense oxides on the sample surface

SUMMARY
• Introduction to selection of heavy liquid metals in CSP and nuclear applications. • Significant synergistic problems between the different engineering applications. • Phenomenon LM corrosion and structural materials selection • Oxide layer formation on austenitic and ferritic stainless steels as well as Fe-Cr-Al
alloys in LM static and flowing conditions. -flow of 3.5m/sec is acceptable. -low oxygen content fosters the development of ferrite zones in austenitic materials -Fe-Cr-Al shows better corrosion properties at higher temperatures. • Adherence of oxides on the substrate material can be sampled directly.
• Introduction to the ICE experiment. accelerated oxidation in the beam spot.

Thank you for your attention!


OXIDATION STAGES OF PM2000 in LBE
0 50 100 150 200
0
100
200
300
400
500
600
0 500 1000 1500 2000 2500
Measured O2 in the
oxide layer
Calcualted O2 in the
oxide layer
Y2O3+
Al2O3+
Cr2O3+
Fe3O4
Y2O3+
Al2O3+
Cr2O3+ Y2O3+
Al2O3+
Oxygen content [counts] Measured Oxygen
content
Calculated Oxygen
content
Based on the published electron binding energy of each element, XPS allows the determination of the
oxidation state of the element. Here the measured oxygen in the layer is compared with the calculated oxygen
for the material.
Experiment
temperature
0 50 100 150 200 Distance [nm]
0
100
200
300
400
500
0 2000 4000 6000
Oxygen
final sum
0
100
200
300
400
500
0 200 400 600
Oxygen
final sum
Distance [nm]
Y2O3+
Al2O3+
Cr2O3+
Fe3O4
Y2O3+
Al2O3+
Cr2O3+
Y2O3+
Al2O3+
Measured Oxygen
content
Calculated Oxygen
content
Oxygen content [counts]
MA956Fe, 20Cr, 4.5Al, 0.3Y2O3
PM2000
Fe, 20Cr, 5.5Al,
0.3Y2O3

LBE
LBE
LBE
LBE
Holes
FIB PROCESSING AND STEM ON LME TEST SAMPLE (T91); SCK SAMPLE
In collaboration with E. Stergar, SCK
LBE penetrates at GB

A large number of intermetallic phases can be formed between Bi, Pb and Zr. While no ternary phase diagram is available the binary systems show significant formation of intermetallic phases
Since in an encapsulated system no new oxygen supply is possible intermetallics may form
The pre-irradiation tests did show that LM-Zr cladding is not a concern due to passivation layers formed and constant fresh supply of oxygen.

OM comparison (capsule 1)

100 µm
SEM OF THE IRRADIATED CAPSULE 1 SAMPLE
• Zr in the LM, • Some U is found at the Zr interface. • Cracks in the LM? • Multi phase mixtures in the LM

AFM/MFM/C-AFM ON HT-9
Outer layer
Inner layer
Outer layer
Inner layer
HT-9 bulk HT-9 bulk
Pores
Crack
Interface Interface -20 nm
Outer layer
Inner layer
Interface
Steel
10-25pA 0pA 10-40pA
GB Grain Current line profile through the boundaries identified
Grain
Cu
rren
t (n
A) Cr2O3 lower
electrical conductivity than Fe3O3

HOW DOES THIS OXIDE LAYER FORM in a Ni containing materials IN LIQUID METAL?
P. Hosemann, et al. J. Nucl. Mat. 375, 3, 30 (2008)323-330
Oxide layer growth: leaching and oxidation takes place: