lisc metroedge report - updated for 2014
TRANSCRIPT

Draft
Downtown MesaRetail Market Profile
LISC MetroEdge is a program of the Local Initiatives Support Corporation (LISC). It works in urban markets nationwide assisting CDC’s, local governments, developers and business associations to define their market potential and develop and implement strategies to achieve that potential.04/15/2023

Draft
Downtown Mesa Trade AreaThis is a Convenience Trade Area. Its boundaries are:
East: Mesa Drive West: Alma School Road North: Tempe Canal South: Broadway
Shoppers would typically expect to find “Saturday morning” shopping options in this area such as pharmacies, groceries, dry cleaners, auto repair stores or hardware stores.
This area is 3.97 square miles
04/15/2023
Draft
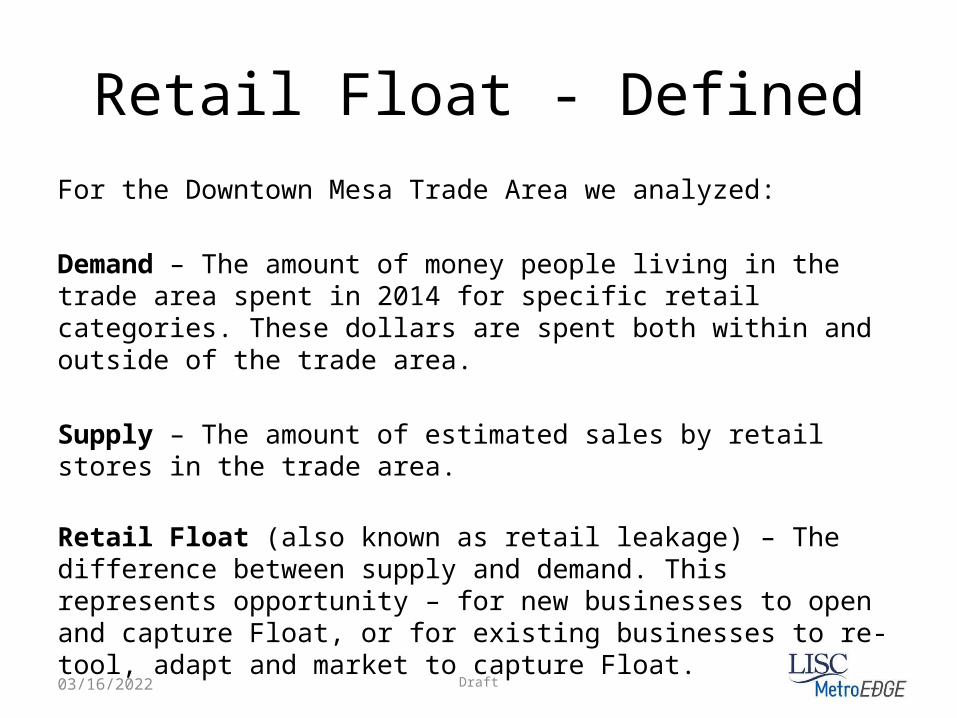
Retail Float - DefinedFor the Downtown Mesa Trade Area we analyzed:
Demand – The amount of money people living in the trade area spent in 2014 for specific retail categories. These dollars are spent both within and outside of the trade area.
Supply – The amount of estimated sales by retail stores in the trade area.
Retail Float (also known as retail leakage) – The difference between supply and demand. This represents opportunity – for new businesses to open and capture Float, or for existing businesses to re-tool, adapt and market to capture Float.
04/15/2023
Draft
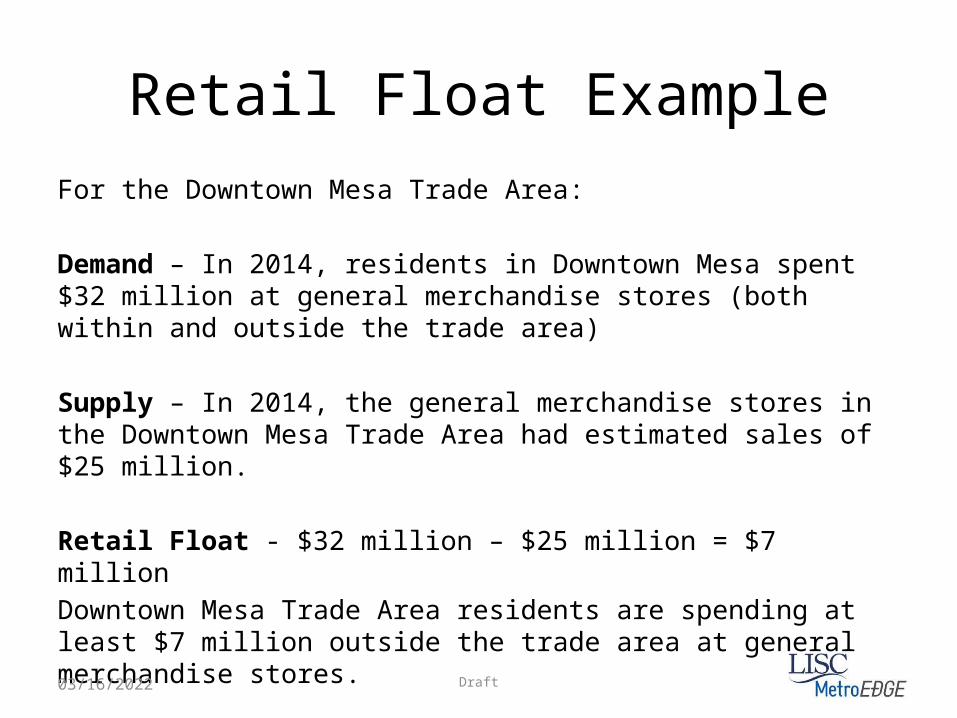
Retail Float ExampleFor the Downtown Mesa Trade Area:
Demand – In 2014, residents in Downtown Mesa spent $32 million at general merchandise stores (both within and outside the trade area)
Supply – In 2014, the general merchandise stores in the Downtown Mesa Trade Area had estimated sales of $25 million.
Retail Float - $32 million – $25 million = $7 millionDowntown Mesa Trade Area residents are spending at least $7 million outside the trade area at general merchandise stores.
04/15/2023

Draft
DefinitionsRetail Float, a measure of the amount of retail opportunity in the trade area, and is calculated as the difference between buying power (demand) and retail sales (supply)
When Retail Float is a positive value there is unmet demand by residents in the trade area, representing opportunities for new or existing businesses to target.
When Retail Float is a negative value there is either a healthy concentration of retail to build from, or there is a saturation of retail that indicates limited opportunity for business growth or expansion.
– Retail such as restaurants, clothing or furniture stores attract shoppers looking for multiple stores. In many cases negative float for these categories indicates a business opportunity to start or grow a business to complement what already exists in the market.
– Retail such as hardware stores, general merchandise stores and grocery stores are less likely to grow or expand when there is negative float (when there is little or no unmet demand in the surrounding market)
04/15/2023

Draft
Concentrated Buying PowerDefinition: Potential dollars available to be spent by trade area residents per square mile
There is an estimated concentrated buying power of $ 74 million in the Downtown Mesa Trade Area
This represents the buying power for the residential community living in the Trade Area.
04/15/2023
Draft
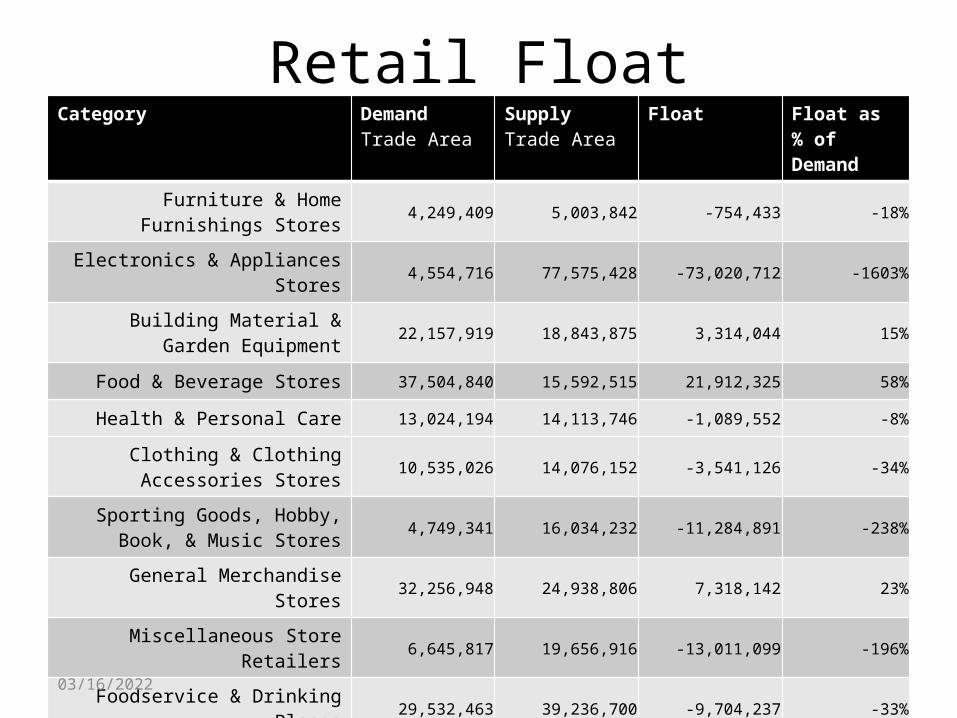
Retail FloatCategory Demand
Trade AreaSupplyTrade Area
Float Float as % of Demand
Furniture & Home Furnishings Stores
4,249,409 5,003,842 -754,433 -18%
Electronics & Appliances Stores
4,554,716 77,575,428 -73,020,712 -1603%
Building Material & Garden Equipment
22,157,919 18,843,875 3,314,044 15%
Food & Beverage Stores 37,504,840 15,592,515 21,912,325 58%
Health & Personal Care 13,024,194 14,113,746 -1,089,552 -8%
Clothing & Clothing Accessories Stores
10,535,026 14,076,152 -3,541,126 -34%
Sporting Goods, Hobby, Book, & Music Stores
4,749,341 16,034,232 -11,284,891 -238%
General Merchandise Stores 32,256,948 24,938,806 7,318,142 23%
Miscellaneous Store Retailers 6,645,817 19,656,916 -13,011,099 -196%
Foodservice & Drinking Places 29,532,463 39,236,700 -9,704,237 -33%
04/15/2023
Draft
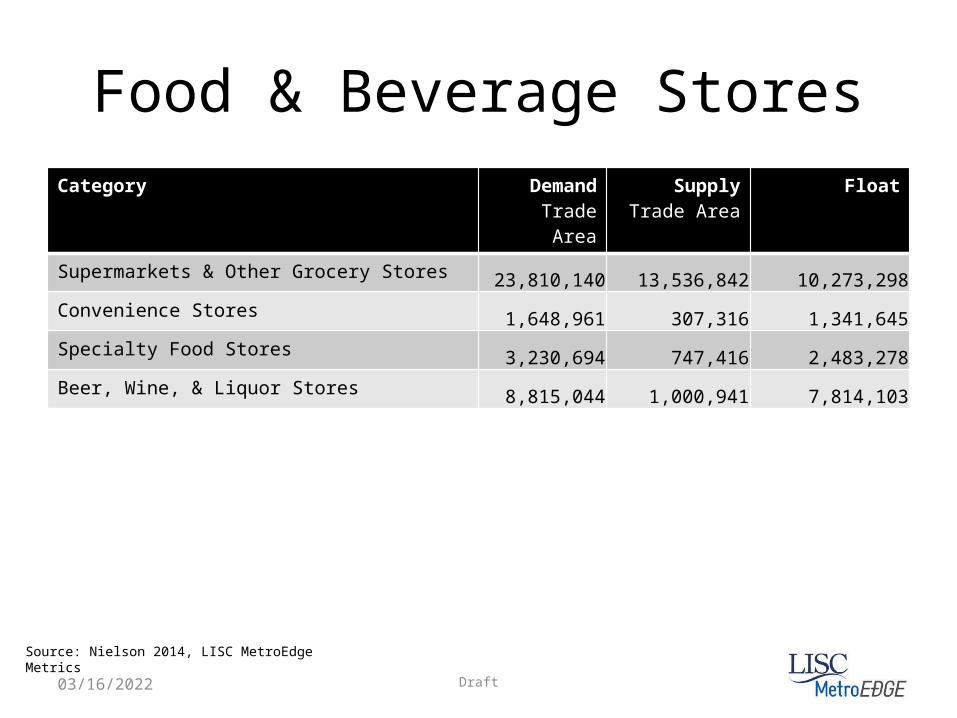
Food & Beverage StoresCategory Demand
Trade AreaSupply
Trade AreaFloat
Supermarkets & Other Grocery Stores23,810,140 13,536,842 10,273,298
Convenience Stores1,648,961 307,316 1,341,645
Specialty Food Stores3,230,694 747,416 2,483,278
Beer, Wine, & Liquor Stores8,815,044 1,000,941 7,814,103
Source: Nielson 2014, LISC MetroEdge Metrics
04/15/2023

Draft
Health & Personal Care Stores
Category DemandTrade Area
SupplyTrade Area
Float
Pharmacies and Drug Stores10,377,723 11,406,884 -1,029,161
Cosmetics, Beauty Supplies and Perfume Stores 907,991 670,443 237,548
Optical Goods Stores535,898 779,830 -243,932
Other Health and Personal Care Stores1,202,582 1,256,589 -54,007
Source: Nielson 2014, LISC MetroEdge Metrics
04/15/2023
Draft
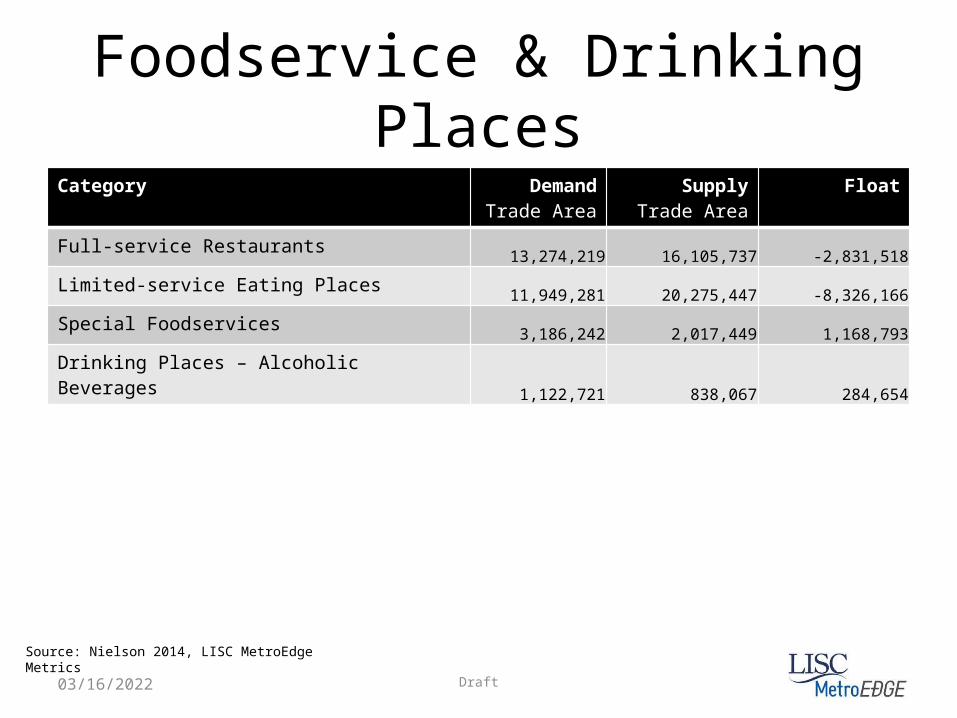
Foodservice & Drinking Places
Category DemandTrade Area
SupplyTrade Area
Float
Full-service Restaurants13,274,219 16,105,737 -2,831,518
Limited-service Eating Places11,949,281 20,275,447 -8,326,166
Special Foodservices3,186,242 2,017,449 1,168,793
Drinking Places – Alcoholic Beverages1,122,721 838,067 284,654
Source: Nielson 2014, LISC MetroEdge Metrics
04/15/2023

Top Ten Employers
Source: City of Mesa; Maricopa Association of Governments; Nielson, 2014
Business Name Address NAICS Description Location TypeNumber of Local Employees
Banner Corporate Center Mesa 525 W Brown Rd Health Care and Social Assistance Single Location 784
Canyon State Drywall, Inc 301 S Westwood Drywall & Insulation Contractors Single Location 350
Mesa City Plaza 20 E Main St Public Administration Single Location 302
Westwood High School945 W Rio Salado Pkwy Educational Services Single Location 248
City of Mesa Central Police Bldg 130 N Robson Public Administration Single Location 208
City of Mesa Utilities 640 N Mesa Dr Public Administration Single Location 186
Wells Fargo 305 E Main St Finance and Insurance Single Location 184City Of Mesa Communications Dept. 161 E 6th Pl Public Administration Single Location 147
Mesa Christian Health 255 W Brown Rd Health Care and Social Assistance Single Location 138
City Of Mesa 55 N Center Public Administration Single Location 135
30 min Lunch

Draft
Downtown Mesa Population
Source: Nielson 2014, LISC MetroEdge Metrics
04/15/2023
2010 2014 estimates 2019 Projections
19,418 19,631 20,154
1

Draft
Downtown Mesa Population by Age
Source: Nielson 2014, LISC MetroEdge Metrics
04/15/2023
Age 0 - 4 Age 5 - 9 Age 10 - 14 Age 15 - 17 Age 18 - 20 Age 21 - 24 Age 25 - 34 Age 35 - 44 Age 45 - 54 Age 55 - 64 Age 65 - 74 Age 75 - 84 Age 85 and over
0.00%
2.00%
4.00%
6.00%
8.00%
10.00%
12.00%
14.00%
16.00%
18.00%
2010 2014 2019
Median Age 2014 (33)

Draft
Downtown Mesa Race/Ethnicity
Source: Nielson 2014, LISC MetroEdge Metrics
04/15/2023
White African American Asian Alone Other Hispanic0%
10%
20%
30%
40%
50%
60%
70%
80%
2010 2014 2019

Downtown Mesa Households
Source: Nielsen Corporation, 2014;
Households by Tenure and Mortgage Status, 2014
Total 9,854 100%
Owner Occupied 2,504 25%
Owned with a Mortgage/Loan 1,904 76%
Owned Free and Clear 767 24%
Average Household Size 2.46
Renter Occupied 5,607 57%

Downtown Mesa Household Income
Source: Nielsen Corporation, 2014;
Income Less than $25,000 Income $25,000 - $34,999 Income $35,000 - $49,999 Income $50,000 - $99,999 Income $100,000 - $149,999
Income Greater than $150,000
0%
5%
10%
15%
20%
25%
30%
35%
40%
45%
2000 2014 2019
Median Income 2014 ($30,559)

Density of Middle to Upper Income Households
Source: Nielsen Corporation, 2014;
2000 2014 2019
501
557589