listening to fish - massachusetts institute of technology
TRANSCRIPT

Listening to FishPassive Acoustic Applications in Marine Fisheries
8-10 April 2002An International Workshop on the Applications of
Passive Acoustics in FisheriesMassachusetts Institute of Technology
Cambridge, MA
Conference Proceedings

TABLE OF CONTENTS
Listening to Fish: Proceedings of the International Workshop on the
Applications of Passive Acoustics to Fisheries
Rodney Rountree, Cliff Goudey, and Tony Hawkins . . . . . . . . . . . . . . . . . . . . . . . . . . . . . . . . . . . . . . . . . . . . . 4
Locating sciaenid spawning aggregations in anticipation of harbor modifications,
and reactions of spotted sea trout spawners to acoustic disturbance
Mark Collins, Bridget Callahan, Bill Post, and Amanda Avildsen . . . . . . . . . . . . . . . . . . . . . . . . . . . . . . . . 11
Characterization of sounds and their use in two sciaenid species: weakfish and Atlantic croaker
Martin A. Connaughton, Michael L. Lunn, Michael L. Fine, & Malcolm H. Tayor. . . . . . . . . . . . . . . . . . . . 15
Detection and characterization of yellowfin and bluefin tuna using passive acoustical techniques
Scott Allen and David A. Demer . . . . . . . . . . . . . . . . . . . . . . . . . . . . . . . . . . . . . . . . . . . . . . . . . . . . . . . . . . . . . 20
Acoustic Competition in the Gulf Toadfish Opsanus beta: Crepuscular Changes & Acoustic Tagging
Michael L. Fine and Robert F. Thorson . . . . . . . . . . . . . . . . . . . . . . . . . . . . . . . . . . . . . . . . . . . . . . . . . . . . . . . . 23
Passive Acoustic Field Research on Atlantic Cod, Gadus morhua L. in Canada
Susan B. Fudge and George A. Rose. . . . . . . . . . . . . . . . . . . . . . . . . . . . . . . . . . . . . . . . . . . . . . . . . . . . . . . . . . 28
Passive Acoustic Transects: Mating Calls and Spawning Ecology in East Florida Sciaenids
R. Grant Gilmore, Jr.. . . . . . . . . . . . . . . . . . . . . . . . . . . . . . . . . . . . . . . . . . . . . . . . . . . . . . . . . . . . . . . . . . . . . . . . . 33
The Use of Passive Acoustics to Identify a Haddock Spawning Area
Anthony D. Hawkins . . . . . . . . . . . . . . . . . . . . . . . . . . . . . . . . . . . . . . . . . . . . . . . . . . . . . . . . . . . . . . . . . . . . . . . . 43
Using a Towed Array to Survey Red Drum Spawning Sites in the Gulf of Mexico
Scott A. Holt . . . . . . . . . . . . . . . . . . . . . . . . . . . . . . . . . . . . . . . . . . . . . . . . . . . . . . . . . . . . . . . . . . . . . . . . . . . . . . . 48
Fish Courtship and Mating Sounds
Phillip S. Lobel . . . . . . . . . . . . . . . . . . . . . . . . . . . . . . . . . . . . . . . . . . . . . . . . . . . . . . . . . . . . . . . . . . . . . . . . . . . . . 54
Using Passive Acoustics to Monitor Spawning of Fishes in the Drum Family (Sciaenidae)
Joseph J. Luczkovich and Mark W. Sprague . . . . . . . . . . . . . . . . . . . . . . . . . . . . . . . . . . . . . . . . . . . . . . . . . . . 59
Are acoustic calls a premating reproductive barrier between two northeast Atlantic cod (Gadus
morhua) groups—a review
Jarle Tryti Nordeide and Jens Loss Finstad . . . . . . . . . . . . . . . . . . . . . . . . . . . . . . . . . . . . . . . . . . . . . . . . . . . 64

Applications of underwater acoustics data in fisheries management for
spotted seatrout, Cynoscion nebulosus, in estuaries of South Carolina
Bill Roumillat and Myra Brouwer . . . . . . . . . . . . . . . . . . . . . . . . . . . . . . . . . . . . . . . . . . . . . . . . . . . . . . . . . . . . 70
Soniferous Fishes of Massachusetts
Rodney Rountree, Francis Juanes, and Joseph E. Blue. . . . . . . . . . . . . . . . . . . . . . . . . . . . . . . . . . . . . . . . . . 77
The mating behaviour of Atlantic cod (Gadus morhua).
Sherrylynn Rowe and Jeffrey A. Hutchings . . . . . . . . . . . . . . . . . . . . . . . . . . . . . . . . . . . . . . . . . . . . . . . . . . . 85
Spotted Seatrout Spawning Requirements and Essential Fish Habitat: A Microhabitat
Approach Using Hydrophones
Donald M. Baltz . . . . . . . . . . . . . . . . . . . . . . . . . . . . . . . . . . . . . . . . . . . . . . . . . . . . . . . . . . . . . . . . . . . . . . . . . . . . 90
Creating a Web-based Library of Underwater Biological Sounds
Jack W. Bradbury and Carol A. Bloomgarden. . . . . . . . . . . . . . . . . . . . . . . . . . . . . . . . . . . . . . . . . . . . . . . . . . 94
Potential for coupling of underwater TV monitoring with passive acoustics
Charles A. Barans, David Schmidt, Myra C. Brouwer . . . . . . . . . . . . . . . . . . . . . . . . . . . . . . . . . . . . . . . . . . . . 98
Application of Passive Acoustic Methods for Detection, Location and Tracking of Whales
Christopher W. Clark. . . . . . . . . . . . . . . . . . . . . . . . . . . . . . . . . . . . . . . . . . . . . . . . . . . . . . . . . . . . . . . . . . . . . . . 103
Passive Detection and Localization of Transient Signals from Marine Mammals using
Widely Spaced Bottom Mounted Hydrophones in Open Ocean Environments
Susan Jarvis and David Moretti . . . . . . . . . . . . . . . . . . . . . . . . . . . . . . . . . . . . . . . . . . . . . . . . . . . . . . . . . . . . 109
Multihydrophone localization of low frequency broadband sources
Stephen E. Forsythe . . . . . . . . . . . . . . . . . . . . . . . . . . . . . . . . . . . . . . . . . . . . . . . . . . . . . . . . . . . . . . . . . . . . . . . 122
Synchronized underwater audio-video recording
Phillip S. Lobel . . . . . . . . . . . . . . . . . . . . . . . . . . . . . . . . . . . . . . . . . . . . . . . . . . . . . . . . . . . . . . . . . . . . . . . . . . . . 127
New technologies for passive acoustic detection of fish sound production
David A. Mann . . . . . . . . . . . . . . . . . . . . . . . . . . . . . . . . . . . . . . . . . . . . . . . . . . . . . . . . . . . . . . . . . . . . . . . . . . . . 131
A remote-controlled instrument platform for fish behaviour studies and sound monitoring
Ingvald Svellingen, Bjørn Totland and Jan Tore Øvredal . . . . . . . . . . . . . . . . . . . . . . . . . . . . . . . . . . . . . . 135
Potential for the use of Remotely Operated Vehicles (ROVs) as a platform for passive acoustics.
Rodney Rountree, Francis Juanes, and Joseph E. Blue . . . . . . . . . . . . . . . . . . . . . . . . . . . . . . . . . . . . . . . . 138
Quantifying Species-Specific Contributions to the Overall Sound Level
Mark W. Sprague and Joseph J. Luczkovich . . . . . . . . . . . . . . . . . . . . . . . . . . . . . . . . . . . . . . . . . . . . . . . . . . 147
Classifying Fish Sounds Using Wavelets
Mark Wood . . . . . . . . . . . . . . . . . . . . . . . . . . . . . . . . . . . . . . . . . . . . . . . . . . . . . . . . . . . . . . . . . . . . . . . . . . . . . . . 154
A summary report on the Biology Session and Biology Working Group from the International
Workshop on the Application of Passive Acoustics in Fisheries.
Joseph J. Luczkovich . . . . . . . . . . . . . . . . . . . . . . . . . . . . . . . . . . . . . . . . . . . . . . . . . . . . . . . . . . . . . . . . . . . . . . 159
Working Group on Technology Issues
David Mann . . . . . . . . . . . . . . . . . . . . . . . . . . . . . . . . . . . . . . . . . . . . . . . . . . . . . . . . . . . . . . . . . . . . . . . . . . . . . . 168
Listening to Fish: Proceedings of the International Workshop on the
Applications of Passive Acoustics to Fisheries
Rodney Rountree1, Cliff Goudey2, and Tony Hawkins3
1School for Marine Science and Technology, UMASS Dartmouth, 706 South Rodney French Blvd, New
Bedford, MA 02744
2 Center for Fisheries Engineering Research, MIT Sea Grant College Program, MIT Bldg. NE20-376,
3 Cambridge Center, Cambridge, MA 02139
3 Kincraig, Blairs, Aberdeen, Scotland AB12 5YT
Workshop Objectives
1. Convene an international conference to assess the potential of passive acoustics as a tool withapplications in fisheries and marine conservation in estuarine, coastal and oceanic ecosystems.
2. To promote the use of passive acoustics for exploring the oceans, surveying marine biodiversity,and assessing the impact of man’s activities upon the oceans.
3. Develop an international research initiative to explore and extend the use of passive acousticsin the marine sciences in both applied and non-applied fields, and to develop potentialresearch theme areas for future funding.
Introduction
On April 8-10, 2002, MIT Sea Grant hosted an international workshop on the application of passive
acoustics in fisheries in Dedham, Massachusetts. The ‘hands-on’ workshop drew over 40 European
and North American experts from fisheries, fish biology, acoustics, signal processing, underwater
technology and other related fields. The workshop was divided into 4 sessions and 2 working
groups with a total of 29 presentations delivered. The first session entitled:“Passive Listening for
fishes - what has been done?” reviewed past and current research activities, while the second ses-
sion “Future developments and applications” examined recommendations for future research and
examples where existing programs could be enhanced by passive acoustic technology. The third
session “Acoustic technology” reviewed the state of the art and future developments for underwater
acoustic and related technologies. A special session included demonstrations of hardware and soft-
ware. The workshop was caped off by a working group on the biological and ecological aspects of
passive acoustic research, moderated by Joe Luczkovich of East Carolina University, and a working
group on technology and software issues moderated by David Mann of the University of Southern
— 4 —
Proceedings from the International Workshop on the Applications of Passive Acoustics to Fisheries
Florida in St. Petersburg. A web page was constructed to document the findings of the workshop
(http://web.mit.edu/seagrant/acoustics/index.html).
The workshop was a great success at bringing together an outstanding group of international
researchers to exchange research results, knowledge and ideas related to the application of passive
acoustics to fisheries, census of marine life and related issues. The workshop demonstrated the high
potential of passive acoustics as a research tool for fisheries and related fields through the presenta-
tion of the results of a number of successful research projects. One of the important outcomes of
the workshop was the exchange of information about ongoing and past research projects that have
successfully used passive acoustics. Previously, many of these scientists had been working in isola-
tion with little interaction with their colleagues working across North America and overseas. The
fisheries biologists participating in the workshop also gained valuable insight from exchange of
information with scientists with well-established backgrounds in the use of passive acoustics to
study marine cetaceans (see Clark, Jarvis and Moretti, herein). Another important result was the
exchange of hardware and software technologies among the participants. The workshop has
already fostered renewed enthusiasm among the participants for this field of research and has
resulted in new domestic and international collaborations. In addition, the workshop brought
researchers together with administrators, staff and scientists from several funding agencies and with
the media (e.g., NURP, National Geographic, etc.). Finally, extensive discussion of the future research
priorities for passive acoustics, and development of both domestic and international collaborations,
are expected to go a long way towards promoting the application of passive acoustic technology to
fisheries and related fields. Some of the most important research initiatives identified by the work-
shop participants were: 1) the importance of developing a national database of historic underwater
sound archives (see Bradbury and Bloomgarden, herein), 2) the importance of establishing a
National/International Reference Library of fish sounds, which would be guided by an international
panel of scientists drawn in part from the workshop participants, 3) the importance of establishing
an international research and training center for passive acoustics applications to fisheries and
marine census (potentially at Grant Gilmore’s Laboratory at the Kennedy Space Center), and 4) the
importance of active promotion of the technology through publications of the workshop proceed-
ings and related articles. Many more specific research needs in biology and technology were
addressed and are presented throughout these proceedings.
Background
Fish are difficult to see and study in the ocean. SCUBA techniques can help in shallow waters and a
range of active acoustic and optical techniques can assist in deep water, but we are still largely igno-
rant of the distribution and behavior of the great majority of marine fish. Possibly one of the great-
est challenges to researchers attempting to study the behavioral ecology of fishes is that of finding
the fish in the first place. Often a scientist must go to great lengths conducting expensive and time
consuming biological surveys simply to determine the locations or habitats where a fish can be
found, before any attempt to study its biotic and abiotic interactions can be made. After all, you
can’t study something you can’t find. Any tool that can help scientists to locate fish is therefore
— 5 —
Proceedings from the International Workshop on the Applications of Passive Acoustics to Fisheries
valuable. Fish too face the problem of assessing their environment, navigating through it, and com-
municating with others of their kind. A surprisingly large number use sound to overcome the prob-
lem of living in a visually opaque medium.
Over 800 species of fishes from 109 families worldwide are known to be vocal, though this is likely
to be a great underestimate. Of these, over 150 species are found in the northwest Atlantic (Fish
and Mowbray 19701). Amongst the vocal fishes are some of the most abundant and important com-
mercial fish species, including cod, haddock and the drum fishes (sciaenidae).
Passive acoustics offers a unique tool to study these fishes, which often live in dark and turbid
waters and are difficult to observe by other means. Passive acoustic techniques can be used to
locate concentrations of particular species, especially during their vulnerable spawning stage. This
in turn allows spawning habitat to be identified, mapped, and protected. It can allow the numbers
of fish to be assessed. And it can be used to gain a better understanding of fish behaviour, includ-
ing fish migrations. Passive acoustics can also be used to simultaneously monitor sources of noise
pollution, and to study the impact of man’s activities on marine communities. Anthropogenic
sources include noise generated by boating activity, seismic surveys, sonars, fish-finders, depth find-
ers, drilling for oil and gas, and military activities. These all have an unknown but potential impor-
tant impact on marine fauna. We believe that passive acoustic technologies hold special promise
and will become important tools in the coming years. However, it has been largely ignored in the
northwest Atlantic in the study of fishes important in the marine food chain. It is also a technique
that is amenable to cooperative research with commercial fishermen, who can bring their own
knowledge to such studies.
Applications to Fisheries
Sounds travel much farther in water than light and underwater sounds, including fish calls, can
often be heard over much greater distances than fish can be seen. Listening to fish can contribute a
great deal to our knowledge of their abundance, distribution and behavior. Passive acoustics stud-
ies using relatively simple techniques have been successful in locating concentrations of important
fish species, opening the way for further, more detailed studies of their behavior, distribution and
habitat use. As reflected in the various research programs described within this proceedings,
already significant strides have been taken in the application of passive acoustics to fisheries:
* in an Arctic fjord in northern Norway, workers from the FRS Marine Laboratory, Aberdeen andthe University of Tromsø have located a spawning ground of haddock, Melanogrammus aeglefi-nus. Passive listening has revealed that this species, previously thought to spawn offshore indeep water, can also form large spawning concentrations close to shore (see Hawkins).
* Norwegian researchers are using passive acoustics to study spawning behavior of Atlantic codand other gadids (see Nordeide and Finstad, Svellingen et al.).
* a number of studies in the estuaries of the eastern United States have helped to localize thespawning areas of drum fishes and demonstrating the usefulness of passive acoustics as a toolfor identification of essential fish habitat requirements, as well as a tool to provide fisheries
— 6 —
Proceedings from the International Workshop on the Applications of Passive Acoustics to Fisheries
managers with information of sciaenid reproductive biology (see Collins et al., Gilmore, Holt,Luczkovich and Sprague, Roumillat and Brower).
* for the first time in the United States passive acoustics are being explored as a tool to censusmarine fishes on the continental shelf. In one study, a towed hydrophone array is being used toidentify spawning sites of red drum in the western Gulf of Mexico (see Holt). In another study,passive acoustics are being used to catalogue soniferous fishes in the Stellwagen Bank NationalMarine Sanctuary (see Rountree et al., Rountree and Juanes). One goal of the study is to deter-mine the feasibility of using passive acoustics as a supplemental tool in the census of fish diver-sity and habitat use patterns in the sanctuary.
* an ongoing survey of soniferous fishes of Massachusetts has resulted in a significant rangeextension for the cryptic estuarine and inshore fish, the striped cusk-eel, Ophidion marginatum(see Rountree and Juanes). Extensive sampling over many decades with conventional gears inthe region had failed to recognize the importance of striped cusk-eel to the fauna, while pas-sive acoustics revealed it to be widespread and abundant. This study demonstrates that even alow-budget, low-tech, approach to passive acoustics can contribute significantly to the censusof marine life.
New Technology
Studies described at the workshop have pushed technology to new levels that will allow researchers
to expand the frontiers of fisheries science and ocean exploration:
* the potential for combining hydrophone arrays with other underwater census technologies isbeing explored, including ROVs (see Rountree et al., Luczkovich and Sprague), underwater video(see Svellingen et al., Lobel, Barans et al.) and active acoustics (Fudge and Rose). Lobel has pio-neered the use of advanced SCUBA technologies for studies of fish vocal behavior.
* researchers are beginning to look towards existing acoustic arrays maintained by the Navy andother agencies for applications to fishes (see Jarvis and Moretti).
* Advances are being made in the development of modeling tools and software for trackingvocal fish (see Forsythe) and identifying individual fish (see Wood).
* New technologies for detecting and recording underwater sounds are rapidly evolving (seeMann).
* Historic archives of fish sounds are being assembled and rescued from deterioration and will bemade available to researchers and the public through the internet (see Bradbury andBloomgarden). The establishment of internet access to libraries of fish sounds is an importantstep to more widespread use of passive acoustics in fisheries science and related fields.
The Future of Passive Acoustics
Although studies described during the workshop reflect the rapid growth of research on passive
acoustics applications to fisheries and marine census, there are many areas where technical devel-
opments are needed to promote future research:
— 7 —
Proceedings from the International Workshop on the Applications of Passive Acoustics to Fisheries

Software
* the development of sound recognition systems, based on wavelet analysis and other new tech-niques to enable the automatic discrimination of different species. For a north Atlantic species,the haddock, it has already proved possible to distinguish the voices of individual male fish (seeWood).
* automatic event detection/analysis software to quantify temporal patterns of sounds over longtime periods.
* localization/tracking software (see Forsythe).
* software allowing simultaneous analysis of video and audio data in behavior studies (i.e., clickon the sound wave of a fish call and view the corresponding video frame in a second window).This capability would allow rapid correlations of individual sounds and sound components withbehavior and functional morphology.
The improvement of passive listening technology for systematically detecting and recording sounds
at sea, including:
* ship based listening systems, with dangling and towed hydrophones.
* bottom mounted listening systems based on underwater vehicles and pop-up buoys.
* drifting sonobuoy systems, either storing the data, or telemetering data to ships or shore-basedlistening stations.
* large hydrophone arrays, capable of localizing sound sources.
* measurement of source levels, and calibration techniques for measuring the distance of soundsources.
Back-yard science: Perhaps of equal importance to passive acoustics systems for use in the open
ocean is the development of technology to aid in small scale, low budget studies of marine fishes in
estuarine and inshore habitats. We feel that passive acoustics have a great potential as a tool to pro-
vide basic information on essential fish habitat use patterns, as it becomes more widely used in
classrooms and State and Federal sampling programs. Several studies presented at the workshop
demonstrate the usefulness of this type of research to fisheries. A good example of this is the dis-
covery, using passive acoustics, that striped cusk-eels are abundant in Massachusetts estuaries,
where despite a long history of conventional sampling in the region, the species was thought to be
a very rare straggler. Technologies to aid this type of research include:
* archival acoustic recorders - unmanned recorders for use on ships of opportunity in many typesof habitats.
* homing devices to locate sound sources (see Forsythe, Rountree et al.).
* devices that allow simultaneous recording of both audio and video data.
* hand-held devices for shore based, or small boat surveys in shallow water.
* miniature ROV designed for both video and audio recording of fish behavior from small boatsand from shore.
— 8 —
Proceedings from the International Workshop on the Applications of Passive Acoustics to Fisheries

Application of passive acoustics in a wider range of habitats where fish may aggregate to spawn.
For example:
* mangrove areas, which are especially difficult to survey by conventional means, but where thediversity of fishes may be especially high.
* coral reefs and rocky reefs, where again many species aggregate.
* oceanic and inshore banks, where the mass spawning of sound producing species, like cod andhaddock, takes place.
* the deep sea, where many species like the morids and macrourids are suspected to be vocalfrom anatomical evidence.
* estuaries - the primary spawning grounds for many economically important fishes.
Development of local, regional, national and international networks of “listening posts” especially in
estuarine and inshore waters. Incorporation of listening posts into local and regional environmental
data networks like GoMOOS and the NOAA/OCRM/NERR’s System Wide Monitoring Program.
The Benefits of Passive Acoustics
* non-invasive, non-destructive census of marine life.
* works at night without bias (versus video and other techniques that require lights).
* can provide continuous monitoring of fishes.
* provides remote census capabilities.
* determine the daily and seasonal activity patterns of fishes including determination of discretedaily spawning times.
* a better foundation for the management of exploited species by mapping their distributionand pinpointing their spawning grounds.
* a better understanding of the habitat preferences of key fish species (e.g., Essential Fish Habitat“EFH” assessment in the US), giving a better focus for their conservation.
* establishment of baselines for the abundance and distribution of key fish species, allowingexamination of the effects of future environmental change.
* obtaining a wider knowledge of the behavior of those fish that cannot readily be studied byany other method.
* can be used to monitor environmental noise and determine their sources.
* can be used to examine the impact of anthropogenic noise on fish, especially on spawningbehaviors.
— 9 —
Proceedings from the International Workshop on the Applications of Passive Acoustics to Fisheries

* networks of listening posts can provide synoptic data on the occurrence of fishes and spawn-ing activities on local, regional, national and global scales.
Conclusion
Research presented at this workshop underscores the great strides that have been made in the
application of passive acoustics to fisheries and related issues in the last two decades. It is clear
from this body of work, that although passive acoustics is currently largely overlooked as a research
tool, it is a rapidly “up-and-coming” field of research that holds great promise for the future. It is our
hope that publication of this proceeding will stimulate the growth of this field, and will encourage
funding agencies to support passive acoustics research.
Acknowledgements
This workshop and the publication of the proceedings benefited by contributions from many indi-
viduals. Grace Lee set up the web page and did much of the text and graphics layout for the pro-
ceedings. The staff of the Endicott House and Brooks Center provided outstanding conference facil-
ities and support for the workshop. The workshop and publication of the workshop proceedings
received major funding from MIT Sea Grant, the Office of Naval Research, and from the Northeast-
Great Lakes Center of the National Undersea Research Program. Travel for some workshop partici-
pants was funded in-whole, or in-part by: Connecticut Sea Grant, Florida Sea Grant, Hawaii Sea
Grant, Louisiana Sea Grant, North Carolina Sea Grant, the South Carolina Sea Grant Consortium,
Texas Sea Grant, and the Woods Hole Sea Grant Programs.
— 10 —
Proceedings from the International Workshop on the Applications of Passive Acoustics to Fisheries

Locating sciaenid spawning aggregations in anticipation of harbor modifica-
tions, and reactions of spotted sea trout spawners to acoustic disturbance
Mark Collins, Bridget Callahan, Bill Post, and Amanda Avildsen
SC Marine Resources Research Institute, SCDNR, Charleston, SC, USA
Introduction
The estuarine-dependent sciaenids are by far the most recreationally (= economically) important
fishes in the Savannah River (SC/GA, USA) estuary. Regional populations of the primary species have
declined in abundance in recent years amid concerns about reduced spawning stock biomass. Most
southern states have responded by tightening harvest regulations.
Plans for major modifications and deepening of the Savannah Harbor and shipping channel have
generated special concerns about exacerbating sciaenid spawning stock reductions due to: 1) direct
dredging mortality; 2) acoustic disruption of spawning aggregations; or, 3) reducing the acceptabili-
ty to the fish of any presently utilized spawning sites through alterations to the bathymetry, flow
characteristics, etc.
The estuaries of SC, GA, and northern FL differ in a number of ways (e.g., higher tidal amplitudes, no
seagrasses) from those to the north and south, and there are reasons to believe that sciaenid
spawning behavior may also differ. Studies of sciaenid spawning in this central region have been
limited in number, producing for example only three red drum spawning locations: two in SC and
one in GA. No studies have been conducted in the Savannah River. Thus, a passive acoustic survey
was initiated to define the geographic and temporal distribution of spawning aggregations of the
recreationally important sciaenid species, determine site fidelity between years, characterize spawn-
ing habitats, and determine effects of dredging activity on aggregations.
Methods
An acoustic survey was conducted during August- November 2000 and February-November 2001 in
the Savannah River estuary, with some coverage of the shipping channel offshore. A directional
hydrophone, analog receiver, and audio recorder were used to detect and record signals, and specif-
ic locations of spawning sites were determined through triangulation. Signal strength (quantified
on a 1-5 scale), prominent bathymetric/structural characteristics, light phase, tide stage, current
velocity, depth, temperature, salinity, and dissolved oxygen were recorded for each location. Field
activities were conducted on average 3 days/week. Emphasis was on the lower estuary where salini-
— 11 —
Proceedings from the International Workshop on the Applications of Passive Acoustics to Fisheries
ties were >15 ppt, but occasional broader surveys were conducted to ensure that no spawning
activity was occurring farther upriver.
During June 2001, preliminary dredging operations began in one turning basin in the lower harbor,
which had been identified as the location of one of the primary spawning aggregations of spotted
seatrout. The reaction of the spawning aggregation to dredging activity was monitored through
the end of the spawning season.
Results
Recreationally/economically important sciaenids encountered included red drum Sciaenops ocella-
tus, spotted sea trout Cynoscion nebulosus, black drum Pogonias cromis, and weakfish Cynoscion
regalis. Sporadic drumming of all species occurred in various locations of the lower estuary.
However, six primary spawning sites were identified for spotted seatrout, one for weakfish, and one
for black drum. All sites were in salinities > 16 ppt, and all were within 12.2 river km of the river
mouth.
Time of day of spawning varied somewhat among species, but in general it appeared to be
anchored around sunset with peak activity from about 1 hr before through about 3 hr after. This
was especially evident with spotted seatrout, which had the longest spawning season. As day
length shortened and sunset occurred progressively earlier at the end of the summer, spawning
activity began earlier.
Spotted seatrout spawning activity took place during May-September, peaking in July-August.
Water temperature apparently was a seasonal spawning cue, as activity ceased abruptly and did not
resume when there was a 2oC drop to 24oC over a 2-day period (although spawning in lower tem-
peratures has been previously reported). All six sites located in 2000 were again used in 2001, but
activity did not begin at all sites simultaneously. The sites had several characteristics in common:
they were in the main river channel rather than side-creeks, they were in or adjacent to deep water
(7-10 m), and they were associated with structure of some type. Structure varied among sites, but
was generally a large channel marker or a rocky area such as a submerged jetty. Drumming activity
appeared strongest when a high or early ebb tide occurred during the appropriate time of day.
Black drum spawned during late March to mid-June at river km 0 (the river mouth) in water temper-
atures of 14-19oC. Weakfish spawning activity was concentrated just upriver at river km 2 during
June to early October at temperatures of 23.9-29.0oC. Weakfish appeared to be less site-specific
than black drum or spotted seatrout, with the aggregation sometimes moving temporarily upriver
and then returning. Weakfish also tended to aggregate around structure like spotted seatrout,
although more weakly, while black drum aggregated in the middle of the channel where no struc-
ture could be detected.
No large red drum spawning aggregations were located. A number of times, individuals or very
— 12 —
Proceedings from the International Workshop on the Applications of Passive Acoustics to Fisheries

small groups of drumming males were found. This was most consistently at the mouth of the river
and in the shipping channel outside the mouth. All activity noted was during August-September.
The active dredge in the vicinity of a large spotted seatrout aggregation began operations at the
upriver end of the turning basin, the opposite end from the aggregation, and moved slowly down-
river. No changes in drumming intensity or periodicity relative to the dredge were noted. However,
the spawning season ended (as confirmed by checking other known spawning sites) before the
dredge actually reached the fish; it was ~100 m away at that point. Large and small vessels transited
the area but did not disturb the fish. One acoustic disturbance that was dramatically apparent, how-
ever, was a total cessation of drumming when bottlenose dolphin Tursiops truncatus (which make a
pronounced acoustic signal) passed by. This behavior was also noticed on two occasions with red
drum.
Discussion
Passive acoustic mapping of sciaenid spawning sites in preparation for harbor modifications was
successful. It confirmed spawning of important sciaenid species within the harbor area, and it
defined the spawning temporally and spatially. There was considerable temporal overlap in spawn-
ing activity among species, and in the lower 2 river km there appeared to be spatial overlap.
However, on a finer scale (hundreds of meters) there was little or no overlap. It is obvious, however,
that the lower 2 river km can be considered the most important sciaenid spawning area in the
Savannah estuary, as all four species aggregated in that stretch of river. Aggregations of red drum
were very small. Comparing this behavior to previous reports from the region is problematic due to
the limited number of systems that have been studied; the aggregation in Charleston Harbor, SC
was quite large, while the aggregation detected in St. Helena Sound, SC was very small. Thus, it is
not known whether red drum typically form large aggregations in this region, or if in some systems
they generally spawn in small groups.
Despite the apparent importance of acoustic signals in spawning aggregations for these species,
noise from boats, dredges, etc. does not interfere with drumming behavior, even when the source of
the noise is close by. Certainly, these fish must be acclimated to vessel passage due to the fact that
the Savannah River is a major port. It is unknown whether fish in a less populous habitat would be
so impervious to anthropogenic noise. The only response to an acoustic signal was exhibited
toward bottlenose dolphin, which prey on these fishes; the cessation of drumming was apparently a
predator avoidance behavior.
While spotted seatrout males do not respond to dredging noise, it is unknown what effect a dredge
would have as it worked in the midst of the aggregation. Relatively large fishes (e.g., Atlantic stur-
geon Acipenser oxyrinchus) are reported with some regularity having been sucked up by dredges
elsewhere. Further, because two (and possibly three) of these species appear to cue in on struc-
tures, removal of these structures, as commonly occurs during deepening and channelization opera-
tions, may have a negative impact. Future research plans include statistical analyses of environmen-
tal variables as related to drumming activity, and re-examination in 2002 of spotted seatrout spawn-
ing behavior in the turning basin that was dredged in 2001.
— 13 —
Proceedings from the International Workshop on the Applications of Passive Acoustics to Fisheries

Acknowledgments
Hayne von Kolnitz assisted extensively in both field and laboratory. Bruce Stender verified identifi-
cations of larval fishes. Joseph Luczkovich (East Carolina University), Mark Spraque (East Carolina
University), Archibald McCallum (University of Charleston), Grant Gilmore (Dynamac Corp.), and Bill
Roumillat provided invaluable assistance in verifying species identifications from acoustic record-
ings of aggregations. South Carolina Department of Natural Resources, Georgia Ports Authority, and
Southern Liquid Natural Gas provided funding.
— 14 —
Proceedings from the International Workshop on the Applications of Passive Acoustics to Fisheries
Characterization of sounds and their use in two sciaenid species: weakfish and
Atlantic croaker
Martin A. Connaughton1, Michael L. Lunn1, Michael L. Fine2, & Malcolm H. Tayor3
1Washington College, 300 Washington Ave., Chestertown, MD 21620 [email protected],
2Department of Biology, Virginia Commonwealth University, Richmond, VA 23284-2012, USA,
3College of Marine Studies and Department of Biological Sciences, University of Delaware, Newark,
DE 19716, USA, [email protected].
Introduction
Both weakfish Cynoscion regalis and Atlantic croaker Micropogonias undulatus are members of the
family Sciaenidae, a group of fish that have been known to produce sound since the turn of the
20th century. This family of fishes produces sound through the use of highly specialized, extrinsic
sonic muscles which lie in close proximity, but are not attached to, the swimbladder (Tower 1908,
Tavolga 1964). In weakfish and most sciaenids, sonic muscles are found only in the male; however, in
others, including Atlantic croaker, the muscles are found in both males and females (Tower 1908,
Fish and Mowbray 1970). Sound production has been linked to reproductive behavior in a number
of sciaenid species (Fish and Cummings 1972, Guest and lasswell 1978, Mok and Gilmore 1983,
Saucier and Baltz 1993) and with fright or warning behaviors in a few species, including Atlantic
croaker (Fish and Mowbray 1970). The purpose of this paper is to characterize the sounds produced
by two species of sciaenid and to discuss the roles of these sounds in the behaviors of these species.
Methods and Results
Weakfish experiments
Field recordings: Field recordings using a hydrophone (Edmund Scientific) were made near the
mouth of the Delaware Bay at three stations along an inshore-offshore transect ranging from 1.24
to 5.64km from shore and varying in depth from 3.5 to 7.8m. One-minute recordings were made at
hourly intervals over a 24hr period on eight dates from mid-April through mid-August, encompass-
ing the late spring-early summer spawning season. Recordings of drumming sounds were ranked
qualitatively from 0 - 4, with 0 representing no calls and 4 representing continuous calling by a cho-
rus of individuals (Connaughton and Taylor 1995).
— 15 —
Proceedings from the International Workshop on the Applications of Passive Acoustics to Fisheries
Drumming was highly seasonal, increasing dramatically from zero in mid-April to nearly maximal
levels in early May. Activity remained at near maximal levels throughout May and June, and
decreased gradually in intensity through July and into August. Physiological indicators of reproduc-
tive readiness, including plasma androgen levels, male GSI, and the presence of hydrated eggs were
all high during the period of maximal drumming activity. Drumming activity also expressed diel
trends, reaching maximal levels between 20:00 and 24:00hr (sunset was between 19:50 - 20:40) and
declining to a minimum between 05:30 and 10:30hr. Drumming activity, whether seasonal or diel,
was most intense inshore, declining in intensity as one moved offshore (Connaughton and Taylor,
1995). The seasonality, evening timing, and inshore location of sound production all coincide with
the known reproductive activity of weakfish in this area (Villoso 1989, Taylor and Villoso 1994).
Captive spawning recordings: Captive weakfish held in a 1500L tank were induced to spawn with
two injections of 1000 IU hCG/kg body weight administered in the early afternoon on two succes-
sive days. Fish spawned during the evening of the second day of injections. Spawning activity was
documented on standard VHS tape with video (Ikegami CCD camera, ICD 4224) and audio (Edmund
Scientific) input (Connaughton and Taylor 1996). Field and captive sounds, staccato bursts of 6-10
individual pulses, were identical (Connaughton and Taylor 1996). It was also determined that domi-
nant frequency and repetition rate vary with temperature and fish size (Connaughton et al. 2000).
During courtship, only pair spawning was observed, though larger groups in larger enclosures
might behave differently. Drumming activity was most often initiated after the first spawning event,
but based on the timing of sound production and spawning in the field (Taylor and Villoso 1994,
Connaughton and Taylor 1995) this observation may be due to a tank effect. The number of drum-
ming bursts per minute varied somewhat between males, but remained relatively constant for a
given male for the duration of the evening’s sonic activity, i.e. number of bursts per minute did not
drop off as time passed after a spawning event. Sound production ceased prior to gamete release,
which was apparently synchronized by body contact.
Croaker experiments
Captive spawning recordings: As above, field caught Atlantic croaker were maintained in laboratory
tanks and induced to spawn following hormone injections, and video/audio recordings (B&W CCD
camera, OS-40D, World Precision Instruments; model C21 hydrophone, Cetacean Research
Technology) were made. To date, only a single successful trial, involving one male and two females,
has been conducted. The courtship behavior of the croaker was similar to that exhibited by the
weakfish: drumming began after the first spawning event, was maintained for several hours there-
after, and ceased just prior to gamete release.
Only the male produced courtship sounds, bursts of 1-3 pulses, with a mode of two pulses.
Dominant frequency for the single recorded male (33cm total length) was 300Hz and the repetition
rate of pulses within a burst was 5.4Hz. Courtship sounds were lower in frequency and repetition
rate than fright response sounds (see below). In addition, the number of drumming bursts per
— 16 —
Proceedings from the International Workshop on the Applications of Passive Acoustics to Fisheries
minute decreased steadily following each spawning event, a behavioral characteristic not shared
with weakfish (Fig. 1).
Fright response recordings: Fright response recordings were made in a rectangular 1250L tank.
Sound production was elicited by casting a shadow over the surface of the holding tank, or moving
a dip net through the water. Thirteen fish, ranging in total length from 22.5 to 30cm were recorded,
and both male and female croaker called readily. The number of pulses per burst for fright response
calls varied more widely that in courtship calls, ranging from 1-9, though the mode was still two. In
contrast, the repetition rate of pulses within a burst was greater in fright response calls, ranging
from 7.87 to 33.56 pulses/sec and expressing a mean of 18.09. Repetition rate was more variable in
shorter bursts (2 or 3 pulses per burst) than in longer bursts (Fig. 2). Even given that dominant fre-
quency appears to vary with fish size (650 to 540Hz for 22.5 to 29cm total length fish), courtship
sounds appear to have a lower dominant frequency (approximately 100Hz lower for a 33cm fish)
(Fig. 3).
Discussion
Sound production in weakfish and croaker may be involved in the formation of spawning aggrega-
tions and/or attracting a mate, though because of the small tank size, this could not be determined
in our laboratory experiments (Connaughton and Taylor 1996). It may also play a role in female
mate selection, since larger individuals of each species produce a sound with a lower dominant fre-
quency (Connaughton et al. 2000). Though weakfish will produce sounds if drawn to the surface
when caught hook and line, or when removed from a tank into the air, we have never recorded a
fright response call from weakfish like those so easily elicited from Atlantic croaker. In-air ‘distur-
bance’ calls elicited from weakfish when they are removed from the water were identical to
courtship calls except for having a wider range of pulses in each burst of sound (Connaughton et al.
2000). In contrast, our data suggest that fright response and courtship calls in croaker may be quite
distinct in dominant frequency and repetition rate, though more data needs to be collected.
Acknowledgements
This work was supported by the Wallop-Breaux Sport Fishing Act with funds administered through
the Delaware Department of Natural Resources and Environmental Control and by in-house funding
provided by Washington College.
Literature Cited
Connaughton, M. A. and Taylor, M. H. (1995). Seasonal and daily cycles in sound production associat-
ed with spawning in the weakfish, Cynoscion regalis. Env. Biol. Fish. 42, 233-240.
— 17 —
Proceedings from the International Workshop on the Applications of Passive Acoustics to Fisheries
Connaughton, M. A. and Taylor, M. H. (1996). Drumming, courtship, and spawning behavior in captive
weakfish, Cynoscion regalis. Copeia 1996, 195-199.
Connaughton, M. A., Taylor, M. H. and Fine, M. L. (2000). Effects of fish size and temperature on weak-
fish disturbance calls: implications for the mechanism of sound generation. J. Exp. Biol. 203, 1503-
1512.
Fish, J. F. and Cummings, W. C. (1972). A 50-dB increase in sustained ambient noise from fish
(Cynoscion xanthulus). J. Acoust. Soc. Am. 52, 1266-1270.
Fish, M. P. and Mowbray, W. H. (1970). Sounds of western North Atlantic fishes. Baltimore: The Johns
Hopkins Press.
Guest, W. C. and Lasswell, J. L. (1978). A note on courtship behavior and sound production of red
drum. Copeia 1978, 337-338.
Mok, H. K. and Gilmore, R. G. (1983). Analysis of sound production in estuarine aggregations of
Pogonias cromis, Bairdiella chrysoura, and Cynoscion nebulosus (Sciaenidae). Bulletin of the Institute
of Zoology, Academia Sinica 22, 157-186.
Saucier, M. H. and Baltz, D. M. (1993). Spawning site selection by spotted seatrout, Cynoscion nebulo-
sus, and black drum, Pogonias cromis, in Louisiana. Env. Biol. Fish. 36, 257-272.
Tavolga, W. N. (1964). Sonic characteristics and mechanisms in marine fishes. In Marine bio-acoustics,
vol. 1 (ed. W. N. Tavolga), pp. 195-211. New York: Pergamon Press.
Taylor, M. H. and Villoso, E. P. (1994). Daily ovarian and spawning cycles in weakfish. Trans. Am. Fish.
Soc. 123, 9-14.
Tower, R. W. (1908). The production of sound in the drumfishes, the sea-robin and the toadfish. Ann.
N.Y. Acad. Sci. 18, 149-180.
Villoso, E. P. (1989). Reproductive biology and environmental control of spawning cycle of weakfish,
Cynoscion regalis (Bloch and Schneider) in Delaware Bay: University of Delaware, Newark, Delaware.
— 18 —
Proceedings from the International Workshop on the Applications of Passive Acoustics to Fisheries

— 19 —
Proceedings from the International Workshop on the Applications of Passive Acoustics to Fisheries
Illustrations and Diagrams
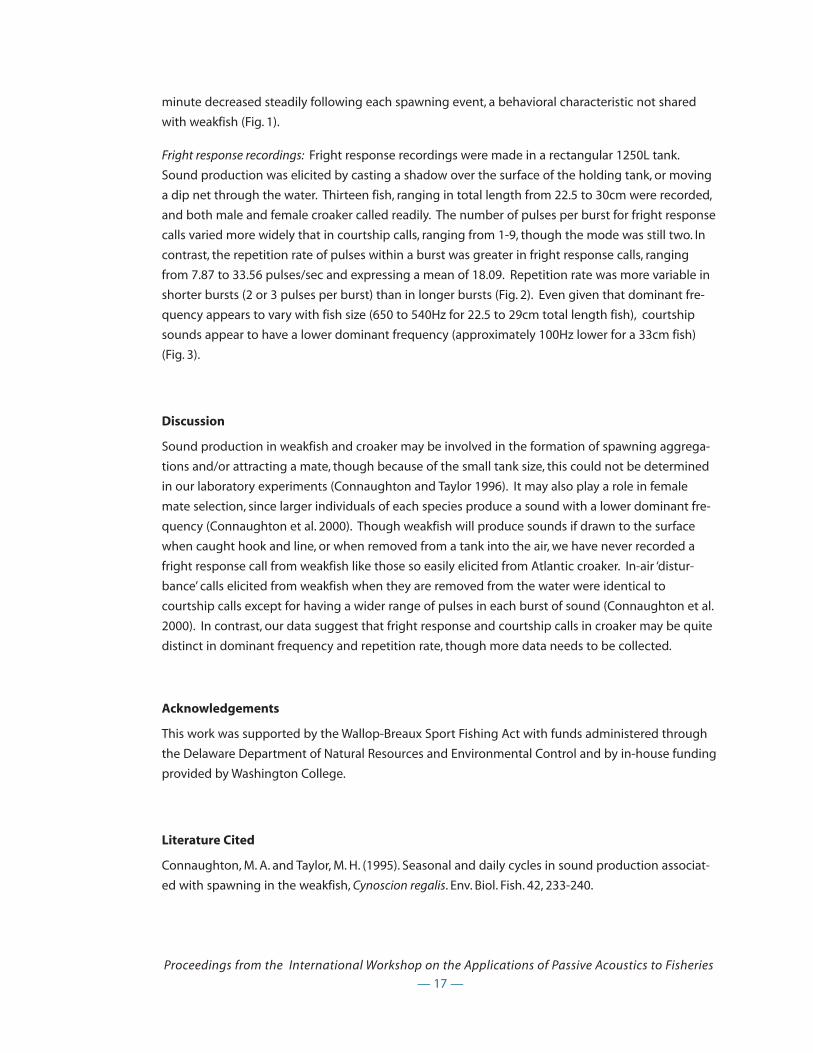
Figure 3. Dominant frequency of individual sound pulses plotted across specimen total length from sounds pro-duced by male and female croaker (N=13) during fright response behaviors. The shaded block represents the domi-nant frequency of calls made by the single male (33 cm) during courtship sound production.
0
5
1 0
1 5
2 0
- 5 0 0 5 0 1 0 0 1 5 0 2 0 0 2 5 0
Nu
mb
er
of
call
s m
inu
te-
1
Time from first spawning (min)
0
1 0
2 0
3 0
4 0
0 1 2 3 4 5 6 7 8 9 1 0
Rep
etit
ion
ra
te
(pu
lses
se
c-
1)
Number of pulses per call
Figure 1. Croaker courtship sound production expressed as number of calls min-1 across time. Values were deter-mined for one minute out of every five recorded over the course of the evening. The solid vertical line represents thefirst spawning event (9:29PM) and the double vertical line, the second (10:29PM).
Figure 2. Repetition rate plotted across number of pulses per call from sounds produced by male and female croaker(N=13) during fright response behaviors. The shaded block represents the repetition rate and number of pulsesobserved during courtship sound production.
— 20 —
Proceedings from the International Workshop on the Applications of Passive Acoustics to Fisheries
Detection and characterization of yellowfin and bluefin tuna using passive
acoustical techniques
Scott Allen1 and David A. Demer2
1Scripps Institution of Oceanography ([email protected])
2NOAA/NMFS/SWFSC/Fisheries Resources Division, 8604 La Jolla Shores Drive, La Jolla, CA 92037
Introduction
Underwater sounds generated by Thunnus albacares and Thunnus thynnus were recorded and stud-
ied to explore the possibility of passive-acoustical detection. Tuna vocalizations were recorded at
the Monterey Bay Aquarium, Monterey, California, and Maricultura del Norte in Ensensada, Baja
California, Mexico. At both locations, the most prevalent sounds associated with tuna were low-fre-
quency pulses varying from 20 to 130 Hz, lasting about 0.1 seconds, and usually single and unan-
swered (Fig. 1). A behavior similar to coughing was coincident with these sounds: the animal’s
mouth opened wide with its jaw bones extended and its abdomen expanded, then contracted
abruptly. On one occasion in Mexico, this behavior and associated noise were simultaneously
recorded (Fig. 2). The center frequencies of these vocalizations may vary as the resonant frequencies
of the tuna’s swim bladder, suggesting a passive-acoustical proxy for measuring the size of tuna.
Matched-filter and phase-difference techniques were explored as means for automating the detec-
tion and bearing-estimation processes.
Conclusion
This study shows that adult bluefin and yellowfin tuna, like many other fish, are capable of generat-
ing sound. The acoustical signals are short (~0.1 s), narrow-bandwidth pulses of low frequency (20-
130 Hz) and amplitude (~105 dB re 1 _Pa @ 1m).
Observations of these fish suggest that a coughing or yawning behavior causes muscular contrac-
tion about the swim bladder and an associated short-duration sound pulse of narrow-bandwidth
and low-frequency and intensity. If the recorded sounds are generated by swim bladder resonance,
then the size of the swim bladder determines the center frequency of the sound pulse. It is
unknown whether the tuna vocalizations are generated as a by-product of some biological function
such as clearing the gills, or an intentional form of communication.

Acknowledgements
We are thankful to Dr. Rennie Holt, Director of the United States Antarctic Marine Living Resources
Program and Dr. John Hunter, Head of the Fisheries Resources Division, SWFSC, for providing the lab-
oratory and equipment resources necessary to complete this study. We would also like to thank Dr.
Kenneth Baldwin of the University of New Hampshire Center for Ocean Engineering for allowing S.
Allen to conduct his Master’s Thesis research at SWFSC. Thanks also to Mr. Ted Dunn, founder of
Maricultura Del Norte of Ensenada, Mexico for graciously supporting this effort with access to his
fish pens. Thanks finally to Dr. Charles Farwell, the manager of pelagic displays at the Monterey Bay
Aquarium in Monterey, California.
— 21 —
Proceedings from the International Workshop on the Applications of Passive Acoustics to Fisheries

— 22 —
Proceedings from the International Workshop on the Applications of Passive Acoustics to Fisheries
Illustrations and Diagrams
Figure 1. Bluefin vocalization recorded at Maricultura del Norte, 18 November 2000 using two hydrophones (a) andtheir power spectral densities (b). Signals were low-pass filtered (Order 4 Butterworth, fc=600 Hz). Estimated soundpressure level is 105 dB re 1 mP.
Figure 2. A bluefin tuna vocalizing at Mariculturadel Norte Ensenada. During the vocalization, theanimal’s mouth opened wide with its jaw bonesextended and its abdomen expanded, then con-tracted abruptly

Acoustic Competition in the Gulf Toadfish Opsanus beta: Crepuscular Changes
and Acoustic Tagging
Michael L. Fine1 and Robert F. Thorson2
1Department of Biology, Virginia Commonwealth University, Richmond, VA 23284-20122Present address: 133 Mockingbird Rd., Tavernier, FL 33070
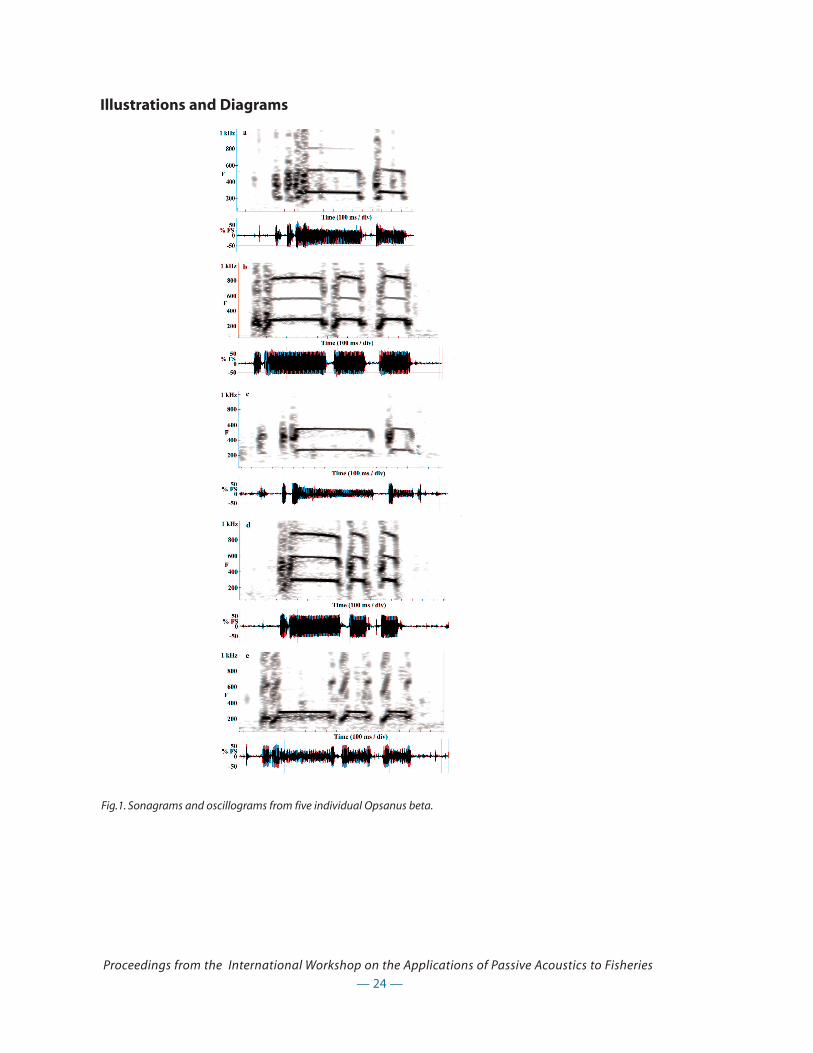
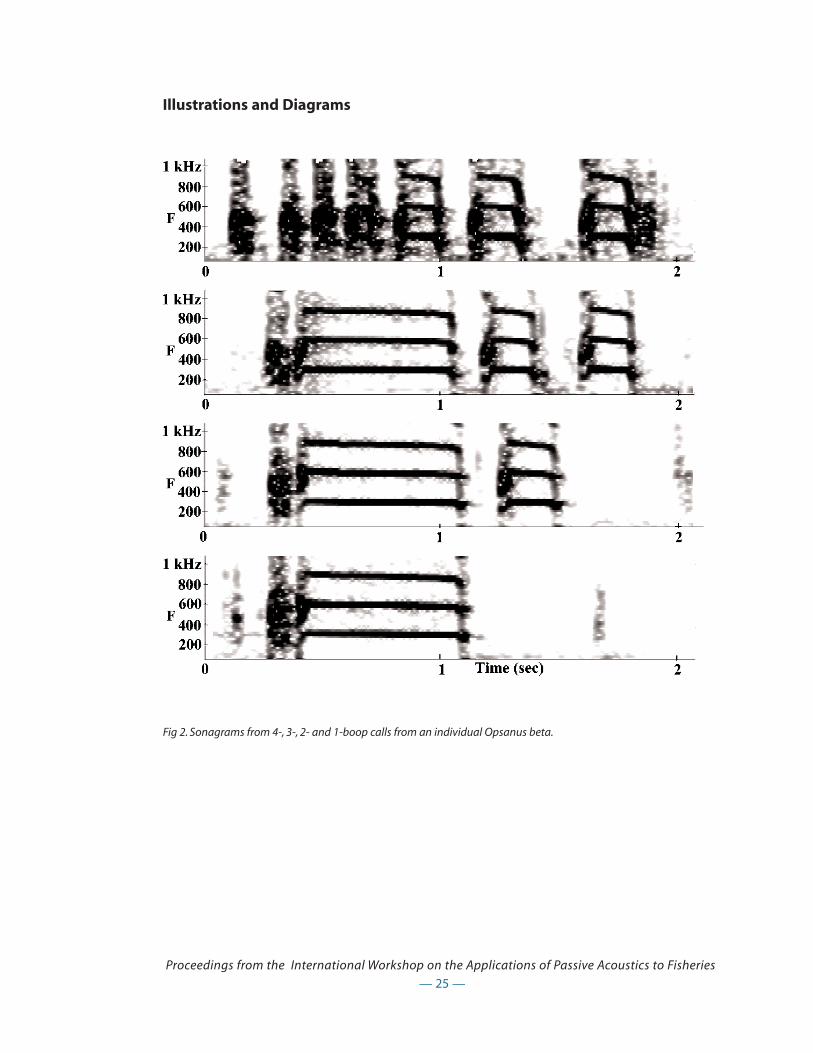
We quantified crepuscular variation in the emission rate and call properties of the boatwhistle
advertisement call of Gulf toadfish Opsanus beta from a field recording of a natural population of
nesting males in the Florida Keys. Their calls are more variable and complex than previously report-
ed (Fig. 1). A call typically starts with a grunt followed by one to five tonal boop notes (typically two
or three) and lasts for over a second. The first boop is considerably longer than later ones, and inter-
vals between boops are relatively constant until the final interval, which approximately doubles in
duration. Positions of fish are fixed for long periods, and calls are sufficiently variable that we could
discern individual callers in field recordings (Fig. 1). Calling rate increases after sunset when males
tend to produce shorter calls with fewer notes (Fig. 2). Analysis by number of notes per call indi-
cates some individuals decrease the number of initial grunts and the duration of the first note, but
most of the decrease results from fewer notes. To our knowledge this sort of call plasticity has not
been demonstrated before in fishes. We suggest that call shortening lowers the chances of overlap-
ping calls of other males and that the small amount of time actually spent producing sound (total
on time) is an adaptation to prevent fatigue in sonic muscles adapted for speed but not endurance.
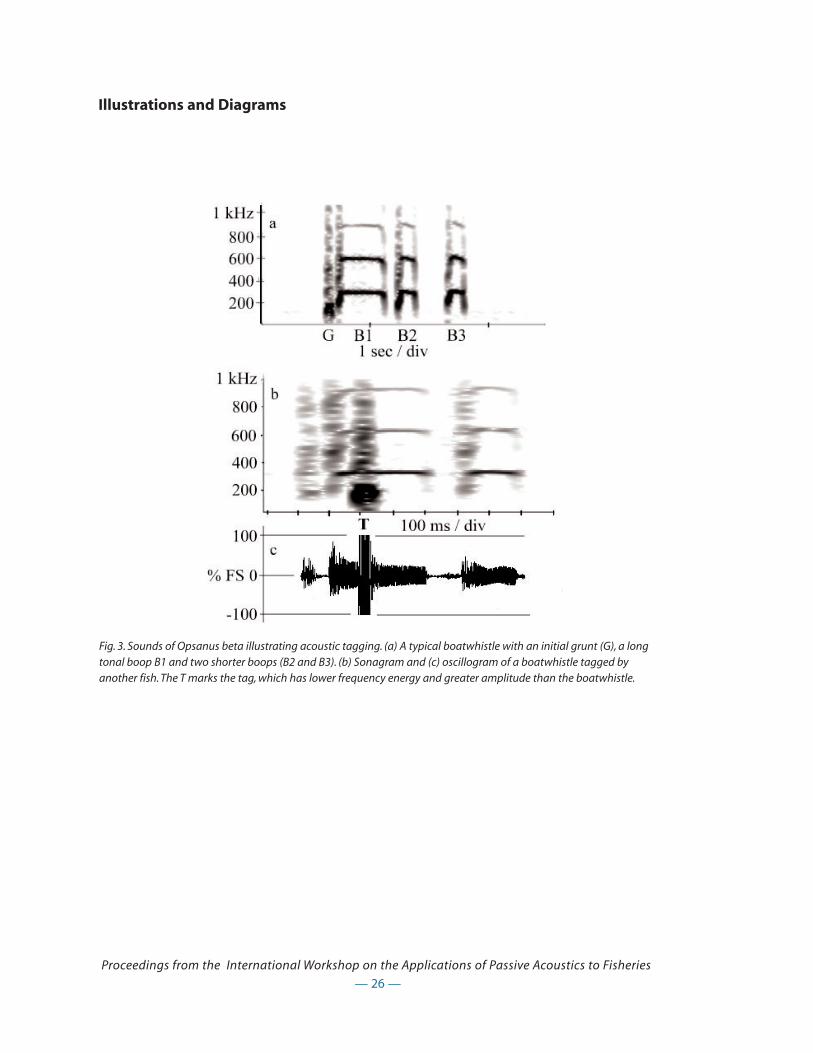
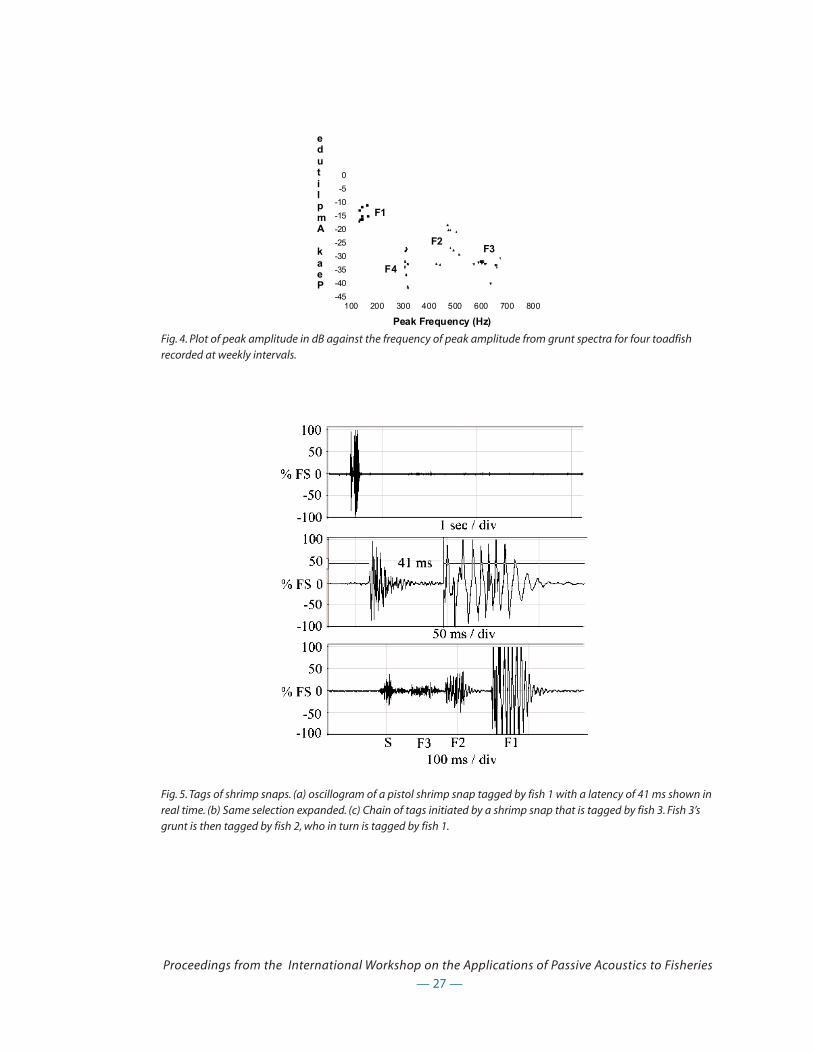
Anomalous boatwhistles contain a short duration grunt embedded in the tonal portion of the boop
or between an introductory grunt and the boop (Fig. 3b, c). Embedded grunts have sound pressure
levels and frequency spectra that correspond with those of recognized neighbors, i.e. we are able to
identify individuals based on frequency spectrum of their grunts (Fig. 4). We therefore suggest that
one fish is grunting during another’s call, a phenomenon here termed acoustic tagging. Snaps of
nearby pistol shrimp may also be tagged, and chains of tags involving more than two fish occur (Fig.
5). The stimulus to tag is a relatively intense sound with a rapid rise time, and tags are generally pro-
duced within 100 ms of a trigger stimulus. Time between the trigger and the tag decreases with
increased trigger amplitude. Tagging is distinct from increased calling in response to natural calls or
stimulatory playbacks since calls rarely overlap other calls or playbacks. Tagging is not generally
reciprocal between fish suggesting parallels to dominance displays.
— 23 —
Proceedings from the International Workshop on the Applications of Passive Acoustics to Fisheries
— 24 —
Proceedings from the International Workshop on the Applications of Passive Acoustics to Fisheries
Illustrations and Diagrams
Fig.1. Sonagrams and oscillograms from five individual Opsanus beta.
— 25 —
Proceedings from the International Workshop on the Applications of Passive Acoustics to Fisheries
Illustrations and Diagrams
Fig 2. Sonagrams from 4-, 3-, 2- and 1-boop calls from an individual Opsanus beta.
— 26 —
Proceedings from the International Workshop on the Applications of Passive Acoustics to Fisheries
Illustrations and Diagrams
Fig. 3. Sounds of Opsanus beta illustrating acoustic tagging. (a) A typical boatwhistle with an initial grunt (G), a longtonal boop B1 and two shorter boops (B2 and B3). (b) Sonagram and (c) oscillogram of a boatwhistle tagged byanother fish. The T marks the tag, which has lower frequency energy and greater amplitude than the boatwhistle.
— 27 —
Proceedings from the International Workshop on the Applications of Passive Acoustics to Fisheries
100 200 300 400 500 600 700 800-45
-40
-35
-30
-25
-20
-15
-10
-5
0
F1
F2F3
F4
Peak Frequency (Hz)
Peak Amplitude
Fig. 4. Plot of peak amplitude in dB against the frequency of peak amplitude from grunt spectra for four toadfishrecorded at weekly intervals.
Fig. 5. Tags of shrimp snaps. (a) oscillogram of a pistol shrimp snap tagged by fish 1 with a latency of 41 ms shown inreal time. (b) Same selection expanded. (c) Chain of tags initiated by a shrimp snap that is tagged by fish 3. Fish 3’sgrunt is then tagged by fish 2, who in turn is tagged by fish 1.

Passive Acoustic Field Research on Atlantic Cod, Gadus morhua L. in Canada
Susan B. Fudge1 and George A. Rose2
1Fisheries Conservation Chair, Fisheries and Marine Institute, Memorial University of Newfoundland,
155 Ridge Road, PO Box 4920, St. John’s, NF Canada, A1C 5R3
2Senior Chair of Fisheries Conservation, Fisheries and Marine Institute, Memorial University of
Newfoundland, 155 Ridge Road, PO Box 4920, St. John’s, NF Canada, A1C 5R3
Introduction
The Atlantic cod is a very important commercial fish in Newfoundland and Atlantic Canada and has
been a part of the culture for centuries. In the past ten years, cod stocks have been drastically
depleted. In Newfoundland waters, cod is found from the coast to the continental shelf in water
temperatures ranging from approximately -0.5 0C to 8.5 0C. They are broadcast spawners and typical-
ly spawn in large aggregations (Robichaud, 2002). The spawning season typically occurs in the
spring but varies by area and is influenced by environmental factors, such as temperature (Scott and
Scott, 1988). Spawning begins in the north as early as February and ends in the south as late as
December. The depth at which spawning occurs varies among stocks; some may spawn in water as
shallow as 20m, while others at depths over 300m (Rose, 1993). Differences in spawning behaviours
among sub-stocks and among ages and sexes have been reported (Robichaud, 2002). Laboratory
studies have shown that cod have elaborate courtship behaviours with males being very territorial
and more aggressive males having the most success at spawning. Cod are also known to detect and
produce sound and this observation has long been recognized by lab experiments (e.g. Brawn,
1961). This study is the first attempt in Canada to document the sounds made during spawning and
to relate them to spawning behaviour in order to link active and passive acoustic research in behav-
ioural field studies.
Previous and future research on Atlantic cod behaviour
Two of the largest spawning components of Atlantic cod in Newfoundland waters have been stud-
ied using active acoustics for several years. These include Placentia Bay, located on the south coast
of Newfoundland (NAFO regulatory area 3Ps), and Trinity Bay, located on the north east coast (NAFO
regulatory area 3L). Annual acoustic surveys using SIMRAD EK 500 echo sounders, along with the
analyses of the data using FASIT (Fisheries Assessment and Species Identification Tool) (Lefeuvre et
— 28 —
Proceedings from the International Workshop on the Applications of Passive Acoustics to Fisheries

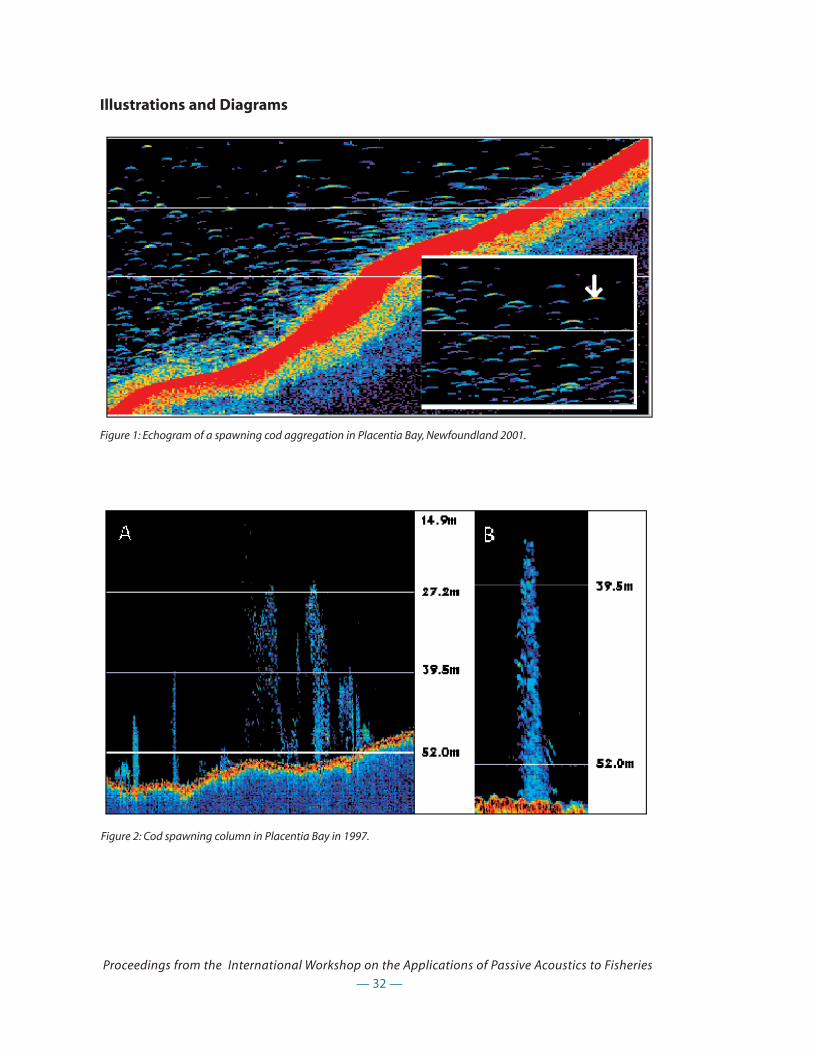
al., 2000) have provided insights into stock migrations and spawning behaviours. The echogram in
Figure 1 is from April 2000 in Placentia Bay, Newfoundland, showing some of the pelagic behaviour
easily observed using an echo sounder. Cod in this area have a peak spawning period between April
and June. This spawning aggregation was found in a trench, over 300m deep. The image in the bot-
tom corner is an enlargement of the echogram where single cod targets (white arrow) are resolved.
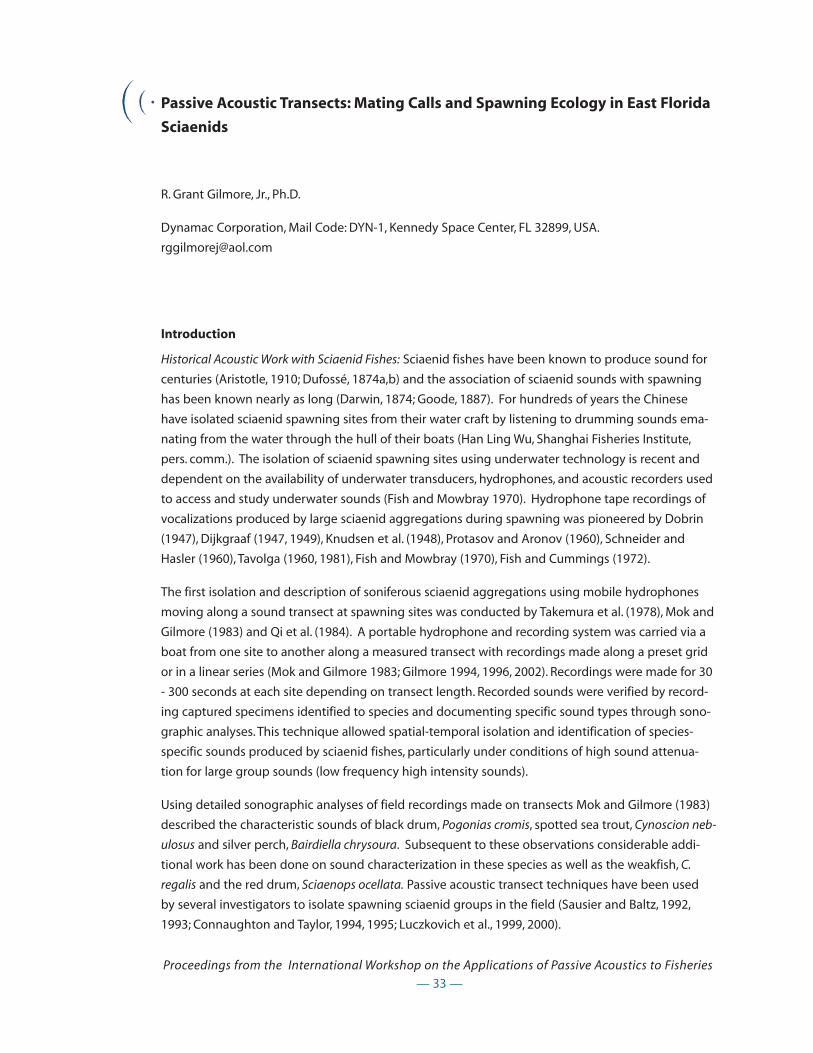
The use of active acoustics has lead to observations of different spawning aggregation structures.
Figure 2 is an echogram of spawning columns observed in shallow waters of Placentia Bay in 1997
at a depth of approximately 50m (Rose, 1993). In section A, several columns are shown. Section B is
an enlargement of one of these columns, which extends approximately 20m off the ocean floor.
Throughout their range, cod occur in distinct stocks as well as sub-stocks, and spawning behaviour
within specific sub-stocks is of interest. Sonar tagging studies have been conducted to investigate
the homing ability of Atlantic cod to specific spawning grounds. Long-term sonar transmitting tags
(Lotek CAFT16_3 Acoustic Transmitters) were implanted in female and male cod at a spawning
ground in Placentia Bay, Newfoundland in April 1998. Homing of cod back to the spawning ground
from which they were taken was observed. Approximately 50% of the tagged cod returned to the
same spawning ground (capture site) in subsequent years and 25% of the tagged cod returned 3
years in a row (Robichaud and Rose, 2001). This study provides some of the first direct evidence that
cod undertaking long-distance feeding migrations may home to a specific spawning location in
consecutive years. Present tagging work that has begun this year also will involve the identification
of distinct spawning populations using acoustic surveys; cod have been released within their
“home” populations as well as within other groups. Results of this study hope to provide valuable
insight into the Atlantic cod’s homing properties.
Using active acoustics in surveys and sonar tagging studies, we have learned a great deal about cod
spawning aggregations and migratory behaviour. As spawning is the first step towards recruitment
and rebuilding cod stocks, there is a continuing interest in the specific behaviour of spawning.
Brawn (1961) documented many interesting features of cod spawning behaviour. Cod are known to
have specific social behaviours related to spawning. Brawn (1961) observed distinct courtship
behaviours performed by males toward females, as well as aggressive behaviour of males toward
males. Both sexes in cod have been observed to produce sound, although it is the males whose
sound production is thought to play an important role in spawning, such as attracting females and
holding territories (Brawn, 1961). In cod, the drumming muscles surrounding the swim bladder are
thought to be related to sound production.
Present field studies will observe the acoustic properties of spawning aggregations over two
spawning seasons. These studies are interested in both the production and reception of sound by
cod, its role in spawning behaviour, and also the influence of ambient noise in the ocean environ-
ment on these behaviours. We have chosen two main research areas, which have been studied for
the past number of years using active acoustics and sonar tracking. Placentia Bay and Trinity Bay
both have relatively large coastal spawning populations. However, Placentia Bay is becoming
increasingly industrialized while Trinity Bay is not. With use of a small vessel specially equipped for
— 29 —
Proceedings from the International Workshop on the Applications of Passive Acoustics to Fisheries
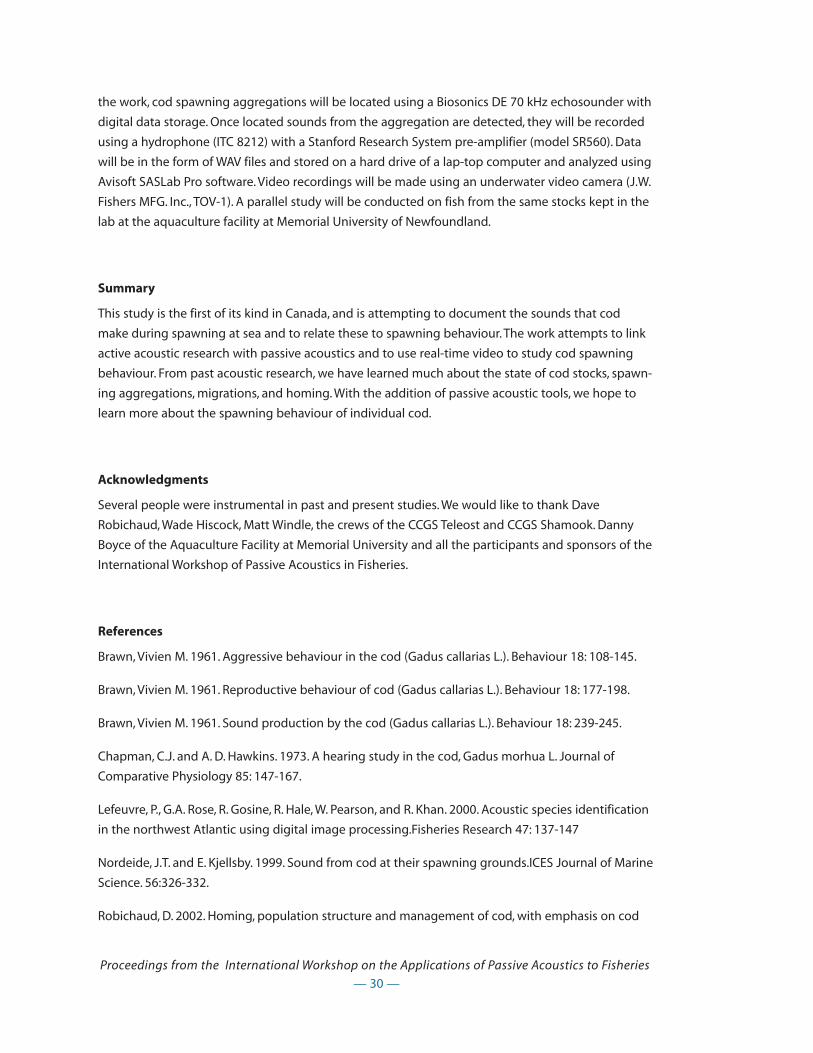
the work, cod spawning aggregations will be located using a Biosonics DE 70 kHz echosounder with
digital data storage. Once located sounds from the aggregation are detected, they will be recorded
using a hydrophone (ITC 8212) with a Stanford Research System pre-amplifier (model SR560). Data
will be in the form of WAV files and stored on a hard drive of a lap-top computer and analyzed using
Avisoft SASLab Pro software. Video recordings will be made using an underwater video camera (J.W.
Fishers MFG. Inc., TOV-1). A parallel study will be conducted on fish from the same stocks kept in the
lab at the aquaculture facility at Memorial University of Newfoundland.
Summary
This study is the first of its kind in Canada, and is attempting to document the sounds that cod
make during spawning at sea and to relate these to spawning behaviour. The work attempts to link
active acoustic research with passive acoustics and to use real-time video to study cod spawning
behaviour. From past acoustic research, we have learned much about the state of cod stocks, spawn-
ing aggregations, migrations, and homing. With the addition of passive acoustic tools, we hope to
learn more about the spawning behaviour of individual cod.
Acknowledgments
Several people were instrumental in past and present studies. We would like to thank Dave
Robichaud, Wade Hiscock, Matt Windle, the crews of the CCGS Teleost and CCGS Shamook. Danny
Boyce of the Aquaculture Facility at Memorial University and all the participants and sponsors of the
International Workshop of Passive Acoustics in Fisheries.
References
Brawn, Vivien M. 1961. Aggressive behaviour in the cod (Gadus callarias L.). Behaviour 18: 108-145.
Brawn, Vivien M. 1961. Reproductive behaviour of cod (Gadus callarias L.). Behaviour 18: 177-198.
Brawn, Vivien M. 1961. Sound production by the cod (Gadus callarias L.). Behaviour 18: 239-245.
Chapman, C.J. and A. D. Hawkins. 1973. A hearing study in the cod, Gadus morhua L. Journal of
Comparative Physiology 85: 147-167.
Lefeuvre, P., G.A. Rose, R. Gosine, R. Hale, W. Pearson, and R. Khan. 2000. Acoustic species identification
in the northwest Atlantic using digital image processing.Fisheries Research 47: 137-147
Nordeide, J.T. and E. Kjellsby. 1999. Sound from cod at their spawning grounds.ICES Journal of Marine
Science. 56:326-332.
Robichaud, D. 2002. Homing, population structure and management of cod, with emphasis on cod
— 30 —
Proceedings from the International Workshop on the Applications of Passive Acoustics to Fisheries

spawning at Bar Haven in Placentia Bay, Newfoundland. Ph. D. thesis. Biology Department, Memorial
University of Newfoundland.
Rose, G.A. 1993. Cod spawning on a migration highway in the north-west Atlantic. Nature 366: 458-
461.
Scott W.B., and M.G. Scott. 1988. Atlantic Fishes of Canada. University of Toronto Press, Toronto.
— 31 —
Proceedings from the International Workshop on the Applications of Passive Acoustics to Fisheries
— 32 —
Proceedings from the International Workshop on the Applications of Passive Acoustics to Fisheries
Illustrations and Diagrams
Figure 1: Echogram of a spawning cod aggregation in Placentia Bay, Newfoundland 2001.
Figure 2: Cod spawning column in Placentia Bay in 1997.
Passive Acoustic Transects: Mating Calls and Spawning Ecology in East Florida
Sciaenids
R. Grant Gilmore, Jr., Ph.D.
Dynamac Corporation, Mail Code: DYN-1, Kennedy Space Center, FL 32899, USA.
Introduction
Historical Acoustic Work with Sciaenid Fishes: Sciaenid fishes have been known to produce sound for
centuries (Aristotle, 1910; Dufossé, 1874a,b) and the association of sciaenid sounds with spawning
has been known nearly as long (Darwin, 1874; Goode, 1887). For hundreds of years the Chinese
have isolated sciaenid spawning sites from their water craft by listening to drumming sounds ema-
nating from the water through the hull of their boats (Han Ling Wu, Shanghai Fisheries Institute,
pers. comm.). The isolation of sciaenid spawning sites using underwater technology is recent and
dependent on the availability of underwater transducers, hydrophones, and acoustic recorders used
to access and study underwater sounds (Fish and Mowbray 1970). Hydrophone tape recordings of
vocalizations produced by large sciaenid aggregations during spawning was pioneered by Dobrin
(1947), Dijkgraaf (1947, 1949), Knudsen et al. (1948), Protasov and Aronov (1960), Schneider and
Hasler (1960), Tavolga (1960, 1981), Fish and Mowbray (1970), Fish and Cummings (1972).
The first isolation and description of soniferous sciaenid aggregations using mobile hydrophones
moving along a sound transect at spawning sites was conducted by Takemura et al. (1978), Mok and
Gilmore (1983) and Qi et al. (1984). A portable hydrophone and recording system was carried via a
boat from one site to another along a measured transect with recordings made along a preset grid
or in a linear series (Mok and Gilmore 1983; Gilmore 1994, 1996, 2002). Recordings were made for 30
- 300 seconds at each site depending on transect length. Recorded sounds were verified by record-
ing captured specimens identified to species and documenting specific sound types through sono-
graphic analyses. This technique allowed spatial-temporal isolation and identification of species-
specific sounds produced by sciaenid fishes, particularly under conditions of high sound attenua-
tion for large group sounds (low frequency high intensity sounds).
Using detailed sonographic analyses of field recordings made on transects Mok and Gilmore (1983)
described the characteristic sounds of black drum, Pogonias cromis, spotted sea trout, Cynoscion neb-
ulosus and silver perch, Bairdiella chrysoura. Subsequent to these observations considerable addi-
tional work has been done on sound characterization in these species as well as the weakfish, C.
regalis and the red drum, Sciaenops ocellata. Passive acoustic transect techniques have been used
by several investigators to isolate spawning sciaenid groups in the field (Sausier and Baltz, 1992,
1993; Connaughton and Taylor, 1994, 1995; Luczkovich et al., 1999, 2000).
— 33 —
Proceedings from the International Workshop on the Applications of Passive Acoustics to Fisheries

Recent East Florida research 1990-2002: Over the past twelve years the value of passive acoustic stud-
ies in determining spatial and temporal spawning activity in sciaenids has increased. East central
Florida studies have been supported by the Florida Fish and Wildlife Conservation Commission, U.S.
Geological Survey, National Aeronautics and Space Administration, Canaveral National Seashore and
NOAA/National Marine Fisheries Service. The major objectives of these studies have been to devel-
op new techniques and technologies to allow real time continuous monitoring of soniferous aquat-
ic organisms. This included a prototype neural network to identify species specific sounds (Lin
1996), and remotely deployed underwater computer systems (HBOI ALMS; NASA PAMS) with
hydrophones and physical sensors for environmental parameters to allow association of physical
oceanography with acoustic activity.
Future acoustic research at the Kennedy Space Center: The long term objectives of this work at the
Kennedy Space Center is to develop an acoustic and sensor array that will allow continuous moni-
toring of biotic acoustic activity in association with intra and interspecific interactions as well as cli-
matic and oceanographic phenomena. An experimental acoustic arena is being developed in the
marine protected areas within the secure zone of the NASA and U.S. Air Force launch complex at
Cape Canaveral.
Function of Sound Production in Sciaenids
The most predictable and robust sounds produced by many fishes are those associated with repro-
duction. As in many soniferous animals, it is the male that must attract a mate and induce her to
donate eggs for fertilization, and, therefore, it is often only the male that produces sound. Large
choral aggregations of male sciaenid species are formed by spotted seatrout, weakfish, red drum
and silver perch specifically to attract females with which to spawn. Since these male choral aggre-
gations contribute no significant resources required by females except the males themselves (no
male paternal care, no food, or nest sites) they are appropriately called seatrout “leks”, such as those
formed by aggregative birds and amphibians strictly for the purpose of reproduction (Höglund and
Alatalo 1995). A lek is an arena to which females come and on which most of the mating occurs. An
arena is a site on which several males aggregate but does not form the habitat normally used by the
species for other activities such as feeding. Sciaenid leks are seasonal and are associated with a wide
variety of environmental parameters that are favorable for egg, larval and adult survival. The
acoustic properties of lek sites are undoubtedly favorable for mating call transmission and must
have specific acoustic properties. Although many sciaenid spawning sites have been isolated to
date, their acoustic properties have not been studied in detail (Mok and Gilmore, 1983; Saucier et. al,
1992, Saucier and Baltz, 1993; Luczkovich et al., 1999; Gilmore 2002). Aggregative calling only occurs
at the appropriate time for spawning, facilitating successful mating, egg fertilization, egg/larval dis-
persal and survival.
— 34 —
Proceedings from the International Workshop on the Applications of Passive Acoustics to Fisheries

Sciaenid Sound Production Mechanisms
The most robust and energetic sciaenid sounds are produced by sonic muscles indirectly or directly
vibrating the membrane of the gas bladder. When a freshly captured, recently calling, male seatrout
is dissected, the bright red sonic muscles surrounding the gas bladder can be easily differentiated
from the exterior lateral body muscles. The muscle vibratory rate is directly associated with the fun-
damental frequency of the characteristic seatrout call produced by the gas bladder.
Most of the 1,200 species in this family produce sound using sonic muscles associated with the gas
bladder. Using the species specific muscle contraction rates and the gas bladder shape sciaenids
produce diagnostic sounds that can be used to identify species within the family (Mok and Gilmore
1983), as has been demonstrated in amphibians and birds. The characteristic shape of the sciaenid
gas bladder is so conservative that it has been used as one of the primary characters to classify sci-
aenids and to determine their phyletic relationships (Chu 1963; Chao 1978, 1986).
Classification of Sciaenid Sounds
Figure 2 illustrate the diagnostic mating calls of sciaenids known to spawn in the Indian River
Lagoon system of east central Florida.
Sciaenid Acoustic and Spawning Ecology: When and Where do Sciaenids Produce Sound?
Mok and Gilmore (1983) demonstrated that sciaenid sound production was specifically associated
with crepuscular and nocturnal courtship and spawning activities. Pelagic eggs and larvae of the
spotted seatrout were collected with plankton nets at spawning sites during vocalization periods
(Mok and Gilmore, 1983; Alshuth and Gilmore, 1993, 1994, 1995). These same studies of soniferous
spawning aggregations have demonstrated long-term spawning site fidelity, with the principal
spawning sites identified by Mok and Gilmore (1983) being used for over twenty years (Gilmore,
1994, 1996, 2002).
As male spotted seatrout could be recognized by distinctive crepuscular calls their presence or
absence from specific locations could be determined and the percent occurrence of calls at all
acoustic listening sites derived. In addition, the approximate size of the calling group could be esti-
mated based upon sound intensity (dB level, re 1 µPa) and group size estimates using a three part
scale: 1 - small group or individual callers; 2 - moderate groups of several tens of callers; and 3 - a
large group of what appear to be hundreds of simultaneous callers. Unfortunately, mixed species
chorus behaviors were common with Arius felis and Bairdiella chrysoura joining in with spotted
seatrout calls, therefore, elevating site specific sound intensities and masking seatrout numbers
based on sound intensity. The percent occurrence of spotted seatrout calls at a site or time period is
the most objective data used to define site and period use by seatrout leks. However, Gilmore
(1994) found that spatial and temporal distributions of the estimated group size, egg and larval
abundance in the water column and percent occurrence of calling trout were highly correlated (r =
— 35 —
Proceedings from the International Workshop on the Applications of Passive Acoustics to Fisheries
0.92 to 0.98 at α= 0.05). This indicates that group size estimates were a useful, independently
derived variable that could be used to verify calling trout distributions and relative use of specific
sites or particular times of the year. These two data types have been used to isolate spawning times
and locations.
Seasonal mating calls were directly associated with primary spawning activity in east central Florida
sciaenids. Figure 4 summarizes their seasonal call pattern at this latitude based on over 300
acoustic transects between 1978 and 2002.
Spatial distribution of sciaenid spawning calls: All soniferous spawning populations of sciaenids in the
upper Banana River Lagoon, a lagoon associated with the Indian River Lagoon system, within the
protected waters of the Kennedy Space Center have been mapped. Spawning sites are utilized only
from sunset to midnight during the spawning period with greater call activity on new and full
moon phases. Some sites within the Indian River Lagoon system have been known as favored
spawning sites with mating calls having been recorded from these sites for over 20 years. Figure 5
represents primary call sites for all sciaenids known to spawn in the upper Banana River Lagoon
basin north of the NASA Causeway at the Kennedy Space Center.
Future Technology Developments at KSC Relative to Acoustic studies of Sciaenid Fishes
Once locations and periods of acoustic activity and spawning have been isolated as they have at the
Kennedy Space Center, then a number of basic questions and hypotheses can be addressed relative
to the evolutionary significance of sound production in sciaenids and other soniferous fishes.
Examples are:
1. Does sciaenid sound production increase the probability of predation mortality?
2. What are the energetic costs of sonifery?
3. How does sciaenid foraging behavior relate to spawning and sound production and are theresexual differences in foraging behavior as a result of differences in mating behavior, acousticenergetics?
4. What are the benefits of sonifery to spawning aggregations?
With the installation of permanent acoustic arrays, portable acoustic systems, roving robotic
acoustic platforms and physical sensor arrays we believe it will be possible to address detailed
research objectives that will finally unravel the intimate mating, foraging and predatory escape
behaviors of regional estuarine sciaenid communities.
Acknowledgements
Sensor Web pod deployments (developed by Kevin Delin, NASA/JPL, Pasadena, CA) and our
NASA/KSC PAMS (Portable Acoustic Monitoring System) being deployed by the Clelia submarine
during a NOAA OE project August 2001.
— 36 —
Proceedings from the International Workshop on the Applications of Passive Acoustics to Fisheries
Literature Cited
Alshuth, S. and R.G. Gilmore. 1993. Egg identification, early larval development and ecology of the
spotted seatrout, Cynoscion nebulosus C. (Pisces: Sciaenidae). ICES C.M. 1993/G 28, Dem. Fish Com: 18
pp.
Alshuth, S. and R.G. Gilmore. 1994. Salinity and temperature tolerance limits for larval spotted
seatrout, Cynoscion nebulosus C. (Pisces: Sciaenidae). ICES C.M. 1994/L:17, Biol. Oceanogr. Cttee., 19
pp.
Alshuth, S. and R.G. Gilmore. 1995. Egg and early larval characteristics of Pogonias cromis, Bairdiella
chrysoura, and Cynoscion nebulosus (Pisces: Sciaenidae), from the Indian River Lagoon, Florida. ICES
C.M. 1995/L:17, Biol. Oceanogr. Cttee., 21 pp.
Aristotle. Historia Animalium, IV, 9. Trans. by D.D’A.Thompson. 1910. Oxford. Clarendon Press.
Chu, Y.T., Y.L. Lo and H.L. Wu. 1963. A study on the classification of the sciaenoid fishes of China, with
description of new genera and species. 1972 Reprint, Antiquariaat Junk, Netherlands.
Chao, L.N. 1978. A basis for classifying western Atlantic sciaenidae (Teleostei: Perciformes). NOAA
Tech. Rept. NMFS Circ. 415.
Chao, L.N. 1986. A synopsis on zoogeography of the sciaenidae. Pp. 570-589, In T. Uyeno, R. Arai, T.
Taniuchi and K. Matsuura (eds.) Indo-Pacific Fish Biol.: Proceedings of the Second Internatl. Conf.
Indo-Pac. Fishes.
Connaughton, M.A. and M.H. Taylor. 1994. Seasonal cycles in the sonic muscles of the weakfish,
Cynoscion regalis. Fish. Bull. 92: 697-703.
Connaughton, M.A. and M.H. Taylor. 1995. Seasonal and daily cycles in sound production associated
with spawning in the weakfish,Cynoscion regalis. Envir. Biol. Fish. 42: 233-240.
Darwin, C. 1874. The descent of man. 2nd edition. N.Y.: H.H. Caldwell.
Dijkgraaf 1947. Ein tone erzeugender fisch in Neapler Aquarium. Experimenta, vol. 3, pp. 494-494.
Dijkgraaf 1949. Untersuchungen uber die funktionen des ohrlabyrinths bei meeresfischen. Physiol.
Comp. Oecolog., vol. 2, pp. 81-106.
Dobrin 1948. Measurements of underwater noise produced by marine life. Sci., Vol. 105: 19-23.
Dufossé, A. 1874a. Rescherches sur les bruts et les sons expressifs que font entendre les poissons
d’Europe et sur les organes producteurs de ces phenomenes acoustiques ainsi que sur les appareils
de l’audition de plusieurs de ces animaux. Annales des Sci. Naturelles ser 5, 19: 53 pp.
Dufossé, A. 1874b. Rescherches sur les bruts et les sons expressifs que font entendre les poissons
d’Europe et sur les organes producteurs de ces phenomenes acoustiques ainsi que sur les appareils
— 37 —
Proceedings from the International Workshop on the Applications of Passive Acoustics to Fisheries

de l’audition de plusieurs de ces animaux. Annales des Sci. Naturelles ser 5, 20: 134 pp.
Fish, J.F. and W.C. Cummings. 1972. A 50-dB increase in sustained ambient noise from fish
(Cynoscion xanthurus). J. Acoust. Soc. Amer. 52: 1266-1270.
Fish, M.P. and W.H. Mowbray. 1970. Sounds of western North Atlantic fishes. The Johns Hopkins
Press, Baltimore.
Gilmore, R.G.,, Jr. 1994. Environmental parameters associated with spawning, larval dispersal and
early life history of the spotted seatrout, Cynoscion nebulosus (Cuvier). Final Program Rev., Contract
No. LCD 347. Mar. Res. Inst., Fla. Dept. Environ. Protection, St. Petersburg, Fla.
Gilmore, R.G. , Jr. 1996. Isolation of spawning groups of spotted seatrout, Cynoscion nebulosus, using
passive hydroacoustic methodologies. Final Report, 21 November 1996, 12 pp., Fla. Dept. Environ.
Protection, Mar. Res. Inst., St. Petersburg, Fla. Subcontract to Dr. Roy Crabtree, Principal Investigator,
FMRI study entitled: The reproductive biology of spotted seatrout, Cynoscion nebulosus, in the Indian
River Lagoon.
Gilmore, R.G, Jr.. 2000. Spawning site fidelity, classification of spawning environments and evolu-
tionary stable strategies: Serranids versus Sciaenids. (Abstract) In Session 54: Fish Aggregation
Symposium. 80th Annual Meeting Am. Soc. Ichthy. And Herp., La Paz, Mexico, June 14-20, 2000.
Gilmore, R.G, Jr.. 2002. Sound production and communication in the spotted seatrout. Chapter 11.
pp. 177-195, in Biology of the Spotted Seatrout, S.A. Bortone, ed. CRC Press, Boca Raton.
Goode, G. B. 1887. American fishes: a popular treatise upon the game and food fishes of North
America with special reference to habits and methods of capture. L.C. Page Co., Boston.
Hoglund, J. and R.V. Alatalo. 1995. Leks. Princeton Univ. Press. 248 pp.
Knudsen, V.O. , R.S. Alfred and J.W. Emling. 1948. Underwater ambient noise. J. Mar. Res., Vol. 7: 410-
429.
Lin, Ya Di. 1996. A neural network for the isolation of fish sounds. Ph.D. Dissertation, Florida Institute
of Technology, Melbourne, Florida, USA.
Luczkovich, J. J., M.W. Sprague, S.E. Johnson and R.C. Pullinger. 1999. Delimiting spawning areas of
weakfish, Cynoscion regalis (family Sciaenidae), in Pamlico Sound, North Carolina usign passive
hydroacoustic surveys. Bioacoustics 10: 143-160.
Luczkovich, J.J., H.J. Daniel III, M. Hutchinson, T. Jenkins, S.E. Johnson, R.C. Pullinger and M.W. Sprague.
2000. Sounds of sex and death in the sea: bottlenose dolphin whistles suppress mating choruses of
silver perch. Bioacoustics 10. 323-334.
Protasov, V.R. and M.I. Aronov 1960. On the biological significance of sounds of certain Black Sea fish.
(In Russian). Biofizika, Vol. 5: 750-752.
— 38 —
Proceedings from the International Workshop on the Applications of Passive Acoustics to Fisheries

Qi, M., S. Zhang and Z. Song. 1984. Studies on the aggregate sound production of most species of
croaker (sciaenoid fishes) in Bohai Sea, Yellow Sea and East China Sea. Studia Marina Sinica, Peking,
21: 253-264.
Saucier, M.H. and D.M. Baltz. 1992. Hydrophone identification of spawning sites of spotted seatrout
Cynoscion nebulosus (Osteichthys: Sciaenidae) near Charleston, South Carolina. N.E. Gulf Sci. 12(2):
141-145.
Saucier, M.H. and D.M. Baltz. 1993. Spawning site selection by spotted seatrout, Cynoscion nebulosus
and black drum, Pogonias cromis, in Louisiana. Env. Biol. Fishes 36: 257-272.
Schneider, H. and A.D. Hasler 1960. Laute and luerzeugung beim susswassertrommler Aplodinotus
grunniens Rafinesque (Scianenidae, Pisces), Zeitschr. Vergl. Physiol., Vol. 43: 499-517.
Takemura, A, T. Takita and K. Mizue. 1978. Studies on the underwater sound - VII: Underwater calls of
the Japanese marine drum fishes(Sciaenidae). Bull. Jap. Soc. Sci. Fish. 44: 121-125.
Tavolga, W. N. 1960. Sound production and underwater communication in fishes. pp. 93-136, in
Animal Sounds and Communication, Lanyon, W.E. and W. N. Tavolga, eds., AIBS 7.
Tavolga, W.N., A.N. Popper and R.R. Fay. (eds). 1981. Hearing and sound communication in fishes.
Springer Verlag, N.Y.: pp 395-425
— 39 —
Proceedings from the International Workshop on the Applications of Passive Acoustics to Fisheries
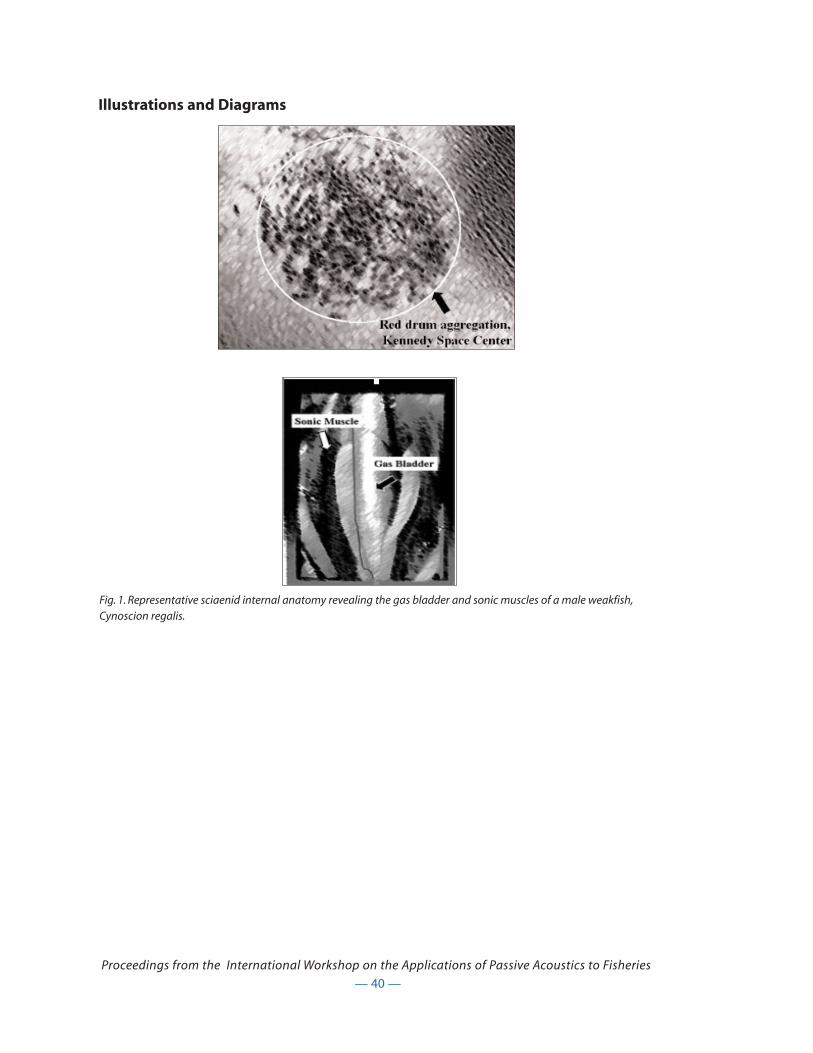
— 40 —
Proceedings from the International Workshop on the Applications of Passive Acoustics to Fisheries
Illustrations and Diagrams
Fig. 1. Representative sciaenid internal anatomy revealing the gas bladder and sonic muscles of a male weakfish,Cynoscion regalis.

— 41 —
Illustrations and Diagrams
Fig. 2. Energy distribution patterns associated with harmonic frequency bands and fundamental frequencies arespecies specific and were used to train a neural network to recognize sciaenid calls (Lin 1996).
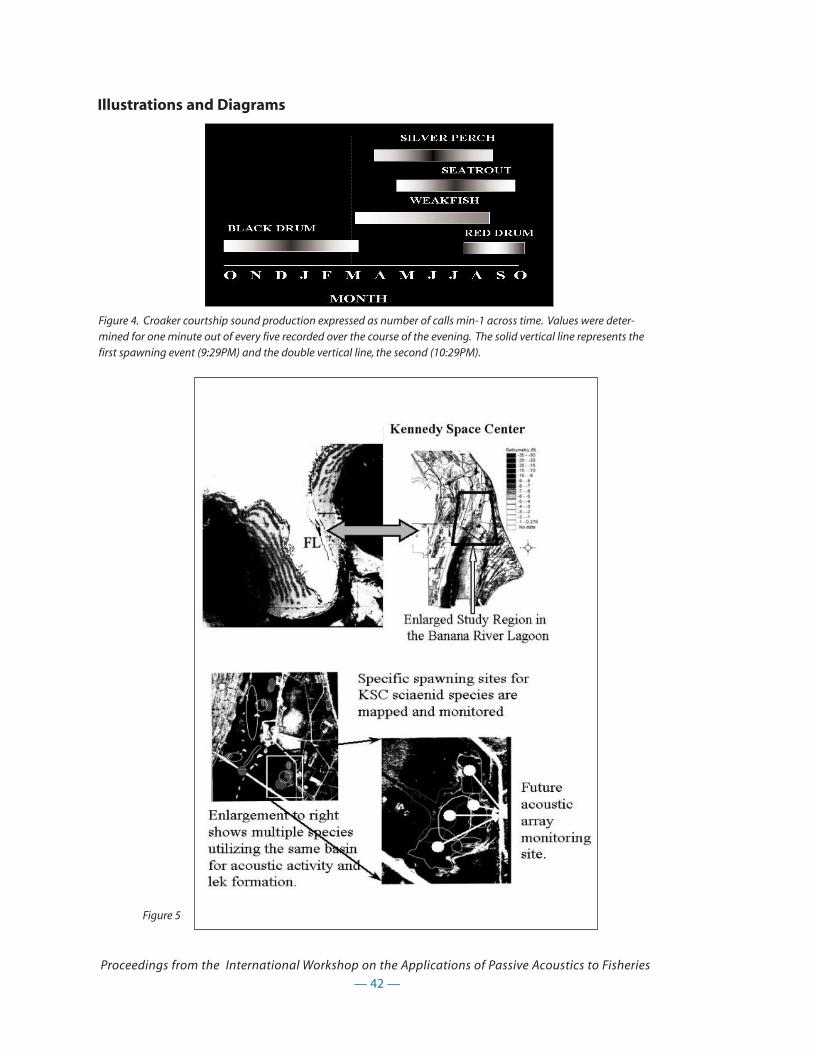
— 42 —
Proceedings from the International Workshop on the Applications of Passive Acoustics to Fisheries
Illustrations and Diagrams
Figure 5
Figure 4. Croaker courtship sound production expressed as number of calls min-1 across time. Values were deter-mined for one minute out of every five recorded over the course of the evening. The solid vertical line represents thefirst spawning event (9:29PM) and the double vertical line, the second (10:29PM).

The Use of Passive Acoustics to Identify a Haddock Spawning Area
Anthony D Hawkins
FRS Marine Laboratory, PO Box 101, Victoria Road, Torry, Aberdeen AB11 9DB, Scotland, UK.
Introduction
The haddock is an important food fish, widely distributed throughout the deeper shelf waters of the
North Atlantic. It is very heavily fished and in some areas is considered to be exploited beyond safe
biological limits. Fisheries management measures have included the closure of spawning areas
(Waiwood & Buzet, 1989). Haddock gather together close to the seabed to spawn (Boudreau, 1992).
Fertilization is external and the pelagic eggs hatch near the sea surface. The larvae drift in the
upper part of the water column before the young fish move down to the seabed. There is very little
detailed information, however, on where haddock spawn. The location of the spawning grounds
has to be inferred either from catches of mature fish, or from the distribution of pelagic eggs.
Haddock are generally believed to spawn offshore at depths of 200-500m or even deeper (Solemdal
et al, 1997), but oral evidence from fishermen suggests that in some areas haddock may spawn
inshore (Ames, 1998).
Like other members of the cod family (Gadidae), the haddock is a noisy fish. The male produces a
diversity of sounds over the spawning season, with distinctive sounds associated with particular
behavioural acts (Hawkins and Amorim, 2000). This behaviour offers the opportunity to detect the
presence of spawning fish simply by listening for sounds. A search was therefore carried out in
coastal waters by listening for the characteristic sounds of haddock. By this means an aggregation
of spawning haddock was located at the upper end of Balsfjord, a sub-arctic fjord in Northern
Norway.
Aquarium Observations on Spawning Haddock
Spawning of captive haddock was observed in a 10m diameter annular aquarium tank at the FRS
Marine Laboratory Aberdeen. Water depth was 1.5m and the water temperature was maintained at
8(C. The fish were observed from above by means of a low light level TV camera and their behav-
iour recorded on a time-lapse video tape recorder.
The sounds of the fish were detected with an omni-directional broad-band hydrophone (ITC,
6050C), amplified (Stanford SR560 pre-amplifier, bandwidth 30Hz to 10kHz), sampled at 8 kHz and
— 43 —
Proceedings from the International Workshop on the Applications of Passive Acoustics to Fisheries

recorded directly as WAV files on the hard disk of a lap-top computer by means of Avisoft Recorder.
Sound analysis was performed with Avisoft SASLab Pro.
In the aquarium, individual female haddock spawned repeatedly over several weeks. Spawning was
accomplished through a close spawning embrace, and preceded by elaborate courtship behaviour.
Sounds were recorded in the aquarium from male and female haddock, and from juveniles.
However, during the spawning period sounds were predominantly made by the male fish.
Haddock sounds have been described as a series of ‘knocks’ (Hawkins & Chapman, 1966), repeated
regularly at different rates. It has since become apparent that each knock can be subdivided into
two short, low-frequency pulses of sound, spaced closely together (Hawkins & Amorim, 2000).
The individual knocks produced by male fish were regularly repeated at a range of different rates,
depending on the behaviour of the fish. Short sequences of repeated knocks were emitted during
agonistic encounters. At spawning time, male fish produced much longer sequences, lasting from
several seconds to several minutes, the knocks being produced at intervals varying from 500 ms to
30 ms. At the very fastest rates, with intervals of less than 50 ms, the sounds were heard as a contin-
uous humming. Different behavioural acts leading up to the spawning embrace were associated
with different repetition rates. This rich diversity of sounds produced by the male haddock appears
to be characteristic of this species.
Male haddock showed a distinctive solitary display. Dominant males adopted a characteristic pat-
tern of pigmentation, occupied a favoured area and showed a characteristic pattern of movement,
moving in tight circles or a figure of eight. During this behaviour the male uttered an almost contin-
uous train of regularly repeated knocks repeated at intervals of between 140 and 60 ms (Figure 1).
During the spawning season males spent much of their time in solitary display (9h out of 24, 75% at
night), interrupting the display only when other fish entered their territories.
Differences between the sounds of individual male haddock were analysed by measurements on
the waveform or through wavelet analysis (see Wood, these proceedings). In most instances the
knocks were composed of two pulses separated by intervals of 10-20ms. The two pulses often dif-
fered in frequency, the first being higher than the second. Within a given call, or from day to day,
there was little variation in the waveform for an individual fish. From month to month, however,
there was a significant change in the detail of the waveform, though the double pulse structure was
usually retained. There were often striking differences between the sounds of individual males
(Figure 2).
The characteristic sounds described from haddock in the aquarium provided clear criteria for the
location of spawning male haddock in the sea. The short low frequency sounds (below 1kHz), made
up of two pulses separated by intervals of 10 - 20 ms, regularly repeated at intervals of 300 - 30 ms,
often for more than several seconds, provided unequivocal evidence of the presence of haddock.
Moreover, changes in the repetition rate of the sounds were indicative of different stages in the
behaviour of the haddock. The sounds were quite different from those described for other gadoid
fish (Hawkins & Rasmussen (1978).
— 44 —
Proceedings from the International Workshop on the Applications of Passive Acoustics to Fisheries
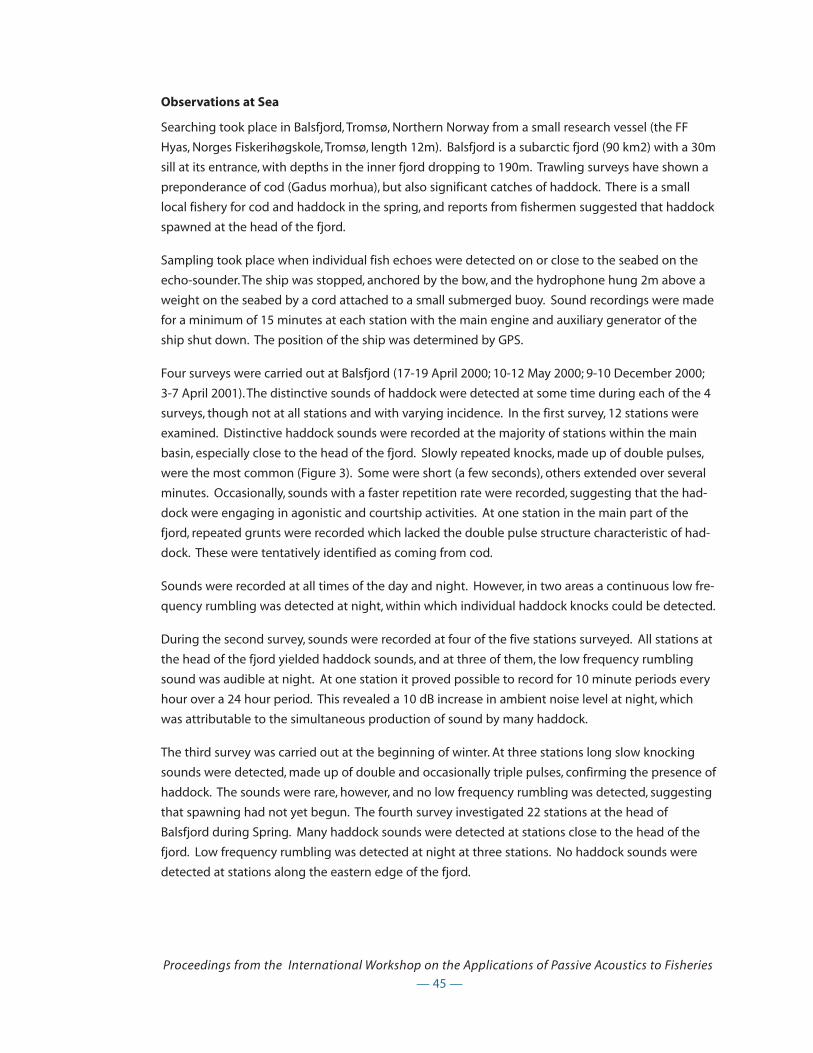
Observations at Sea
Searching took place in Balsfjord, Tromsø, Northern Norway from a small research vessel (the FF
Hyas, Norges Fiskerihøgskole, Tromsø, length 12m). Balsfjord is a subarctic fjord (90 km2) with a 30m
sill at its entrance, with depths in the inner fjord dropping to 190m. Trawling surveys have shown a
preponderance of cod (Gadus morhua), but also significant catches of haddock. There is a small
local fishery for cod and haddock in the spring, and reports from fishermen suggested that haddock
spawned at the head of the fjord.
Sampling took place when individual fish echoes were detected on or close to the seabed on the
echo-sounder. The ship was stopped, anchored by the bow, and the hydrophone hung 2m above a
weight on the seabed by a cord attached to a small submerged buoy. Sound recordings were made
for a minimum of 15 minutes at each station with the main engine and auxiliary generator of the
ship shut down. The position of the ship was determined by GPS.
Four surveys were carried out at Balsfjord (17-19 April 2000; 10-12 May 2000; 9-10 December 2000;
3-7 April 2001). The distinctive sounds of haddock were detected at some time during each of the 4
surveys, though not at all stations and with varying incidence. In the first survey, 12 stations were
examined. Distinctive haddock sounds were recorded at the majority of stations within the main
basin, especially close to the head of the fjord. Slowly repeated knocks, made up of double pulses,
were the most common (Figure 3). Some were short (a few seconds), others extended over several
minutes. Occasionally, sounds with a faster repetition rate were recorded, suggesting that the had-
dock were engaging in agonistic and courtship activities. At one station in the main part of the
fjord, repeated grunts were recorded which lacked the double pulse structure characteristic of had-
dock. These were tentatively identified as coming from cod.
Sounds were recorded at all times of the day and night. However, in two areas a continuous low fre-
quency rumbling was detected at night, within which individual haddock knocks could be detected.
During the second survey, sounds were recorded at four of the five stations surveyed. All stations at
the head of the fjord yielded haddock sounds, and at three of them, the low frequency rumbling
sound was audible at night. At one station it proved possible to record for 10 minute periods every
hour over a 24 hour period. This revealed a 10 dB increase in ambient noise level at night, which
was attributable to the simultaneous production of sound by many haddock.
The third survey was carried out at the beginning of winter. At three stations long slow knocking
sounds were detected, made up of double and occasionally triple pulses, confirming the presence of
haddock. The sounds were rare, however, and no low frequency rumbling was detected, suggesting
that spawning had not yet begun. The fourth survey investigated 22 stations at the head of
Balsfjord during Spring. Many haddock sounds were detected at stations close to the head of the
fjord. Low frequency rumbling was detected at night at three stations. No haddock sounds were
detected at stations along the eastern edge of the fjord.
— 45 —
Proceedings from the International Workshop on the Applications of Passive Acoustics to Fisheries
Discussion
By listening, it proved possible to locate concentrations of spawning haddock at the head of
Balsfjord during Spring over two successive years, confirming that passive acoustics provide a reli-
able non-invasive technique for identifying the precise areas where haddock spawn. The method
may greatly assist in the search for the spawning areas of commercially important food fishes.
Sound production was most intense at night.
Acknowledgments
These studies were collaborative and depended on the efforts of others. Research at the FRS Marine
Laboratory was conducted with Licia Casaretto, Marta Picciullin, & Mark Wood, all of the University of
Aberdeen. Studies at sea involved Licia Casaretto, Marta Picciullin and also Kjell Olsen and Captain
Eilert Halsnes from the University of Tromso.
References
Ames, E.P. (1998) Cod and haddock spawning grounds in the Gulf of Maine. In: The implications of
localized fishery stocks (eds. von Herbing, I.H., Tupper, M., & Wilson, J.) 55(64. NRAES, Ithaca, New York.
Boudreau, P.R. (1992) Acoustic observations of patterns of aggregation in haddock (Melanogrammus
aeglefinus) and their significance to production and catch. Can. J. Fish. Aquat. Sci. 49, 23(31.
Hawkins, A.D. & Amorim, M.C.P. (2000) Spawning sounds of the male haddock, Melanogrammus
aeglefinus. Env. Biol. Fish. 59, 29(41.
Hawkins, A.D. and Chapman, C.J. (1966) Underwater sounds of the haddock Melanogrammus
aeglefinus (L.). J. mar. biol. Ass. U.K. 46, 241-247.
Hawkins, A.D. and Rasmussen, K.J. (1978) The calls of gadoid fish. J. mar. biol. Ass. U.K. 58, 981-911.
Solemdal, P., Knutsen, T., Bjørke, H., Fossum, P., & Mukhina, N. (1997) Maturation, spawning and egg
drift of Arcto-Norwegian haddock (Melanogrammus aeglefinus). J. Fish. Biol., 51 (Suppl. A), p 419.
Waiwood, K.G. & Buzeta, M.I. (1989) Reproductive biology of Southwest Scotian Shelf haddock
(Melanogrammus aeglefinus). Can. J. Fish. Aquat. Sci. 46, 153(170.
— 46 —
Proceedings from the International Workshop on the Applications of Passive Acoustics to Fisheries
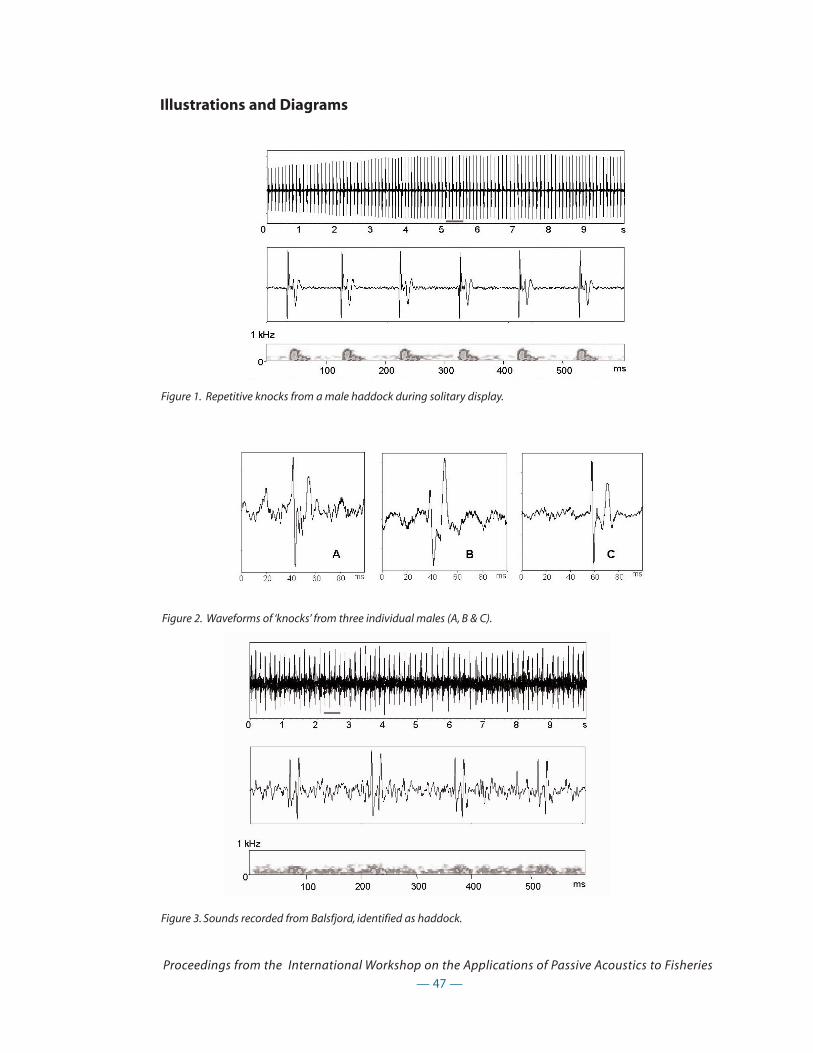
— 47 —
Proceedings from the International Workshop on the Applications of Passive Acoustics to Fisheries
Illustrations and Diagrams
Figure 3. Sounds recorded from Balsfjord, identified as haddock.
Figure 1. Repetitive knocks from a male haddock during solitary display.
Figure 2. Waveforms of ‘knocks’ from three individual males (A, B & C).
— 48 —
Proceedings from the International Workshop on the Applications of Passive Acoustics to Fisheries
Using a Towed Array to Survey Red Drum Spawning Sites in the Gulf of Mexico
Scott A Holt
University of Texas at Austin Marine Science Institute, 750 Channel View Drive, Port Aransas TX
78373 USA.
Introduction
The red drum (Sciaenops ocellatus) is an important recreational and, in some locations, commercial
species throughout its range. Juveniles generally live in estuaries and move to nearshore oceanic
waters as they reach maturity (Pearson 1929). Adults range widely over the nearshore continental
shelf waters throughout the year but apparently move to coastal waters to spawn (Overstreet 1983).
Spawning is generally thought to take place in coastal waters near inlets (Jannke 1971, Holt et al.
1985) although Lyczkowski-Shultz et al. (1988) found eggs and larvae out to 34 km from shore in
the eastern Gulf of Mexico. There is also evidence of limited spawning activity within estuaries in
Florida (Murphy and Taylor 1990, Johnson and Funicelli 1991) and in North Carolina (Luczkovich et
al.1999).
The location of spawning areas has typically been inferred through capture of fish with mature
gonads or the distribution of eggs and larvae. Red drum make loud, characteristic sounds during
spawning (Guest and Lasswell 1978). Listening for the characteristic sound production has recently
been used to locate red drum spawning sites in Indian River Lagoon, Florida (Johnson and Funicelli
1991), and in Plamico Sound, North Carolina (Luczkovich et al.1999), and at tidal inlets in South
Carolina (Collins et al., these proceedings). These surveys have been done with both hand-held
hydrophones and remotely placed sonobuoys.
Over a four-year period from 1998-2001, a hydrophone mounted on a pier in the Aransas Pass, Texas
tidal inlet has been use to record sounds of red drum spawning activity every evening during the
September through October spawning period. Recordings were made for 20 s every 15 m from
1700 to 0100 hours and spanned the 4-5 hour evening spawning period of red drum (Holt et al.
1985). Red drum produced characteristic spawning sounds from about one hour before sunset to
about three hours after sunset with the most intense activity occurring during the two hours follow-
ing sunset (S. Holt, unpublished data). These data, along with collections of red drum eggs and lar-
vae at the site, confirmed that red drum spawn actively in the vicinity of the tidal inlet. The spatial
extent of red drum spawning was still unknown but it was clear that surveying sound production
during spawning was an effective means of locating spawning sites.
This paper reports on a survey of potential spawning sites in the nearshore western Gulf of Mexico
using a towed hydrophone array.

Study Area and Methods
The survey was conducted in the northwestern Gulf of Mexico along the central portion of the
Texas, USA, coast. Preliminary surveys with a hand-held hydrophone in the area revealed that red
drum spawning sounds were more commonly observed along the 10 m contour than in either shal-
low water near the surf zone or farther offshore in deeper water. Hence, for this initial survey, three
transects were established roughly parallel to the coastline along the 10 m contour. Transects were
sampled on three consecutive nights (one transect per night) in late September 2000. Sampling
commenced about 30 - 45 min before sunset, which was about 1925, and ran for about 3.5 hours.
The towed array was composed of eight hydrophones in an 80 meter cable connected to a 200
meter towing cable and was towed at approximately 4.5 kts from a 105 foot stern trawler. The array
is spectrally flat (i.e. no peaks in sensitivity) from 6Hz to 18 kHz, with a sensitivity of approximately -
191 dB re 1 volt per µPa at 7.2 kHz. The signals from each of the eight separate hydrophones were
saved to an eight-track digital recorder (Tascam DA-88) sampling at 44 kHz. The combination of a
temporal window of spawning vocalizations (about 3.5 hours) and optimum towing speed for the
array of (4.5 kts) limited each nightly transect to about 20 km.
Red drum produce low frequency sounds described as knocks (Fish and Mowbray 1970) or drum-
ming (Guest and Lasswell 1978). Although Guest and Lasswell (1978) found the “dominant energy”
of their recordings from a tank was around 240 Hz - 1000 Hz, I have found the fundamental frequen-
cy of red drum calls obtained from unconstrained fish in the field to consistently be around 140 Hz -
160 Hz (Fig. 1). Each call consists of a variable number of pulses, or knocks, that are repeated at a
range of pulse repetition rates (Guest and Lasswell 1978, laboratory observations; S Holt unpub-
lished data, field observations). Whether there are specific behaviors associated with specific call
types is unknown but the existence of numerous variants in call pattern suggests individual variabil-
ity. Despite variation in call duration and pulse repetition rate, the consistency in fundamental fre-
quency and general character of the call pattern make recognition by ear relatively easy.
Recorded signals from the array were analyzed by listening to the tapes while observing the real-
time power spectra and real-time sonogram on a computer screen (SpectraPro 3.32, Sound
Technology Inc.). Two classes of red drum sounds could be distinguished. One was a low frequency
rumble with a prominent energy peak in the 150 Hz range. This was presumed to be from large
numbers of red drum producing sounds simultaneously but at some distance from the hydrophone.
(The sound produced by the ship and the hydrophone itself was determined to have dominant
energy in the range of 250 Hz - 300 Hz.) The other class of sounds was clearly distinguishable calls
made by an individual or small group of red drum.
The occurrence of background rumble indicates spawning activity in the vicinity of the hydrophone
but more work is needed before the spatial scale over which those sounds travel can be meaning-
fully interpreted. For this paper, I will describe only the distribution of individual or small-group calls.
From our observations and the work of Luczkovich et al. (1999), it appears that the drumming of an
individual red drum can be distinguished over a distance of about 100 m. Thus, we can roughly
define the spatial distribution of individual red drum detected by the hydrophones as a 200 m
— 49 —
Proceedings from the International Workshop on the Applications of Passive Acoustics to Fisheries
swath along the transect. The physical location of each observation was determined by comparing
the underway data recorded from the ship’s SAIL system (which included time and latitude/longi-
tude as well as several physical parameters) and the clock time on the digital recorder which was
carefully synchronized with the ships clock. The data set was initially constructed by recording the
hour/minute/second of each identifiable call. The data was then summarized by counting the num-
ber of calls heard in each one-minute segment (the ships location was recorded once per minute so
that was our finest scale of spatial resolution). The number of calls/minute was arbitrarily divided in
two groups: <16 per minute and 16 or more per minute. This division was set to separate the typi-
cally lower occurrence of drumming (5-10 per minute was typical) from the relatively rarer higher
rate (we rarely heard more than 20-30 per minute). Finally the drumming rate (i.e. none, low, or high)
was plotted on the cruise track.
Results
Red drum calls were detected along most sections of the three transects (Figs. 2 & 3). Calls were
detected both in extensive clusters and in isolated occurrences along the transects. For example, on
the San Jose “A” transect (Fig. 3), there are two occurrences of near continuous calling that extend
over several kilometers. On the same transect, there are several isolated occurrences of red drum
calls and extensive segments (up to 4 km) where there are no calls. Transect segments were domi-
nated by the absence of red drum calls. There was a total of 474 minutes of observations over all
transects. Of those, 330 minutes (70%) had no red drum calls, 109 minutes (23%) had low drumming
rates (<16 per min), and 35 minutes (7%) had high drumming rates (>15 per min). High drumming activity
was concentrated in two segments along the San Jose “A” transect and in one segment of the
Matagorda transect. One segment, on the east end of the transect, spanned 5 minutes of towing
time and covered 600 m. The other, farther to the west on that transect, spanned 14 minutes of tow-
ing time and covered 2.2 km. Only 4 of the 14 minutes in this segment were low level drumming
and none were without drumming.
The most intense drumming activity occurred between 1830 and 2130. Little drumming was heard
after 2130 on the Matagorda or San Jose “A” transects (data for the later part of the San Jose “B” tran-
sect was lost due to an audio tape malfunction). Low and high drumming rates were distributed
throughout this time period without any temporal pattern.
Discussion
Based on the distribution of sound production, red drum appear to spawn all along the nearshore
region of the central Texas coast. This survey was not spatially comprehensive enough to fully delin-
eate the spawning area, but it is clear from this initial survey that spawning activity is widespread.
Spawning was not concentrated at inlets as suggested by earlier authors (Simmons and Breuer
(1962), Jannke (1971). Areas of the coastline far removed from the inlets had relatively intense drum-
ming activity and confirms suggestions of Murphy and Taylor (1990) that spawning also occurs over
the nearshore continental shelf.
— 50 —
Proceedings from the International Workshop on the Applications of Passive Acoustics to Fisheries
It is still not exactly clear how drumming by male red drum should be interpreted. There are at least
three possibilities: 1) the drumming male will engage in spawning at that location on that evening;
2) the drumming male is calling from a potential spawning site but will spawn at that site on that
day only if joined (or selected) by a cooperative female; or 3) the drumming male may move to
another place before engaging in spawning. Luczkovich et al. (1999) observed instances of red drum
drumming without finding eggs and Johnson and Funicelli (1991) found red drum eggs without
hearing drumming. In both instances, short-term observations were made in shallow water with a
hand held hydrophone and the observers may have disturbed the fish or missed part of the spawn-
ing process. At this point, it is assumed that drumming roughly equates to spawning but the issue
needs more investigation.
The distribution of drumming male red drum suggest that some, if not most, of the spawning takes
place among widely distributed individuals as opposed to highly aggregated groups. Only 7% of
the one-minute summaries recorded high drumming rates of more than 15 calls per minute. Guest
and Lasswell (1978) reported a call rate of about 2-16 calls per minute for captive red drum in
courtship. Our subjective impression from listening to the tapes was that many of the low drum-
ming rates were produced by a single fish. There were, however, at least two large aggregations of
drumming fish. Both were in the vicinity of Cedar Bayou, a relatively small but historically persistent
tidal inlet. One of these aggregations spanned a linear distance of over 2 km and its breath was
undetermined. The number of calls per minute (up to 40) indicates that several red drum were call-
ing simultaneously within the roughly 100 meter detection range of the hydrophones and this “den-
sity” was consistent over most of the 2 km stretch.
The full extent of the offshore spawning area of red drum is yet to be determined and much
remains to be learned about their reproductive strategies, but the use of towed hydrophone arrays
offers promise of an efficient means to achieve those goals.
Acknowledgments
I thank John Keller for processing the audio data and Cameron Pratt for preparing the figures. The
crew of the R/V Longhorn was instrumental in acquiring the recordings. This work was funded
through a grant from the Sid W. Richardson Foundation.
References
Fish, M. P., and W. H. Mowbray. 1970. Sounds of western North Atlantic fishes; a reference file of bio-
logical underwater sounds. Johns Hopkins Press, Baltimore.
Guest, W. C., and J. L. Lasswell. 1978. A note on courtship behavior and sound production of red
drum. Copeia 1978: 337-338.
Holt, G. J., S. A. Holt, and C. R. Arnold. 1985. Diel periodicity of spawning in sciaenids. Marine Ecology
Progress Series 27: 1-7.
— 51 —
Proceedings from the International Workshop on the Applications of Passive Acoustics to Fisheries

Jannke, T. E. 1971. Abundance of young sciaenid fishes in Everglades National Park, Florida, in relation
to season and other variables. University of Miami Sea Grant Technical Bulletin 11: 128p.
Johnson, D. R., and N. A. Funicelli. 1991. Spawning of the red drum in Mosquito Lagoon, East-Central
Florida. Estuaries 14: 74-79.
Luczkovich, J. J., H. J. Daniel, III, and M. W. Sprague. 1999. Characterization of critical spawning habitats
of weakfish, spotted seatrout and red drum in Pamlico Sound using hydrophone surveys. Pages 128.
North Carolina Department of Environment and Natural Resources, Morehead City, NC.
Lyczkowski-Shultz, J., J. P. Steen, Jr., and B. H. Comyns. 1988. Early life history of red drum (Sciaenops
ocellatus) in the northcentral Gulf of Mexico. Pages 148. Mississippi-Alabama Sea Grant Consortium.
Murphy, M. D., and R. G. Taylor. 1990. Reproduction, growth, and mortality of red drum Sciaenops
ocellatus in Florida waters. Fishery Bulletin, US 88: 531-542.
Overstreet, R. M. 1983. Aspects of the biology of the red drum, Sciaenops ocellatus, in Mississippi.
Gulf Research Reports Supplement 1: 45-68.
Simmons, E. G., and J. P. Breuer. 1962. A study of redfish, Sciaenops ocellata Linnaeus and black drum,
Pogonias cromis Linnaeus. Publications of the Institute of Marine Science 8: 184-211.
— 52 —
Proceedings from the International Workshop on the Applications of Passive Acoustics to Fisheries

— 53 —
Proceedings from the International Workshop on the Applications of Passive Acoustics to Fisheries
Illustrations and Diagrams
Figure 3. Location of the Matagorda hydrophone transect. See Fig.2 legend for details.
Figure 1. Sonogram of a red drum call from an unconstrained individual in the field. This particular call consists ofthree widely spaced knocks followed by two pairs of closely spaced knocks.
Figure 2. Location San Jose “A” and “B” hydrophone transects. The line indicates the cruise track. Bars above the lineindicate low one-minute drumming rates at that location. Bars below the line indicate high one-minute drummingrates. Sampling time is indicated randomly along the track.
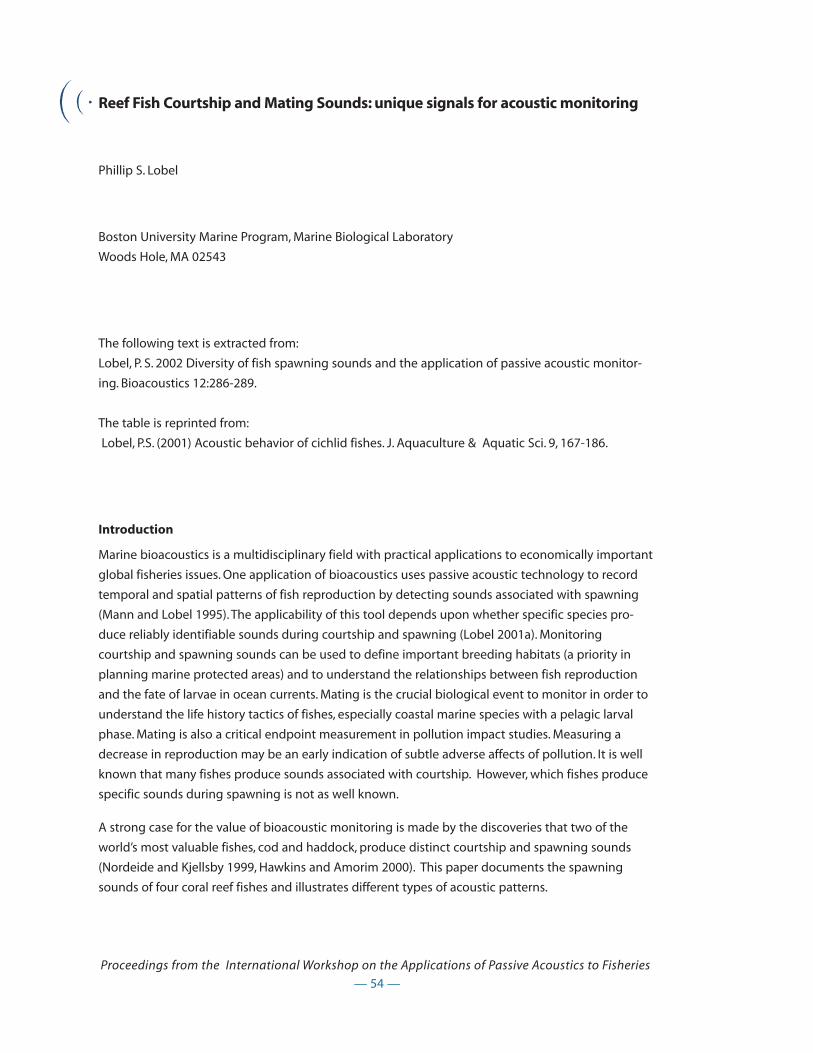
Reef Fish Courtship and Mating Sounds: unique signals for acoustic monitoring
Phillip S. Lobel
Boston University Marine Program, Marine Biological Laboratory
Woods Hole, MA 02543
The following text is extracted from:
Lobel, P. S. 2002 Diversity of fish spawning sounds and the application of passive acoustic monitor-
ing. Bioacoustics 12:286-289.
The table is reprinted from:
Lobel, P.S. (2001) Acoustic behavior of cichlid fishes. J. Aquaculture & Aquatic Sci. 9, 167-186.
Introduction
Marine bioacoustics is a multidisciplinary field with practical applications to economically important
global fisheries issues. One application of bioacoustics uses passive acoustic technology to record
temporal and spatial patterns of fish reproduction by detecting sounds associated with spawning
(Mann and Lobel 1995). The applicability of this tool depends upon whether specific species pro-
duce reliably identifiable sounds during courtship and spawning (Lobel 2001a). Monitoring
courtship and spawning sounds can be used to define important breeding habitats (a priority in
planning marine protected areas) and to understand the relationships between fish reproduction
and the fate of larvae in ocean currents. Mating is the crucial biological event to monitor in order to
understand the life history tactics of fishes, especially coastal marine species with a pelagic larval
phase. Mating is also a critical endpoint measurement in pollution impact studies. Measuring a
decrease in reproduction may be an early indication of subtle adverse affects of pollution. It is well
known that many fishes produce sounds associated with courtship. However, which fishes produce
specific sounds during spawning is not as well known.
A strong case for the value of bioacoustic monitoring is made by the discoveries that two of the
world’s most valuable fishes, cod and haddock, produce distinct courtship and spawning sounds
(Nordeide and Kjellsby 1999, Hawkins and Amorim 2000). This paper documents the spawning
sounds of four coral reef fishes and illustrates different types of acoustic patterns.
— 54 —
Proceedings from the International Workshop on the Applications of Passive Acoustics to Fisheries
Examples of Spawning Sounds
Methods are reported by Lobel (2001a) and spawning behaviors with sounds are described in refer-
ences cited below for each species.
Ostracion meleagris (Family Ostraciidae) produces a clear tonal sound with one harmonic (Figure 1a,
Lobel 1996).
Dascyllus albisella (Family Pomacentridae) produces a spawning sound composed of a simple series
of one to four pulses (Figure 1b). This spawning sound differs from its courtship sound only by hav-
ing fewer pulses (Lobel and Mann 1995). A spawning sound was not found in another pomacentrid
(Abudefduf sordidus) or in related freshwater cichlids (Lobel 1998, 2001b, Lobel and Kerr 1999), even
though these other fishes produce courtship sounds similar to D. albisella.
Hypoplectrus nigricans (Family Serranidae) produces a distinct two-part spawning sound (Figure 1c).
A short downward frequency sweep is followed by a short silence and then followed by a broad-
band sound, which is made as the fish disperse gametes (Lobel 1992). This sound may be a combi-
nation of swimbladder sound and hydrodynamic noise from rapid fin fluttering.
Scarus iserti (Family Scaridae) spawns in aggregations of about 20 to 40 individuals. These fish gather
in groups over the reef surface and then suddenly and with great speed, rush upwards a few meters,
turn rapidly while releasing gametes and dart back to the reef shelter (Lobel 1992). This spawning
sound is hydrodynamic noise produced by the fish's swimming movements (Figure 1d).
Discussion
Why do some fishes make spawning sounds? By the time mating has started, mate selection has
already taken place. Such sounds may have originated as a mere by-product of movements associ-
ated with swimming and gamete extrusion. Furthermore, these sounds are in the low frequency
range that has been shown to be highly attractive to predators, e.g. sharks (Myrberg et al. 1972).
Spawning fishes may be less responsive to predatory threats once they are completely preoccupied
with mating (Lobel and Neudecker 1985, Sancho et al. 2000). The possibility that spawning sounds
may be an attracting signal to predators on adults or newly spawned embryos is a significant
potential cost in terms of natural selection. This implies that spawning sounds must also provide
some evolutionary advantage as well. Spawning sounds may have evolved to behaviorally synchro-
nize gamete release in order to maximize external fertilization.
— 55 —
Proceedings from the International Workshop on the Applications of Passive Acoustics to Fisheries

Table 1. (reprinted from Lobel 2001b)
Possible information transmitted by sound patterns (in order of increasing complexity of signal
interpretation)
Message Acoustic clue
Mate location sound occurrence
Readiness to spawn sound occurrence
synchonization of gamete release (= mating or spawning sound)
Vigor / aggressiveness duration of call &/ call repetition rate
Individual size dominant frequency
Species identity variation in pulse repetition rate in a call, number of pulses in a
call, variation in pulse amplitude, call duration , plus color
patterns & behavior
Individual identity combination of all above clues, plus other features of behavior
Acknowledgement
Research funded by the Army Research Office (DAAG-55-98-1-0304 and DAAD19-02-1-0218). My
participation in this meeting was supported by the Woods Hole Sea Grant office.
References
Hawkins, A. D. & Amorim, M. C. P. (2000) Spawning sounds of the male haddock, Melanogrammus
aegelfinus. Environ. Biol. Fishes 59, 29-41.
Lobel, P. S., (1992) Sounds produced by spawning fish. Environ. Biol. Fishes 33, 351-358.
Lobel, P. S. (1996) Spawning sound of the trunkfish, Ostracion meleagris (Ostraciidae). Biol. Bul. 191,
308-309
Lobel, P. S. (1998) Possible species specific courtship sounds by two sympatric cichlid fishes in Lake
Malawi, Africa. Environ. Biol. Fishes 52, 443-452.
Lobel P. S. (2001a) Fish bioacoustics and behavior: passive acoustic detection and the application of
a closed-circuit rebreather for field study. Marine Technology Society Journal 35(2)19-28
Lobel, P. S. 2002 Diversity of fish spawning sounds and the application of passive acoustic monitor-
ing. Bioacoustics 12:286-289.
— 56 —
Proceedings from the International Workshop on the Applications of Passive Acoustics to Fisheries
— 57 —
Proceedings from the International Workshop on the Applications of Passive Acoustics to Fisheries
Lobel, P.S. (2001b) Acoustic behavior of cichlid fishes. J. Aquaculture & Aquatic Sci. 9, 167-186.
Lobel, P. S. 2002 Diversity of fish spawning sounds and the application of passive acoustic monitor-
ing. Bioacoustics 12:286-289.
Lobel, P. S. & Kerr, L. M. (1999) Courtship sounds of the Pacific Damselfish, Abudefduf sordidus
(Pomacentridae). Biol. Bul. 197, 242-244.
Lobel P. S. & Mann, D. A. (1995) Spawning sounds of the damselfish, Dascyllus albisella
(Pomacentridae), and relationship to male size. Bioacoustics 6, 187-198.
Lobel, P. S. & Neudecker, S. (1985) Diurnal periodicity of spawning activity by the hamlet fish,
Hypoplectrus guttavarius (Serranidae). In: The Ecology of Coral Reefs, Vol. 3, Symposia Series for
Undersea Research, (M. L. Reaka, ed), NOAA, Rockville, MD, pp. 71-86
Myrberg, A. A., Ha S. J., Walewski S. & Branbury J. C.. 1972. Effectiveness of acoustic signals in attract-
ing epipelagic sharks to an underwater source. Bull. Marine Sci. 22, 926-944. Sci. 56, 326-332.
Sancho, G., Petersen, C. W. & Lobel, P. S. (2000) Predator-prey relations at a spawning aggregation site
of coral reef fishes. Mar. Eco. Prog. Ser., 203, 275-288.
Nordeide, J.T. & Kjellsby, E. (1999) Sound from spawning cod at their spawning grounds. ICES J. Mar.
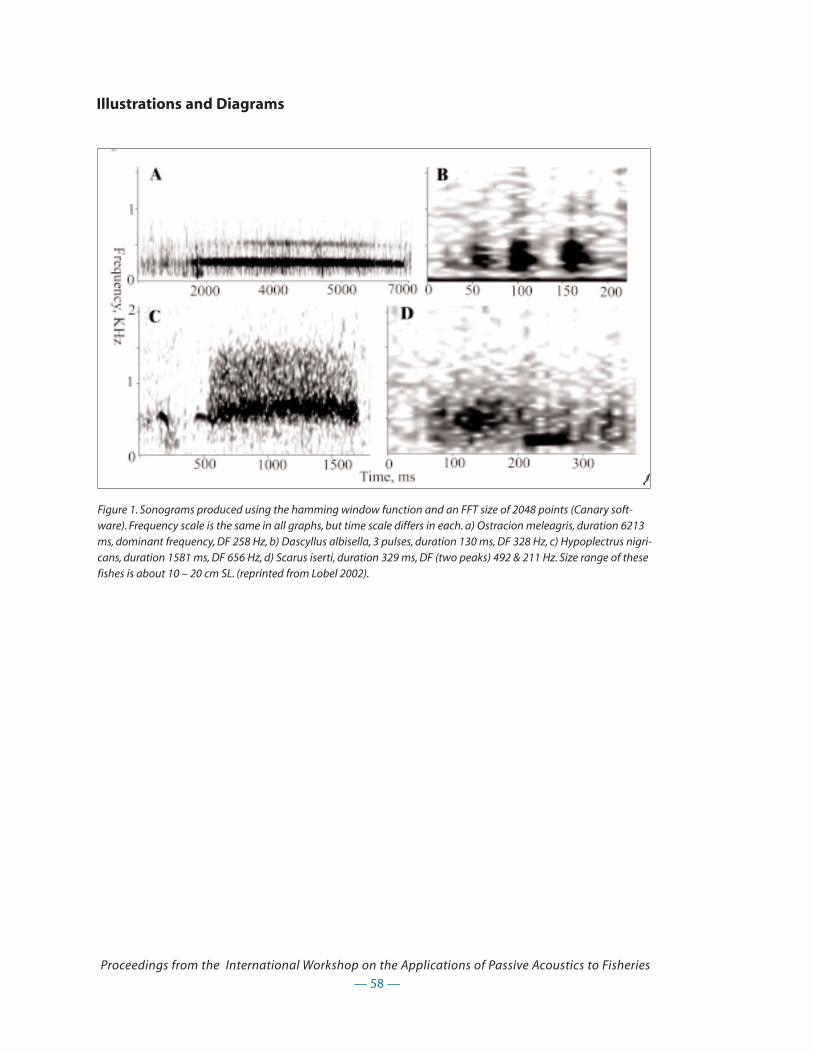
— 58 —
Proceedings from the International Workshop on the Applications of Passive Acoustics to Fisheries
Illustrations and Diagrams
Figure 1. Sonograms produced using the hamming window function and an FFT size of 2048 points (Canary soft-ware). Frequency scale is the same in all graphs, but time scale differs in each. a) Ostracion meleagris, duration 6213ms, dominant frequency, DF 258 Hz, b) Dascyllus albisella, 3 pulses, duration 130 ms, DF 328 Hz, c) Hypoplectrus nigri-cans, duration 1581 ms, DF 656 Hz, d) Scarus iserti, duration 329 ms, DF (two peaks) 492 & 211 Hz. Size range of thesefishes is about 10 – 20 cm SL. (reprinted from Lobel 2002).

Using Passive Acoustics to Monitor Spawning of Fishes in the Drum Family
(Sciaenidae)
Joseph J. Luczkovich1,2 and Mark W Sprague3
1Institute for Coastal and Marine Resources, 2Department of Biology, 3Department of Physics,
East Carolina University, Greenville, NC, USA 27858 A
Introduction
Drum fish (Family Sciaenidae) are known for their sound production during mating, from which the
family derives its name (Fish and Mowbray 1970). Members of the drum family are dominant
species in the large and valuable commercial and recreational fisheries in North Carolina and the
Southeastern USA. Recently, concerns have been raised about the decline in the population and
spawning stock of some sciaenids, especially the red drum, Sciaenops ocellatus (Ross et al. 1995).
One management option that has been suggested is to create spawning reserves, but spawning
areas must be surveyed first in order to protect them. Sciaenid fishes held in captivity produce
species-specific sounds associated with spawning behavior (Guest & Laswell 1978; Connaughton
and Taylor 1996, Sprague et al. 2000) and recently spawned eggs and sounds co-occur in field sam-
ples (Mok and Gilmore 1983, Luczkovich et al. 1999). Spectral analysis of these sounds allows us to
identify each sciaenid species based on their sound production, even when they co-occur in the
same area (see Sprague et al 2000, Sprague and Luczkovich these proceedings). Because sounds are
produced by male fishes in the Sciaenidae in communication during courtship and spawning, we
are able to use these sounds as an indicator of spawning areas. Here we report on how we used
passive acoustic survey techniques for mapping spawning areas of red drum, weakfish (Cynoscion
regalis), spotted seatrout (C. nebulosus) and silver perch (Bairdiella chrysoura) in Pamlico Sound, NC.
Methods
Sounds of sciaenid fishes were recorded in two ways: 1) a hydrophone and recording system
deployed from a small boat that was able to move from station to station; and 2) a hydrophone
array system on a remotely operated vehicle (ROV) with low-light video capabilities. From May
through September during 1997 and 1998, we used an InterOcean (902) Calibrated Acoustic
Listening System [consisting of a gain-adjustable pre-amp, a hydrophone, and an overall sound
pressure level meter] and a Sony (TCD-D8) Digital Audio Tape recorder to record from a small boat
at fixed stations in Pamlico Sound for up to 5 min per station after sunset on monthly intervals. The
— 59 —
Proceedings from the International Workshop on the Applications of Passive Acoustics to Fisheries
hydrophone was suspended over the side of the boat at a depth of 1 m. In order to confirm that the
sites where we recorded sounds were spawning areas, we conducted ichthyoplankton surveys at
the hydrophone stations immediately after each sound recording ended. A 28-cm diameter bongo
net with 500 µm mesh was towed at the surface for 5 min to capture the buoyant eggs. In May of
2001, we used a Phantom S2 ROV with low-light video and a calibrated International Transducer
Corporation (ITC-4066) hydrophone array to record the sound production of a silver perch in situ.
The hydrophone array was mounted on the ROV on a 1.5 m long boom. The pre-amplified signal
from the hydrophone array was sent up the 900-foot ROV umbilical cord to an audio and video
recorder on board the boat. Although we used a four-hydrophone array, which was originally
intended to help localize fish sounds, only one hydrophone (hydrophone number 4 located on the
far right side of the boom as viewed from the point of view of the video camera) was selected for
recording in this study. All sound recordings were resampled at 24 kHz from the original tapes
using a National Instruments A/D board. We used 1024-point Fast-Fourier-Transforms (FFTs) to
obtain spectrograms and estimates of overall sound pressure levels. To generate the spectrograms,
we used Virtual Instruments written for use with LabView data acquisition software and
Mathematica for creating plots. Statistical analysis was done using Systat 10 (Sprague et al. 2000).
Results
We detected the spawning aggregations of silver perch, weakfish, spotted seatrout, and red drum in
Pamlico Sound during both 1997 and 1998. Male silver perch were detected on both the eastern
and western side of Pamlico Sound, but were loudest at the inlet stations during May and June of
both years (Figure 1a). The male weakfish were detected making their characteristic “purring”
sounds only at stations on the eastern side of Pamlico Sound, near Ocracoke and Hatteras Inlets in
May through August of both years, but the peak calling was in May and June (Figure 1b). Spotted
seatrout were found producing their grunts at stations on both sides of the sound from June
through September, but were more regularly recorded near the Bay River on the western side of
Pamlico Sound in July of both years (Figure 1c). Red drum were heard both at the inlets and on the
western side of the sound in August through September both years, but they were loudest in
September near the mouth of the Bay River in the western side of the sound (Figure 1d). The overall
picture is one of a seasonally shifting use of specific areas near river mouths and inlets by the four
species, with distinct peak spawning times for each species. To demonstrate that these sounds are
associated with spawning activity, we collected sciaenid type eggs in the areas where we had
recorded fish sounds. The overall sound pressure level (in dB re 1 µPa) at each station was directly
correlated with the log10 transformed sciaenid type egg density (Figure 2, r = 0.61). This suggests
that the sounds (produced by male fish) and the recently spawned sciaenid eggs (produced by
female fish) are associated in space and time, an indication that the sounds are associated with
spawning.
The low-light capabilities of the video camera of the Phantom S2 ROV allowed us to see fish as they
made their sounds. Thus, we were able to measure the sound production by silver perch when they
were a known distance from the hydrophone. In this way, we were able to determine the sound
— 60 —
Proceedings from the International Workshop on the Applications of Passive Acoustics to Fisheries
— 61 —
Proceedings from the International Workshop on the Applications of Passive Acoustics to Fisheries
source level for an individual fish in situ, which is a necessary first step for modeling sound produc-
tion and propagation. In May 2001, we had the opportunity to capture a single silver perch on video
while it passed in front of the ROV and the hydrophone, producing some of the loudest sounds that
we had recorded during our surveys. The ROV was deployed in Wallace Channel, near Ocracoke
Inlet, at a depth of 28 feet, in an area where we had previously recorded loud vocalizations of both
silver perch and weakfish. Poor water clarity and strong currents at this site limited the camera’s
ability to see and the mobility of the ROV, which was deployed with a down-weight rig to hold near
to the bottom during the tidal current shifts. On May 5, 2001 at 21:18:05, we recorded a calling male
silver perch and measured the sound pressure level at hydrophone #4 when the fish was swimming
through (from left to right) the viewing field of the low-light video (Figure 3). At this point, the
sound pressure level was 126 dB re 1µPa. At 21:18:15, after the fish swam across the video field of
view, and closer to hydrophone # 4, which was on the boom to the right, the sound pressure level
was measured at 129 dB re 1µPa. Thus, the overall sound pressure level increased as the fish (sound
source) got closer to the hydrophone.
Discussion
The passive acoustic approach we have described is limited to soniferous fishes, but almost all sci-
aenids fall into this category. Soniferous sciaenid fishes produced sounds during spawning in
Pamlico Sound, and these general areas have been mapped. Weakfish and silver perch call com-
monly near Hatteras and Ocracoke inlets, peaking in May and June, whereas spotted seatrout were
commonly detected calling throughout the summer in both eastern and western Pamlico Sound,
peaking in July. Red drum were less commonly detected by passive acoustics than the other
species of sciaenids, perhaps due to their declining spawning stocks; they were only detected at the
inlets and in western Pamlico Sound in August and September, with the greatest sound production
at the mouth of the Bay River in September. Sciaenid-type egg abundance was correlated to over-
all sound pressure level (loudness) of sciaenid drumming in field surveys, suggesting that egg pro-
duction could be estimated from sound production. This passive acoustic approach to estimating
spawning stock relative abundance would be useful to fishery biologists attempting to verify the
variations in spawning stock sizes from year to year. No estimates of absolute fish abundance can
be made at the present time; but biomass estimation may be possible in the future if active
acoustics were also used.
From the ROV hydrophone measurement of sound source levels, we can now estimate the distance
over which fish sounds can be detected. For an individual silver perch calling 1 m from the
hydrophone at 129 dB re 1 µPa, (assuming a cylindrical spreading model, where rmax is the radius
of the cylinder, see Luczkovich et al. 1999), we can now estimate rmax = 10(SPL source - SPL background)/10 = 79 m.
However, this cylindrical spreading model assumes that sound waves will propagate through water
with constant temperature and salinity and a uniform depth, conditions that are unlikely to occur at
the inlets. Consequently, we may be over-estimating the distance which we can detect sounds. It is
also possible that sound may be channeled further than this due to particular bathymetric and
water stratification conditions peculiar to Pamlico Sound and the inlets.

— 62 —
Proceedings from the International Workshop on the Applications of Passive Acoustics to Fisheries
References
Connaughton, M. A. and M. H. Taylor. 1996. Drumming, courtship, and spawning behavior in captive
weakfish, Cynoscion regalis. Copeia 1996, 195-199
Fish, M. P. and W. H. Mowbray. 1970. Sounds of Western North Atlantic Fishes, The Johns Hopkins
Press, Baltimore and London, 194 pp.
Guest, W. C. and J. L. Lasswell. 1978. A note on courtship behavior and sound production of red drum.
Copeia 1978, 337-338.
Luczkovich, J. J., M.W. Sprague, S. E. Johnson, and R. C. Pullinger. 1999. Delimiting spawning areas of
weakfish, Cynoscion regalis (Family Sciaenidae) in Pamlico Sound, North Carolina using passive
hydroacoustic surveys. Bioacoustics 10, 143-160.
Luczkovich, J. J., H. J. Daniel III, M. Hutchinson, T. Jenkins, S. E. Johnson, R. C. Pullinger, and M.W.
Sprague. 2000. Sounds of sex and death in the sea: bottlenose dolphin whistles silence mating cho-
ruses of silver perch. Bioacoustics 11, 323-334.
Mok, H. K. and R. G. Gilmore. 1983. Analysis of sound production in estuarine aggregations of
Pogonias cromis, Bairdiella chrysoura, and Cynoscion nebulosus (Sciaenidae). Bulletin of the Institute
of Zoology, Academia Sinica. 22, 157-186.
Sprague, M. W., J.J. Luczkovich, R. C. Pullinger, S. E. Johnson, T. Jenkins, and H. J. Daniel III. 2000. Using
spectral analysis to identify drumming sounds of some North Carolina fishes in the family
Sciaenidae. Journal of the Elisha Mitchell Society 116, 124-145.
Ross, J. L., Stevens, T. M. and Vaughan, D. S. 1995. Age, growth, reproductive biology, and population
dynamics of red drum (Sciaenops ocellatus) in North Carolina waters. Transactions of the American
Fisheries Society 124, 37-54.

— 63 —
Proceedings from the International Workshop on the Applications of Passive Acoustics to Fisheries
Illustrations and Diagrams
Figure 3. Spectrogram of 24-s segment of the ROV audio track from hydrophone #4, recorded 5 May 2001, beginningat 21:18:00. The sound source levels (in sound pressure in dB re 1 µPa) are shown for two times at which the silverperch first appears in the ROV video camera field of view (at 5-6 s) and just after it passed out of view of the camera,when it was the loudest (at 16-17 s)
Figure 1 Maps of Pamlico Sound sciaenid species’ spawning areas and times as determined by hydrophone surveys:a) silver perch (triangles), peaking in May and June; b) weakfish (circles) peaking in May and June; c) spotted seatrout(squares) peaking in July; and red drum (pentagons) peaking in September.
Figure 2 Log 10 transformed sciaenid-typeegg production plotted versus sound pressurelevel (db re 1 µPa). Line fitted with a locallyweighted regression (LOWESS).

Is acoustic calls a premating reproductive barrier between two northeast
Atlantic cod (Gadus morhua) groups—a review
Jarle Tryti Nordeide1 and Jens Loss Finstad2
1Faculty of Fisheries and Natural Sciences, Bodø Regional University, N-8049 Bodø, Norway.2Master student at: Department of Fisheries and Marine Biology, University of Bergen, Norway
Summary
This paper reviews the first attempts to test the hypothesis that spawning calls of male migratory
“Arctic” and a stationary “Coastal” cod group, which are sympatric during the spawning season, is a
premating behavioural reproductive barrier. As predicted from the hypothesis, a hushed hubbub of
sound with a transient character, band-width and harmonic spacing typical of cod calls, was
revealed at a major spawning ground during the spawning period but not six months later.
Moreover, individual calls from male cod kept in tanks varied a lot both in harmonic spacing and
duration, from 42 to 79 Hz and 0.11 to 1.25 s, respectively. Such individual variation in calls is expect-
ed if females choose mate on the basis of their calls. However, the results so far has failed to support
the third prediction, since no differences have been found between the calls of the two groups, nei-
ther in harmonic spacing, duration, or temporal structure of the calls.
Introduction
Northeast Atlantic cod consist of two stocks, the Northeast Arctic, or “Arctic” cod, and the Norwegian
coastal cod, or “Coastal” cod (Rollefsen 1934). Arctic cod migrate from the feeding areas in the
Barents Sea to the spawning areas along the Norwegian coast and the most important spawning
area is off the Lofoten Islands where the main spawning occurs in March and April (Bergstad & al.
1987). Coastal cod inhabit coastal areas and fjords, migrate short distances and spawns in a large
number of fjords along the Norwegian coast (Rollefsen 1954), including off the Lofoten Islands
(Hylen 1964). Both cod groups spawn in March and April and mature speciemens are sympatric dur-
ing spawning at the major spawning grounds off the Lofoten Islands (Nordeide 1998). A controver-
sial topic during decades has been whether or not the two cod groups interbreed, and a majority of
studies conclude that they rarely do (see references in Nordeide & Pettersen 1998). If so, active part-
ner choice is required, and lekking has recently been suggested to best describe the cod’s mating
system (Hutchings & al. 1999; Nordeide & Folstad 2000).
Møller (1968) suggested that active partner choice based on acoustic calls may be an behavioural
mechanism which prevents interbreeding between the two cod groups. The aim of this paper is to
— 64 —
Proceedings from the International Workshop on the Applications of Passive Acoustics to Fisheries
summarize the first attempts to test predictions derived from Møller’s hypothesis. The predictions
are that (i) recordings from major cod spawning grounds should reveal sound with characteristics
typical of cod whereas much less sound should be revealed outside the spawning season, (ii) calls
from individual cod should show considerable variation, and (iii) calls from Arctic and Coastal cod
should differ.
Material and methods
To study sound at a major spawning ground, recordings were carried out during the night at five
stations off the Lofoten Islands at 68o13.0’N 14o38.7’E in Northern Norway, during the spawning sea-
son 8 and 9 April 1997, and half a year later on 4 September 1997 (Nordeide & Kjellsby 1999). The
measuring hydrophone with a 32 dB gain built-in preamplifier had a total sensitivity of -152 dB re 1
V/µPa within the frequency range of 16 Hz to 2 kHz. In order to emphasize the transient character of
the sound the digital recordings were analysed with Short-time Fourier Techniques (STFT), at the
Norwegian Defence Research Establishment (Nordeide & Kjellsby 1999).
To compare the calls from the two groups, recordings were carried out in land-based tanks in 1998
to 2001 (Finstad, 2002.). Speciemens of the Arctic and Coastal cod were caught by trawl and trans-
ferred to tanks where recordings were carried out during the spawning period in 1998 - 2001. The
smallest male used was 53 cm and the largest male was 94 cm long, whereas the smallest and
largest females were 51 cm and 104 cm long, respectively. The average length of the five cod groups
varied from 74.2 cm to 84.0 cm for males, and from 68.8 cm to 90.5 cm for females. Most recordings
were from three 6 m diameter fibreglass tanks, but a 3 m diameter fibreglass tank was also used.
Water level was 1.4 - 1.5 m in all tanks. Recording equipment was a 1 inch piezoceramic spherical
hydrophone with a sensitivity of -198 dB ref 1V 1µPa, a Levell preamplifier type TA 601 with 60 dB
gain, and a Sony TCD-D100 digital tape recorder. In 1998, the recordings were carried out with 12
speciemens (six Coastal males) in the experimental tank, whereas seven Arctic cod (5 males) where
present in 1999. After the first years of experience we had identified two major problems: (i) we
were not able to identify which cod produced the calls, and (ii) relatively few grunts had been
recorded. In 2000 and 2001 we therefore chose to first record grunts with all cod in each group kept
together, to increase the number of grunts. Thereafter, we split the groups of fish into a total of 10
smaller sub-groups to increase the minimum number of individual cod which could possibly pro-
duce the grunts. The groups in 2000 and 2001 consisted of 8 (3 males), 25 (19 males) and 22 (7
males) cod, respectively. The sub-groups consisted of from 4 (2 males) to 16 (11 males) cod. Towards
the end of the spawning season the fish were killed. Examination of their otoliths by the Institute of
Marine Research in Bergen, revealed that the recordings were carried out with groups and sub-
groups consisting of (i) only male Coastal cod with or without the presence of Arctic females, (ii)
only male Arctic cod with or without the presence of Coastal females, and (iii) a mixture of Coastal
and Arctic males and females. These three alternative combinations are referred to as “Coastal-vocal”,
“Arctic-vocal” and “Mix-vocal” groups respectively, since only males produce sound during the
spawning period (Brawn 1961c, Hawkins & Rasmussen 1978, see also Templeman & Hodder 1958,
Engen & Folstad 1999). The number of individual cod (statistical “N”) which could have produced the
— 65 —
Proceedings from the International Workshop on the Applications of Passive Acoustics to Fisheries

recorded grunts were minimum 3 and maximum 12 in the “Coastal-vocal” group, minimum 2 and
maximum 7 in the “Arctic-vocal”, and minimum 4 and maximum 22 in the “Mix-vocal” groups.
Analysis by Avisoft-SASLabPro v. 3.74 provided estimates of harmonic spacing and duration of the
grunts. Temporal structure of 78 recorded high quality grunts were analysed from oscillograms.
Parameters included were number of downward peaks, time-intervals between peaks, and duration
of the grunt. These parameters were analysed by Principal Component Analysis by the software “The
Unscrambler” v. 7.5.
Results and Discussion
Field recordings provide support for the hypothesis that acoustic communication is important dur-
ing cod spawning. Sound recordings at the major spawning ground off the Lofoten Islands revealed
a hushed hubbub of sound, at approximately 40 - 500 Hz during the spawning period (Fig. 1a). Much
less sound was revealed in September (Fig. 1b) when no cod spawn and migratory cod had emigrat-
ed to the Barents Sea. Nordeide & Kjellsby (1999) argues that this sound most likely is made by
spawning cod since (1) The sound activity is highest in the frequency range where it has been sug-
gested cod communicate (Chapman & Hawkins 1973; Hawkins & Rasmussen 1978). (2) The sound
above 50 Hz had a transient character as expected for cod grunts. (3) More than ca. 50 million male
cod spawned off the Lofoten Islands in April 1997, and recordings were made where the Institute of
Marine Research in Bergen located the highest densities of spawning cod. (4) Cod totally dominat-
ed, by constituting more than 98 % by wet weight, the experimental and commercial catches in the
area the seven days before, during and after the recordings (Nordeide & Kjellsby 1999).
Variation in calls between individual cod kept in tanks is as expected under the hypothesis that
acoustic communication is important during female mate choice. Grunts from cod kept in tanks
vary in harmonic spacing from 42 Hz to 79 Hz, and in duration from 0.11 s to 1.25 (Table 1). The two
grunts with the lowest and highest harmonic spacing came from two different individuals, since
they were recorded from two different sub-groups. The shortest and longest calls were also pro-
duced by two different individuals. This shows that different cod individuals may grunt at different
frequencies and durations, but we cannot tell anything about each individual cod’s possibility to
vary their calls.
Frequency (Hz) Duration (s)
N Mean Min Max N Mean Min Max
CC-vocal1 18 53.4 47 60 11 0.33 0.13 0.94
NAC-vocal2 11 55.7 50 60 11 0.31 0.11 0.74
MIX-vocal3 126 51.5 42 79 95 0.22 0.13 1.25
All grunts 155 52.1 42 79 116 0.24 0.11 1.25
— 66 —
Proceedings from the International Workshop on the Applications of Passive Acoustics to Fisheries
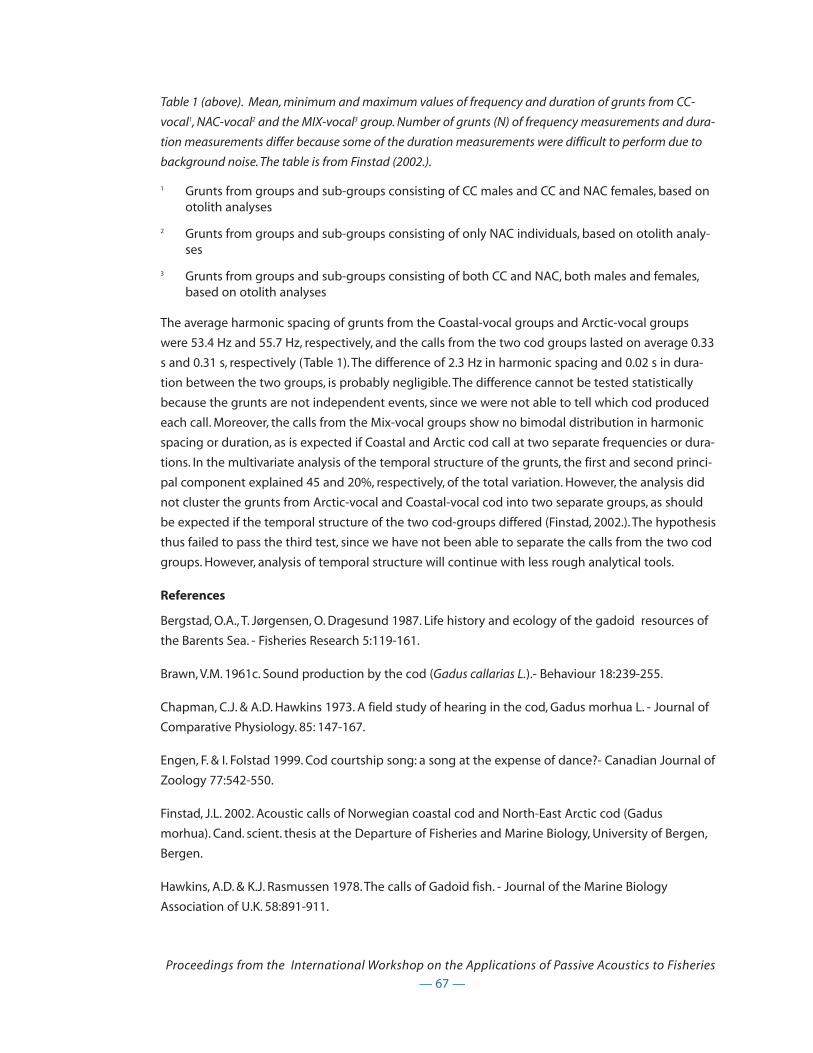
— 67 —
Proceedings from the International Workshop on the Applications of Passive Acoustics to Fisheries
Table 1 (above). Mean, minimum and maximum values of frequency and duration of grunts from CC-
vocal1, NAC-vocal2 and the MIX-vocal3 group. Number of grunts (N) of frequency measurements and dura-
tion measurements differ because some of the duration measurements were difficult to perform due to
background noise. The table is from Finstad (2002.).
1 Grunts from groups and sub-groups consisting of CC males and CC and NAC females, based onotolith analyses
2 Grunts from groups and sub-groups consisting of only NAC individuals, based on otolith analy-ses
3 Grunts from groups and sub-groups consisting of both CC and NAC, both males and females,based on otolith analyses
The average harmonic spacing of grunts from the Coastal-vocal groups and Arctic-vocal groups
were 53.4 Hz and 55.7 Hz, respectively, and the calls from the two cod groups lasted on average 0.33
s and 0.31 s, respectively (Table 1). The difference of 2.3 Hz in harmonic spacing and 0.02 s in dura-
tion between the two groups, is probably negligible. The difference cannot be tested statistically
because the grunts are not independent events, since we were not able to tell which cod produced
each call. Moreover, the calls from the Mix-vocal groups show no bimodal distribution in harmonic
spacing or duration, as is expected if Coastal and Arctic cod call at two separate frequencies or dura-
tions. In the multivariate analysis of the temporal structure of the grunts, the first and second princi-
pal component explained 45 and 20%, respectively, of the total variation. However, the analysis did
not cluster the grunts from Arctic-vocal and Coastal-vocal cod into two separate groups, as should
be expected if the temporal structure of the two cod-groups differed (Finstad, 2002.). The hypothesis
thus failed to pass the third test, since we have not been able to separate the calls from the two cod
groups. However, analysis of temporal structure will continue with less rough analytical tools.
References
Bergstad, O.A., T. Jørgensen, O. Dragesund 1987. Life history and ecology of the gadoid resources of
the Barents Sea. - Fisheries Research 5:119-161.
Brawn, V.M. 1961c. Sound production by the cod (Gadus callarias L.).- Behaviour 18:239-255.
Chapman, C.J. & A.D. Hawkins 1973. A field study of hearing in the cod, Gadus morhua L. - Journal of
Comparative Physiology. 85: 147-167.
Engen, F. & I. Folstad 1999. Cod courtship song: a song at the expense of dance?- Canadian Journal of
Zoology 77:542-550.
Finstad, J.L. 2002. Acoustic calls of Norwegian coastal cod and North-East Arctic cod (Gadus
morhua). Cand. scient. thesis at the Departure of Fisheries and Marine Biology, University of Bergen,
Bergen.
Hawkins, A.D. & K.J. Rasmussen 1978. The calls of Gadoid fish. - Journal of the Marine Biology
Association of U.K. 58:891-911.
— 68 —
Proceedings from the International Workshop on the Applications of Passive Acoustics to Fisheries
Hutchings, J.A., T.D. Bishop & C.R. McGregor-Shaw 1999. Spawning behaviour of Atlantic cod, Gadus
morhua: evidence of mate competition and mate choice in broadcast spawner.- Canadian Journal
of Fisheries and Aquatic Sciences 56:97-104.
Hylen, A. 1964. Coastal cod and skrei in the Lofoten area. - Fiskeridirektoratets Skrifter Serie
Havundersøkelser, 13:27-42.
Møller, D. 1968. Genetic diversity in spawning cod along the Norwegian coast.- Hereditas 60:1-32.
Nordeide, J.T. 1998. Coastal cod and north-east Arctic cod - do they mingle at the spawning grounds
in Lofoten?- Sarsia 83:373-379.
Nordeide, J.T. & I. Folstad 2000. Is cod lekking or a promiscuous group spawner?- Fish and Fisheries
1:90-93.
Nordeide, J.T. & E. Kjellsby 1999. Sound from spawning cod at their spawning grounds.- ICES Journal
of Marine Science 56:326-332.
Nordeide, J.T. & I.H. Pettersen 1998. Haemoglobin frequencies and vertebrae numbers of cod (Gadus
morhua L.) off northern Norway - test of a population structure hypotheses.- ICES Journal of Marine
Science 55:134-140.
Rollefsen, G. 1934. The cod otolith as a guide to race, sexual development and mortality.- Rapports et
Proces-Verbaux des Reunions du Conseil International Pour l’Exploration de la Mer 88:1-6.
Rollefsen, G. 1954. Observations on the cod and cod fisheries of Lofoten.- Rapports et Proces-
Verbaux des Reunions du Conseil International Pour l’Exploration de la Mer, 136:40-47.
Templeman, W. & V.M. Hodder 1958. Variation with fish length, sex, stage of sexual maturity, and sea-
son in the appearance and volume of the drumming muscles of the swimbladder in the haddock,
Melanogrammus aeglefinus (L.).- Journal of the Fisheries Research Board of Canada. 15:355-390.

— 69 —
Proceedings from the International Workshop on the Applications of Passive Acoustics to Fisheries
Illustrations and Diagrams
Figure 1. Recordings from a major spawning ground off the Lofoten Islands, (a) during the spawning period in Apriland (b) in September when no cod spawn. Reprinted from ICES Journal of Marine Science,Vol. 56, Nordeide, J.T. & E.Kjellsby, Sound from spawning cod at their spawning grounds, 326-332, 1999, by permission of the publisherAcademic Press.
Applications of underwater acoustics data in fisheries management for
spotted seatrout, Cynoscion nebulosus, in estuaries of South Carolina
Bill Roumillat and Myra Brouwer
Marine Resources Research Institute, South Carolina Department of Natural Resources,
217 Ft. Johnson Rd., Charleston, SC 29412.
Introduction
The spotted seatrout, Cynoscion nebulosus, is an estuarine-dependent member of the family
Sciaenidae. Spotted seatrout are year-round residents of estuaries along the South Atlantic coast
and spawning takes place inshore and in coastal areas (McMichael and Peters, 1989; Luczkovich et
al., 1999). During summer months, male spotted seatrout produce “drumming” sounds, this resulting
from the contraction of the swimbladder by specialized muscles which are seasonally hypertro-
phied from the abdominal hypaxialis muscle mass (Fish and Mowbray, 1970; Mok and Gilmore,
1983). Direct involvement of sound production with spawning has been shown for this and other
sciaenids (Mok and Gilmore, 1983; Saucier et al., 1992; Saucier and Baltz, 1993; Luczkovich et al.,
1999). By listening to these sounds during evening hours (Holt et al. 1985) using hydrophone equip-
ment we determined the locations, seasonality and diurnal periodicity of spawning aggregations in
Charleston Harbor (Saucier et al., 1992; Riekerk et al., unpublished data).
Spotted seatrout are group-synchronous spawners with indeterminate fecundity. As such, they
release gametes in several batches over a protracted spawning season and total fecundity is not
fixed prior to the onset of spawning (Wallace and Selman, 1981). The spawning season extends
from April through September along the South Atlantic and Gulf of Mexico coasts (Overstreet, 1983;
Brown-Peterson et al., 1988; McMichael and Peters, 1989; Wenner et al., 1990; Saucier and Baltz,
1993). As in other indeterminate spawning fish, annual fecundity in this species is dictated by the
number of oocytes released during each spawning event (batch fecundity, BF) and the number of
such spawning events during the course of the season (spawning frequency, SF). Estimation of
annual fecundity (AF) is intuitively necessary to determine the contribution of an entire spawning
season, and is made even more useful for fisheries management purposes if separated by size class
or age cohort within a population (Prager et al., 1987; Zhao and Wenner, 1995).
Behavior patterns based on acoustic data enabled us to target females in imminent spawning con-
dition, then carry out oocyte counts for batch fecundity estimation. Additional random sampling in
other estuarine areas of the SC coast provided the data necessary to estimate spawning frequency
— 70 —
Proceedings from the International Workshop on the Applications of Passive Acoustics to Fisheries

for each of the three dominant age classes (ages 1-3) in our waters. Ultimately, our annual fecundity
estimates for each age class will facilitate management of this species in South Carolina.
Estimation of batch fecundity
We conducted sampling for batch fecundity studies during two consecutive afternoons fortnightly
from the middle of April through the first week of September 1998, 1999 and 2000. We deployed a
trammel net from a shallow water boat at pre-selected sites in Charleston Harbor. Sites were chosen
based on proximity to known spawning locales established through hydrophone work. Water
depth at the sampling sites ranged from 0.3 to 1.5 meters and sampling was conducted during the
afternoon (1400-1800h) high tide. Male spotted seatrout, identified by their drumming sounds, were
measured and released on site. Females were brought back to the laboratory for processing. We
recorded standard life-history parameters for each specimen, preserved sagittal otoliths for aging
and removed sections of the posterior portion of each ovary for histological work. In addition, whole
ovaries that evidenced oocyte maturation were fixed in 10% buffered seawater formalin for enu-
meration of hydrated oocytes (Hunter and Macewicz, 1985).
One hundred and thirty-five ovaries were used to estimate batch fecundity of spotted seatrout aged
1-3. We re-weighed preserved ovaries to the nearest 0.01 g and randomly extracted 130-150 mg
aliquots from three of eight possible regions in the ovary (four per lobe). We counted hydrated
oocytes and used their mean number per subsample to estimate the total number of oocytes in the
ovary. To investigate the relationships between batch fecundity and length, somatic weight (ovary-
free body weight), and age we used linear regression on log-transformed data. We used ANOVA on
ranked data for comparisons of mean batch fecundity among ages, months and years.
As expected, we found a significant difference in mean batch fecundity among age classes (Kruskal-
Wallis test, P< 0.05). Age 1 spotted seatrout, produced an average of 145,452 oocytes per spawn.
Fish aged 2 and 3 spawned an average of 291,123 and 529,976 oocytes per batch, respectively.
Therefore, mean batch fecundity was compared among months and years for each age class sepa-
rately. There were no significant inter-annual or monthly variations in mean batch fecundity for any
of the three age classes.
Pooling data across years, total length explained 69% of the variability in spotted seatrout batch
fecundity. Batch fecundity showed a similarly strong relationship to female somatic (ovary-free)
weight but did not relate quite as strongly to age. The equations below describe these relation-
ships:
Log BF = 3.134(Log TL) - 2.653 (r2 = 0.686) P<0.05
Log BF = 1.011(Log OFWT) + 2.709 (r2 = 0.675) P<0.05
Log BF = 0.288(Age) + 4.844 (r2 = 0.586) P<0.05
Calculation of spawning frequency
— 71 —
Proceedings from the International Workshop on the Applications of Passive Acoustics to Fisheries

We obtained samples for spawning frequency determination during the course of stratified random
trammel net sampling in several estuaries along the SC coast. Each stratum was sampled once a
month throughout the year during ebbing tide. However, we only used spotted seatrout samples
obtained during summer months (1 May through 31 August) for this study.
We calculated monthly spawning frequencies for age classes 1-3 using the postovulatory follicle
method of Hunter and Macewicz (1985) where spawning frequency is the inverse of the proportion
of ovaries with postovulatory follicles (POF) < 24 h old among mature and developing females.
Over a decade of sampling the Charleston Harbor estuarine system we have observed that, among
females captured in shallow water during the spawning season, oocyte maturation begins at about
1200h. From mid to late afternoon these females leave the marsh edge for deeper water to spawn.
Our hydrophone surveys have indicated that spawning typically begins around 1800h and ceases
around 2200h. Females then return to feeding grounds near the marsh where they are available to
our sampling gear. Knowledge of this reproductive behavior enabled us to target spotted seatrout
in the mid-late afternoon specifically to capture fish with late-maturing oocytes for batch fecundity
estimation. Females that were back in the shallows after having spawned the previous evening were
available for capture during daytime sampling. In addition, we carried out round-the clock sampling
on two occasions during the 2000-spawning season. Samples from this effort allowed for the cali-
bration of criteria used to age POFs.
A total of 941 female spotted seatrout, captured during the spawning seasons of 1998,1999 and
2000 was examined to determine spawning frequency. Females used to determine SF ranged in
length from 240 mm to 542 mm (mean 340 mm) and in age from 1 to 5. However, 97% of the speci-
mens belonged to age classes 1-3. Thus, reproductive parameters are presented only for these age
classes.
Small sample sizes prevented calculation of monthly spawning frequencies for each age class by
year. Thus, data for all three years were pooled to obtain a single monthly spawning frequency esti-
mate by age class (Table 1). Overall, spotted seatrout ages 1-3 in South Carolina spawned every 4.4
days or roughly 28 times during the reproductive season.
Estimation of annual fecundity
We calculated monthly egg production (MEP) by multiplying the monthly spawning frequency by
the mean monthly batch fecundity for each specimen. Because not all age-1 female trout were
mature at the beginning of the spawning season, the fraction of mature age-1 females obtained
from a previous study (Wenner, unpublished data) was used to refine the MEP estimate. MEP esti-
mates were then summed to arrive at an annual fecundity estimate for each age class (Table 1). We
used linear regression on log-transformed data to investigate the relationship between annual
fecundity and age and thus predict annual fecundity for spotted seatrout aged 4 and 5. Age
explained 98% of the variability in annual fecundity for age classes 1-3. From this relationship, the
predicted annual fecundities for age classes 4 and 5 were 43,752,211 and 101,157,945, respectively.
— 72 —
Proceedings from the International Workshop on the Applications of Passive Acoustics to Fisheries
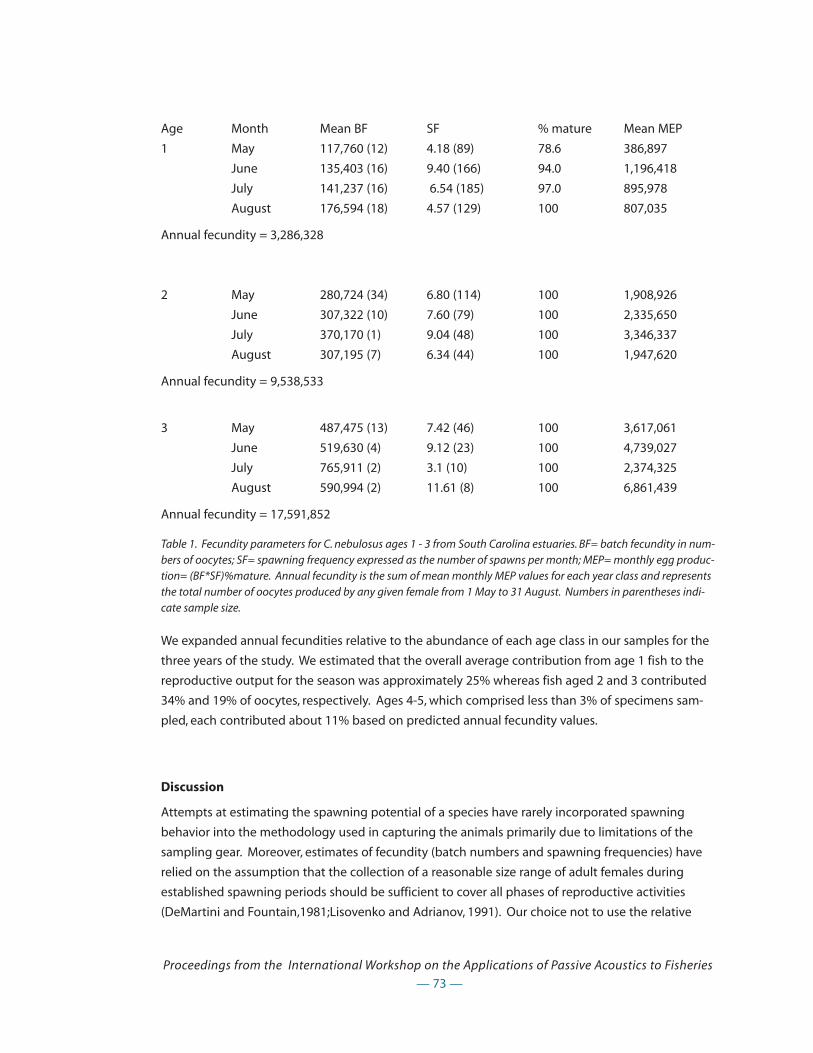
Age Month Mean BF SF % mature Mean MEP
1 May 117,760 (12) 4.18 (89) 78.6 386,897
June 135,403 (16) 9.40 (166) 94.0 1,196,418
July 141,237 (16) 6.54 (185) 97.0 895,978
August 176,594 (18) 4.57 (129) 100 807,035
Annual fecundity = 3,286,328
2 May 280,724 (34) 6.80 (114) 100 1,908,926
June 307,322 (10) 7.60 (79) 100 2,335,650
July 370,170 (1) 9.04 (48) 100 3,346,337
August 307,195 (7) 6.34 (44) 100 1,947,620
Annual fecundity = 9,538,533
3 May 487,475 (13) 7.42 (46) 100 3,617,061
June 519,630 (4) 9.12 (23) 100 4,739,027
July 765,911 (2) 3.1 (10) 100 2,374,325
August 590,994 (2) 11.61 (8) 100 6,861,439
Annual fecundity = 17,591,852
Table 1. Fecundity parameters for C. nebulosus ages 1 - 3 from South Carolina estuaries. BF= batch fecundity in num-bers of oocytes; SF= spawning frequency expressed as the number of spawns per month; MEP= monthly egg produc-tion= (BF*SF)%mature. Annual fecundity is the sum of mean monthly MEP values for each year class and representsthe total number of oocytes produced by any given female from 1 May to 31 August. Numbers in parentheses indi-cate sample size.
We expanded annual fecundities relative to the abundance of each age class in our samples for the
three years of the study. We estimated that the overall average contribution from age 1 fish to the
reproductive output for the season was approximately 25% whereas fish aged 2 and 3 contributed
34% and 19% of oocytes, respectively. Ages 4-5, which comprised less than 3% of specimens sam-
pled, each contributed about 11% based on predicted annual fecundity values.
Discussion
Attempts at estimating the spawning potential of a species have rarely incorporated spawning
behavior into the methodology used in capturing the animals primarily due to limitations of the
sampling gear. Moreover, estimates of fecundity (batch numbers and spawning frequencies) have
relied on the assumption that the collection of a reasonable size range of adult females during
established spawning periods should be sufficient to cover all phases of reproductive activities
(DeMartini and Fountain,1981;Lisovenko and Adrianov, 1991). Our choice not to use the relative
— 73 —
Proceedings from the International Workshop on the Applications of Passive Acoustics to Fisheries

occurrence of hydrated oocytes to estimate spawning frequencies was based on our knowledge of
the spawning behavior of this species. Previous work conducted in the study area (Riekerk et al.,
unpublished data) established the location and timing of spawning activities allowing us to focus
our sampling efforts in shallow waters near known spawning locations to collect females with late
maturing oocytes. This constant loss of late maturing females from the fish available to our nets in
shallow water would have decreased the relative abundance of this maturity stage in our samples.
Therefore, using the relative number of late maturing oocytes for spawning frequency calculations
would have resulted in an underestimate of spotted seatrout reproductive potential.
Because obtaining representative numbers of animals with late-maturing oocytes is not often feasi-
ble, researchers have relied on the relative abundance of postovulatory follicles to calculate spawn-
ing frequencies (i.e.Hunter and Goldberg, 1980; Hunter et al.,1986; Brown-Peterson et al., 1988;
Fitzhugh et al., 1993; Taylor et al., 1998; Macchi and Acha, 2000; Brown-Peterson and Warren, 2001;
Nieland et al., 2002). This method has depended on the ability to time the disappearance of these
structures. Our diurnal sampling of reproductively active spotted seatrout during warm water condi-
tions allowed us to establish criteria to accurately estimate the age of POFs throughout the spawn-
ing season. Furthermore, we were able to verify our assessments by sampling around the clock on
two occasions to collect fish over the time period immediately following a spawn. This would not
have been possible had we failed to establish and verify the location of spawning aggregations with
the use of passive acoustics.
The main impetus behind this study was to establish realistic annual fecundity estimates by age
class that could be used in predictive modeling of the spotted seatrout population in coastal South
Carolina. Herein, we present equations relating fecundity to length and age that can be used to esti-
mate the reproductive potential for each age class of spotted seatrout along the South Carolina
coast. The average season-long oocyte output of age 1 fish was one-third that of age 2 (~3.28 M vs.
9.5 M). When analyzed in relation to the abundance of the other age classes, age 2 fish were predict-
ed to contribute more overall fertilizable oocytes to the environment. Even though the average age
3 fish produced almost twice as many oocytes (17.5 M) than the average age 2, the abundance of
age 3 trout in our estuarine samples was low enough to make their overall contribution to a sea-
son’s spawning effort only half that of 2 year-olds. This exemplifies the potential for error in estimat-
ing reproductive output based on the abundance of year classes, especially that of younger fish.
Acknowledgements
We thank members of the Inshore Fisheries Section of the South Carolina Department of Natural
Resources for assisting in field data collection throughout this study (Dr. C. Wenner, J. Archambault,
H. von Kolnitz, W. Hegler, E. Levesque, L. Goss, C. McDonough, C. Johnson, A. Palmer). Dr. C. Wenner, H.
von Kolnitz and E. Levesque conducted age assessments. Histological processing was provided by C.
McDonough, R. Evitt, A. Palmer and W. Hegler. C. McDonough, T. Piper, K. Maynard and R. Evitt assist-
ed with oocyte counts. J. Archambault coordinated data management and Dr. C. Wenner and E.
Levesque provided helpful suggestions on the manuscript. Funding for this study was provided by
the National Marine Fisheries Service under MARFIN grant #NA77FF0550.
— 74 —
Proceedings from the International Workshop on the Applications of Passive Acoustics to Fisheries

References
Brown-Peterson, N., P. Thomas, and C. Arnold. 1988. Reproductive biology of the spotted seatrout,
Cynoscion nebulosus, in South Texas. Fish. Bull. 86:373-387.
Brown-Peterson, N. J. and J. W. Warren. 2001. The reproductive biology of spotted seatrout,
Cynoscion nebulosus, along the Mississippi Gulf coast. Gulf. Mex. Sci. 2001(1):61-73.
DeMartini, E. E., and R. K. Fountain. 1981. Ovarian cycling frequency and batch fecundity in the
queenfish, Seriphus politus: attributes representative of spawning fish. Fish. Bull. 79:547-560.
Fish, M. P., and W. H. Mowbray. 1970. Sounds of western North Atlantic fishes. A reference file of bio-
logical underwater sounds. The Johns Hopkins Press, Baltimore and London.
Fitzhugh, G. R., B. A. Thompson, and T. G. Snider. 1993. Ovarian development, fecundity and spawning
frequency of black drum, Pogonias cromis, In Louisiana. Fish. Bull. 91:244-253.
Holt, G.J., S. A. Holt, and C. R. Arnold. 1985. Diel periodicity of spawning in sciaenids. Mar. Ecol. Prog.
Ser. 27:1-7.
Hunter, J. R., and S. R. Goldberg. 1980. Spawning incidence and batch fecundity in northern anchovy,
Engraulis mordax. Fish. Bull. 77:641-652.
Hunter, J. R., and B. J. Macewicz. 1985. Measurement of spawning frequency in multiple spawning
fishes. In: An egg production method for estimating spawning biomass of pelagic fish: application to
the northern anchovy Engraulis mordax (R. Lasker, ed.) p. 79-94. U. S. Dep. Commer., NOAA Tech. Rep.
NMFS 36.
Hunter, J. R., B. J. Macewicz, and H. R. Sibert. 1986. The spawning frequency of skipjack tuna,
Katsuwonus pelamis, from the South Pacific. Fish. Bull. 84:895-903.
Lisovenko, L. A., and D. P. Andrianov. 1991. Determination of absolute fecundity of intermittently
spawning fishes. Voprosy ikhtiologii 31:631-641.
Luczkovich, J. J., H. J. Daniel III and M. W. Sprague. 1999. Characterization of critical spawning habi-
tats of weakfish, spotted seatrout and red drum in Pamlico Sound using hydrophone surveys. Final
report and annual performance report F-62-2 and F-62-2. North Carolina Department of
Environment and Natural Resources, Division of Marine Fisheries, Morehead City, NC 28557.
Macchi, G. J., and E. M. Acha. 2000. Spawning frequency and batch fecundity of Brazilian menhaden,
Brevoortia aurea, in the Rio de la Plata estuary off Argentina and Uruguay. Fish. Bull. 98:283-289.
McMichael, R. H., and K. M. Peters. 1989. Early life-history of spotted seatrout, Cynoscion nebulosus
(Pisces: Sciaenidae), in Tampa Bay, Florida. Est. 12:98-110.
Mok, H. K., and R. G. Gilmore. 1983. Analysis of sound production in estuarine aggregations of
Pogonias cromis, Bairdiella chrysoura, and Cynoscion nebulosus (Sciaenidae). Bull. Inst. Zool., Acad.
Sinica (Taipei) 22:157-186.
— 75 —
Proceedings from the International Workshop on the Applications of Passive Acoustics to Fisheries
Nieland, D. L., R. G.Thomas, and C. A. Wilson. (2002). Age, growth and reproduction of spotted
seatrout in Barataria Bay, Louisiana. Trans. Am. Fish. Soc. 131:245-259.
Overstreet, R. M. 1983. Aspects of the biology of the spotted seatrout, Cynoscion nebulosus, in
Mississippi. Gulf Res. Rep. Suppl. 1:1-43.
Prager, M. H., J. F. O’Brien, and S. B. Saila. 1987. Using lifetime fecundity to compare management
strategies: a case history for striped bass. Am. J. Fish. Manag. 7:403-409.
Riekerk, G. H. M., S. J. Tyree, and W. A. Roumillat. 1997. Spawning times and locations of spotted
seatrout in the Charleston Harbor Estuarine System from acoustic surveys. Final Report to
Charleston Harbor Project, Bureau of Ocean and Coastal Resources Management, South Carolina
Department of Health and Environmental Control, Charleston.
Saucier, M. H., D. M. Baltz, and W. A. Roumillat. 1992. Hydrophone identification of spawning sites of
spotted seatrout Cynoscion nebulosus (Osteichthys: Sciaenidae) near Charleston, South Carolina. N.
Gulf Sci.12:141-145.
Saucier, M. H., and D. M. Baltz. 1993. Spawning site selection by spotted seatrout, Cynoscion
nebulosus, and black drum, Pogonias cromis, in Louisiana. Env. Biol. Fish. 36:257-272.
Taylor, R. G., H. J. Grier, and J. A. Whittington. 1998. Spawning rhythms of common snook in Florida. J.
Fish Biol. 53:502-520.
Wallace, R. A. and K. Selman. 1981. Cellular and dynamic aspects of oocyte growth in teleosts. Amer.
Zool. 21: 325-343.
Wenner, C. A., W. A. Roumillat, J. E. Moran Jr., M. B. Maddox, L. B. Daniel III and J. W. Smith. 1990.
Investigations on the life history and population dynamics of marine recreational fishes in South
Carolina: part 1. Final Report F-37. Marine Resources Research Institute, MarineResources Division,
South Carolina Department of Natural Resources, 217 Ft. Johnson Rd., Charleston, SC 29412.
Wenner, C. A. and B. Zhao. 1995. Stock assessment and fishery management of the spotted seatrout,
Cynoscion nebulosus, on the South Carolina coast. Marine Resources Research Institute, Marine
Resources Division, South Carolina Department of Natural Resources, 217 Ft. Johnson Rd.,
Charleston, SC 29412
— 76 —
Proceedings from the International Workshop on the Applications of Passive Acoustics to Fisheries
Soniferous Fishes of Massachusetts
Rodney Rountree1, Francis Juanes2, and Joseph E. Blue3
1School for Marine Science and Technology, UMASS Dartmouth, 706 Rodney French Blvd., New
Bedford, MA 02744-1221 [email protected]
2Department of Natural Resources Conservation, University of Massachusetts, Amherst, MA 01003
3President, Leviathan Legacy, Inc., 3313 Northglen Drive, Orlando, FL 32806 [email protected]
Introduction
Since the seminal work of Fish and Mowbray (1970), little advancement has been made towards the
study of soniferous fishes from the marine waters of the Northeastern United States. A review of the
literature suggests at least 51 fishes are vocal in New England waters (Table 1), although many of
these species are uncommon stragglers to these waters. Spontaneous sound production is known
from only about half of these species. However, laboratory studies are often hampered by the diffi-
culty of maintaining healthy specimens, and the difficulty of inducing natural behaviors such as
spawning under confinement. This is further complicated by the fact that many fish are primarily
vocal during the spawning season, and may not vocalize until maturity, and because vocal behavior
is usually limited to males (e.g., haddock and weakfish). The objectives of this study were to conduct
a pilot field survey of soniferous fishes in Massachusetts’s waters to determine what species are
vocal and examine temporal patterns in vocal behavior. However, because of the unexpected find-
ing of widespread calls of the striped cusk-eel on Cape Cod, this paper will focus on this enigmatic
species.
Table 1(below). Partial list of species known to be capable of sound production based on field and/or laboratorystudies, and which occur at least seasonally in New England (Long Island to Maine) estuarine and shelf waters (Fishet al. 1952, Fish and Mowbray 1970, Hawkins and Rasmussen 1978, Tavolga 1980, Mann et al. 1997). *Sound produc-tion capability assumed based on the presence of anatomical structures usually associated with vocalization. (Allspecies were not necessarily subjected to both mechanical and electrical stimulation in the Fish et al. 1952 and Fishand Mowbray 1970 studies).
Scientific name Common name Sounds produced spontaneously (S) or under either mechanical(M) or electrical (E) stimulation
Anguillidae American eel Weak: M,E and S
— 77 —
Proceedings from the International Workshop on the Applications of Passive Acoustics to Fisheries
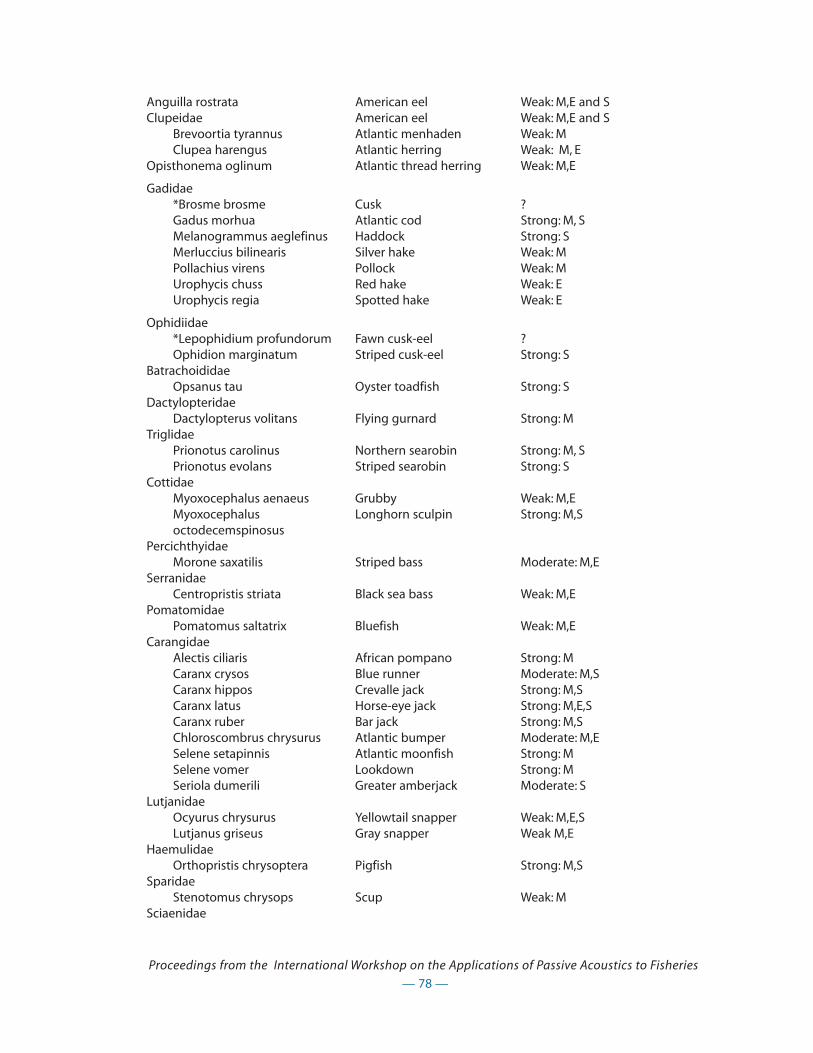
Anguilla rostrata American eel Weak: M,E and SClupeidae American eel Weak: M,E and S
Brevoortia tyrannus Atlantic menhaden Weak: MClupea harengus Atlantic herring Weak: M, E
Opisthonema oglinum Atlantic thread herring Weak: M,E
Gadidae*Brosme brosme Cusk ?Gadus morhua Atlantic cod Strong: M, SMelanogrammus aeglefinus Haddock Strong: SMerluccius bilinearis Silver hake Weak: MPollachius virens Pollock Weak: MUrophycis chuss Red hake Weak: EUrophycis regia Spotted hake Weak: E
Ophidiidae*Lepophidium profundorum Fawn cusk-eel ?Ophidion marginatum Striped cusk-eel Strong: S
BatrachoididaeOpsanus tau Oyster toadfish Strong: S
DactylopteridaeDactylopterus volitans Flying gurnard Strong: M
TriglidaePrionotus carolinus Northern searobin Strong: M, SPrionotus evolans Striped searobin Strong: S
CottidaeMyoxocephalus aenaeus Grubby Weak: M,EMyoxocephalus Longhorn sculpin Strong: M,Soctodecemspinosus
PercichthyidaeMorone saxatilis Striped bass Moderate: M,E
SerranidaeCentropristis striata Black sea bass Weak: M,E
PomatomidaePomatomus saltatrix Bluefish Weak: M,E
CarangidaeAlectis ciliaris African pompano Strong: MCaranx crysos Blue runner Moderate: M,SCaranx hippos Crevalle jack Strong: M,SCaranx latus Horse-eye jack Strong: M,E,SCaranx ruber Bar jack Strong: M,SChloroscombrus chrysurus Atlantic bumper Moderate: M,ESelene setapinnis Atlantic moonfish Strong: MSelene vomer Lookdown Strong: MSeriola dumerili Greater amberjack Moderate: S
LutjanidaeOcyurus chrysurus Yellowtail snapper Weak: M,E,SLutjanus griseus Gray snapper Weak M,E
HaemulidaeOrthopristis chrysoptera Pigfish Strong: M,S
SparidaeStenotomus chrysops Scup Weak: M
Sciaenidae
— 78 —
Proceedings from the International Workshop on the Applications of Passive Acoustics to Fisheries

Bairdiella chrysoura Silver perch Strong: M,SCynoscion nebulosus Spotted seatrout ?Cynoscion regalis Weakfish Strong: M,SLeiostomus xanthurus Spot Moderate: M,E,SMenticirrhus saxatilis Northern kingfish Weak: MMicropogon undulatus Atlantic croaker Strong: M,SPogonias cromis Black drum Strong: M,S
LabridaeTautoga onitis Tautog Moderate: E,STautogolabrus adspersus Cunner Weak: E
BalistidaeAluterus schoepfi Orange filefish Moderate: M,E,SBalistes capriscus Gray triggerfish Moderate: M,E,SMonacanthus hispidus Planehead filefish Moderate: M,E
OstraciidaeLactophrys quadricornis Scrawled cowfish Moderate: M
TetraodontidaeChilomycterus schoepfi Striped burrfish Moderate: M,ESphoeroides maculatus Northern puffer Moderate: M
MolidaeMola mola Ocean sunfish Strong: M
Methods
Recordings of fish sounds were made at 12 different sites across Cape Cod at least once between
June and October 2001. However, the primary sampling location was the Cotuit town landing
which was sampled on 18 different dates, including 5 dates on which monitoring was conducted
over the diel cycle. Except for the diel studies, most sampling was conducted around sunset, usually
beginning 1 to 2 hours before sunset and continuing for 2 to 3 hours after sunset. To obtain infor-
mation on the daily pattern of fish calls, diel studies were conducted on five different dates at Cotuit
town landing. For these studies, sounds were recorded approximately from 1300-1400, 1900-2300,
0100-0200, and 0400-0600, corresponding to afternoon, sunset, night, and sunrise periods, respec-
tively. Low cost hydrophones (Arretec, PB 3098 Bletchley, Milton Keynes MK2 2AD, United Kingdom)
were deployed from docks, piers, jetties and small boats and recorded to a hi-fi VCR. Occasionally,
recordings were made to a Sony hand-held tape recorder (model TCM-929). In addition, whenever
possible, video recordings were made simultaneously to the VCR using a hand-deployed underwa-
ter video camera equipped with infrared lights (models made by Vista Cam, 9911 Goodhue St. NE,
Blaine MN 55449, and Aqua vu, Nature Vision Inc., 213 NW 4th St., Brainerd, MN 56401). Sounds were
captured to a PC while playing back from a VCR using Cool Edit 2000 (made by Syntrillium Software
Corporation). Some spectral analyses were also conducted using Signal for Windows (Engineering
Design, 43 Newton St, Belmont, MA 02478). To quantify call frequency, 1-4 hour sound samples were
divided into 10-minute segments and a randomly selected 2 minute sound clip was obtained from
each. Calls for toadfish, striped cusk-eel and searobins were identified and counted. Reference
sound clips of unknown calls were made and used to make counts of unknown sounds by type
(e.g.,“grunt-A”, etc.).
— 79 —
Proceedings from the International Workshop on the Applications of Passive Acoustics to Fisheries
Results
Over 53 VHS and 12 cassette tapes comprising over 160 hours of recordings were collected. Calls of
striped cusk-eels, Ophidion marginatum, oyster toadfish, Opsanus tau, and striped searobin, Prionotus
evolans, dominated the observations. Several unidentified calls were also common. We are continu-
ing our efforts to identify these calls. In addition, various sources of natural and man-made noise
were also recorded including: outboard boats, barges, jet-skies, dock noises, fishing noises, depth-
finders, and gas release from sediments. Based on the occurrence of vocal choruses, we found sun-
set spawning aggregations of the striped cusk-eels at eight of 12 locations sampled across the
length of Cape Cod, including two sites (Barnstable Harbor and Provincetown Harbor) on the north
shore. Cusk-eels were recorded from the first sampling date (June 11) through the end of August,
but abruptly stopped by early September. Oyster toadfish were also already calling at the start of
the field season, but sunset choruses had ceased by mid-July. Striped searobin calls were not associ-
ated with sunset, but occurred throughout the night. Searobin calls were most frequent in August
and September but were still present in October. The cusk-eel sounds recorded in MA are nearly
identical to striped cusk-eel sounds recorded by the first author under laboratory conditions in New
Jersey (Mann et al. 1997), and more recent sounds recorded in the field and attributed to stripe cusk-
eels in Narragansett Bay (Perkins 2002) and North Carolina (Sprague and Luczkovich 2001). Our
attribution of these sounds to the striped cusk-eel is further validated by the capture of a 170 mm
TL specimen while recording sounds in Cotuit, MA in July 2001, and by subsequent sightings of a
larger individual later that same month. Cusk-eels can sometimes be observed in the shallows at
night with the aid of a spot light (Rountree, pers. Observ.). In Figure 1, chatters vary in relative ampli-
tude and range form 8 to 16 pulses and call times of 275 msec to 730 msec. The dominant frequen-
cy was 1098-1866 Hz (compared to the toadfish call at the beginning of the sequence at 171-585
Hz). A sample call recorded from Provincetown, MA on August 23, 2001 is shown in Figure 2. This
call is considerably longer (31 pulses, 1,715 msec) than those in Figure 1, but is still well within the
range characteristic of the species (Mann et al. 1997, Sprague and Luczkovich 2001). A single repre-
sentative pulse has most energy between 914 and 1524 Hz (Fig. 2).
Striped cusk-eel calls can be heard sporadically throughout the day, but calls clearly become more
frequent at sunset (Fig. 3). Peak number of calls occurred between 20 to 60 minutes after sunset,
and declined to near zero within two hours. In contrast, the oyster toadfish calls more frequently
during the day, but also exhibits a strong increase in activity associated with sunset (Figure 4).
Although data are more limited, peak activity occur 1-2 hours after sunset, with more gradual
declines through the night compared to the striped cusk-eel.
— 80 —
Proceedings from the International Workshop on the Applications of Passive Acoustics to Fisheries

Discussion
It is significant that the striped cusk-eel was the most frequently heard and widely distributed
species encountered during this study as it has previously been thought to occur from Block Island
south to Florida, with only rare stragglers occurring as far north as Cape Cod (Collette and Klein-
MacPhee 2002), despite extensive faunal surveys in the region over several decades. This finding
nicely demonstrates the usefulness of passive acoustics as a supplement to traditional survey meth-
ods, particularly for species difficult to sample in other ways. The seasonal and daily pattern of
striped cusk-eel vocal activity agrees with published laboratory findings (Mann et al. 1997, Sprague
and Luczkovich 2001). Striped cusk-eels were already chorusing by mid-June when sampling
began, but had stopped by mid-September in good agreement with previous studies. Call frequen-
cy increases rapidly at sunset developing into a loud chorus that lasts from 1 to 2 hours (Fig. 3).
Captive cusk-eels have been observed to chorus after sunset as part of courtship and spawning
behavior (Mann et al. 1997, Rountree and Bowers-Altman 2002). We believe that our observations
suggest widespread spawning of striped cusk-eels within estuaries of both the north and south
shores of Cape Cod. The species’ cryptic nocturnal behavior, and habit of remaining burrowed dur-
ing the day likely account for the failure of previous researchers using conventional sampling gears
(i.e., trawls and seine sampling mostly limited to daylight hours) to recognize its importance to the
region. At this time the northern range of the striped cusk-eel must be reconsidered. How much
farther up the cost the species extends is unknown. It is notable that Geoghegan et al. (1998)
recorded a single adult striped cusk-eel at Seabrook, New Hampshire and argued that it might rep-
resent a small local population. Therefore, we suspect that reproducing populations of this species
may occur at least to New Hampshire waters. However, the scarcity of ophidiid eggs in ichthyoplank-
ton surveys of the region is puzzling (e.g., Fahay 1992) and future studies on the distribution and
ecology of this cryptic species are needed. Boat sounds were problematic during the day, some-
times occurring during 50-99% of the sound sample clips. During these times, sounds of fishes
could not be heard above the boat’s noise. Boat noise was rare during the evening hours. The
impact of boat-associated noise on the behavior of fishes is poorly known, but it had a strong
impact on our ability to record day-time fish sounds. It is hoped that the newly available archive of
fish sounds originally published by Fish and Mowbray (1970) and recently repackaged by the
University of Rhode Island (Rountree et al. 2002) will aid in the identification of the unknown calls
recorded on Cape Cod. In summary this study has demonstrated the usefulness of even low-cost
passive acoustics technology as a tool to survey estuarine and marine fishes. Information on the
temporal and spatial patterns of fish vocal behavior can be used to gain insight into temporal and
spatial patterns in habitat use patterns by vocal species. In particular, identification of spawning
habitats through passive acoustics surveys is promising.
Acknowledgements
Megan Hendry-Brogan and Katie Anderson are thanked for diligent work in both the field and labo-
ratory to collect and process fish sound data. This project received major funding from the
Northeast and Great Lakes National Undersea Research Center, which also provided extensive logis-
— 81 —
Proceedings from the International Workshop on the Applications of Passive Acoustics to Fisheries
tical support. The Woods Hole Sea Grant College Program also provided supporting funds.
The Sounds Conservancy, Quebec-Labrador Foundation/Atlantic Center for the Environment provid-
ed a stipend for Megan’s fieldwork.
Literature Cited
Collette, B.B., and G. Klein-MacPhee. (eds.). 2002. Bigelow and Schroeder’s Fishes of the Gulf of Maine.
3rd Edition. Smithsonian Institution Press, Washington, D.C. 748 p.
Fahay, M.P. 1992. Development and distribution of cusk eel eggs and larvae in the middle Atlantic
Bight with a description of Ophidion robinsi n.sp. (Teleostei: Ophidiidae). Copeia 1992(3):799-819.
Fish, M.P., A.S. Kelsey, Jr., and W.H. Mowbray. 1952. Studies on the production of underwater sound by
North Atlantic coastal fishes. J. Mar. Res. 11:180-193.
Fish, M.P., and W.H. Mowbray. 1970. Sounds of Western North Atlantic fishes. Johns Hopkins Press,
Baltimore, MD. 205 p.
Geoghegan, P., J.N. Strube, and R. A. Sher. 1998. The first occurrence of the striped cusk eel, Ophidion
marginatum (Dekay), in the Gulf of Mexico. Northeastern Naturalist 5(4):363-366.
Hawkins, A.D. 1986. Underwater sound and fish behaviour. pp. 114-151. In: The Behaviour of Teleost
Fishes. (ed. T.J. Pitcher). Groom-Hellm. London.
Hawkins, A.D., and K.J. Rasmussen. 1978. The calls of gadoid fish. J. Mar. Biol. Ass. U.K. 58:891-911.
Mann, D.A., J. Bowers-Altman, and R.A. Rountree. 1997. Sounds produced by the striped cusk-eel
Ophidion marginatum (Ophidiidae) during courtship and spawning. Copeia 1997(3):610-612.
Perkins, P.J. 2002. Drumming and chattering sounds recorded underwater in Rhode Island.
Northeastern Naturalist 8(3):359-370.
Rountree, R.A. and J. Bowers-Altman. 2002. Soniferous behavior of the striped cusk-eel, Ophidion
marginatum. Bioacoustics 12(2/3):240-242.
Rountree, R.A., P.J. Perkins, R.D. Kenney, and K.R. Hinga. 2002. Sounds of Western North Atlantic Fishes:
Data rescue. Bioacoustics 12(2/3):242-244.
Sprague, M.W. and J. J. Luczkovich. 2001. Do striped cusk eels, Ophidion marginatum (Ophidiidae) pro-
duce the ‘chatter’ sound attributed to weakfish, Cynoscion regalis (Sciaenidae)? Copeia 2001 (3): 854-859.
Tavolga, W.N. 1980. Hearing and sound production in fishes in relation to fisheries management.
P.102-123, In: Bardach, J.E., J.J. Magnuson, R.C. May, and J.M. Reinhart (eds.). Fish Behavior and its use
in the capture and culture of fishes. ICLARM Conference Proceedings 5, 512 p. International Center
for Living Aquatic Resources Management, Manila, Philippines.
— 82 —
Proceedings from the International Workshop on the Applications of Passive Acoustics to Fisheries

— 83 —
Proceedings from the International Workshop on the Applications of Passive Acoustics to Fisheries
Illustrations and Diagrams
Cal
Toadfish
Call 1 Call 2 Call 3
Call 4
Call 5
Call 6
Cusk eel
Figure 1. Representative sample of cusk-eel calls recorded in Cotuit, MA on June 20th 2001. The lower panel shows astring of six separate cusk-eel calls, likely from six different individuals. The first call overlaps with that of a toadfish.The upper left figures show the waveform and spectrogram for call 3. The power spectrum of call 3 is shown in theupper right panel.
Figure 2. Single chatter attributed to the striped cusk-eel, Ophidion marginatum, recorded from Provincetown, MA on23 August 2001. The lower panel shows the energy spectrum for the entire call, while the upper panels show thewaveform, energy spectrum and power spectrum of a single pulse.
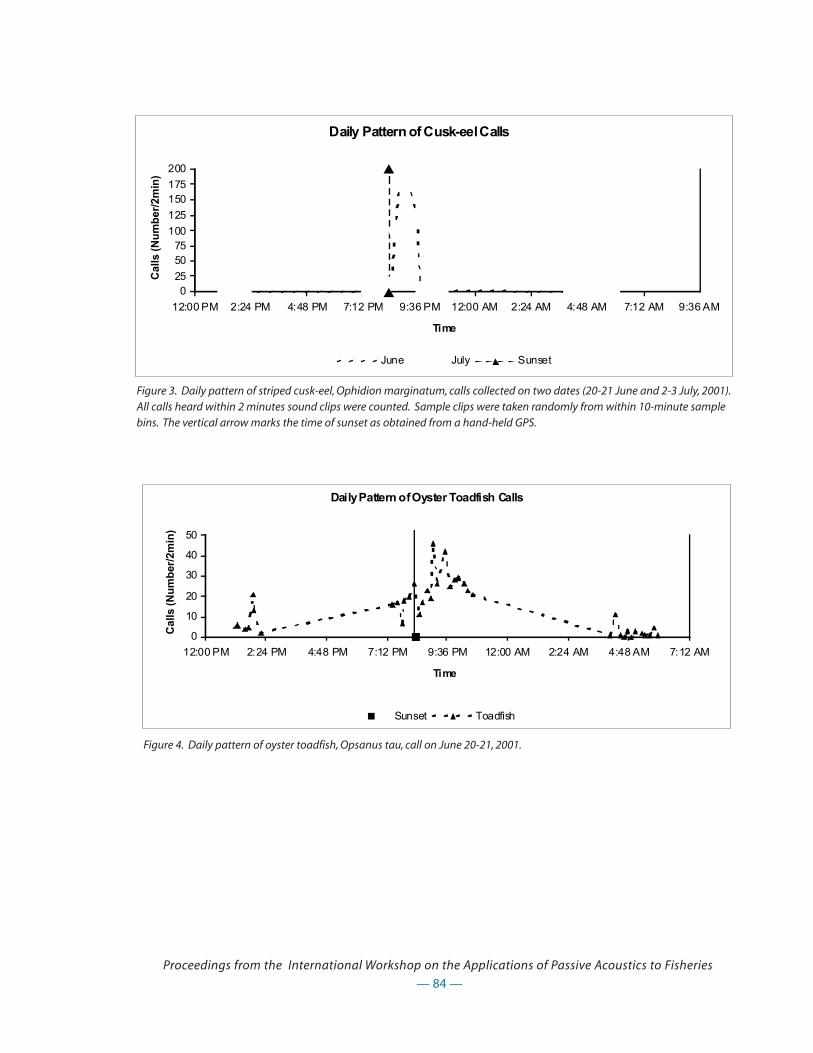
— 84 —
Proceedings from the International Workshop on the Applications of Passive Acoustics to Fisheries
Daily Pattern of Cusk-eel Calls
025
5075
100
125
150175
200
12:00 PM 2:24 PM 4:48 PM 7:12 PM 9:36 PM 12:00 AM 2:24 AM 4:48 AM 7:12 AM 9:36 AM
Time
Cal
ls (
Nu
mb
er/2
min
)
June July Sunset
Daily Pattern of Oyster Toadfish Calls
0
10
20
30
40
50
12:00 PM 2:24 PM 4:48 PM 7:12 PM 9:36 PM 12:00 AM 2:24 AM 4:48 AM 7:12 AM
Time
Cal
ls (
Nu
mb
er/2
min
)
Sunset Toadfish
Figure 3. Daily pattern of striped cusk-eel, Ophidion marginatum, calls collected on two dates (20-21 June and 2-3 July, 2001).All calls heard within 2 minutes sound clips were counted. Sample clips were taken randomly from within 10-minute samplebins. The vertical arrow marks the time of sunset as obtained from a hand-held GPS.
Figure 4. Daily pattern of oyster toadfish, Opsanus tau, call on June 20-21, 2001.
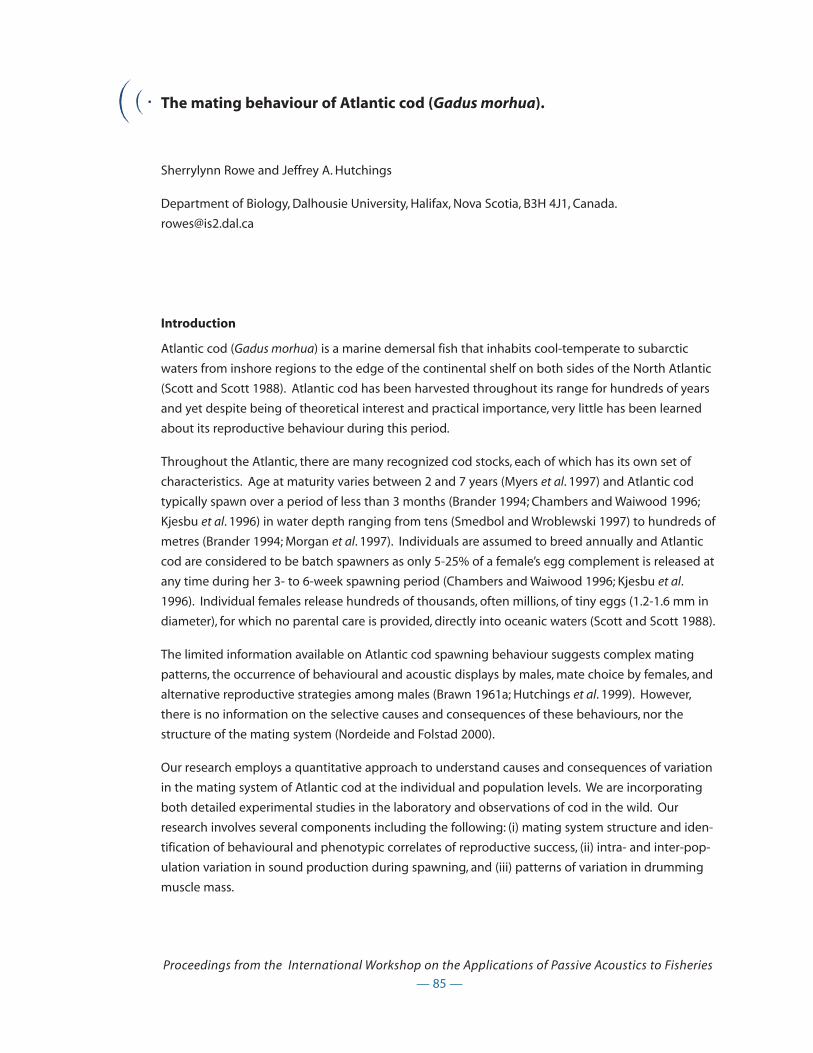
The mating behaviour of Atlantic cod (Gadus morhua).
Sherrylynn Rowe and Jeffrey A. Hutchings
Department of Biology, Dalhousie University, Halifax, Nova Scotia, B3H 4J1, Canada.
Introduction
Atlantic cod (Gadus morhua) is a marine demersal fish that inhabits cool-temperate to subarctic
waters from inshore regions to the edge of the continental shelf on both sides of the North Atlantic
(Scott and Scott 1988). Atlantic cod has been harvested throughout its range for hundreds of years
and yet despite being of theoretical interest and practical importance, very little has been learned
about its reproductive behaviour during this period.
Throughout the Atlantic, there are many recognized cod stocks, each of which has its own set of
characteristics. Age at maturity varies between 2 and 7 years (Myers et al. 1997) and Atlantic cod
typically spawn over a period of less than 3 months (Brander 1994; Chambers and Waiwood 1996;
Kjesbu et al. 1996) in water depth ranging from tens (Smedbol and Wroblewski 1997) to hundreds of
metres (Brander 1994; Morgan et al. 1997). Individuals are assumed to breed annually and Atlantic
cod are considered to be batch spawners as only 5-25% of a female’s egg complement is released at
any time during her 3- to 6-week spawning period (Chambers and Waiwood 1996; Kjesbu et al.
1996). Individual females release hundreds of thousands, often millions, of tiny eggs (1.2-1.6 mm in
diameter), for which no parental care is provided, directly into oceanic waters (Scott and Scott 1988).
The limited information available on Atlantic cod spawning behaviour suggests complex mating
patterns, the occurrence of behavioural and acoustic displays by males, mate choice by females, and
alternative reproductive strategies among males (Brawn 1961a; Hutchings et al. 1999). However,
there is no information on the selective causes and consequences of these behaviours, nor the
structure of the mating system (Nordeide and Folstad 2000).
Our research employs a quantitative approach to understand causes and consequences of variation
in the mating system of Atlantic cod at the individual and population levels. We are incorporating
both detailed experimental studies in the laboratory and observations of cod in the wild. Our
research involves several components including the following: (i) mating system structure and iden-
tification of behavioural and phenotypic correlates of reproductive success, (ii) intra- and inter-pop-
ulation variation in sound production during spawning, and (iii) patterns of variation in drumming
muscle mass.
— 85 —
Proceedings from the International Workshop on the Applications of Passive Acoustics to Fisheries
Laboratory observations of spawning Atlantic cod
The laboratory component of our research involves cod from two spatially distinct areas in the
Northwest Atlantic: Southwest Scotian Shelf and Southern Gulf of St. Lawrence, identified by the
Northwest Atlantic Fishery Organization (NAFO) Divisions as 4X and 4T, respectively. Mature adults
from each stock were collected and taken to a 680 m3 aquarium at Dalhousie where spawning
occurred. Groups of fish representing each stock were examined separately during their temporally
distinct spawning periods. Cod were maintained at densities similar to those in nature (approxi-
mately 0.1 fish per m3; Rose 1993; Morgan et al. 1997) and spawning behaviour of individually
tagged fish was recorded by videotape and visual observation. A hydrophone was placed in the
centre of the tank and sounds were recorded continuously during the spawning season. A random
sample of fertilized eggs was collected daily and pedigree analysis is being undertaken using
microsatellite DNA. In addition to providing information on individual male and female reproduc-
tive success, the DNA analyses, coupled with behavioural observations, will allow us to determine
phenotypic and behavioural correlates of reproductive success.
Observations to date suggest that strong differences in spawning behaviour exist between and
within Atlantic cod populations. A strong dominance hierarchy, territoriality, and high levels of
aggression characterized males from 4T but this wasn’t the case for males from 4X among which
very little aggressive behaviour occurred and no fish held territories for prolonged periods.
However, preliminary examination of the sound recordings have suggested that 4X fish are more
vocal than 4T fish. Similarly, we found that for both females and males, 4X fish had heavier drum-
ming muscles relative to their body weight (drumming muscle somatic index) than those from 4T
(Figure 1).
We also observed intra-population differences in behaviour, particularly for fish from 4T. We found
that the aquarium was dominated by 3-4 males that fiercely defended territories during the spawn-
ing season and frequently engaged in courtship activity. Other males were much more passive and
it seems that some specialized as sneakers in spawning events and even might have been imitating
females to gain access to male territories. Initial observations suggest that fish which were domi-
nant and engaged in most courtship activity were ones with the largest drumming muscle somatic
index (and were not necessarily the largest in length). We are waiting for results of the pedigree
analysis to determine the way in which these behaviours might have influenced reproductive suc-
cess.
Field observations of variation in Atlantic cod drumming muscle mass
Sound production by males is hypothesized to be important to successful mating in cod (Brawn
1961a, b; Engen and Folstad 1999; Hutchings et al. 1999) and we wanted to examine patterns of vari-
ation in the size of their sound-producing “drumming” muscles in more detail. Brawn (1961b) found
that Atlantic cod produced sound most frequently during the spawning period and although both
sexes were capable of producing sounds throughout the year, only males seemed to do so during
the spawning season, typically during aggressive defense of territories and courtship display.
— 86 —
Proceedings from the International Workshop on the Applications of Passive Acoustics to Fisheries
During March 2001 - February 2002, we sampled approximately 100 cod/month from NAFO Division
4X to quantify seasonal and individual variation in body condition and drumming muscle mass. We
found that drumming muscle mass tended to increase with fish size. Furthermore, when we con-
trolled for fish size, we found that spawning males had larger drumming muscles than non-spawn-
ing males (Figure 2) but there was no such relationship for females. In addition, males had larger
drumming muscles than females both during spawning and non-spawning seasons.
Interestingly, we also observed a weak, but significant relationship between drumming muscle
somatic index and body condition for males in spawning condition (Figure 3). This suggests that
male drumming ability could convey reliable information to females about mate quality.
Conclusions
We will continue our research on Atlantic cod by combining pedigree data with phenotypic and
behavioural observations of fish in our aquarium to assess correlates of reproductive success. Also,
we will study sound production by cod in more detail by examining the types and characteristics of
sounds produced, the behavioural contexts in which sounds occur, and temporal patterns of sound
production.
In recent years, stock collapses have caused many Atlantic cod fisheries to be reduced and others
even closed. Knowledge of Atlantic cod spawning behaviour will likely contribute to better under-
standing of population dynamics and improved ability to predict the effects of fishing on cod popu-
lations.
Acknowledgements
Thanks to Jim Eddington, Paty Avendano, and the Fishermen and Scientists Research Society for
technical assistance. Financial support for this research was provided by a Natural Sciences and
Engineering Research Council grant and a Petro-Canada Young Innovator award to JAH.
References
Brander, K. 1994. Spawning and life history information for North Atlantic cod stocks. ICES Coop.
Res. Rep. No. 205.
Brawn, V.M. 1961a. Reproductive behaviour of the cod (Gadus callarias L.). Behaviour 18: 177-198.
Brawn, V.M. 1961b. Sound production by the cod (Gadus callarias L.). Behaviour 18: 239-255.
Chambers, R.C., and K.G. Waiwood. 1996. Maternal and seasonal differences in egg sizes and spawn-
ing characteristics of captive Atlantic cod, Gadus morhua. Can. J. Fish. Aquat. Sci. 53: 1986-2003.
— 87 —
Proceedings from the International Workshop on the Applications of Passive Acoustics to Fisheries
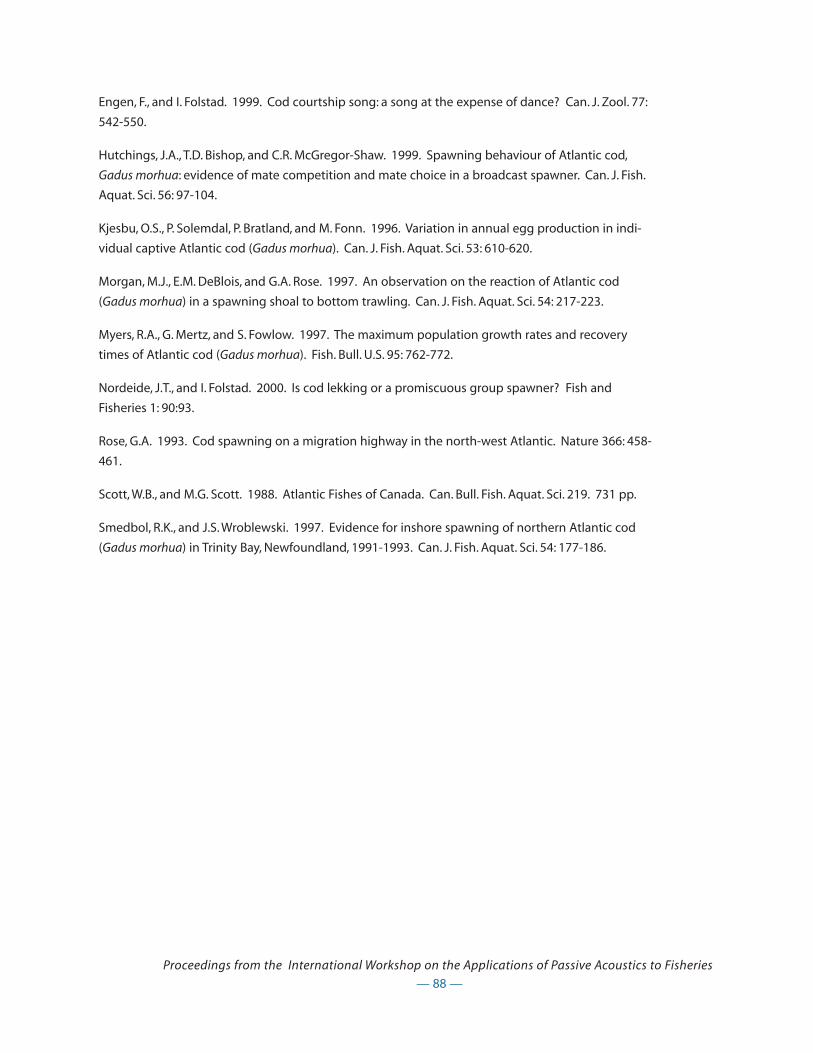
Engen, F., and I. Folstad. 1999. Cod courtship song: a song at the expense of dance? Can. J. Zool. 77:
542-550.
Hutchings, J.A., T.D. Bishop, and C.R. McGregor-Shaw. 1999. Spawning behaviour of Atlantic cod,
Gadus morhua: evidence of mate competition and mate choice in a broadcast spawner. Can. J. Fish.
Aquat. Sci. 56: 97-104.
Kjesbu, O.S., P. Solemdal, P. Bratland, and M. Fonn. 1996. Variation in annual egg production in indi-
vidual captive Atlantic cod (Gadus morhua). Can. J. Fish. Aquat. Sci. 53: 610-620.
Morgan, M.J., E.M. DeBlois, and G.A. Rose. 1997. An observation on the reaction of Atlantic cod
(Gadus morhua) in a spawning shoal to bottom trawling. Can. J. Fish. Aquat. Sci. 54: 217-223.
Myers, R.A., G. Mertz, and S. Fowlow. 1997. The maximum population growth rates and recovery
times of Atlantic cod (Gadus morhua). Fish. Bull. U.S. 95: 762-772.
Nordeide, J.T., and I. Folstad. 2000. Is cod lekking or a promiscuous group spawner? Fish and
Fisheries 1: 90:93.
Rose, G.A. 1993. Cod spawning on a migration highway in the north-west Atlantic. Nature 366: 458-
461.
Scott, W.B., and M.G. Scott. 1988. Atlantic Fishes of Canada. Can. Bull. Fish. Aquat. Sci. 219. 731 pp.
Smedbol, R.K., and J.S. Wroblewski. 1997. Evidence for inshore spawning of northern Atlantic cod
(Gadus morhua) in Trinity Bay, Newfoundland, 1991-1993. Can. J. Fish. Aquat. Sci. 54: 177-186.
— 88 —
Proceedings from the International Workshop on the Applications of Passive Acoustics to Fisheries
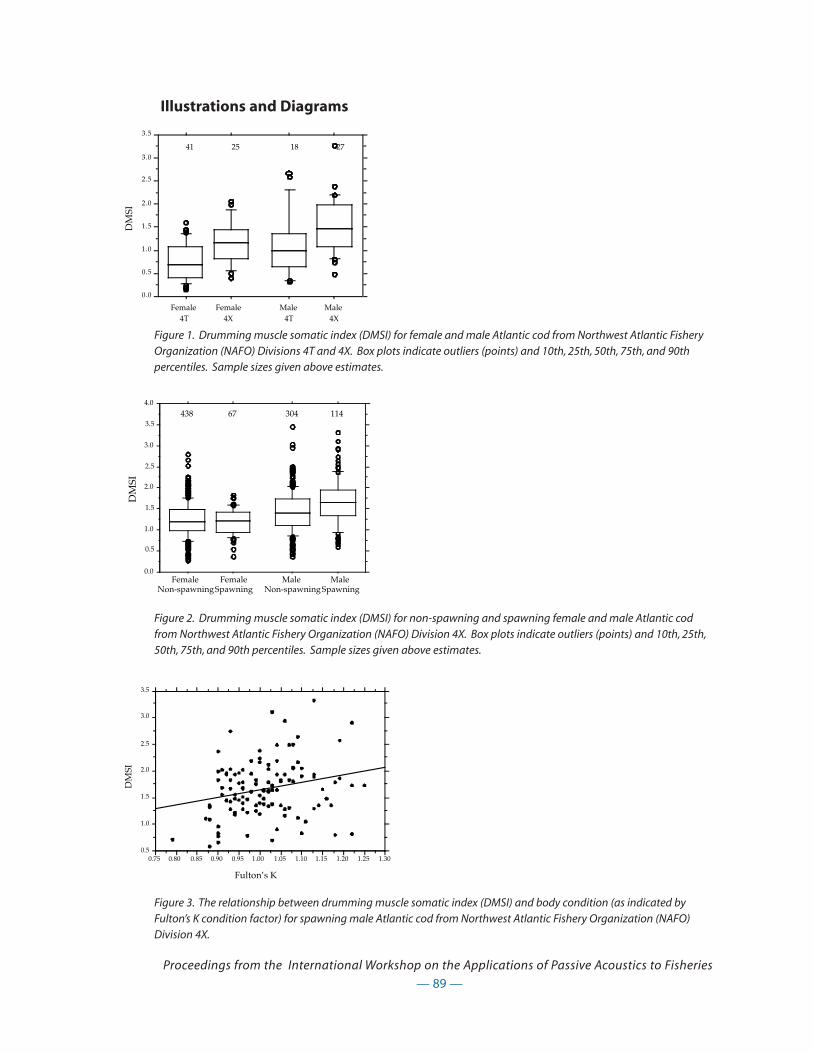
— 89 —
Proceedings from the International Workshop on the Applications of Passive Acoustics to Fisheries
Figure 3. The relationship between drumming muscle somatic index (DMSI) and body condition (as indicated byFulton’s K condition factor) for spawning male Atlantic cod from Northwest Atlantic Fishery Organization (NAFO)Division 4X.
0.0
0.5
1.0
1.5
2.0
2.5
3.0
3.5D
MSI
Female4T
Female4X
Male4T
Male4X
41 25 18 27
DM
SI
0.0
0.5
1.0
1.5
2.0
2.5
3.0
3.5
4.0
FemaleNon-spawning
FemaleSpawning
MaleNon-spawning
MaleSpawning
438 67 304 114
0.5
1.0
1.5
2.0
2.5
3.0
3.5
0.75 0.80 0.85 0.90 0.95 1.00 1.05 1.10 1.15 1.20 1.25 1.30
Fulton’s K
DM
SI
Figure 1. Drumming muscle somatic index (DMSI) for female and male Atlantic cod from Northwest Atlantic FisheryOrganization (NAFO) Divisions 4T and 4X. Box plots indicate outliers (points) and 10th, 25th, 50th, 75th, and 90thpercentiles. Sample sizes given above estimates.
Figure 2. Drumming muscle somatic index (DMSI) for non-spawning and spawning female and male Atlantic codfrom Northwest Atlantic Fishery Organization (NAFO) Division 4X. Box plots indicate outliers (points) and 10th, 25th,50th, 75th, and 90th percentiles. Sample sizes given above estimates.
Illustrations and Diagrams
Spotted Seatrout Spawning Requirements and Essential Fish Habitat: A
Microhabitat Approach Using Hydrophones
Donald M. Baltz
Oceanography and Coastal Sciences, Coastal Fisheries Institute, Louisiana State University, Baton
Rouge, LA 70803, USA.
Summary
Hyrdrophones can be used in conjunction with a microhabitat approach to yield a fish’s eye view of
its habitat requirements. At the finest scale, the microhabitat of an individual is the site it occupies
at a given point in time. Sites are presumably selected to optimize an individual’s net energy gain
while avoiding predators (i.e., tradeoffs of growth vs mortality). Since similarly sized individuals of a
species select similar microhabitats, many careful measurements of individuals and associated phys-
ical, chemical, and biological variables should define the population’s responses to environmental
gradients. As defined here, the microhabitat is an occupied site, not a little bitty habitat type. Fine-
scale measurements of environmental conditions at a site occupied by one or more individuals con-
stitute an observation, and many independent observations characterize the population’s response
to complex gradients.
Habitat is a loosely used ecological term that can be applied at the individual, population, and com-
munity levels and is often entangled with so many other ecological concepts that it can mean
everything and therefore nothing. The term ‘habitat’ has almost been relegated to the status of a
pseudocognate (sensu Salt 1979, Ecology) in that it is a term in common use and each individual
who uses it feels that all others share his own intuitive definition. Nevertheless, it is used and can be
useful. We can use habitat as the range of environmental conditions in which a species/popula-
tion/life-history stage can live. It is a general term that broadly defines where a species lives without
specifying patterns of resource use (sensu Hurlbert 1981, realized niche = resources used: energy,
materials, and sites (Evolutionary Theory 5:177-184)). There are several points of view. From a fish’s
point of view, its distribution over environmental gradients describes its habitat. From a biologist’s
point of view, strata in the environment can be arbitrarily described as habitats, but more properly
as “habitat types”. At the community level, the environments dominated by a single species (e.g.,
Spartina alterniflora) may be characterized as Spartina habitat, but more properly as a “Spartina
community”.
The concept of Essential Fish Habitat (EFH) is based on 1996 federal legislation and is aimed at
enhancing the sustainability of our fisheries. The legislation established four levels of data quality in
— 90 —
Proceedings from the International Workshop on the Applications of Passive Acoustics to Fisheries
defining EFH: I. Presence/absence, II. Density patterns (e.g., population responses to gradients, suit-
ability), III. Condition/health (e.g., growth, parasite loads, pollution loads, RNA/DNA ratios), and IV.
Production (e.g., secondary production, reproductive output). What is EFH? Essential is a qualifier
that carries a notion of quality. We are not just asking where a species lives (Level I), but where it
lives well (Levels II-IV). Where are its resource needs best met? Now we are concerned with pat-
terns of resource use (sensu Hurlbert 1981, realized niche = resources used: energy, materials, and
sites (Evolutionary Theory 5:177-184)).
How can we use a fish’s eye view to define EFH? We can seek answers to three questions. How are
species and life history stages distributed in the environment? What intervals along environmental
gradients are selected or avoided? What is most important to the fish in terms of growth and/or
survival?
Level I data: Presence/Absence data: Most risk averse approach to protecting habitat (based on the
precautionary principle); however, reliance on Level I data overprotects less valuable habitat and
essentially equates water with EFH. High quality habitat is given the same level of protection as
Low quality habitat and scientists/managers lose credibility.
Level II data: Density data:. Uses fish population’s responses (density patterns) to environmental gra-
dients. Level II assessments can be improved by relating population’s response in terms of resource
use to resource availability (e.g., habitat suitability), and high quality can be distinguished from low
quality habitat. Habitat Suitability [S = Suitability = P (E | F) / P (E)] is an index of habitat quality
based on a quotient of Resource Use and Resource Availability (Bovee, K. D. & T. Cochnauer, 1977,
U.S. Fish & Wildlife Service Biological Services Program FWS/OBS-77/63). Resource use is a probabili-
ty statement, given the presence of fish, and resource availability is a probability statement, regard-
less of the presence of fish. Suitability is an index of use divided by availability that ranges from
zero (intolerable) to one (optimal) after standardization.
Level III data: Growth data: I have not been able to relate this level to hydrophone work on spotted
seatrout, but others may find an application for other soniferous species that make sounds for non-
reproductive functions (e.g., foraging parrotfishes). What environmental conditions foster growth of
early juvenile spotted seatrout? Nursery microhabitat selection is presumably controlled by some
combination of physiological constraints, prey distributions, foraging success, competitor densities,
and predation pressure, all of which may influence growth and/or survival. Linkages between
microhabitat, diet, & conspecific density may predict recent daily growth which in turn reveals the
recruitment potential of preferred nursery characteristics (Baltz et al.1998, Env Biol Fish 53: 89-103).
Level IV: Production data: This is the best kind of information and the best example is from a study of
oyster seed production (Chatry, Dugas, and Easley 1983, Cont. Mar. Sci. 26: 81-94). Oyster seed set
and growth are best at 20-22 ppt (Level III data), but oyster predators (drills, etc) seriously deplete
populations in high salinity water (> 15 ppt). Oyster seed production is highest for seed set at 12-16
ppt the previous summer, and therefore EFH for oyster seed production is highest in a narrow sum-
mer salinity range of 12-16 ppt.
— 91 —
Proceedings from the International Workshop on the Applications of Passive Acoustics to Fisheries
I will argue that suitability indices for reproduction (Saucier & Baltz, 1993, Env Biol Fish 36: 257-272)
are high-level EFH data and qualify at Level IV. Moreover, this kind of data can be acquired easily
with hydrophones. Saucier and Baltz (1993) used a microhabitat approach to identify selected and
avoided points along salinity, depth, substrate, and velocity gradients used for spawning by spotted
seatrout. Relatively deep, moving waters with a salinity of 14-23 and a temperature of 29-33 °C were
selected. Conflicting literature from earlier studies in the northern Gulf of Mexico suggested that
spawning occurred more or less exclusively in bays, passes or the open gulf. We found that spotted
seatrout spawn across a wide variety of habitat types (bays, channels, passes, and open gulf ) where
environmental conditions are right. We found that spawning locations shifted along a salinity gradi-
ent up to 30 km on a north-south axis, and concluded that environmental conditions were more
important than places.
Spawning temperatures for Louisiana spotted seatrout
Spawning salinity for Louisiana spotted seatrout
There are several pitfalls to avoid. Non-linear effects along environmental gradients should be
expected. Non-representativeness in sampling design may lead to biased results, especially sam-
pling bias that focuses on particular habitat types may generate misinformation. Noisy crews, boats
and traffic may make it difficult to locate spawning aggregations. Misidentification of drumming
species can be avoided by careful comparisons with known recordings, and verification of actual
spawning by the collection and rearing of eggs from drummng sites to identifiable larvae is impor-
tant. A stratified water column may present contrasting environmental variables in a vertical profile
(We want to know what’s going on at the fish’s nose).
Hydrophone Techniques & Assumptions: Aggregation size: Sound Intensity may be used to estimate
Source Level (SL) if distance to source is known. Source Level is calculated by adding a one-way
spherical spreading loss (i.e., a 20 log [depth in meters - 1]) for a correction (absorption is ignored).
It is a continuous variable that estimates group size for statistical modeling: SL = microhabitat vari-
ables + temporal variables + ε. A recorded Sound Intensity (my standard settings were 132 db re 1
µ pascal) of +5 db yields a Source Level of 139.6 db for an aggregation on the bottom in 15 m of
water [e.g., 132 + 5 + (20 log 14) = 139.6 db]. A cylindrical correction or no correction may be more
appropriate under given circumstances.
Future Applications: My wish list is topped by a fixed or moveable listening array with overlapping
directional capabilities to generate position fixes, computer programs to process fix data, and real-
time transmission capabilities to allow a small boat to move to aggregation sites and random sites
for measurements of resource use and availability.
Recommendations for EFH: Quality research and wise management related to fish habitat depend on
how clearly we can define habitat and EFH and that we are all discussing the same concepts. We
should try to take a fish’s point of view and let them describe what is essential along environmental
gradients. By comparing resource use with environmental availability, we gain insights into patterns
— 92 —
Proceedings from the International Workshop on the Applications of Passive Acoustics to Fisheries

of selection and avoidance. We can identify biological endpoints that reflect the health and well
being of individuals and communities of fishes. Use of the best data and research designs available
will help avoid management errors in describing EFH. Management errors that result in over- or
under-protecting EFH can be viewed as having positive and negative outcomes:
Over-protection Under-protection
Species & habitats are better protected (+) Species & habitats at greater risk (-)
Scientists & managers may lose credibility (-) Scientists & managers may lose credibility (-)
Costs the regulated group its profits (-) Regulated group is happy (+)
Enforcement is more expensive (-) Enforcement is less costly (+)
Clearly, we can use hydrophones and a microhabitat approach to credibly describe EFH for some
soniferous spawning fishes, like spotted seatrout.
Acknowledgments
I am grateful to Grant Gilmore and Mike Mok for an acoustical primer and other assistance, Scott
Holt for showing us how to rear larvae, Louisiana Sea Grant for funding, and Rodney Rountree, Tony
Hawkins, & Cliff Goudey for putting together the workshop.
— 93 —
Proceedings from the International Workshop on the Applications of Passive Acoustics to Fisheries

Creating a Web-based Library of Underwater Biological Sounds
Jack W. Bradbury and Carol A. Bloomgarden
Macaulay Library of Natural Sounds, Cornell Laboratory of Ornithology
159 Sapsucker Woods Road, Ithaca, N.Y. 14850, [email protected]
Introduction
Establishing an archive of fish and other underwater biological sounds will meet many of the long-
standing challenges faced by marine acousticians - the ability to catalogue their sounds and data in
a way that fosters comparative studies, easy access to the sounds for analysis and identification, and
the capacity to search through passive recordings for sounds of particular interest. The Macaulay
Library of Natural Sounds (MLNS), with a long history of working toward these goals in ornithology
and animal behavior, recently launched a new Internet-accessible archive of underwater sounds
with the help of over sixty individual recordists and institutions worldwide. Researchers will be able
to annotate their sounds with detailed and extensive data through an online database application,
summarize search results in exportable tables and maps, and download copies of recordings for
research, teaching, and conservation. MLNS is committed to dual goals of maintaining open access
to allow other researchers to listen and help identify sounds, while protecting recordists’ copyrights
and restricting access during the publication process. Detailed and extensive metadata are needed,
however, to create the functionality such an archive requires.
Acquisition of Source Material
A recent survey of suitable original recordings resulted in commitments by more than 60
researchers or institutions to supply original tapes and metadata for archival at MLNS. These consist
of over 8000 hours of audio tape and 800 hours of video and include recordings of 95 species of
marine mammals and more than 200 species of fish (representing 36 families) and marine inverte-
brates. Upon request, MLNS staff will visit participating institutions to help organize and pack origi-
nal tapes, collect the metadata and any information required to import it, and then carefully track
the status and location of all contributed material through the shipping and archival processes.
Restoration
Many older recordings exist on deteriorating tape stocks. These must be treated before copying.
MLNS has extensive experience and an excellent track record in tape restoration. Many of these
tapes can be restored in-house using controlled baking and vacuum treatments. A few may be so
— 94 —
Proceedings from the International Workshop on the Applications of Passive Acoustics to Fisheries
deteriorated that they must be out-sourced to specialists who examine the molecular structure with
electron microscopes before undertaking situation-specific restoration procedures.
Ingestion
Most analog sound tapes are digitized once at high resolution (96 kHz/24 bits). Although the high
sampling and bit rates are not necessary for all recordings (given ambient noise levels and frequen-
cy composition of the sounds), these high-resolution settings greatly accelerate the archival process
by freeing technicians from detailed monitoring of signal levels and inadvertent aliasing. They also
preserve any high frequency sounds that are unnoticed or in the background but that may later
prove of interest. Proper digitization of Odontocete sonar signals will require a combination of
replay at reduced speeds and even higher digitization rates. Digital recordings are copied at their
original rates. Analog video will be converted to digital tape replicas. All digitized materials will be
stored on local hard disks until transferred to hard media.
Extraction
Whereas terrestrial recordists can limit recording time by watching their subjects, marine
researchers often record blindly for long periods, and their recordings therefore often have a much
smaller fraction of useful content than do terrestrial ones. At least a third of the contributed audio
material consists of such unedited continuous recordings. Once digitized, these must be examined
in real-time and the relevant sounds extracted. We will work with developers to adapt prototype
detector software for real-time extraction of appropriate marine sound tapes. This tool will be
essential for reducing raw audio streams to separate sound files.
Formatting & Storage
All high-resolution digital copies of extracted sounds and videos will be preserved in a deep archive.
Sounds will be stored as AIFF files on DVD-ROM discs in a computer-controlled jukebox array. Video
will be encoded as MPEG-2 files and stored in a near-line digital AIT (Advanced Intelligent Tape)
library. Copies of each sound and video will be created in a variety of down-sampled popular for-
mats (compact disc quality, RealAudio, QuickTime, Windows Media, and perhaps MP3) and stored on
CLO’s new EMC Symmetrix hard drive system. These latter copies will be the ones available over the
Web. High-resolution copies can be obtained by special order. Automatic routines will randomly
monitor the integrity of the DVD-ROM copies and the EMC system copies. Damaged files can be
robotically regenerated from backup high-resolution copies.
Identification and Annotation
Remote experts will be able to examine copies of extracted sounds or annotate copies of longer
— 95 —
Proceedings from the International Workshop on the Applications of Passive Acoustics to Fisheries

behavioral sequences (both audio and video). Given our ability to create a lower resolution copy of
any sound or video clip, it will be easy to download these to the consultant over the Web along with
software for recording identifications or annotations that would then be uploaded to our database.
Our software will be specifically designed to accept annotation data created remotely and synchro-
nize it with all subsequent copies of the files. These tools will thus create a much larger pool of par-
ticipating consultants.
Importing of Metadata
CLO has adopted one of the industry standards for its database, Oracle’s relational system, and is
designing a data architecture that conforms with the Dublin Core (http://www.dublincore.org) pro-
tocols. These define a set of metadata and XML tags that allow our databases to be accessible and
compatible with other libraries and museums worldwide. Lower levels in this architecture allow for
taxon-specific data for behavioral repertoires or habitat use, sophisticated GIS links using ESRI rou-
tines, complex and high level data mining protocols, and within-file (e.g. annotation and extracted
parametric data) searches. CLO is developing general tools for data importation and searching
through a wide variety of database formats. All data, whether entered by hand or ported, will be
checked for accuracy and veracity before being published online.
Client Services
CLO’s sound and video libraries have a wide diversity of users. These include private individuals, sci-
entific researchers, conservationists, wildlife managers, education programs at all levels, website
owners, military and government agencies, the media and film industries, and various commercial
companies. Our major goal in the recent acquisition of an EMC enterprise storage and Web delivery
system was the provision of rapid, direct, and reliable access to the CLO archives through the
Internet. This requires JAVA and HTML/XML programs for the Web pages and underlying engines for
a variety of online services including a) powerful searches of our metadata and within-file annota-
tions; b) provision of search results as data tables with hot links or maps including links to a variety
of online GIS tools; c) the ability to hear any selected cut online; d) the ability to collect a series of
multimedia selections onto a worktable for comparison, sequencing, or editing; e) creation of a
shopping cart with secure credit-card payment protocols; and f ) tracked delivery of requested
resources through streaming, Web downloads, or shipment of hard copies (CD, DVD). Some of these
features are being developed CLO-wide, but others will require specific adaptations for the marine
animal sound collections.
Analytical Tools
In addition to search, selection, and retrieval, CLO intends to provide various sound analysis tools
online. These may include the abilities to a) see a playable spectrogram or waveform (or both time-
— 96 —
Proceedings from the International Workshop on the Applications of Passive Acoustics to Fisheries
aligned) of any sound in the archive; b) select and play any part of a visible spectrogram or wave-
form; c) select a large number of sounds in the archive and submit a batch job to compare each
sound with every other sound using any of several alternative tools (spectrographic cross-correla-
tion, temporal cross-correlation, multiple measurement and PCA, etc.); and d) submit an unknown
sound and associated metadata and receive a likely identification (or list of alternative suspects).
Acknowledgements
Funding for the Marine Animal Sounds Archive is through the U.S. Office of Naval Research. Many
thanks to Bob Gisiner at ONR for his encouragement and support on this project.
— 97 —
Proceedings from the International Workshop on the Applications of Passive Acoustics to Fisheries
Potential for coupling of underwater TV monitoring with passive acoustics
Charles A. Barans1, David Schmidt2, Myra C. Brouwer3
1, 3 Marine Resources Research Institute, South Carolina Department of Natural Resources, 217 Ft.
Johnson Rd., Charleston, SC 29412 1 [email protected] [email protected]
2Jackson and Tull - SMARTech Division, 1211 Ben Barron Lane, Moncks Corner, South Carolina 29462
Introduction
The temporally and spatially fluid nature of fish associations often confuses interpretations of their
underwater sounds. Ideally, visual confirmation of the sound producers and any behaviors associat-
ed with sound making should accompany acoustic data. Investigators have long been expanding
their inventory of specific sounds that represent, conclusively or potentially, specific underwater
sources. These are the acoustic “standards” by which to compare unknown sounds for
recognition/identification purposes. Unfortunately, these standards are often not available for
acoustic research on fishes. Although some sonic signatures have been corroborated with visual
observations, many more are needed to assist in interpretations of sonic data from hydrophones
placed in complex habitats with many interacting species of vertebrates and invertebrates. The
underwater television (UWTV) is ideal for direct correlations between specific sounds and their
causes, if the water visibility is acceptable.
Underwater video devices can provide a wealth of information to scientists and fishery managers
including seasonal movements of fishes, the potential for development of indices of abundance for
some migrating and resident populations, and any seasonal behaviors associated with the forma-
tion of pre-spawning aggregations along a migration route. An UWTV system offshore allows the
study of fishes on the bottom throughout the year without the costly trips to a research site in
inclement weather. The present visual capability of UWTV should be integrated with acoustic infor-
mation to enhance fisheries biologists’ understanding of fish behavior and movements within the
region. This paper describes recent results from a permanent installation of an UWTV at an artificial
reef offshore.
The Underwater Television System
The research site was established in 25-28 m of water about 72 Km off central Georgia on May 11,
1999 with the deployment of several large fish attraction units (Artificial Reefs, Inc.). On August 24,
1999, the underwater TV cameras, cable and computer were installed and images were transmitted
— 98 —
Proceedings from the International Workshop on the Applications of Passive Acoustics to Fisheries

via microwaves to shore. Artificial reef structures are arranged in a circle around the camera system
to maintain a resident aggregation of reef fishes, to attract transient species and to focus local fish
activities within the view of the cameras.
The video system consists of two main parts. A pressure housing, located on the sea floor and a
video capture engine, located remotely. Six monochrome video cameras are housed with a micro-
controller and a few basic sensors. The micro-controller provides the means to multiplex the 6 ana-
log video signals to one coaxial cable running between the pressure housing and the video capture
engine. The video capture engine is a computer running under the Windows NT operating system. A
console application controls a video frame grabber, which takes the analog video signal and con-
verts it to digital images. The system has the ability to capture multi-frame or single frame images
based on parameters set by the user. The micro-controller in the pressure housing receives com-
mands from the video capture engine for camera selection, tilting data, and system status updating.
The embedded computer also acts as a web server through which the video system is controlled.
File transfer and system parameter updates are made possible by an interface between the web
server and the console application controlling the video system using pcANYWHERE.
Small black and white security cameras (Supercircuits PC-23C) with low light capabilities (to 0.04
lux) and relatively low resolution (460 lines) were used. Camera lenses of 8 mm allowed a 12 degree
angle of view, and the seabed was in view at about 13.7 m from the camera. Daily observations
(~65) were conducted between 1200 and 2130 GMT (Greenwich Mean Time). Still images ~15 Kb
(jpg) were recorded and logged at 10 minute intervals for 10 sec. Video clips ~400 Kb (avi) were
recorded on the hour from camera No. 5, since only camera No. 5 was directed at reef structure with
any reef fish activity. Images were downloaded from the remote computer to the laboratory com-
puter for fish counts and long-term data storage.
Observations using UWTV
We have learned how to deploy and maintain the UWTV system and remote operations systems. We
have temporally documented species presence and activity. The seasonal dates of the first appear-
ance of various fish species are especially important for identification of any prespawning migration
to the south by adult grouper, one of our main target species. Seasonal changes in the makeup of
the fish assemblage at the UWTV site appear much greater than previously believed. We are docu-
menting the annual cycle of juvenile recruitment in spring and summer followed by intense preda-
tion by transient species later in the year.
Large schools of bait fish have been present in most seasons accompanied by schools of predatory
greater amberjacks (Seriola dumerili). The subjects of interest to us, snapper and grouper species,
however, have yet to establish resident populations at the site. Year-round resident species included
Atlantic spadefish (Chaetodipetus faber), gray triggerfish (Balistes capriscus), and the predators black
seabass (Centropristis striata), and great barracuda (Shyraena barracuda). Other resident species may
— 99 —
Proceedings from the International Workshop on the Applications of Passive Acoustics to Fisheries

not have been observed due to decreased visibility and/or increased cryptic behavior during winter.
The visibility near the bottom was relatively poor throughout May, at some times in late summer
and often after winter Northeaster storms and hurricanes. Swarms of juvenile round scad
(Decapterus punctatus) appeared in mid-May and were occasionally accompanied by snapper and
grouper species. Transient species in May included loggerhead seaturtle (Caretta caretta), sand tiger
shark (Odontaspis taurus), rock hind (Epinephelus adscensionis), nurse shark (Ginglymostoma cirra-
tum), and cobia (Rachycentrum canadum). The settlement and recruitment to an area by juvenile
baitfish may attract many temporary predatory species. In 2000, we first sighted small baitfish in
April, although periodic clouds of very small juveniles could not be identified to species.
During 1999, tomtate (Haemulon aruolineatum), especially juveniles, were one of the most abundant
and conspicuous members of the fish assemblage in close proximity with the structural reef units.
Large schools of round scad often swam in and out of view near the tops of reef units. Immediately
above any fish structure and well up into the water column were loose aggregations of adult
greater amberjack. Other jacks occasionally passed through the site, including black bar jack (Caranx
ruber).
Although resident predators must significantly reduce recruitment of many species, large stochastic
predation events appear to have a formidable influence on mortality and survival of small and juve-
nile reef fishes. Two important large-scale predation events observed in 1999-2000 were the arrival
of migrating loons (Caranx ruber) and the mid-winter appearance of large populations of
ctenophores (believed to be Leucothea milticornus) near the bottom. We observed the loons to visu-
ally select fish prey in and near the structural reef units within a meter of the bottom. Also, the large
numbers of ctenophores and/or jellyfish in winter corresponded to the temporary residence of an
ocean sunfish (Mola mola) and a relatively large population of adult Atlantic spadefish. Both species
are known to feed on jellyfish. The importance of predator-prey relationships was confirmed by
inference from general observations of the relatively simultaneous arrival of baitfish and some of
the higher level predators in the early spring. The infrequent appearance of high level piscivores at
the small artificial reef site suggests large feeding ranges of many species, which appear to be “pass-
ing through” looking for feeding opportunities. Species that may move back and forth between
other habitats within their hunting range and were observed at the site include large adults of log-
gerhead turtles, sand bar sharks, red snapper (Lutjanus campechanus), gag (Mycteroperca microlepis)
and scamp (M. phenax).
Discussion
Observations from the artificial reef research site can contribute significantly to the understanding
of the short-term and long-term temporal changes in an offshore reef fish assemblage. Permanent
installations of UWTV systems have the advantage of non-obtrusive observations of fish interac-
tions. The sorts of behaviors that are of most interest to biologists, such as feeding or spawning, are
rarely observed in the wild. Documenting such rare events often requires constant, long-term obser-
— 100 —
Proceedings from the International Workshop on the Applications of Passive Acoustics to Fisheries
vation that is difficult under natural conditions because the ocean is always changing. Observations
by divers are severely limited during seasons of high seas, often including both winter and spring,
when migration and/or spawning activities among reef fishes most often occur.
Although the lack of mobility of our UWTV is a spatial limitation, a semi-permanent setting allows
temporal investigations. Similar visual studies could develop sound catalogs of transient species and
more detailed behavior-related sound patterns of resident species for potential management appli-
cations. For instance, estimates of population size of coral-nibbling parrot fish might be made after
correlations between the mean rate of munching done per fish, with visual verification of the feed-
ing behavior/sound relationship.
Synergistic information would come from the simultaneous combination of visual and sonic infor-
mation. The addition of less expensive, passive acoustic data gathering devices could compensate
for the lack of spatial coverage by more expensive UWTV systems. It could also provide more com-
plete coverage of the events taking place in the vicinity of the cameras, but beyond their field of
view.
Imagine, if you will, the interesting array of sounds that might have accompanied the feeding of
loons on cigar minnows near the bottom, Atlantic spadefish biting a chunk off a passing jellyfish or
a school of tuna passing through the artificial reef structures. Each of these complex sound series
may be far more interpretable with TV documentation during the first several encounters.
Behavioral observations correlated with acoustics and environmental conditions and validated over
time would contribute to the interpretations of results from other sampling areas for which only
acoustic data are available.
Integration of a relatively permanent TV and passive hydrophone offshore to refine the acoustic
“dictionary” seems to be nearing reality. The UWTV systems exist associated with Fish Watch,
Africam, Aquarius and specific public aquariums throughout the US. The bandwidth necessary to
add simultaneous passive acoustic data should be minimal and be waiting only for the enthusiasm
to make it happen.
The primary scientific objective of the UWTV system established off Georgia was to document and
quantify prespawning aggregations of gag grouper as they move south along the continental shelf.
If an associated sound recognition pattern were associated with such fish aggregations and move-
ments, multiple listening stations could be established at key locations across the shelf and along
the potential migration path at a cost for monitoring much less than that using other methods. The
visual findings of the present UWTV study expand our understanding of the importance of large
scale stochastic predation events on relatively localized reef fish aggregations, especially of juveniles
and bait species. The sounds generated by the assemblage interactions would have filled chapters
of a catalog on reef fish sounds. The scientific community anxiously awaits the development and
application of tools that will allow simultaneous visual and sonic investigations of fish associations
and behaviors.
— 101 —
Proceedings from the International Workshop on the Applications of Passive Acoustics to Fisheries

Acknowledgments
Any marine research requires a team effort with many experts and professionals involved to accom-
plish even a small task offshore. In the case of remote transmissions from an underwater TV system,
the numbers of support electronics/computer, divers, vessel operators and agencies willing to loan
facilities and/or manpower to get the job done can be staggering. We thank all those multi-agency
staff and, in particular, the staff that always can be depended on to accomplish multiple tasks to
keep the system functioning: Trent Moore, Cheryl Burden Ross and Travis McKissick. We thank many
staff of the following institutions/ agencies/ groups for their undying support, including: the
Skidaway Institute of Oceanography, the Gray’s Reef National Marine Sanctuary, the SC Marine
Resources Div, Artificial Reef Section and MARMAP program, the Georgia Coastal Resources Division
and the USN Explosive Ordnance Disposal Mobile Unit #12. We are grateful for funding from the US
Navy through the Office of Naval Research, National Oceanographic Partnership Program, Grant No.
N00014-98-1-0808.
— 102 —
Proceedings from the International Workshop on the Applications of Passive Acoustics to Fisheries

Application of Passive Acoustic Methods for Detection, Location and Tracking
of Whales
Christopher W. Clark
Bioacoustics Research Program, Cornell Lab of Ornithology, 159 Sapsucker Woods Rd., Ithaca, NY
14850 cwc2@cornell .edu, http://www.birds.cornell.edu/brp/
Introduction
Baleen whales produce species specific sounds. At least five species produce long, patterned, hierar-
chically organized sequences of sounds referred to as songs. Baleen whale distribution and relative
abundance estimates are traditionally based on visual surveys from vessels and/or airplanes. This
approach is limited by visibility conditions and access to observation platforms. Acoustic monitoring
using either single or multiple sensors offers a significant improvement by increasing spatial and
temporal sampling. Throughout the last 20 years, acoustic hardware and software tools have been
developed and applied to survey whale species and gain insights into natural behaviors. This
includes the use of Navy SOSUS arrays to detect and estimate numbers of vocal animals throughout
an ocean basin, autonomous seafloor sensors to detect, locate and track species of interest in
regions, and sparse or towed hydrophone arrays to detect, locate and track selected species in spe-
cific study areas. For at least four species, SOSUS data reveal annual seasonal and large geographic
fluctuations reflecting migration, feeding and breeding patterns. For bowheads combined visual-
acoustic efforts have lead to calculation of a robust population assessment and trend over a 20-year
period, as well as understandings of acoustic functions. For blue and fin whales, integrated
approaches combining passive acoustic methods with visual, biopsy, photo-ID and prey field sur-
veys are beginning to reveal critical details of behavioral ecology and significant insights into vocal
functions.
Background
The Cornell Bioacoustics Research Program specializes in the development and application of
advanced techniques to investigate the mechanisms and evolutionary bases of animal acoustic
behaviors. Techniques successfully developed for the study of one organism or taxonomic group are
often applied to another group. Part of the motivation for including the topic of whales in this sym-
posium was to provide an opportunity to exchange information with researchers primarily interest-
ed in fishes. Clearly many of the tools developed for studies on whales are applicable to fish. Species
in both taxa produce rich assortments of sounds in the low-frequency band (<1000Hz). Most sounds
are species specific and can be used as indicators of species presence and relative abundance. Males
— 103 —
Proceedings from the International Workshop on the Applications of Passive Acoustics to Fisheries

are known to produce acoustic displays associated with breeding. Similar sound propagation mod-
els can be applied to quantify probabilities of detection. An integrated approach in which acoustic
techniques are combined with other methods (e.g., visual, molecular, oceanographic) can yield
tremendous advancements in our collective understandings of marine biology.
Whale bioacoustics
All 11 species of baleen whales produce sounds. Representations of sound repertoires are complete
for the five coastal species, bowhead, gray, humpback and the southern and northern right whales.
There are good representations for two pelagic species, blue and fin whales. Whale source levels
(RMS power in dB re 1µPa @ 1 m) have been reported as high as 188 dB (tabulated in Richardson et
al. 1995). Under certain conditions (e.g., water depth that is not well matched to the signal’s frequen-
cy band of lowest transmission loss, or highly reverberant environments), there is little or no advan-
tage to increased source level, and selection should favor changes in other acoustic features to opti-
mize communication effectiveness and range.
In the marine environment, assuming a selective advantage for long-range communication, the
influences of physical acoustics should have imposed strong selective pressures on the acoustic fea-
tures of communication sounds. There is evidence in support of this general hypothesis on sound
function when considering the physical acoustic properties of the ocean environment in combina-
tion with the acoustic features of sounds produced by mysticete whales. Two primary acoustic prop-
erties that strongly influence communication range are transmission loss (TL) and ambient noise. In
a shallow water habitat (< 200-300m) sounds in the 100-800Hz band experience the lowest TL and
there is often a window of low ambient noise in this frequency range. Along a shelf break or in
deep ocean environments (> 1000m), sounds below 100Hz experience the lowest TL and between
10-50Hz there is a plateau of low ambient noise. The acoustic features for species which breed and
forage in predominantly coastal habitats are very different from those from a pelagic environment,
as illustrated in Figure 1.
Ambient noise levels are different for these two environments, and the dominant frequency band of
a species’ song is generally matched to the frequency band of low ambient noise as shown in Figure
2 (Clark and Ellison in press).
Traditional visual survey methods are inadequate for documenting species presence/absence, distri-
bution or relative abundance. The spatial and temporal sampling scales required are prohibitive for
ship or aerial surveys, but passive acoustic sampling can offer an effective solution. Over the last ten
years the acoustic activity of four species have been monitored on an ocean-scale basis in the north
Pacific and North Atlantic using the Navy’s SOSUS network (Watkins et al.2000, Charif et al. 2001).
Results provide large scale patterns of vocal activity throughout the year in areas where animals
(e.g., humpbacks) are known to breed. Surprisingly, however, for pelagic species with no known
breeding or calving grounds, singing occurs throughout most of the year even during the feeding
season in high latitude areas (Figure 3).
— 104 —
Proceedings from the International Workshop on the Applications of Passive Acoustics to Fisheries
For regional-scale sampling, autonomous seafloor recorders have been used in conjunction with
visual surveys (aircraft or vessels) to estimate species densities and with active acoustic surveys to
study the relationship between whales and the physical and biological oceanographic conditions.
The results from such integrated efforts are immensely more informative than any one survey
method alone. The number of cases in which acoustics detected species first and more often than
visual survey is increasing, even for species that are plentiful and highly visible.
In cases where a highly focused effort is required, for example, when conducting a visual-acoustic
census or testing specific hypotheses regarding sound function, a variety of hydrophone systems
can be used. This includes sparse arrays of hydrophones, distributed networks of autonomous
seafloor recorders or a towed beamforming arrays (Clark et al. 1996; Clark and Fristrup 1997; Croll et
al. 2002). Such techniques provide mechanisms to continuously describe the number, locations and
movements of individual animals in great detail. When combined with data from other focused field
methods such as photo-id and biopsy sampling, one can relate age, sex, breeding status and behav-
ior of individuals within a population to their acoustic behaviors (e.g., Croll et al. 2002). Integrated
approaches offer tremendous opportunities for expanding critical knowledge in such diverse areas
as marine vertebrate mating strategies and human impacts on the marine environment.
Acknowledgements
The basis for this synthesis comes from several decades of research sponsored by the National
Geographic Society, New York Zoological Society, National Science Foundation, Naval Research Lab,
North Slope Borough Department of Wildlife Management, and the Office of Naval Research. Jack
Bradbury, Donald Croll, William Ellison, Leila Hatch and Roger Payne provided stimulating discus-
sions. I am indebted to all the staff in the Bioacoustics Research Program for assistance with data
collection, analysis, and interpretation.
References
Charif, R. A., Clapham, P. J. and Clark, C.W. 2001. Acoustic detections of singing humpback whales in
deep waters off the British Isles. Mar. Mamm. Science 17(4):751-768.
Clark, C. W., Charif, R., Mitchell, S., and Colby, J. 1996. Distribution and Behavior of the Bowhead
Whale, Balaena mysticetus, Based on Analysis of Acoustic Data Collected During the 1993 Spring
Migration off Point Barrow, Alaska. Rep. int. Whal. Commn. 46: 541-552.
Clark, C. W., and Ellison, W. T. In press. Potential use of low-frequency sounds by baleen whales for
probing the environment: evidence from models and empirical measurements. in Echolocation in
Bats and Dolphins (J. Thomas, C. Moss and M. Vater, eds.). The University of Chicago Press.
Clark, C.W. and Fristrup, K. 1997. Whales ‘95: A combined visual and acoustic survey of blue and fin
— 105 —
Proceedings from the International Workshop on the Applications of Passive Acoustics to Fisheries
whales off southern California. Rep. Int. Whal. Commn. 47:583-600.
Croll, D. A., Clark, C. W., Acevedo, A., Tershy, B., Flores, S., Gedamke, J. and Urban, J. 2002. Only males fin
whales sing loud songs. Nature 417:809.
Richardson, W. J., C. R. Greene, Jr., C. I. Malme, and D. H. Thomson. 1995. Marine Mammals and Noise.
Academic Press, New York, 576 pp.
Watkins, W. A., M. A. Daher, G. M. Reppucci, J. E. George, D. L. Martin, N. A. DiMarzio, and D. P. Gannon.
2000. Seasonality and distribution of whale calls in the North Pacific. Oceanography 13:62-67.
— 106 —
Proceedings from the International Workshop on the Applications of Passive Acoustics to Fisheries

— 107 —
Proceedings from the International Workshop on the Applications of Passive Acoustics to Fisheries
Illustrations and Diagrams
Blue
Humpback
Time (s)
Figure 1. Spectrograms of blue and humpback songs to illustrate differences in acoustic characteristics for speciespredominantly from pelagic (blue) and coastal (humpback) habitats.
Figure 2. Spectra (solid lines) for pelagic (blue) and coastal (humpback) species overlaid on ambient noise spectra(dashed lines) for the two different habitats.
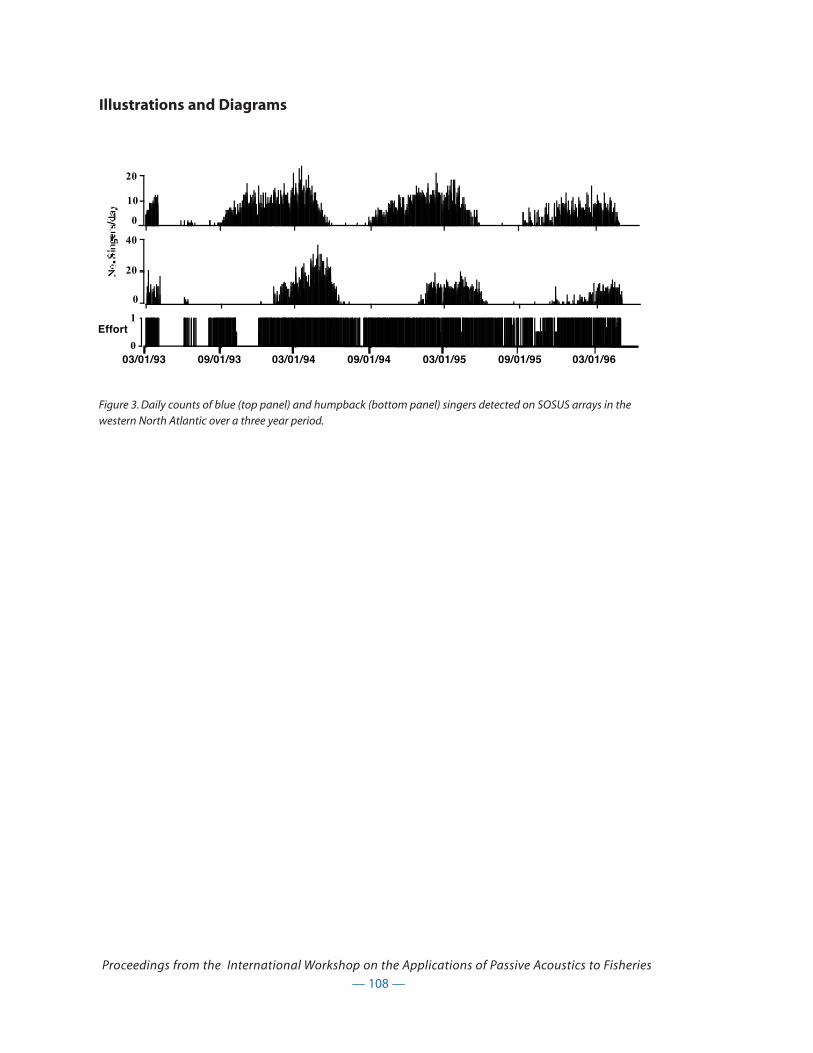
— 108 —
Proceedings from the International Workshop on the Applications of Passive Acoustics to Fisheries
Illustrations and Diagrams
Figure 3. Daily counts of blue (top panel) and humpback (bottom panel) singers detected on SOSUS arrays in thewestern North Atlantic over a three year period.
0
20
10
0
20
40
03/01/93 09/01/93 03/01/94 09/01/94 03/01/95 09/01/95 03/01/96
Effort
0
1
Passive Detection and Localization of Transient Signals from Marine Mammals
using Widely Spaced Bottom Mounted Hydrophones in Open Ocean
Environments
Susan Jarvis and David Moretti
Naval Undersea Warfare Center Division NewportEngineering, Test and Evaluation Department
1176 Howell St., Newport, R.I. 02841-1708
Abstract
One objective of the Marine Mammal Monitoring on Navy Ranges project is to use existing Navy
undersea range infrastructure to develop a toolset for passive detection and localization of marine
mammals. The Office of Naval Research funded the M3R project as part of the Navy’s effort to deter-
mine the effects of acoustic emissions on marine mammals and threatened/ endangered species. A
necessary first step in this effort is the creation of a baseline of behavior which requires long-term
monitoring of marine mammals. Such monitoring, in turn, requires the ability to detect and localize
the animals. This paper will present algorithms for passive detection and localization of transient
signals developed as part of the M3R toolset. It will also present results of the application of these
tools to detection and tracking of various toothed whales at the Atlantic Undersea Test and
Evaluation Center (AUTEC), Andros Island, Bahamas.
Introduction
Navy undersea ranges such as the Atlantic Undersea Test and Evaluation Center (AUTEC) use arrays
of widely spaced bottom mounted hydrophones to acoustically track undersea and surface vehicles.
Traditionally, the vehicles are equipped with acoustic pingers that emit known identification signals
at known repetition rates. Increasingly, range instrumentation infrastructure (Figure 1) is being
applied to non-traditional tracking problems. The Marine Mammal Monitoring on Navy Undersea
Ranges (M3R) program has developed a set of signal processing tools to detect and track marine
mammals using Navy range facilities [1]. Under the M3R program, algorithms were developed to
automatically detect and track two classes of whale vocalizations — clicks and whistles. Both of
these classes of signals are transient in nature. The tool set was recently tested at AUTEC over a two-
week period. Over five hundred square nautical miles of ocean were simultaneously monitored via
68 broad-band hydrophones. Several species of toothed whales where automatically detected and
tracked in real-time. The positional accuracy of the M3R tracking tools was confirmed by visual
sightings by a surface craft and by manual analysis of the hydrophone data.
— 109 —
Proceedings from the International Workshop on the Applications of Passive Acoustics to Fisheries
Discussion
Visual sightings [2] and aural analysis of hydrophone recordings [3] indicate that many species of
toothed whales are present at AUTEC. The most commonly seen and heard are sperm whales, dol-
phins and short finned pilot whales, all of which are present nearly year round. Consequently, the
M3R tools were developed to detect and track these common species. For purposes of algorithm
development, the vocalizations produced by the whales were characterized as clicks and whistles.
Clicks are, in general, any impulsive, broad-band signal. However, sperm whale clicks were of partic-
ular interest. Sperm whale clicks are very distinct, have high source level, and occur in regular pat-
terns [4] or “click trains” (Figure 2). Whistles were more broadly defined as any narrowband event
that sweeps in frequency over time (Figure 3).
There are three distinct parts to the whale localization problem. First the vocalizations or whale
calls must be automatically detected. In order to determine the position of the animal in three
dimensions, a given call must be detected on a minimum of four hydrophones. The second part of
the problem is the association of the detections received on various hydrophones with each other.
That is, one must be able to determine that the call received on hydrophone A at time tA is the
same signal that was received by hydrophone B at time tB. Finally, associated sets of arrival times
are input into a multilateration algorithm to solve for position. A three-dimensional hyperbolic posi-
tioning model [5] is used to determine the vocalizing animal’s location in X, Y, and Z as well as the
time of emission of the call.
M3R employs a real-time frequency domain energy detector for whale call detection. A spectrogram
of the incoming acoustic data from each of the hydrophones is formed using 512-point fast Fourier
transforms (FFT) with a rectangular window and fifty percent overlap. The resultant spectrogram
has a frequency resolution of approximately 51 Hz and a time resolution of approximately 9.8 ms.
Each time-frequency bin of the spectrogram is compared to a time varying threshold, D(f,t). The
threshold is set to be m dB above the (time) average power within frequency bin f. The output of the
detector, Qi(f,t), for each hydrophone, is a binary valued “detection spectrogram” which contains a 1
in each time-frequency bin that exceeded D(f,t) and a 0 everywhere else (Figure 4). The detection
spectrogram indicates, in real-time, the presence of whale vocalizations as well as providing infor-
mation on their frequency content. As evident in Figures 2 and 3, the signal structure of (sperm
whale) clicks is very different from the signal structure of whistles. Therefore, separate detection
association algorithms were developed for each signal type.
A series of clicks from a single sperm whale exhibits nearly the same inter-click interval on all receiv-
ing hydrophones. Calls from each additional animal exhibit their own unique pattern. In fact, inter-
click interval patterns were found to be an effective means of both differentiating between individ-
ual whales and associating patterns of detections among hydrophones [6]. In the first step of the
M3R click association algorithm the time-frequency detection spectra from all hydrophones were
reduced to binary “click maps”. Click maps contain a 1 for time indices where broad band events
occurred in the detection spectrum and 0 for all other times (Figure 5). Conceptually, the next step
is to cross correlate the click maps from several hydrophones with a master hydrophone to find the
difference in time of arrival between each hydrophone and the master. However, care must be
— 110 —
Proceedings from the International Workshop on the Applications of Passive Acoustics to Fisheries
taken in implementing the cross correlation in order to properly associate each click detection
among the hydrophones. Figure 6a shows an example of a click map from a single hydrophone
containing clicks from two individuals. Figure 6b shows the click map from a second hydrophone
over the same time period. The question is which clicks in figure 6b belong to which individual?
The M3R click association algorithm uses the notion of a “scanning sieve” [7] to match detection pat-
terns between hydrophones. The sequence of click detections (i.e. click map) within the scanning
sieve on the master channel is compared to the clicks maps from surrounding hydrophones
(“scanned” signals). The scanning sieve time window always starts on a click detection, and is
moved across the scanned signal one click detection at a time. That is, the resultant correlation
value at any time delay represents the number of matches between the master channel pattern
starting a specific click and the scanned channel pattern starting at a specific click. The delay of the
maximum correlation value represents the difference in time of arrival where the first clicks in the
scanning sieve and the scanned signal were best aligned. The output of the scanning sieve process
are sets of time difference of arrival (TDOA) for each click detection received on the master channel
(Figure 7). The TDOA data from each hydrophone are then histogrammed to estimate the number
of separable sources (Figure 8). Only detections associated with significant populations are used
(Figure 9). These associated TDOA sets are then sent to the AUTEC multilateration tracking algo-
rithm which calculates 3D position.
Whistle vocalizations do not typically follow known repetition patterns. An individual can emit a
single short whistle or groups of sweeps that last several seconds or both. However, the time-fre-
quency characteristics of the calls in whatever sequence they may occur remain the same on all
receiving hydrophones. To determine the TDOA of signals among the hydrophones, the detection
spectrograms Q(f,t) of the available hydrophones are cross-correlated against a master channel, M
[8]. The cross correlation Ci(t,_) between the i-th channel and the master channel is calculated over a
time window of approximately 6 to 10 seconds. That time window is then advanced by one half its
duration and Ci(t,_) is updated.
Ci(t,τ)=ΣΣQM(f,t)Qi(f, t+τ)
The time delay associated with the peak of the correlation functions indicates the TDOA for a signal
relative to the master hydrophone (Figure 10a). If whistles from multiple whales are present within
a cross correlation time window, multiple correlation peaks will be evident (Figure 10b). Note that if
both clicks and whistles are present at the same time, sperm whale clicks will dominate the detec-
tion spectra. Correlation peaks due to whistle signals will be obscured. Therefore, for practical pur-
poses, broad-band click events should be removed from the detection spectra prior to cross correla-
tion.
While cross correlation of detection spectra indicates times of signal arrival and the presence of
multiple whales, it does not associate the time delays of the correlation peaks with an individual
across the hydrophone channels. However, as mentioned early, the sequence of whistles from an
individual is the same on all receiving hydrophones. Figure 11 shows the time differences of arrival
relative to a master hydrophone of the correlation peaks for five hydrophones. Notice that there are
— 111 —
Proceedings from the International Workshop on the Applications of Passive Acoustics to Fisheries
two distinct patterns of detections versus time along specific time delays. Matching these patterns
along time delays associates the TDOA’s among the hydrophones with an individual whale.
Associated sets of TDOA can then be the sent to the multilateration tracking algorithm which calcu-
lates 3D position.
Recent Results
The M3R toolset was demonstrated at AUTEC as part of a joint experiment with researchers from
Woods Hole Oceanographic Institution (WHOI). The WHOI team was testing a new whale tagging
system [9]. The M3R algorithms were used with sixty-eight of the AUTEC hydrophones to monitor
over 500 sq. NMi. When marine mammals were localized, their positions were relayed to the tagging
vessel, which then endeavored to maneuver close enough to place a tag.
The detection, association and tracking algorithms described in Section 2.0 were implemented to
run in real-time for arrays of five to seven hydrophones. Given that there were 68 hydrophones to
monitor, other display tools were used to broadly locate whales before applying the high resolution
positioning algorithm. The Circle display is a Matlab program that shows the number of detections
on each hydrophone by drawing a circle around the respective hydrophone. The number of detec-
tions per minute is mapped to the color of the circle. Figure 12 shows an example of the Circle dis-
play while two groups of whales were on the range. The bright circles around Hydrophone 85 were
caused by a single clicking sperm whale. The bright circles around Hydrophone 53 were caused by
a group of pilot whales just off the range (hydrophones 47, 48, 54 and 55 were not monitored). The
WHOI team successfully tagged two of the pilot whales shortly after this picture was taken.
The strip chart program displays the detection spectrogram from a particular hydrophone in real-
time. The program reads the detection data from a server process allowing the user to run multiple
charts on multiple computers simultaneously. During the AUTEC tests this display was quite handy
for monitoring phones over a wide area. At various times, both broad sperm whales clicks, and pilot
whale clicks and whistles were evident (Figure 13).
Both the click association and whistle association algorithms worked well during the exercise.
Vocalizing whales were heard on range almost everyday. At different times, individuals and/or
groups of sperm whales, short finned pilot whales, roughed toothed dolphins, melon headed
whales and even a beaked whale were all detected and tracked by the M3R algorithms. The track
positions produced by M3R were confirmed by GPS readings and visual observations from the tag-
ging vessel, as well as by manual monitoring of the hydrophones. Figures 14a-b show an example
of real-time X-Y position and depth plots for a group of two or three sperm whales. The depth plot
indicates that these whales were likely performing deep feeding dives. On some dives monitored
during the test, sperm whales were tracked at depths of 1000 to 1200 m. Figure 14c shows the
depth track for a single sperm whale that was performing shallow, near-surface dives. Figure 15
shows the real-time X-Y position plot for a group of whistlers, which were later identified by WHOI
team members as roughed toothed dolphins and melon headed whales.
— 112 —
Proceedings from the International Workshop on the Applications of Passive Acoustics to Fisheries

Summary
The M3R project has developed algorithms for the passive detection and tracking of marine mam-
mals using widely spaced, bottom-mounted hydrophones characteristic of Navy undersea tracking
ranges. While these algorithms have been implemented and tested for deployment at the AUTEC,
they are applicable to any fixed or portable range that uses multilateration tracking algorithms.
Potential ranges with the hardware to support the M3R system include the Pacific Missile Range
Facility, the Southern California Offshore Acoustic Range, and any of the Navy’s various portable sys-
tems.
The M3R algorithms have been designed to work in a highly channelized multi-processor hardware
environment, and the software architecture has been developed to be fully network compatible.
Signal detection, and detection-association algorithms for two primary types of whale calls, whistles
and clicks, have been developed. These algorithms are specifically designed to be used with widely
spaced sensors, and assume that the marine mammals vocalize repetitively with sufficient source
levels to be detected on multiple hydrophones.
The M3R algorithms, for both clicks and whistles, have been successfully demonstrated resulting in
real time 3D tracking of several species of toothed whales including sperm whales, rough toothed
dolphins, melon headed whales and pilot whales. The M3R tool set allows automated collection of
data previously unavailable for the long-term monitoring of marine mammal bioacoustics within
their natural environment. This opportunity has been created with minimal investment in infra-
structure by providing Navy ranges as a dual-use asset. Research applications of the M3R system
include the ability to remotely estimate marine mammal abundance, assessment of bioacoustic
behavioral baselines, and evaluation of the impact of anthropogenic noise compared to those base-
lines.
Acknowledgements
We would like to acknowledge our sponsor, Dr. Robert Gisiner, at the Office of Naval Research, for
funding this project. We would also like to thank the AUTEC personnel, especially Thomas Szlyk, for
access to their considerable infrastructure and ongoing support. In addition, we would like to thank
the NUWC Division Newport ILIR program manager, Richard Philips, for supporting the initiative to
create a baseline sperm whale bioacoustic characterization in the Tongue of the Ocean (TOTO).
References
[1] Moretti, D., et al.,“Marine Mammal Monitoring on Navy Ranges (M3R)”, Proceedings of the
Undersea DefenseTechnology Hawaii 2001 Conference, October 2001.
[2] Naval Undersea Warfare Center Detachment AUTEC,“Final Environmental Review, Adoption of a
Range Management Plan for the Atlantic Undersea Test and Evaluation Center (AUTEC), Andros
— 113 —
Proceedings from the International Workshop on the Applications of Passive Acoustics to Fisheries
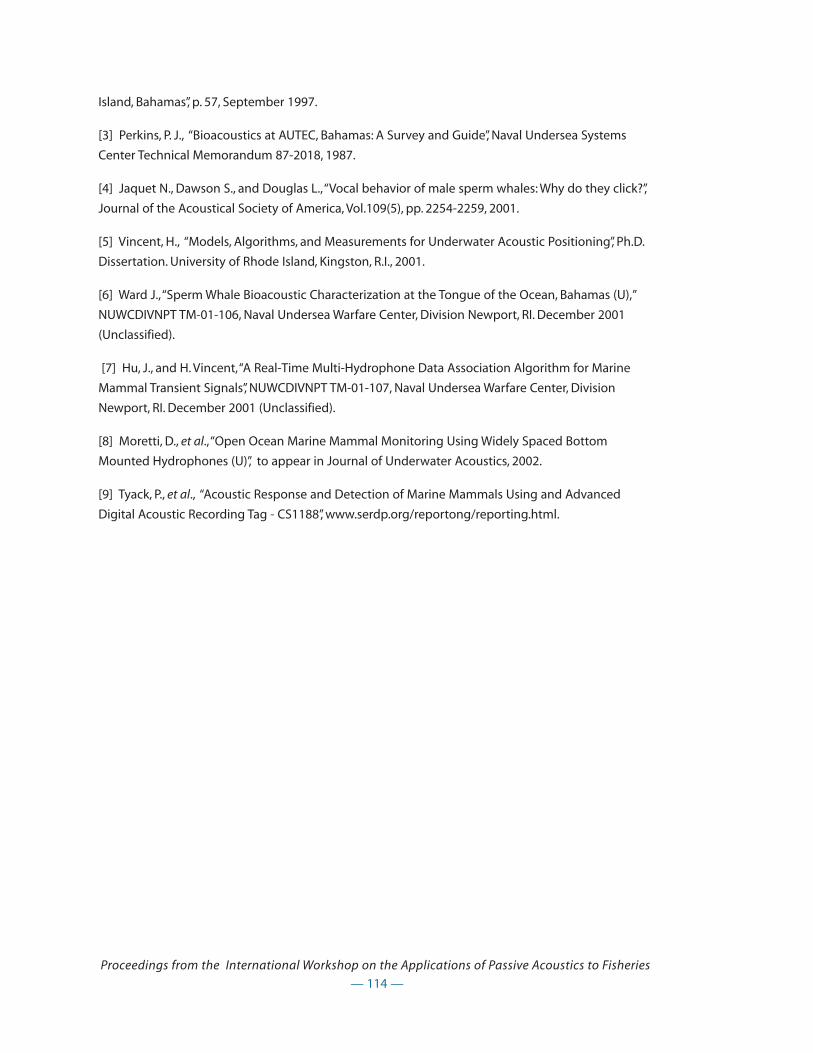
Island, Bahamas”, p. 57, September 1997.
[3] Perkins, P. J., “Bioacoustics at AUTEC, Bahamas: A Survey and Guide”, Naval Undersea Systems
Center Technical Memorandum 87-2018, 1987.
[4] Jaquet N., Dawson S., and Douglas L.,“Vocal behavior of male sperm whales: Why do they click?”,
Journal of the Acoustical Society of America, Vol.109(5), pp. 2254-2259, 2001.
[5] Vincent, H., “Models, Algorithms, and Measurements for Underwater Acoustic Positioning”, Ph.D.
Dissertation. University of Rhode Island, Kingston, R.I., 2001.
[6] Ward J.,“Sperm Whale Bioacoustic Characterization at the Tongue of the Ocean, Bahamas (U),”
NUWCDIVNPT TM-01-106, Naval Undersea Warfare Center, Division Newport, RI. December 2001
(Unclassified).
[7] Hu, J., and H. Vincent,“A Real-Time Multi-Hydrophone Data Association Algorithm for Marine
Mammal Transient Signals”, NUWCDIVNPT TM-01-107, Naval Undersea Warfare Center, Division
Newport, RI. December 2001 (Unclassified).
[8] Moretti, D., et al.,“Open Ocean Marine Mammal Monitoring Using Widely Spaced Bottom
Mounted Hydrophones (U)”, to appear in Journal of Underwater Acoustics, 2002.
[9] Tyack, P., et al., “Acoustic Response and Detection of Marine Mammals Using and Advanced
Digital Acoustic Recording Tag - CS1188”, www.serdp.org/reportong/reporting.html.
— 114 —
Proceedings from the International Workshop on the Applications of Passive Acoustics to Fisheries
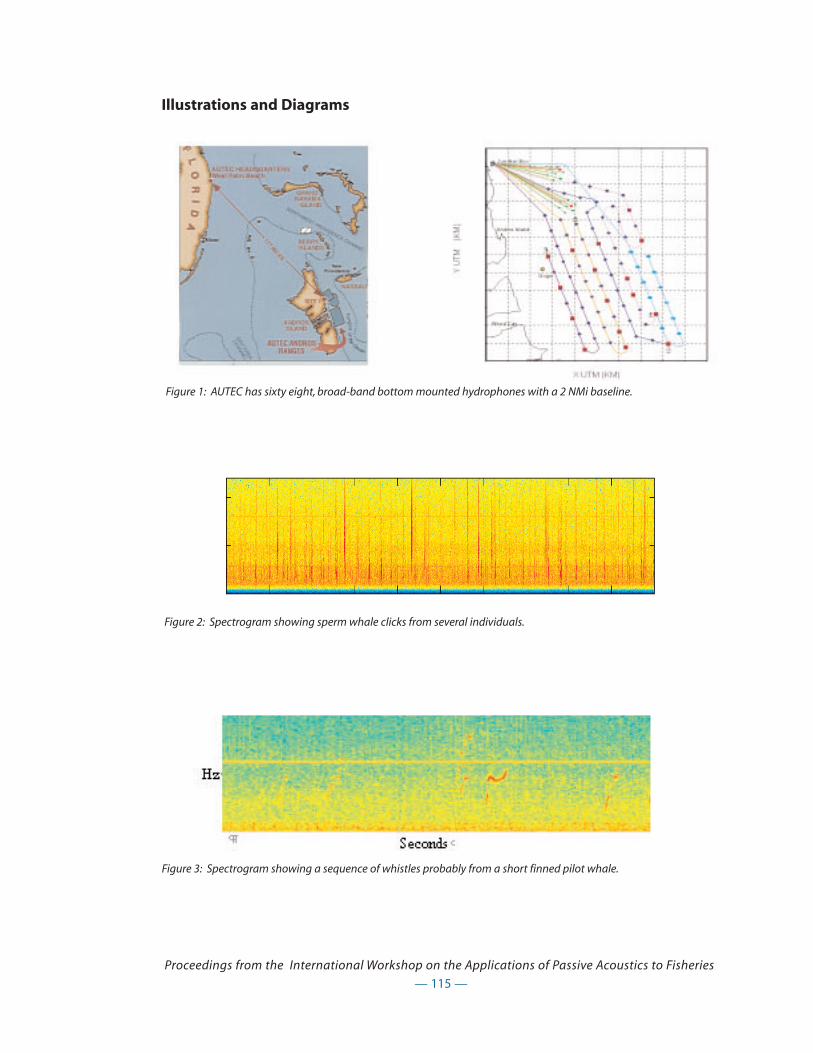
— 115 —
Proceedings from the International Workshop on the Applications of Passive Acoustics to Fisheries
Illustrations and Diagrams
Figure 2: Spectrogram showing sperm whale clicks from several individuals.
Figure 3: Spectrogram showing a sequence of whistles probably from a short finned pilot whale.
Figure 1: AUTEC has sixty eight, broad-band bottom mounted hydrophones with a 2 NMi baseline.
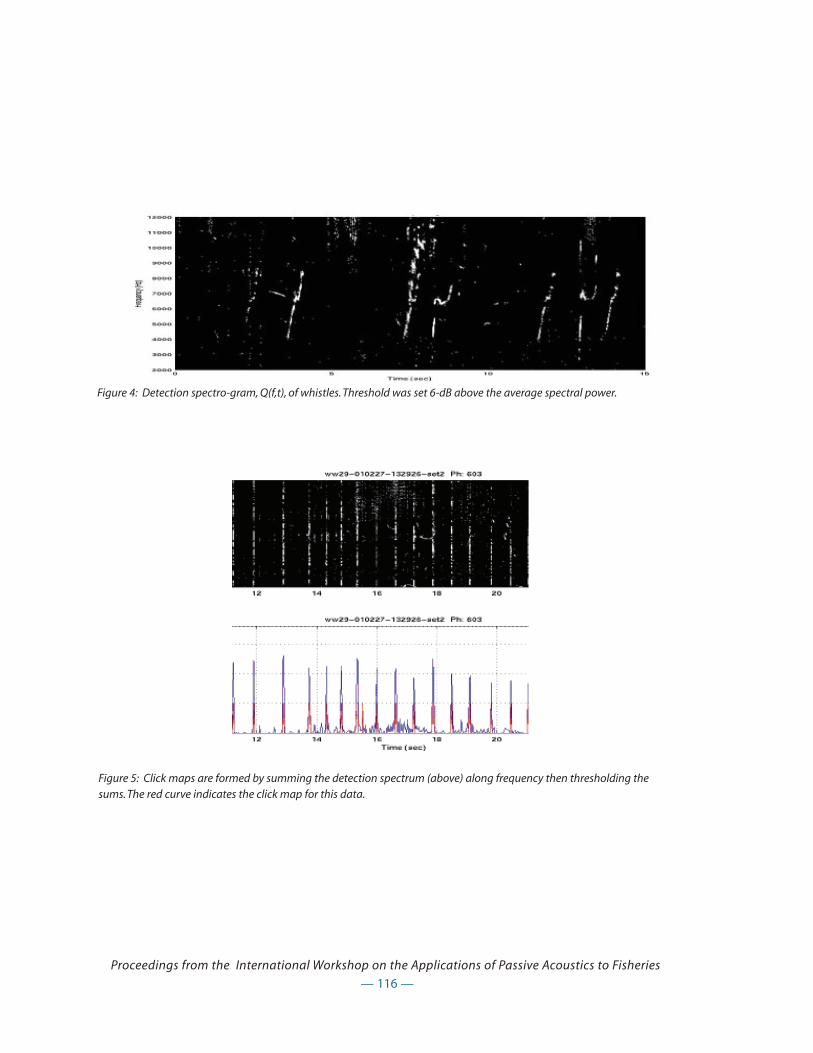
— 116 —
Proceedings from the International Workshop on the Applications of Passive Acoustics to Fisheries
Figure 4: Detection spectro-gram, Q(f,t), of whistles. Threshold was set 6-dB above the average spectral power.
Figure 5: Click maps are formed by summing the detection spectrum (above) along frequency then thresholding thesums. The red curve indicates the click map for this data.

— 117 —
Proceedings from the International Workshop on the Applications of Passive Acoustics to Fisheries
Figure 7: Preliminary output of the M3R click association algorithm showing the estimated TDOA between the scan-ning sieve, hydrophone 611, and five additional hydrophones
Figure 6: Click maps for two hydrophones containing clicks from two individuals. It is not evident which clicksreceived by hydrophone B are associated with Source 1 or Source 2.

— 118 —
Proceedings from the International Workshop on the Applications of Passive Acoustics to Fisheries
Figure 9: Final output of the click association algorithm for calls from a single sperm whale. The points indicate theTDOA at which the algorithm found the best matches between the scanning sieve and the clicks maps ofhydrophones 605, 603, 604, 612 and 606 relative to master hydrophone, 611. Notice the minimal scatter of the TDOApoints.
Figure 8: Above is the output of the click association algorithm for hydrophone 612 (indicated in purple in figure 7).Two separate times of arrival are evident indicating the presence of 2 whales. A histogram of the TDOA data showstwo significant populations.

— 119 —
Proceedings from the International Workshop on the Applications of Passive Acoustics to Fisheries
Figure 10:
a)Results of cross correlation indicating the TDOA of the signal from one whale.
b)Cross correlation results indicating the TDOA’s of signals from two whales.
Figure 11: TDOA data resulting from cross correlations of five hydrophones against a master hydrophone. Two indi-vidual whales show two distinct patterns (indicated by purple and green boxes) of detections versus time along spe-cific TDOA’s.
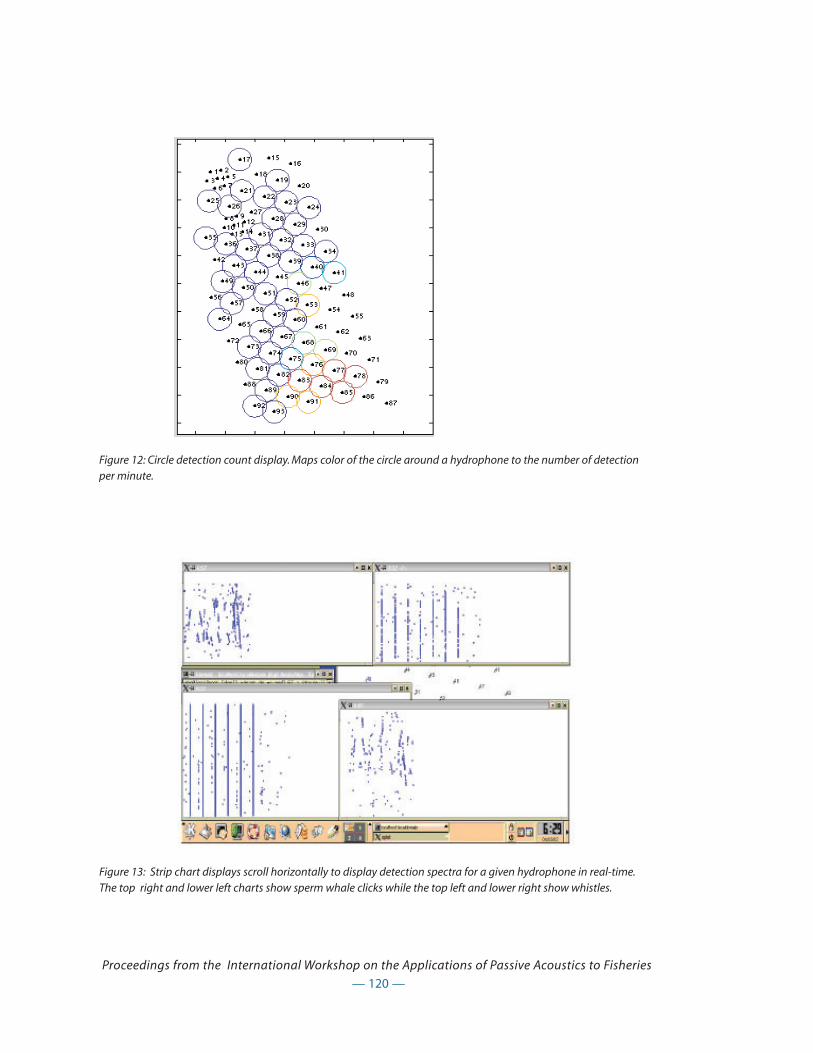
— 120 —
Proceedings from the International Workshop on the Applications of Passive Acoustics to Fisheries
Figure 13: Strip chart displays scroll horizontally to display detection spectra for a given hydrophone in real-time.The top right and lower left charts show sperm whale clicks while the top left and lower right show whistles.
Figure 12: Circle detection count display. Maps color of the circle around a hydrophone to the number of detectionper minute.
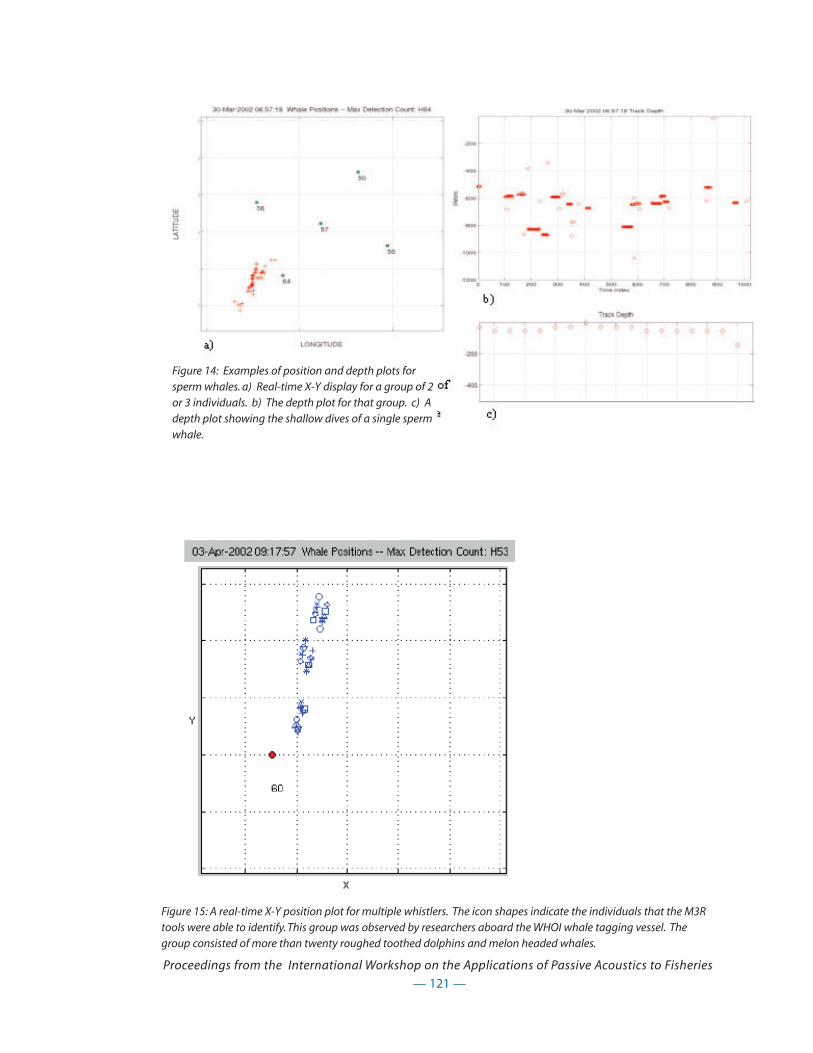
— 121 —
Proceedings from the International Workshop on the Applications of Passive Acoustics to Fisheries
Figure 15: A real-time X-Y position plot for multiple whistlers. The icon shapes indicate the individuals that the M3Rtools were able to identify. This group was observed by researchers aboard the WHOI whale tagging vessel. Thegroup consisted of more than twenty roughed toothed dolphins and melon headed whales.
Figure 14: Examples of position and depth plots forsperm whales. a) Real-time X-Y display for a group of 2or 3 individuals. b) The depth plot for that group. c) Adepth plot showing the shallow dives of a single spermwhale.
Multihydrophone localization of low frequency broadband sources
Stephen E. Forsythe
Naval Undersea Warfare Center, 1176 Howell Ave, Newport RI 02841 USA,
Introduction
To localize high areas of fish activity and adequately characterize fish behavior, it is useful to localize
individual fish by their emitted sounds over a range of 10s-100s of meters. In theory, one can use
multiple hydrophones distributed in space to localize a source position/direction: using time-of-
flight differences among the hydrophones, generate multiple hyperboloids then solve for the sur-
faces’ intersection to give a unique position for the source, perhaps in the least-squares sense. In
practice, this is difficult for low frequency signals generated by fish (thumps, etc.) because the
onsets of the signals are not well defined. By using cross correlations among the received signals as
a “fuzzy” measure of time difference it is possible to do the equivalent of the intersecting hyper-
boloids calculation with an uncertain measure of time differences, giving the equivalent of a proba-
bility density of source location over a predetermined space of a priori possible locations.
The proposed method of tracking should be flexible, easily deployed, and self-calibrating. A useful
side benefit of this kind of computerized fish tracking is to provide a record of vocalizations for later
processing.
Prior art: conventional beamforming approach
A conventional beamformer coherently adds the outputs of several hydrophones using time delays
per hydrophone to emphasize energy arriving from a particular direction (and to suppress energy
arriving from other directions). In general, the spacing among hydrophones must be several times
the wavelength of the detected sound to form an accurate estimate of direction; in addition, con-
ventional arrays of hydrophones have ambiguity in locating a sound source (e.g., the angular ambi-
guity around a line array).
Alternative: Position estimates from time differences among hydrophone pairs
An alternative to beamforming is to use a “loose” array of hydrophones with an irregular geometry
to perform the localization. In this method, hydrophones are used in pairs. For each pair, correlated
pulses of sound arriving with a time difference (t between hydrophones correspond to a single
— 122 —
Proceedings from the International Workshop on the Applications of Passive Acoustics to Fisheries

source whose position lies on a hyperboloid with the hydrophone pair at the foci. Using several
pairs of hydrophones reduces the problem of location to finding the intersection (possibly in the
least squares sense) of several hyperboloids. The problem with this method is that uncertainty in the
required (t produces an uncertain estimate of the hyperboloids’ intersections. This uncertainty is rel-
atively small for high frequency clicks, but is greater at low frequencies or for narrowband signals
like thumps and whistles.
To overcome the effects of uncertainty, it is useful to keep the estimates of (t “fuzzy” by replacing the
number (by a probability distribution around the most likely (t. The use of statistics derived from the
cross correlation functions between pairs of hydrophones does exactly this. Data from multiple
hydrophone pairs can be fused into a single coherent picture by combining statistics from several
hydrophone pairs in a manner to multiplying probabilities of independent events to obtain the
probability of all events occurring simultaneously.
Position estimation experiment
To test the effectiveness of the localization technique, 5 hydrophones were deployed in a lake. The
hydrophones were arranged as vertices of an inverted square pyramid 1 meter on a side with the
apex 1 meter below the base.
Figure 1 below shows the “fuzzy” surface (mapped as a Mercator projection using elevation from
the horizontal plane and “longitude” around the equator) formed from the magnitude of the cross
correlation function of a cusk-eel sound as measured by a pair of hydrophones in the array. The dark
red areas are the most likely positions of the source as measured by the magnitude of the cross cor-
relation of the two hydrophones’ signals. Figure 2 represents the product of the first two cross cor-
relation magnitudes.
The improvement using just two pairs is dramatic. Finally, figure 3 below shows the results of includ-
ing all hydrophone pairs in the product.
Discussion
The technique described above performs well in a low-noise environment. By simulation, several
potential sources of error were modeled using the acoustic data gathered in the original experi-
ment. The error sources considered were
1. Uncertainty in hydrophone positions (contaminates all measurements);
2. Uncertainty in signal arrival times;
3. Signals at hydrophones not exact copies of source (directivity of source);
4. Reverberation (images of the signal from boundaries);
5. Ambient noise;
— 123 —
Proceedings from the International Workshop on the Applications of Passive Acoustics to Fisheries

6. Overlapping signals from multiple sources.
Of the 6 sources of error, the most damaging were numbers 4 and 6. Because the estimation process
used has a nonlinear component (product of magnitudes), multiple signals received simultaneously
from the same type of fish generate multiple cross correlation peaks. These in turn generate spuri-
ous product terms when multiplied together to form the final estimate. The minimization of this
effect is the subject of future research.
— 124 —
Proceedings from the International Workshop on the Applications of Passive Acoustics to Fisheries

— 125 —
Proceedings from the International Workshop on the Applications of Passive Acoustics to Fisheries
Illustrations and Diagrams
Figure 1. Magnitude of the broadband cross correlation (dB relative to max) for 2 hydrophones (apex and 1 base).
Figure 2. product of correlation magnitudes for the first 2 hydrophone pairs.
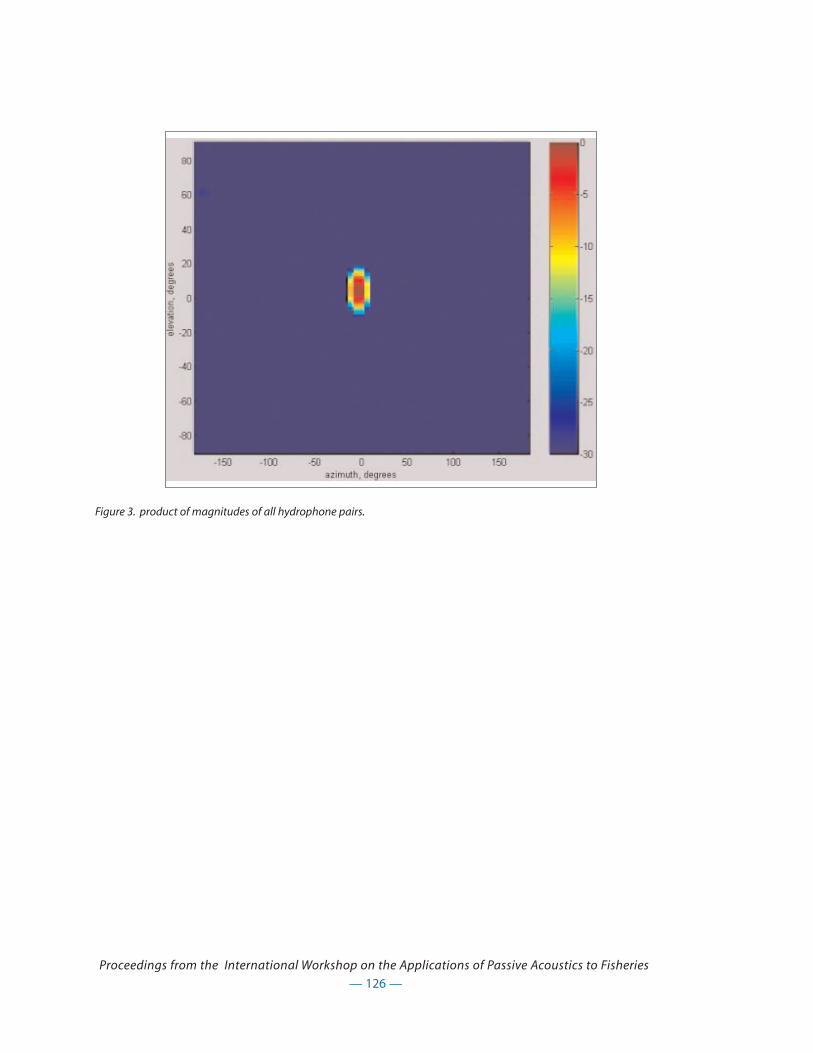
— 126 —
Proceedings from the International Workshop on the Applications of Passive Acoustics to Fisheries
Figure 3. product of magnitudes of all hydrophone pairs.

Synchronized underwater audio-video recording
Phillip S. Lobel
Boston University Marine Program, Marine Biological Laboratory
Woods Hole, MA 02543
Extracted from: Lobel P. S. 2001 Fish bioacoustics and behavior: passive acoustic detection and the
application of a closed-circuit rebreather for field study. Marine Technology Society Journal, 35:19-28
Introduction
One advanced technique used in undersea research to study fish acoustic behavior is simply the
interdisciplinary application of established acoustic technology combined with new mini-video
cameras and hydrophones while diving with a UBA rebreather. Rebreathers and hydrophones have
been around for more than 40 years but it has been only in the last decade that video cameras and
hydrophones have become miniaturized. Most importantly, these video cameras are equipped with
audio input enabling synchronous audio-video recording. Acoustic signal analysis is also greatly
simplified by direct connections to advanced portable computers and new sound analysis software.
Even so, the basic situation is the same now as when Steinberg and Koczy (1964) stated, "the princi-
ple accomplishment of the techniques for underwater observation is that of extending man’s senses
of sight and hearing underwater".
Being able to observe and record the sonic behavior of marine animals was recognized as an impor-
tant scientific approach to understanding fish behavior ever since it was first revealed that sounds
were integral to behavior in many species (Fish 1954, Griffin 1955, Moulton 1958, Tavolga 1960). The
approach that I use in recording bioacoustics was pioneered in the 1960’s at the Lerner Marine
Laboratory in Bimini, Bahamas and during missions of the underwater habitat, TEKTITE. In 1963, a
television and hydrophone system was deployed in about 20m depth and linked by cable to the
Lerner lab with a room full of electronic equipment for recording (see figures in Kronengold et al.
1964). This system recorded a variety of sounds but the fixed camera did not usually catch the iden-
tity of the sound producer (Kumpf 1964). This early system did, however, clearly document several
temporal patterns of distinctive sound production by marine animals (Cummings et al. 1964). This
system was also used for the playback of sounds to determine the effectiveness of pulsed low fre-
quency sounds for attracting sharks and other fishes (Richard 1968, Myrberg et al. 1969). During the
TEKTITE missions of 1969, divers used rebreathers from an underwater habitat to record fish sounds
using a 8mm film movie camera and a tape-recorder with hydrophone operated independently but
simultaneously (Bright 1972). Bright clearly noted the benefit of the noiseless rebreather when
— 127 —
Proceedings from the International Workshop on the Applications of Passive Acoustics to Fisheries
recording fish behavior. The two major advances today are 1) advanced video and hydrophone tech-
nology enabling truly synchronous audio recording (in a much smaller package) and 2) the
increased reliability of electronic rebreather systems.
Bubble Noise
Bubbles not only produce noisy sounds but also near-field vibrations in the water (Fig. 1, 2). This
water disturbance is probably similar to the hydrodynamic disturbances produced by fast moving
predators to which most fish are especially sensitive by means of their lateral line and sensory pore
system. The common range of reef fish hearing is roughly between 20 and 1000 Hz although some
hearing specialist species can hear in ranges up to 10 KHz. One herring species can hear at 180 KHz
(Hawkins 1981, Mann et al.1997, Popper and Fay 1998). However, it is fair to note that some fish
apparently habituate to boat and scuba noise, as is seen at some marine protected areas or other
sites with high diver activities. For example, I recently recorded a situation where scuba and exces-
sive boat noise did not affect the mating activity of the damselfish, Dascyllus reticulatus in a lagoon
(Lobel pers. obs., Saipan, July 2000).
I started recording the acoustic behavior of free ranging fishes in 1988 using open circuit scuba and
first generation 8mm camcorders connected to a hydrophone (Lobel 1992). Because of the scuba
bubbles, I had to spend many hours per day in the water to allow the subject fish to habituate to my
presence. This required remaining motionless on the bottom for long periods and carefully control-
ling my breathing so that only a trickle of tiny bubbles was slowly exhaled (Figure 3). This somewhat
avoided the louder noise caused by a big burst of bubbles from a single exhalation. In order to
obtain quality acoustic recordings without scuba bubble noise interference, acoustic measurements
were edited in the lab from those portions of the video made between breaths. Thus, divers needed
to be very disciplined in their respiratory pace and activity while recording.
We started using a rebreather three years ago and, without a doubt, it is the most successful
method for obtaining fish behavioral and bioacoustic data (Lobel and Kerr, pers. obs). Beginning
with my first field experience with the rebreather (after 31 years of scuba), I was greatly impressed
with how differently fish behaved when there were no bubbles. The great advantage of the
rebreather is to allow us to approach animals more closely. But this is also a bit more risky for the
same reason. I have found that eels and grey reef sharks are more inquisitive and approach much
closer without noisy bubbles. On the other hand, the only time I experienced a school of juvenile
parrotfish actually swim toward and over me, as if I was just a rock, was when using a rebreather.
This aspect of using rebreathers will have its most significant impact on the practice of conducting
— 128 —
Proceedings from the International Workshop on the Applications of Passive Acoustics to Fisheries
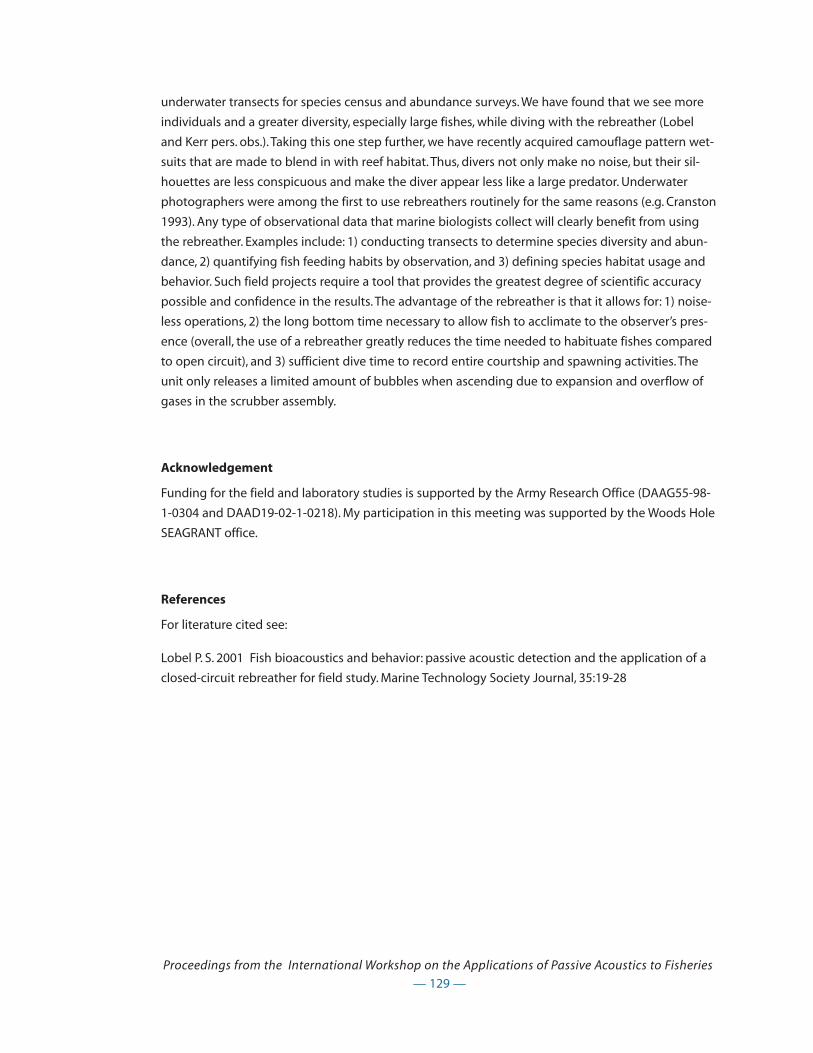
underwater transects for species census and abundance surveys. We have found that we see more
individuals and a greater diversity, especially large fishes, while diving with the rebreather (Lobel
and Kerr pers. obs.). Taking this one step further, we have recently acquired camouflage pattern wet-
suits that are made to blend in with reef habitat. Thus, divers not only make no noise, but their sil-
houettes are less conspicuous and make the diver appear less like a large predator. Underwater
photographers were among the first to use rebreathers routinely for the same reasons (e.g. Cranston
1993). Any type of observational data that marine biologists collect will clearly benefit from using
the rebreather. Examples include: 1) conducting transects to determine species diversity and abun-
dance, 2) quantifying fish feeding habits by observation, and 3) defining species habitat usage and
behavior. Such field projects require a tool that provides the greatest degree of scientific accuracy
possible and confidence in the results. The advantage of the rebreather is that it allows for: 1) noise-
less operations, 2) the long bottom time necessary to allow fish to acclimate to the observer’s pres-
ence (overall, the use of a rebreather greatly reduces the time needed to habituate fishes compared
to open circuit), and 3) sufficient dive time to record entire courtship and spawning activities. The
unit only releases a limited amount of bubbles when ascending due to expansion and overflow of
gases in the scrubber assembly.
Acknowledgement
Funding for the field and laboratory studies is supported by the Army Research Office (DAAG55-98-
1-0304 and DAAD19-02-1-0218). My participation in this meeting was supported by the Woods Hole
SEAGRANT office.
References
For literature cited see:
Lobel P. S. 2001 Fish bioacoustics and behavior: passive acoustic detection and the application of a
closed-circuit rebreather for field study. Marine Technology Society Journal, 35:19-28
— 129 —
Proceedings from the International Workshop on the Applications of Passive Acoustics to Fisheries
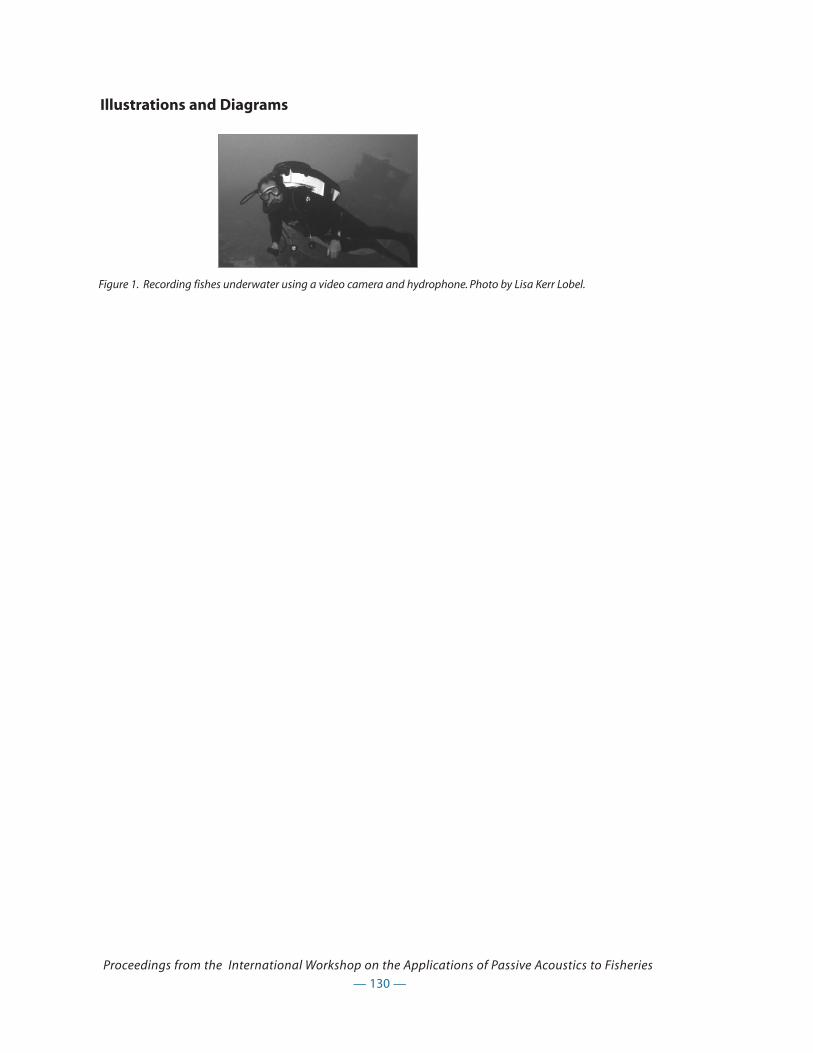
— 130 —
Proceedings from the International Workshop on the Applications of Passive Acoustics to Fisheries
Illustrations and Diagrams
Figure 1. Recording fishes underwater using a video camera and hydrophone. Photo by Lisa Kerr Lobel.
New technologies for passive acoustic detection of fish sound production
David A. Mann
University of South Florida, College of Marine Science, 140 Seventh Avenue South, St. Petersburg, FL,
33701 USA. [email protected]
Introduction
Passive acoustic detection of fish sounds relies heavily on advances in recording and data process-
ing technology. The recent explosion in fast, inexpensive personal computers and electronics has
created tremendous growth potential in the field. This paper describes early efforts in developing
passive acoustic detection systems for fishes and more recent efforts utilizing digital systems. The
goals of each of these systems were to automatically detect and quantify sounds of interest in real-
time, minimize false detections, and minimize the amount of data that needs to be stored to deter-
mine calling rates continuously over long periods of time.
First Generation Passive Acoustic Detection System
Most fish sounds are either simple pulsed broad-band sounds or tonal type sounds, where the pulse
rates or dominant frequency are species-specific (e.g. Lobel and Mann, 1995; Mann and Lobel, 1998;
reviewed in Zelick et al., 1999). Fish sounds do not typically exhibit complex frequency modulations
seen in many marine mammal vocalizations. This makes it possible to describe most fish sounds
with a few metrics, such as sound duration, peak frequency, and bandwidth. Timing between pulses
can be recorded by storing the time of onset of each pulse. By recording these simple metrics, a sys-
tem can be developed to automatically detect and process sounds of interest and greatly reduce
the amount of data that would be acquired by simply recording continuously.
Early attempts at passive acoustic detection involved developing a largely analog system that
would detect sounds that were above some background level and store the time of occurrence and
sound duration (actual sound data were not stored) (Mann and Lobel, 1995) (Fig. 1). From these
data, the rate of sound production of different species’ sounds could be determined. This system
was employed to measure sound production rates of individual damselfish over periods of months,
and revealed a striking dawn chorus in sound production and a tight link between sound produc-
tion and spawning cycles (Mann and Lobel, 1995).
Real-Time Digital Signal Processing Systems
— 131 —
Proceedings from the International Workshop on the Applications of Passive Acoustics to Fisheries
While the analog system was a robust detector, continued increases in data storage capacities and
the emergence of inexpensive digital signal processing chips and the flexibility that these provide,
prompted the development of a programmable digital system. This system is commercially pro-
duced by Tucker-Davis Technologies (Gainesville, FL) and consists of a battery-powered datalogger
with two channels of A/D, 32 MB of RAM, and a graphical programming interface. The flexibility of
the datalogger is that it can be used to process the signal in real-time including a wide array of fil-
tering (FIR, IIR) techniques and adaptive thresholding. The datalogger can be programmed to store
whatever data is desired by the researcher. To demonstrate its flexibility, a device was programmed
to detect the sounds produced by the toadfish Opsanus beta, store the time of occurrence of the
sound and record a 1000-point sound sample (Fig 2).
The Future of Fisheries Bioacoustics
The primary tools for the fish bioacoustician will remain the PC and continuous digital recording
systems for some time. To promote the emergence of fisheries bioacoustics requires more research
into the sounds made by different fish species and the development of new technologies that uti-
lize these data.
Ultimately fisheries bioacoustics should move the way of fisheries acoustics where the signal output
is not the actual sound data, but the locations and intensity of fish spawning.
A useful analogy is the development of SONAR systems for fish quantification. These systems do
not deliver raw sound data to the researcher. They return processed data on fish location and abun-
dance. One can envision the day when real-time fisheries bioacoustics systems will produce maps
of the locations of sound-producing fishes that can provide managers with data on the temporal
and spatial extent of spawning.
Acknowledgments
My introduction and passion for the field of passive acoustic detection was driven by my Ph.D. advi-
sor Phillip Lobel. Support for the development of the digital datalogger was provided to TDT by an
NIH grant to the author.
References
Lobel, P.S. and D.A. Mann. 1995. Spawning sounds of the damselfish, Dascyllus albisella
(Pomacentridae), and relationship to male size. Bioacoustics 6: 187-198.
Mann, D.A., and P.S. Lobel. 1995. Passive acoustic detection of sounds produced by the damselfish,
Dascyllus albisella (Pomacentridae). Bioacoustics 6: 199-213.
— 132 —
Proceedings from the International Workshop on the Applications of Passive Acoustics to Fisheries

Mann, D.A., and P.S. Lobel. 1998. Acoustic behavior of the damselfish Dascyllus albisella: behavioral
and geographic variation. Environ. Biol. Fish. 51: 421-428.
Zelick, R., D.A. Mann, and A.N. Popper. 1999. Acoustic communication in fishes and frogs. In:
Comparative Hearing: Fish and Amphibians. Springer, New York. pp. 363-411.
— 133 —
Proceedings from the International Workshop on the Applications of Passive Acoustics to Fisheries

— 134 —
Proceedings from the International Workshop on the Applications of Passive Acoustics to Fisheries
Illustrations and Diagrams
Figure 2. Spectrogram of a series of automatically-detected toadfish (Opsanus beta) calls plotted one after another.The dominant frequency of these calls is approximately 250 Hz.
Figure 1. Signal processing scheme for the detection of damselfish (Dascyllus albisella) calls.

A remote-controlled instrument platform for fish behaviour studies and
sound monitoring
Ingvald Svellingen, Bjørn Totland and Jan Tore Øvredal
Institute of Marine Research Fish Capture Division
P.O. Box 1870 5817 Bergen Norway
Email: [email protected],
bjø[email protected], [email protected]
This paper was originally presented as a poster at a symposium titled “Fish Bioacoustics”. The sympo-
sium was held in Chicago, USA May 30-June 2, 2001. The paper will also be published in the journal
“Bioacoustics”.
Introduction
A new remote-controlled instrument platform for in situ recording of behaviour-specific fish sound
and synchronous video observations has been developed. Such studies have normally been carried
out using a cable connection between the hydrophone and the observing vessel, which must be
positioned relatively close to the hydrophone itself and generate noise. Vessel generated noise will
not only affect the recorded sound pattern, but may also have an impact on the behaviour of the
fish studied.
The new remote-controlled platform allows operation at distances up to 10 nautical miles and has
therefore been developed to omit such problems during behaviour studies of wild fish in their natu-
ral environments.
Description of the system
The instrument platform consists of two main units (fig 1); a surface buoy and an underwater elec-
tronic bottle capable of operating at depths down to 500m. The surface buoy contains a high-
speed, full duplex, 115 kbps, data telemetry radio and a video link transmitter. It is connected to an
underwater bottle via a 12 lead Kevlar cable. The underwater bottle is made of an anodized alu-
minum cylinder mounted on a stainless steel frame and houses a full feature single-board computer
in order to control various instruments, and to log data from different sensors. Two rechargeable
batteries provide power, 24 VDC, to the electronics. All electronic parts have been chosen to mini-
mize power consumption, making it possible to run the system continuously for approximately 20
hours before recharging.
— 135 —
Proceedings from the International Workshop on the Applications of Passive Acoustics to Fisheries
For sound recording a hydrophone is used and connected to the amplifier in the electronic bottle
via a sub-sea connector on the end lid. All amplifier settings are fully remote controlled from the
observing vessel via the radio telemetry link, and its output is connected to the PC sound card. The
digitized signal is temporarily stored on a flash memory in order to avoid mechanical noise from a
hard disk drive which might disturb the received signal. The recording program allows automatic
frequency, level- and pre trigging facilities, which makes it suitable for a selective sound recording.
A low light video camera placed on the top of the bottle is used for simultaneous video observa-
tions. Both sound- and video signals are transmitted to the observing vessel and monitored in real
time.
A number of sub-sea connectors on the electronic bottle allow connection of different sensors and
equipment like pan/tilt unit, artificial light, echo sounder etc., making the system suitable for a vari-
ety of tasks. Modification of the underwater unit can easily be done to support different instrumen-
tation needed for a wide range of studies.
The video transmitter and the data link enable the instrument platform to be operated from an
observing vessel at a distance of up to 1 nautical miles for video transfer, and up to 10 nautical miles
with data link only.
The remote controlled instrument platform has so far been successfully used to record fish sounds
with synchronous video observations from cod, haddock, saithe, and tusk. The advantages of a
remote-controlled instrument platform over a system with long cables have been clearly demon-
strated in these studies.
— 136 —
Proceedings from the International Workshop on the Applications of Passive Acoustics to Fisheries

— 137 —
Proceedings from the International Workshop on the Applications of Passive Acoustics to Fisheries
Illustrations and Diagrams
Fig. 1. Fish behavior and sound production can be monitored from a distance with the remote-controlled instrumentplatform, using radio link.
Potential for the use of Remotely Operated Vehicles (ROVs) as a platform for
passive acoustics.
Rodney Rountree1, Francis Juanes2, and Joseph E. Blue3
1Program Manager, Mount Hope Bay Natural Laboratory, School for Marine Science and Technology,
UMASS Dartmouth, 706 Rodney French Blvd., New Bedford, MA 02744-1221 [email protected]
2Department of Natural Resources, University of Massachusetts, Amherst, MA 01003
3President, Leviathan Legacy, Inc., 3313 Northglen Drive, Orlando, FL 32806 [email protected]
Introduction
We are still largely ignorant of the distribution and behavior of the great majority of marine fish.
Possibly one of the greatest challenges to researchers attempting to study the behavioral ecology
of fishes is that of finding the fish in the first place. Since some fish are soniferous, acoustic detection
and tracking may offer methods of population assessment for management decisions. Passive
acoustic techniques can be a valuable tool for the identification of essential fish habitats (EFH) for
soniferous species. These techniques can allow for non-destructive surveys of large areas to pin-
point habitats frequented by soniferous species, particularly during spawning events when vocal
activity tends to be greatest. Studies of fish sounds can provide a wealth of data on temporal and
spatial distribution patterns, habitat use, and spawning, feeding, and predator avoidance behaviors.
Currently most investigators use simple omnidirectional hydrophones and can usually only locate
the general area of a spawning aggregation, but have often been forced to use circumstantial evi-
dence of the identity and behavior of the calling species (e.g. Saucer and Baltz 1993, Luczkovich et
al. 1999a,b). Attempts to use passive acoustics as a tool to identify EFH based on spatial patterns in
sound production is also critically hampered by the lack of sufficient data describing the sound
characteristics of individual species and behaviors under field conditions. We propose that acoustic
technologies utilizing hydrophone arrays to home in on sound sources can greatly improve the
study of soniferous fishes and their habitat requirements. First, homing in on sound sources will
provide a valuable new tool to validate the identity of sound producers, especially when coupled
with underwater photography or video devices. Second, the ability to home in on vocal fishes
would enhance our ability to correlate fish sound production with specific locations and habitats. In
this paper, we describe our preliminary attempts to develop a Soniferous Fish Locator (SFL) for use
with a remotely operated vehicle (ROV) to home in on fish sound sources and make recommenda-
tions for future efforts.
— 138 —
Proceedings from the International Workshop on the Applications of Passive Acoustics to Fisheries
Tracking and Homing Basics
The use of passive acoustics for homing was developed for naval warfare during and before WW II. A
passive acoustics homing system was implemented on torpedoes for destruction of ships and sub-
marines. The technique of homing was extended to detection and tracking of submarines by
sonobuoys during World II. These systems were developed before the advent of small, fast comput-
ers and were implemented with electronics that are now known as operational amplifiers. Adequate
Signal-to-Noise ratios were required for implementing these techniques. Homing on ships and sub-
marines by torpedoes requires only 2 directional hydrophones because the torpedo body blocks
out sound from behind it. The available aperture is small so frequencies such that there are several
wavelengths across the directional hydrophones are used for the lowest frequency in the tracking
bandwidth. The torpedo determines the bearing from acoustic signature (signal) of the ship or sub-
marine by cross-correlating the signatures from the 2 hydrophones. The cross-correlation function
is:
t+T/2
C12 (τ) = 1/T [ s1(t)s2(t+τ)] dτ as T ∞ (1)
t-T/2
where s1(t) and s2(t) are the noise-free time signals from the 2 hydrophones, τ is the time delay
between the arrivals of the signals at their respective hydrophones and T is the period over which
the cross-correlation is estimated. The longer T is, the better the cross-correlation estimate E[C12(τ)].
For this function, there are 2 bearings or values of ( that can arise for the maximum value of
E[C12(τ)]. One represents the back direction that we know is wrong because the body of the torpe-
do blocks out that back direction. The other bearing then has to be the correct one. Hydrophone
separation, x, in homing torpedoes is small but a relatively broad segment of the noise spectra is
available to provide sufficient bearing accuracy for tracking.
The cross-correlation function of Equation (1) cannot be realized in practice but only estimated.
Accuracy of the estimate depends primarily on 1) signal-to-noise ratio (SNR), 2) bandwidth of the
signal and 3) separation of the hydrophones. Obviously for wider separations, bearing accuracy is
better. The choice of hydrophone separation is a compromise imposed by the operational require-
ments arising when one wishes to place hydrophones on an ROV. Loss of coherence depends on
environmental conditions and their effect on propagation of sound. Loss of coherence is more
severe at the higher frequencies, but it is not an important factor for arrays that will fit on an ROV.
For large signal bandwidths, the peak of the cross-correlation function is narrow. When estimating
the cross-correlation function, the time gate T imposes a (sin πf )/πf type function upon the estimate
that, along with SNR, determines how accurately one can track a fish. When the bandwidth is large
and SNR high, one can choose a small time window and/or a small hydrophone separation and get
good homing results.
— 139 —
Proceedings from the International Workshop on the Applications of Passive Acoustics to Fisheries

Methods
The SFL was designed to work based on the well-understood principle of null steering on an
acoustic source with two cardiod hydrophones (Fig. 1). Specifically, the SFL consists of three
hydrophones configured to form two orthogonal cardiods shown by the solid and dotted lines (Fig.
1). The two cardiods are 180 degrees out of phase with each other in this configuration. Electronic
summing of the two cardiods results in a null along the x-axis (Fig. 1). A bearing to a sound source is
obtained by rotating the SFL until the sound direction is coincident with the null. To enable an
operator to determine bearing, output from the SFL will be sent to both earphones and a recording
device. The null is found by listening to the summed output of the two cardiods in one ear while
simultaneously listening to the sound intensity with the other ear. Feeding output from cardiod 1
prior to summation with cardiod 2 to the second earphone channel eliminates noise from behind
the SFL (sound from behind the SFL is nulled out by the cardiod, Fig. 1). Hence, the operator listens
only to the intensity of sounds coming from in front of the SFL. This is an important property of the
SFL that reduces interference due to ROV noise and/or boat noise when operating in shallow water.
The distances, d, separating the hydrophones can be changed to increase or decrease the sensitivity
of the dipole and allow the operator to tune the maximum sensitivity toward the predominant fre-
quency band of the type of soniferous fish species for which he/she is searching.
Initial tests of the feasibility of deploying an array of hydrophones on a Phantom III model ROV as
part of the SFL were conducted in test tanks located at the Northeast-Great Lakes Center for the
National Under Sea Research Program at Avery Pt. Connecticut in October 2001. Test were conduct-
ed on the array configuration, attachment methods and ROV noise production. The ROV was not
able to support a hydrophone array in the required configuration (Fig. 1) because of ballast prob-
lems. We therefore had to modify the configuration so that the hydrophone array could be support-
ed by the ROV frame (Fig. 2). Unfortunately, this configuration does not allow for the cancellation of
ROV noise (the array must be forward of the noise source as in Fig. 1). With this configuration, noise
levels under various operating conditions were tested: 1) with all thrusters off and the ROV sitting
on the bottom, 2) with top thrusters on, 3) with rear thrusters on, and 4) with all thrusters on.
Field testing was conducted within the Stellwagen Bank National Marine Sanctuary on board the
R/V Connecticut from October 17-24, 2001. Ten ROV dives were conducted in sand, gravel and boul-
der habitats within the sanctuary. Operations were conducted in depths of up to 70 m under some-
times harsh environmental conditions and strong tidal currents. To reduce ship noise, ROV dives
were conducted while the ship was at anchor and running off of its generators. The array was com-
posed of three TH608-40 model hydrophones made by Engineering Acoustics, Inc (933 Lewis Drive,
Suite C, Winter Park, FL 32789). The hydrophones had a nominal sensitivity at the preamplifier out-
put of -160.5 dB. The 3-channel audio data from the array was captured to a laptop PC with a 4-
channel I/O board and NIDisk software supplied by Engineering Design (43 Newton St., Belmont, MA
02478). Sound signal processing was conducted using Signal 4.0 (Engineering Design). A 1 k Hz
sine wave was played through a portable CD player into the system and the input voltage recorded
at the beginning of each ROV dive. This allowed calibration of the system gain, in addition to the
hydrophone. A single channel of audio data was simultaneously recorded to video (both Hi-8 and
— 140 —
Proceedings from the International Workshop on the Applications of Passive Acoustics to Fisheries
VHS) for backup. The calibration signal was also recorded to the videotape so that calibrated audio
data can be obtained directly from the tapes to obtain signal source levels.
Results
Tank tests revealed a very high level of noise, even with the thrusters turned off and the ROV sitting
motionless on the bottom of the tank (Fig. 3). Although noise levels were highly variable, we esti-
mated levels of >130 dBV with thruster off and >160 dBV with all thrusters on. The high level of
noise precluded the operation of the SFL with a “flying” ROV, with the current array configuration.
We therefore decided to modify the operation of the ROV while in the field in order to increase the
signal to noise ratio enough to obtain bearing information. We required the ROV to remain station-
ary with its thrusters turned off long enough to acquire the bearing to the sound source.
With all thrusters on, the ROV produced high levels of sound at both high and low frequencies (Fig.
4). Dominant frequencies were centered on 7-8 kHz. While the stationary ROV was significantly qui-
eter, it still generated substantial noise centered on 8 kHz (Fig. 5). The low frequency noise in Fig. 5 is
an artifact resulting from mechanical banging, rubbing and tapping on the tank sides by techni-
cians testing sound reception.
Recording fish sounds in the field with an array attached to the ROV proved to be very difficult in
practice. Strong currents limited our ability to remain stationary on the bottom. The ROV was rarely
able to maintain its position on the bottom for more than a few minutes before the operator was
forced to turn on its thrusters to stabilize the vehicle. This also required the operator to turn on the
ROV lights, thus further disturbing the fishes. Fish sounds were recorded on only one occasion
when we were able to maintain the ROV on the bottom with its thrusters and lights off (Fig. 6). A
prolonged series of low thumps and growls from a single fish were recorded over a 20 minute peri-
od when the ROV was sitting stationary with its lights off. During this time a large cusk, Brosme
brosme, was frequently observed hanging around the ROV. It is highly likely that the cusk is the
source of the recorded sounds. We estimated the ambient noise (ROV + ship + seas) level at around
134 dBV and the cusk call at around 140 dBV. At other times when the lights and thrusters were on,
cusk were only observed in a highly agitated state, and appeared to strongly avoid the ROV.
Discussion
Based on preliminary analysis of these data we feel that the concept of a Soniferous Locator Device
is viable. However, current ROV designs preclude optimal configuration of the hydrophone array,
requiring the SFL to be operated in a stationary mode. We propose that a vehicle specifically
designed for low noise production and capable of carrying an SFL with a 2-3 m base line in its nose
would provide an exciting new passive acoustic tool for soniferous fish surveys. The low calling rate
of the fish recorded in this study demonstrates that it would be difficult to track fish using the man-
ual null steering method proposed. Faster digital tracking using this same principal would correct
— 141 —
Proceedings from the International Workshop on the Applications of Passive Acoustics to Fisheries
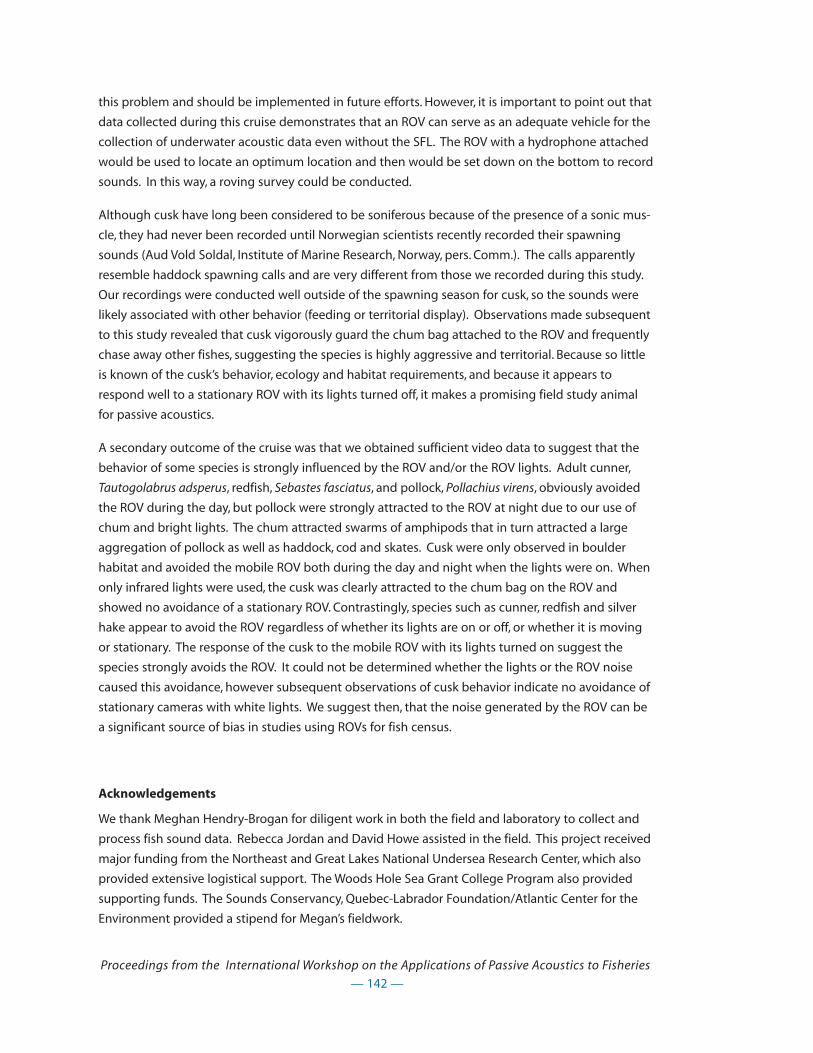
this problem and should be implemented in future efforts. However, it is important to point out that
data collected during this cruise demonstrates that an ROV can serve as an adequate vehicle for the
collection of underwater acoustic data even without the SFL. The ROV with a hydrophone attached
would be used to locate an optimum location and then would be set down on the bottom to record
sounds. In this way, a roving survey could be conducted.
Although cusk have long been considered to be soniferous because of the presence of a sonic mus-
cle, they had never been recorded until Norwegian scientists recently recorded their spawning
sounds (Aud Vold Soldal, Institute of Marine Research, Norway, pers. Comm.). The calls apparently
resemble haddock spawning calls and are very different from those we recorded during this study.
Our recordings were conducted well outside of the spawning season for cusk, so the sounds were
likely associated with other behavior (feeding or territorial display). Observations made subsequent
to this study revealed that cusk vigorously guard the chum bag attached to the ROV and frequently
chase away other fishes, suggesting the species is highly aggressive and territorial. Because so little
is known of the cusk’s behavior, ecology and habitat requirements, and because it appears to
respond well to a stationary ROV with its lights turned off, it makes a promising field study animal
for passive acoustics.
A secondary outcome of the cruise was that we obtained sufficient video data to suggest that the
behavior of some species is strongly influenced by the ROV and/or the ROV lights. Adult cunner,
Tautogolabrus adsperus, redfish, Sebastes fasciatus, and pollock, Pollachius virens, obviously avoided
the ROV during the day, but pollock were strongly attracted to the ROV at night due to our use of
chum and bright lights. The chum attracted swarms of amphipods that in turn attracted a large
aggregation of pollock as well as haddock, cod and skates. Cusk were only observed in boulder
habitat and avoided the mobile ROV both during the day and night when the lights were on. When
only infrared lights were used, the cusk was clearly attracted to the chum bag on the ROV and
showed no avoidance of a stationary ROV. Contrastingly, species such as cunner, redfish and silver
hake appear to avoid the ROV regardless of whether its lights are on or off, or whether it is moving
or stationary. The response of the cusk to the mobile ROV with its lights turned on suggest the
species strongly avoids the ROV. It could not be determined whether the lights or the ROV noise
caused this avoidance, however subsequent observations of cusk behavior indicate no avoidance of
stationary cameras with white lights. We suggest then, that the noise generated by the ROV can be
a significant source of bias in studies using ROVs for fish census.
Acknowledgements
We thank Meghan Hendry-Brogan for diligent work in both the field and laboratory to collect and
process fish sound data. Rebecca Jordan and David Howe assisted in the field. This project received
major funding from the Northeast and Great Lakes National Undersea Research Center, which also
provided extensive logistical support. The Woods Hole Sea Grant College Program also provided
supporting funds. The Sounds Conservancy, Quebec-Labrador Foundation/Atlantic Center for the
Environment provided a stipend for Megan’s fieldwork.
— 142 —
Proceedings from the International Workshop on the Applications of Passive Acoustics to Fisheries

Literature Cited
Luczkovich, J.J., H.J. Daniel, III., M.W. Sprague, S.E. Johnson, R.C. Pullinger, T. Jenkins, and M.
Hutchinson. 1999. Characterization of critical spawning habitats of weakfish, spotted seatrout and
red drum in Pamlico Sound using hydrophone surveys. Final Report and Annual Performance
Report Grant F-62-1 and F-62-2, Funded by the U.S. Department of the Interior, Fish and Wildlife
Service in Cooperation with the North Carolina Department of Environment and Natural Resources,
Division of Marine Fisheries, Morehead City, NC 28557. 128 p.
Luczkovich, J.J., M.W. Sprague, S.E. Johnson, and R. C. Pullinger. 1999. Delimiting spawning areas of
weakfish Cynoscion regalis (Family Sciaenidae) in Pamlico Sound, North Carolina using passive
hydroacoustic surveys. Bioacoustics 10:143-160.
Saucier, M.H., and D.M. Baltz. 1993. Spawning site selection by spotted seatrout, Cynoscion nebulosus,
and black drum, Pogonias cromis, in Louisiana. Env. Biol. Fish. 36:257-272.
— 143 —
Proceedings from the International Workshop on the Applications of Passive Acoustics to Fisheries
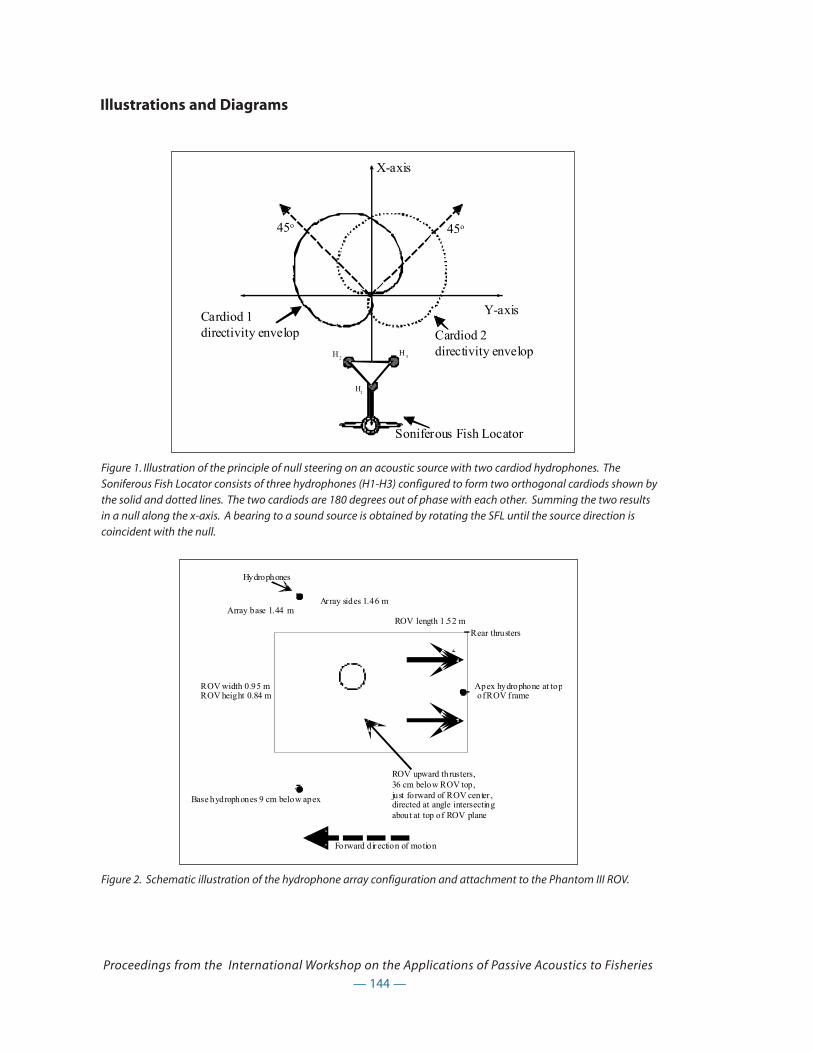
— 144 —
Proceedings from the International Workshop on the Applications of Passive Acoustics to Fisheries
Illustrations and Diagrams
Y-axis
X-axis
45o
Cardiod 1directivity envelop Cardiod 2
directivity envelop
Soniferous Fish Locator
H1
H2
H3
45o
ROV length 1.52 m
ROV width 0.95 mROV height 0.84 m
ROV upward thrusters,36 cm below ROV top,just forward of ROV center ,directed at angle intersectingabout at top of ROV plane
Hydrophones
Apex hydrophone at top of ROV f rame
Base hydrophones 9 cm below apex
Rear thrusters
Array base 1.44 mArray sides 1.46 m
Forward direction of motion
Figure 1. Illustration of the principle of null steering on an acoustic source with two cardiod hydrophones. TheSoniferous Fish Locator consists of three hydrophones (H1-H3) configured to form two orthogonal cardiods shown bythe solid and dotted lines. The two cardiods are 180 degrees out of phase with each other. Summing the two resultsin a null along the x-axis. A bearing to a sound source is obtained by rotating the SFL until the source direction iscoincident with the null.
Figure 2. Schematic illustration of the hydrophone array configuration and attachment to the Phantom III ROV.
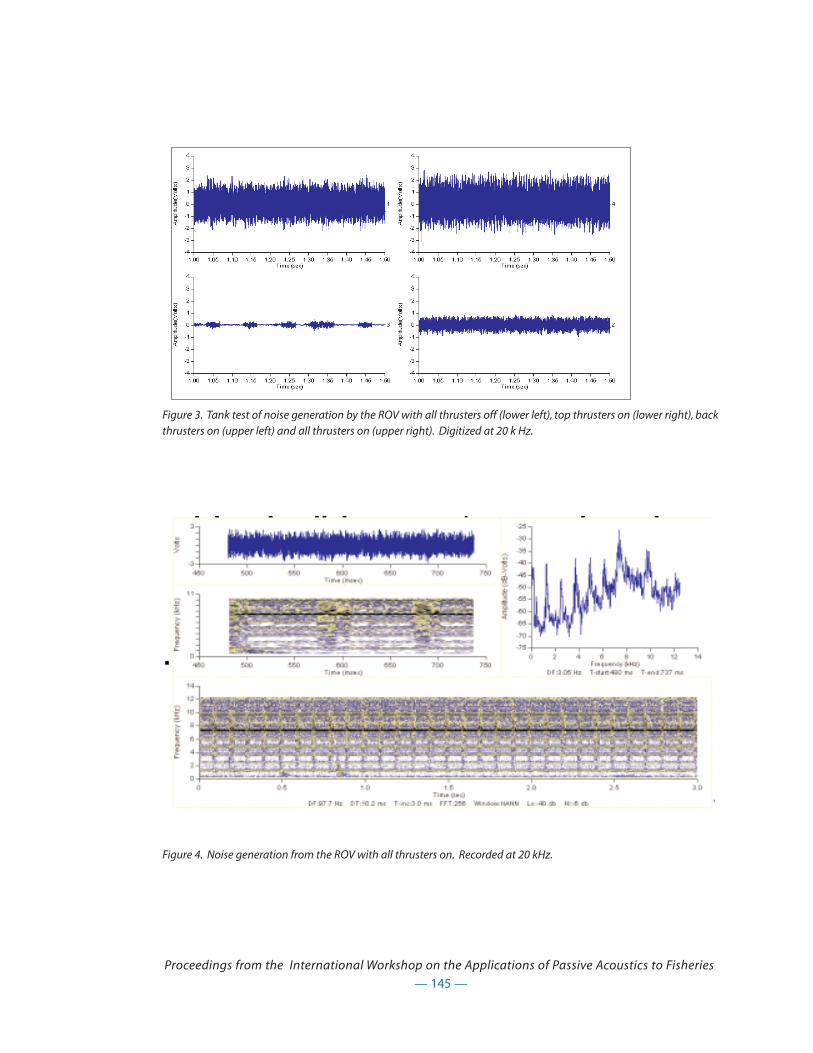
— 145 —
Proceedings from the International Workshop on the Applications of Passive Acoustics to Fisheries
Figure 3. Tank test of noise generation by the ROV with all thrusters off (lower left), top thrusters on (lower right), backthrusters on (upper left) and all thrusters on (upper right). Digitized at 20 k Hz.
Figure 4. Noise generation from the ROV with all thrusters on. Recorded at 20 kHz.
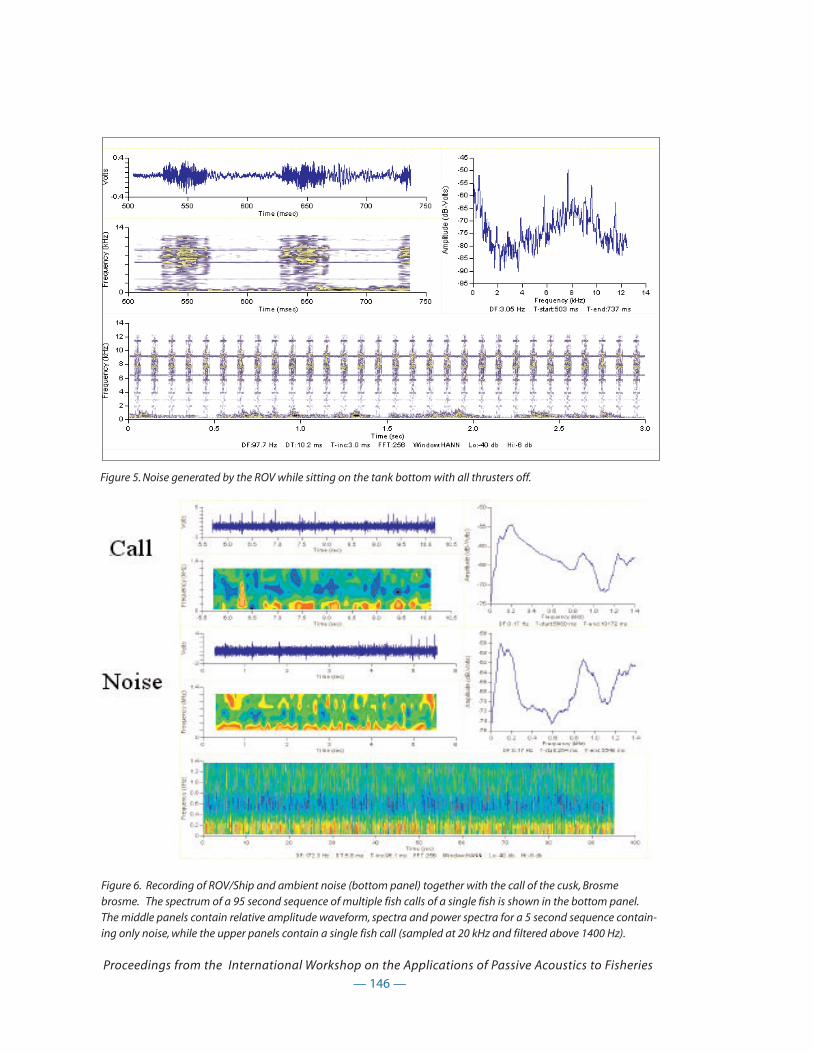
— 146 —
Proceedings from the International Workshop on the Applications of Passive Acoustics to Fisheries
Figure 5. Noise generated by the ROV while sitting on the tank bottom with all thrusters off.
Figure 6. Recording of ROV/Ship and ambient noise (bottom panel) together with the call of the cusk, Brosmebrosme. The spectrum of a 95 second sequence of multiple fish calls of a single fish is shown in the bottom panel.The middle panels contain relative amplitude waveform, spectra and power spectra for a 5 second sequence contain-ing only noise, while the upper panels contain a single fish call (sampled at 20 kHz and filtered above 1400 Hz).

Quantifying Species-Specific Contributions to the Overall Sound Level
Mark W. Sprague1
and Joseph J. Luczkovich2
1Dept. of Physics, East Carolina University, Greenville, NC 27858, USA
2Inst. for Coastal and Marine Resources and Dept. of Biology, East Carolina University,
Greenville, NC 27858, USA
Introduction
Many fishes are soniferous (sound-producing) and produce species-specific sounds (Fish and
Mowbray 1970, Sprague et al. 2000). The sound production of an individual fish or group of fishes
can be used to determine their presence in an area and as an indication of courtship and spawning
behavior. Often, we would like to quantify the sound production of a particular individual or
species, but how do we separate that sound from other sounds that are simultaneously produced
by biological sources, wave noise, and anthropogenic sources such as boats and ships? A short
answer to this question is to use a portion of the sound in which the desired source dominates over
all others. This portion could be a time segment in which the desired source is much louder than
the background (i.e., all other sounds), a portion of the frequency spectrum in which the desired
source is much louder than the background, or a combination of these techniques.
Separating and Combining Sounds
Parseval’s Theorem tells us that the squared-pressure of each frequency component contributes
additively to the time-averaged overall squared-pressure P2
P2
av = ΣP2(fn) (1)
In other words, each frequency component in a power spectrum or sonogram makes an additive
contribution to the total sound power because sound power is proportional to the squared-pres-
sure. Also, when sounds are mutually incoherent (i.e., originating from sources not correlated in
time), their time-averaged squared-pressures, (P12)av and (P2
2)av add to give the squared-pressure of
the combined sound,
— 147 —
Proceedings from the International Workshop on the Applications of Passive Acoustics to Fisheries

P2
av = (P12)av + (P2
2)av (2)
Equation (2) applies to most fish and background sounds because most naturally-occurring sounds
are incoherent.
The total sound pressure level (SPL) is also calculated from P2av using the relationship
, (3)
where P0 is the reference pressure (1 µPa for underwater acoustics). To combine two mutually inco-
herent sounds with SPLs SPL1 and SPL2, we must convert each SPL to a squared-pressure using the
inverse of Equation (3) before adding them. The combined SPL is
. (4)
Equation (4) can be used to combine or separate the SPLs of various sources, including fish sounds
and the background.
Background Correction Function Cbg
Pierce (1989) developed a background correction function Cbg, based on Equation (4), to determine
the sound pressure level of a source SPL1 when background noise is present:
. (5)
In Equation (5), is the difference between the source and background SPLs and SPLtot is the total
sound pressure level. The Cbg technique is inaccurate when ∆SPL<3dB because small inaccuracies
in the measurement of lead to large inaccuracies in SPL1. Figure 1 shows a plot of Cbg vs.∆SPL.
When a sound is 10 dB or more above the background, the total SPL is the same as the SPL of the
sound (i.e.,∆SPL is zero).
In order to determine the source SPL using , the total SPL and the background SPL must be meas-
ured.
— 148 —
Proceedings from the International Workshop on the Applications of Passive Acoustics to Fisheries
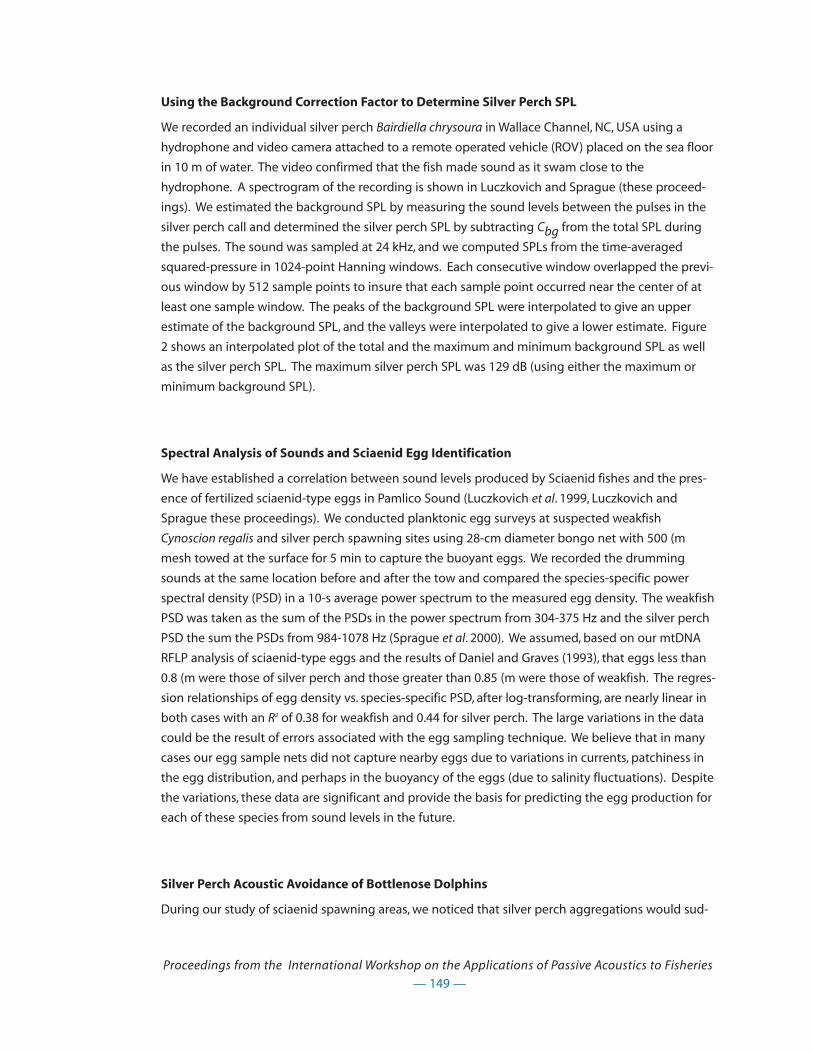
Using the Background Correction Factor to Determine Silver Perch SPL
We recorded an individual silver perch Bairdiella chrysoura in Wallace Channel, NC, USA using a
hydrophone and video camera attached to a remote operated vehicle (ROV) placed on the sea floor
in 10 m of water. The video confirmed that the fish made sound as it swam close to the
hydrophone. A spectrogram of the recording is shown in Luczkovich and Sprague (these proceed-
ings). We estimated the background SPL by measuring the sound levels between the pulses in the
silver perch call and determined the silver perch SPL by subtracting Cbg from the total SPL during
the pulses. The sound was sampled at 24 kHz, and we computed SPLs from the time-averaged
squared-pressure in 1024-point Hanning windows. Each consecutive window overlapped the previ-
ous window by 512 sample points to insure that each sample point occurred near the center of at
least one sample window. The peaks of the background SPL were interpolated to give an upper
estimate of the background SPL, and the valleys were interpolated to give a lower estimate. Figure
2 shows an interpolated plot of the total and the maximum and minimum background SPL as well
as the silver perch SPL. The maximum silver perch SPL was 129 dB (using either the maximum or
minimum background SPL).
Spectral Analysis of Sounds and Sciaenid Egg Identification
We have established a correlation between sound levels produced by Sciaenid fishes and the pres-
ence of fertilized sciaenid-type eggs in Pamlico Sound (Luczkovich et al. 1999, Luczkovich and
Sprague these proceedings). We conducted planktonic egg surveys at suspected weakfish
Cynoscion regalis and silver perch spawning sites using 28-cm diameter bongo net with 500 (m
mesh towed at the surface for 5 min to capture the buoyant eggs. We recorded the drumming
sounds at the same location before and after the tow and compared the species-specific power
spectral density (PSD) in a 10-s average power spectrum to the measured egg density. The weakfish
PSD was taken as the sum of the PSDs in the power spectrum from 304-375 Hz and the silver perch
PSD the sum the PSDs from 984-1078 Hz (Sprague et al. 2000). We assumed, based on our mtDNA
RFLP analysis of sciaenid-type eggs and the results of Daniel and Graves (1993), that eggs less than
0.8 (m were those of silver perch and those greater than 0.85 (m were those of weakfish. The regres-
sion relationships of egg density vs. species-specific PSD, after log-transforming, are nearly linear in
both cases with an R2 of 0.38 for weakfish and 0.44 for silver perch. The large variations in the data
could be the result of errors associated with the egg sampling technique. We believe that in many
cases our egg sample nets did not capture nearby eggs due to variations in currents, patchiness in
the egg distribution, and perhaps in the buoyancy of the eggs (due to salinity fluctuations). Despite
the variations, these data are significant and provide the basis for predicting the egg production for
each of these species from sound levels in the future.
Silver Perch Acoustic Avoidance of Bottlenose Dolphins
During our study of sciaenid spawning areas, we noticed that silver perch aggregations would sud-
— 149 —
Proceedings from the International Workshop on the Applications of Passive Acoustics to Fisheries

denly become quiet when we heard bottlenose dolphin Tursiops truncatus signature whistles. To
verify our observations, we played a recording of bottlenose dolphin signature whistles (with fre-
quency content 4-8 kHz) at similar source levels to those produced by bottlenose dolphins near a
silver perch aggregation and found that the signature whistles significantly quieted the silver perch
vocalizations (Luczkovich et al. 2000). We also played a 700-Hz tone at the same source level with
no significant effect on the silver perch.
We determined the silver perch PSD by summing the PSDs in the power spectrum for frequency
components from 950-1200Hz, the frequency range where silver perch are dominant, for consecu-
tive 10-s average power spectra (see Figure 3). To determine the silver perch reaction to the play-
back, we took the difference between the measured the silver perch PSD immediately before play-
back and during the interval between 20-30 s after playback. Using an analysis of covariance
(ANCOVA), we compared the decrease in silver perch PSD after playback of bottlenose dolphin whis-
tles to changes in silver perch PSD after the 700-Hz tones and also to spontaneous PSD changes
before and 20-30 s after an ad-hoc selected time in a 120-s recording of silver perch with no sound
playback. The bottlenose dolphin whistle produced a significant 9-dB decrease in silver perch SPL
[ANCOVA, (among playback treatment adjusted means), (among slopes of the regression lines for
each treatment), , ]. The silver perch responded to bottlenose dolphin signature whistles by reduc-
ing their sound production.
Conclusions
Several techniques have been demonstrated for determining the sound level of an individual or
species in the presence of other sound sources. Each technique isolates a portion of the sound in
which the desired source dominates over the others. The sound portion could be a time interval in
which the desired source is much louder than the others or it could be a portion of the frequency
spectrum in which the desired source dominates. In some situations, techniques that combine time
intervals and characteristic frequency bands must be used to separate the contributions of the
desired source.
References
Daniel, L. B. and Graves. J. E. (1994) Morphometric and genetic identification of eggs of spring-
spawning sciaenids in lower Chesapeake Bay. Fish. Bull. 92, 254-261.
Fish, M. P. and W. H. Mowbray. (1970) Sounds of Western North Atlantic Fishes. Johns Hopkins Press,
Baltimore, 209 pp.
Luczkovich, J. J., M. W. Sprague, S. E. Johnson, and R. C. Pullinger. (1999) Delimiting spawning areas of
weakfish, Cynoscion regalis (Family Sciaenidae) in Pamlico Sound, North Carolina using passive
hydroacoustic surveys. Bioacoustics 10, 143-160.
— 150 —
Proceedings from the International Workshop on the Applications of Passive Acoustics to Fisheries

Luczkovich, J. J., H. J. Daniel III, M. Hutchinson, T. Jenkins, S. E. Johnson, R. C. Pullinger, and M. W.
Sprague. (2000) Sounds of sex and death in the sea: bottlenose dolphin whistles silence mating
choruses of silver perch. Bioacoustics 11, 323-334.
Pierce, A. D. (1989) Acoustics an introduction to its physical principals and applications. Acoustical
Society of America, Woodbury, NY, pp. 54-78.
Sprague, M. W., J. J. Luczkovich, R. C. Pullinger, S. E. Johnson, T. Jenkins, and H. J. Daniel III. (2000) Using
spectral analysis to identify drumming sounds of some North Carolina fishes in the family
Sciaenidae. Journal of the Elisha Mitchell Society 116, 124-145.
— 151 —
Proceedings from the International Workshop on the Applications of Passive Acoustics to Fisheries
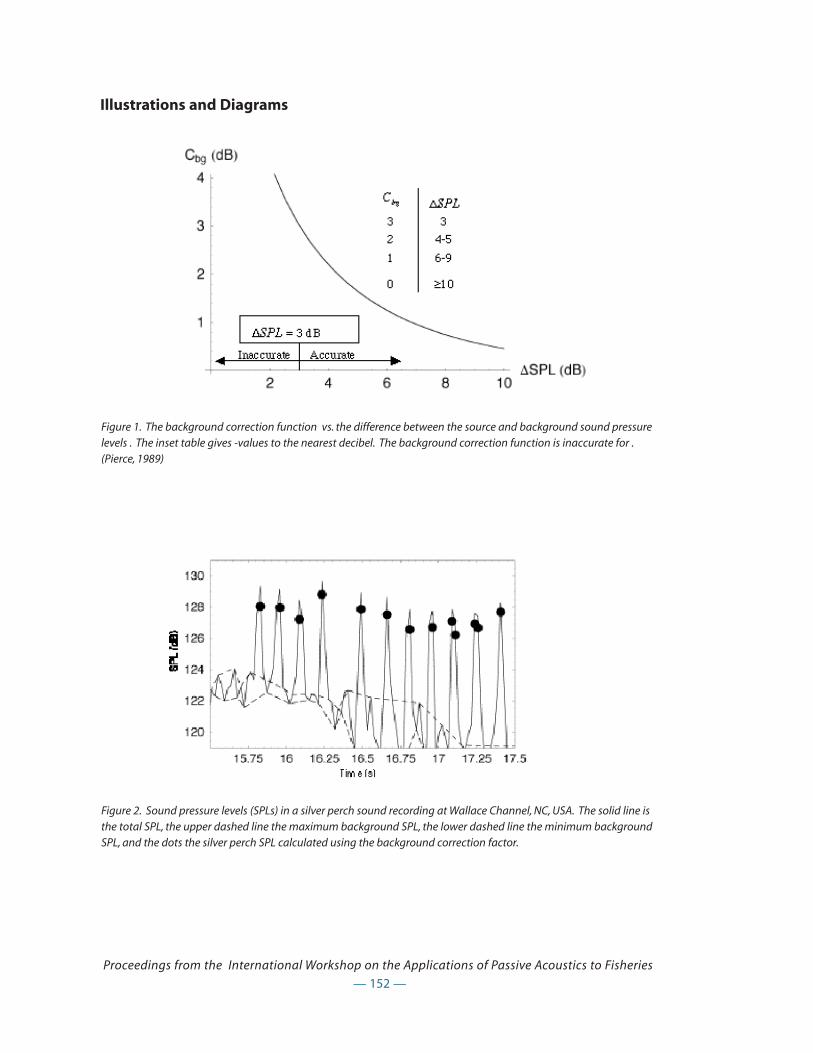
— 152 —
Proceedings from the International Workshop on the Applications of Passive Acoustics to Fisheries
Illustrations and Diagrams
Figure 2. Sound pressure levels (SPLs) in a silver perch sound recording at Wallace Channel, NC, USA. The solid line isthe total SPL, the upper dashed line the maximum background SPL, the lower dashed line the minimum backgroundSPL, and the dots the silver perch SPL calculated using the background correction factor.
Figure 1. The background correction function vs. the difference between the source and background sound pressurelevels . The inset table gives -values to the nearest decibel. The background correction function is inaccurate for .(Pierce, 1989)
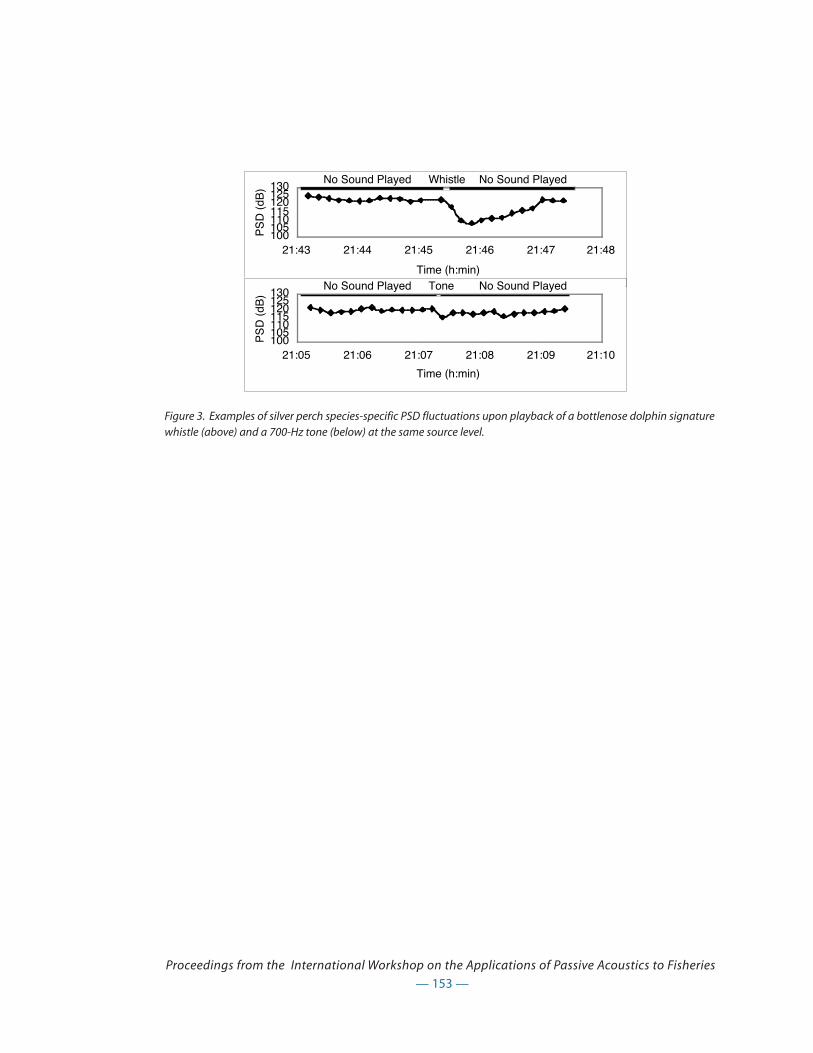
— 153 —
Proceedings from the International Workshop on the Applications of Passive Acoustics to Fisheries
Figure 3. Examples of silver perch species-specific PSD fluctuations upon playback of a bottlenose dolphin signaturewhistle (above) and a 700-Hz tone (below) at the same source level.
100105110115120125130
21:43 21:44 21:45 21:46 21:47 21:48
Time (h:min)P
SD
(dB
)
WhistleNo Sound Played No Sound Played
100105110115120125130
21:05 21:06 21:07 21:08 21:09 21:10
Time (h:min)
PS
D (
dB)
ToneNo Sound Played No Sound Played
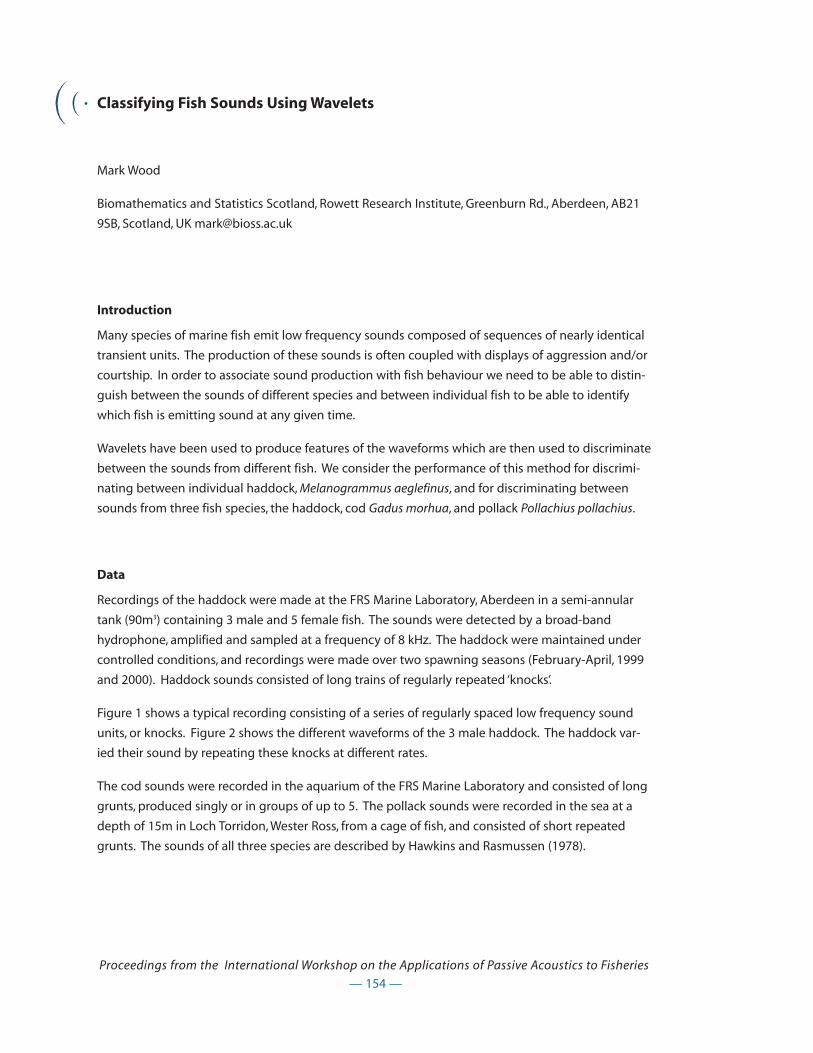
Classifying Fish Sounds Using Wavelets
Mark Wood
Biomathematics and Statistics Scotland, Rowett Research Institute, Greenburn Rd., Aberdeen, AB21
9SB, Scotland, UK [email protected]
Introduction
Many species of marine fish emit low frequency sounds composed of sequences of nearly identical
transient units. The production of these sounds is often coupled with displays of aggression and/or
courtship. In order to associate sound production with fish behaviour we need to be able to distin-
guish between the sounds of different species and between individual fish to be able to identify
which fish is emitting sound at any given time.
Wavelets have been used to produce features of the waveforms which are then used to discriminate
between the sounds from different fish. We consider the performance of this method for discrimi-
nating between individual haddock, Melanogrammus aeglefinus, and for discriminating between
sounds from three fish species, the haddock, cod Gadus morhua, and pollack Pollachius pollachius.
Data
Recordings of the haddock were made at the FRS Marine Laboratory, Aberdeen in a semi-annular
tank (90m3) containing 3 male and 5 female fish. The sounds were detected by a broad-band
hydrophone, amplified and sampled at a frequency of 8 kHz. The haddock were maintained under
controlled conditions, and recordings were made over two spawning seasons (February-April, 1999
and 2000). Haddock sounds consisted of long trains of regularly repeated ‘knocks’.
Figure 1 shows a typical recording consisting of a series of regularly spaced low frequency sound
units, or knocks. Figure 2 shows the different waveforms of the 3 male haddock. The haddock var-
ied their sound by repeating these knocks at different rates.
The cod sounds were recorded in the aquarium of the FRS Marine Laboratory and consisted of long
grunts, produced singly or in groups of up to 5. The pollack sounds were recorded in the sea at a
depth of 15m in Loch Torridon, Wester Ross, from a cage of fish, and consisted of short repeated
grunts. The sounds of all three species are described by Hawkins and Rasmussen (1978).
— 154 —
Proceedings from the International Workshop on the Applications of Passive Acoustics to Fisheries

Wavelets
Wavelets are special mathematical functions, designed to overcome the shortfalls of the well known
Fourier Transform. Wavelets are produced by scaling (compressing or expanding) and shifting a sin-
gle ‘mother’ wavelet along the time axis. These wavelets are usually designed to form an orthonor-
mal basis, in which any sound signal may be represented as a series of the scaled and shifted
wavelets. The ‘amount’ of each wavelet present in the decomposition determines the dominant fre-
quency components and their location in the signal. For this reason we say that the wavelet trans-
form has good time and frequency localization.
Background material on wavelet analysis may be found in Jawerth and Sweldens (1994), Bruce and
Gao (1996) and Abramovich et al. (2000). A more mathematical treatment is given by Chui (1992a,b)
and Daubechies (1992).
Recognition of Individual Haddock
Wavelets were used to extract features from the sound units which would enable individual had-
dock or different species to be automatically recognised. The procedure consisted of 4 steps.
1. The smoothing property of wavelets was used to automatically isolate individual sound units inthe recordings. By setting certain smaller wavelet coefficients to zero and then applying theinverse wavelet transform we were able to extract individual haddock knocks, or cod and pol-lack grunts from the background. These were extracted in 32ms windows (containing 256 datapoints) and were standardised so that their amplitude was of unit variance.
2. Due to the way in which the knocks were extracted in (1), and the fact that the wavelet trans-form is sensitive to shifts along the time scale, the non-decimated (or stationary) wavelet trans-form was used to decompose the knocks. A member of the Coiflet family of wavelets wasfound to give the best results.
3. Plots of the non-decimated wavelet coefficients in descending order of absolute value in eachlevel are very similar for sounds from the same fish, but clearly different for sounds from differ-ent fish. These plots suggest suitable features for discriminating between the knocks of individ-ual male haddock and between different fish species. For haddock, a plot of the scores on thefirst two canonical variates (Krazanowski (1996)) showed three well separated clusters.
4. Certain features from (3) were selected and used in a discriminant analysis to allocate unclassi-fied knocks to one of the three male haddock or to each of the three species, or to a spurioussound. The method of extracting pulses in (1) meant that sounds were picked up which werenot produced by any of the male haddock, cod or pollack. These spurious sounds, caused bysplashes for example, could not be eliminated and so were allocated to a fourth group.
Results and Conclusions
In a test data set of the haddock sounds, 175 knocks were detected as having come from fish A, 336
from B, 194 from C and 142 were spurious sounds. The classification rates are shown in table 1. The
overall success rate was 89%. It was shown that using the fact that knocks occurred in long repeti-
tive series increased the success rate to 95%.
— 155 —
Proceedings from the International Workshop on the Applications of Passive Acoustics to Fisheries
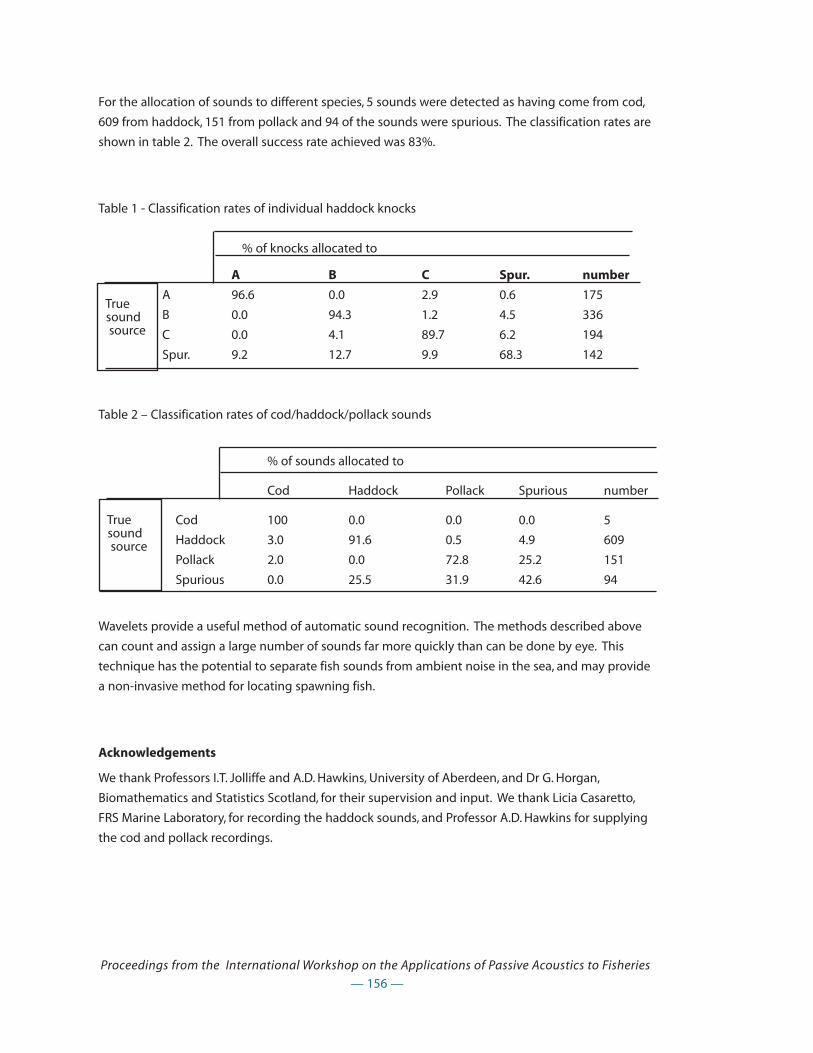
For the allocation of sounds to different species, 5 sounds were detected as having come from cod,
609 from haddock, 151 from pollack and 94 of the sounds were spurious. The classification rates are
shown in table 2. The overall success rate achieved was 83%.
Table 1 - Classification rates of individual haddock knocks
% of knocks allocated to
A B C Spur. number
A 96.6 0.0 2.9 0.6 175
B 0.0 94.3 1.2 4.5 336
C 0.0 4.1 89.7 6.2 194
Spur. 9.2 12.7 9.9 68.3 142
Table 2 – Classification rates of cod/haddock/pollack sounds
% of sounds allocated to
Cod Haddock Pollack Spurious number
Cod 100 0.0 0.0 0.0 5
Haddock 3.0 91.6 0.5 4.9 609
Pollack 2.0 0.0 72.8 25.2 151
Spurious 0.0 25.5 31.9 42.6 94
Wavelets provide a useful method of automatic sound recognition. The methods described above
can count and assign a large number of sounds far more quickly than can be done by eye. This
technique has the potential to separate fish sounds from ambient noise in the sea, and may provide
a non-invasive method for locating spawning fish.
Acknowledgements
We thank Professors I.T. Jolliffe and A.D. Hawkins, University of Aberdeen, and Dr G. Horgan,
Biomathematics and Statistics Scotland, for their supervision and input. We thank Licia Casaretto,
FRS Marine Laboratory, for recording the haddock sounds, and Professor A.D. Hawkins for supplying
the cod and pollack recordings.
— 156 —
Proceedings from the International Workshop on the Applications of Passive Acoustics to Fisheries
Truesoundsource
Truesoundsource

References
Abramovich, F., Bailey, T.C. and Sapatinas, T. (2000) Wavelet analysis and its statistical applications,
Journal of the Royal Statistical Society, Series D, 49(1), 1-29.
Bruce, A. and Gao, Hong-Ye (1996) Applied wavelet analysis with S-PLUS, Springer-Verlag, New York.
Chui, C.K. (1992a) An introduction to wavelets, Academic Press, Boston, MA.
Chui, C.K. (1992b) Wavelets: a tutorial in theory and applications, Academic Press, Boston, MA.
Daubechies, I (1992) Ten lectures on wavelets, Society for Industrial and Applied Mathematics,
Philadelphia.
Jawerth, B. and Sweldens, W. (1994) An overview of wavelet based multiresolution analyses, Society
for Industrial and Applied Mathematics, 36(3), 377-412.
Krazanowski, W.J. (1996) Principles of multivariate analysis: A users perspective, Oxford University
Press, Oxford.
Hawkins, A.D. and Rasmussen, K.J. (1978) The calls of gadoid fish, Journal of the Marine Biology
Association U.K., 58, 881-911.
— 157 —
Proceedings from the International Workshop on the Applications of Passive Acoustics to Fisheries

— 158 —
Proceedings from the International Workshop on the Applications of Passive Acoustics to Fisheries
Illustrations and Diagrams
Figure 1 - Sound recording of a single haddock made in the tank
Figure 2 - The waveform produced by the haddock.
A summary report on the Biology Session and Biology Working Group from
the International Workshop on the Application of Passive Acoustics in
Fisheries.
Joseph J. Luczkovich
Institute for Coastal and Marine Resources, Department of Biology, East Carolina, University,
Greenville, NC 27858
Summary
Fishes are known sound-producers in the sea. Sound production is associated with mating, aggres-
sion, and feeding in fishes. The sounds are species-specific in many cases, but the identification of
fishes based on sound production alone has led to mis-identifications in the past. Sound-truthing,
or the identification of species’ sounds has been accomplished by use of recording of individuals in
aquaria and in situ using underwater video and audio. A library of known fish sounds in being
assembled and will be archived at Cornell Library of Natural Sounds. Data rescue of existing record-
ings that are in danger of being lost due to age and inadequate storage is underway, but needs are
great in this area. Sounds can be detected over fairly long distances (1 km), so after sound-truthing
and archiving of sounds, detection of the fish in an area by means of passive acoustics alone
becomes possible, even if the fish has not been captured and observed.
Introduction
Listen to the fish? When I suggest that they do this, most people respond that they were not aware
that fish produce sounds. Yet, Aristotle reported this phenomenon (Historia Animalium, IV, 9), and
Native Americans may have listened for underwater sounds to locate groups of fish while hunting
them. Passive acoustics has been used for over 50 years in fish biology and fisheries surveys (see
Fish et al. 1952 and Fish and Mowbray 1970 for a summary of early work) and is being used routinely
today to determine habitat use, delineate and monitor spawning areas, and study the behavior of
fishes (various papers presented in these proceedings). Fishes produce sounds to communicate
with one another while they are feeding, mating, or being aggressive and also make noises associat-
ed with feeding and swimming. Over 700 species of fishes have been identified as sound producers
(soniferous fishes) (Kaatz 2002). The purpose of this report is to summarize the findings of the
Biology Working Group that was held on the third day of the workshop. The Biology Working Group
was tasked with reviewing papers presented during the workshop, and information from the litera-
ture, and to summarize our state-of-knowledge on passive acoustics applications to fisheries and
the census of marine life. Specifically, the group sought to identify areas of that have been well
— 159 —
Proceedings from the International Workshop on the Applications of Passive Acoustics to Fisheries

studied, as well as those in need of further research, and to set forth a list of research areas that the
workshop participants deemed of highest priority.
What have we learned in the workshop on the biology of fishery organisms and fish from
studying passive acoustics?
Using hydrophones, marine ecologists and fishery biologists have been able to listen to the sounds
fishes produce and identify species-specific signatures using signal processing and spectral analysis
computer algorithms. Often these sounds are very loud and dominate the acoustic environment
where they occur, as in the drum family Sciaenidae, so much so that they interfere with military and
petroleum prospecting operations that involve acoustic monitoring. In other situations, such as
damselfishes on coral reefs, the sounds are not loud and require specialized techniques to detect
them (Mann and Lobel 1995, Lobel and Mann 1995).
The main problem that has been overcome in the past by biologists using the passive acoustic
approach is to identify the species producing a sound: one first must do “sound-truthing” to discover
which sound has been produced by an individual fish. There are two main ways this has been
accomplished: (1) captive fish recordings and (2) in situ recordings. Most identifications of fish
sounds in the past have been done using captive fishes that produced sounds under conditions
that are far from natural. Fishes held in aquaria often do not exhibit natural behavior and sound
production is adversely affected. Although some fishes produce sounds naturally after capture in
aquarium environments that mimic the environment in situ, most do not. Investigators have resort-
ed to mechanical or some other kind of stimulation (including electrical shock!) to produce a distur-
bance call, which may or may not represent the sounds produced by fishes in nature. As was dis-
cussed at length, aquaria present their own series of technical difficulties, including tank echoes and
background produced by air bubbles, pumps and motors. Yong Han and Joe Blue provided insight
as to how these difficulties might be overcome to some degree by proper design of the aquarium.
Verification in situ of the location of the sound source, sound source levels, and identity of the
species involved is frequently difficult. One example of the difficulty in correct identification was
reported by Sprague and Luczkovich (2001), who corrected a long-standing error in identification of
the “chatter” sound, originally attributed to weakfish by Fish and Mowbray (1970), but now known to
be produced by striped cusk eel (Mann et al. 1997). The problem of matching sounds to species and
behaviors occurs because of the limited ability of biologists to observe fish producing sounds in
situ. Although some observations have been made recently using underwater video in clear tropical
reef waters (Mann and Lobel 1998, Lobel 2001, and Lobel these proceedings) and even in temperate
environments with turbid waters (Luczkovich and Sprague 2002; Rountree et al., these proceedings),
many attempts to record fishes have failed because of mechanical sounds produced by the plat-
form with the videocamera (bubbles from SCUBA divers, motors and propellers of ROVs and subs)
to which fishes are extremely sensitive and which inhibit or mask fish sound production. Lobel
(2001) has developed underwater videography techniques that use calibrated hydrophones and
videocameras operated by divers using a rebreather apparatus, which produces no bubbles.
Underwater autonomous recording devices such as timer-operated sonobuoys have also been used
— 160 —
Proceedings from the International Workshop on the Applications of Passive Acoustics to Fisheries
to detect the sounds produced by fishes and the acoustic avoidance response produced when their
bottlenose dolphin predators also are detected on the recording (Luczkovich et al. 2000). Because
there is no observer near the autonomous recording device, disturbances are minimized and natural
behavior can be recorded. A future goal for identification of species sounds should be to develop
combined acoustic and videotape recorders that are triggered when sounds or water movements of
a specific level and type are detected.
Knowledge of sound source levels is important for calculating the detection limits (in terms of area
sampled) of hydrophones and sonobuoys. Sound in water is measured as a Sound Pressure level
(SPL) in dB re 1 _Pa, which can be measured with calibrated hydrophones and recording devices.
Luczkovich and Sprague (2002) reported that the sound source level for an individual silver perch
Bairdiella chrysoura 1 m from the hydrophone was 129 dB. Lobel and Mann (1995) measured the
sound source levels of the domino damselfish Dascyllus albisella and modeled the propagation of
the sound (Mann and Lobel 1997). More precise measurement of sound source levels in the future
will require that one know both the location of the fish and the hydrophone, so that proper
assumptions can be applied to the calculation of sound transmission loss and the determination of
acoustic sampling areas (Mann and Lobel 1997). Calibrated hydrophones and recording devices that
are easy to use are needed for such studies (see Mann et al., these proceedings, for a discussion of
the recording technology available).
Another problem discussed related to species identification of fish sounds is the nomenclature
used to describe these sounds. Numerous investigators have used terms such as “grunts”,“knocks”,
“snaps”,“pops”,“staccato”,“drumming”,“humming”,“rumbles”,“percolating”,“purring”, etc. to describe the
sounds heard; these names are often onomatopoeic. There was general agreement at the workshop
that such names be used in the future in the published literature to describe a sound, but that there
was a need to standardize our names for fish sounds. This standardization will allow rapid communi-
cation between biologists and other observers while listening to unfamiliar sounds. Some biologists
have given different names to the same sounds; others have given the same name to a similar but
different sounds produced by two species, even though the sounds differ between species when
examined spectrographically (see below). This can lead to confusion, and so as much as possible
unique names can be given an individual sound (“long-spine squirrelfish grunt” versus “silver perch
long aggregated grunt”). Standardization of names should give priority to previously published
names whenever possible. Kaatz (2002) suggested a possible approach using a plot of sound dura-
tion vs. frequency, which allows a clustering of similar sound types, so that we can name them
accordingly. Thus a “hum” has a long duration at a particular low frequency, whereas a “grunt” has a
short duration at a low frequency.
One way to more precisely report a sound produced by a fish in captivity or in situ is to make a
spectrograph or “voice print” of the sound recording. Sound spectral analysis software has been
used to great advantage in fish passive acoustics surveys and archives. Fishery biologists should be
aware of the established methods and pitfalls for doing such spectral analysis of sounds. A primer
— 161 —
Proceedings from the International Workshop on the Applications of Passive Acoustics to Fisheries

on bioacoustics may be needed for the biologist new to the field of passive acoustics; this is avail-
able in Canary for MacIntosh sound-analysis software package available at (www.cornell.edu/lns)
and soon to be released in a PC WINDOWS version called RAVEN. Another primer is also available at
the Acoustical Society of America website (www.asa.org). In the past, species’ sounds have been
characterized in terms of their spectral properties, pulse repetition rates, dominant frequencies, and
power spectra using Fast Fourier Transforms (FFTs), which are available in most sound analysis soft-
ware programs (SpectroGram, CoolEdit, Canary, LabView, Avisoft, Spectraplus, Signal, Igor, etc. - see
Mann et al., these proceedings, for a discussion about sound recording and analysis technology).
Spectral analysis has proved very useful identifying species and in separating the contribution of
individual species to the overall sound levels. The sound and egg production of the sciaenids silver
perch, Bairdiella chrysoura, and weakfish, Cynoscion regalis, are correlated (Luczkovich et al. 1999). It
was known from captive fish recordings that B. chrysoura and C. regalis have different dominant fre-
quencies (Sprague et al. 2000). Using spectral analysis and Parcival’s Theorem, Sprague and
Luczkovich (these proceedings) have shown how the sound contribution of each species of sciaenid
can be separated in a recording that contains more than one species. This frequency-specific SPL
can be correlated with egg production from each species. A different form of spectral analysis
called wavlet analysis has been used to identify species and individual fish within a species (Wood
et al. 2002). If we can recognize individual fish on the basis of their wavelet “voice prints”, then this
would allow soniferous fish individuals to be tagged and recaptured without humans having to
capture them in nets. Such approaches may revolutionize fishery biology for soniferous species. We
can also “clean up” noisy recordings using wavelets. Wavlet analysis shows great promise in future
studies to segregate the sounds of multiple individuals in large aquaria and in situ.
Biologists have been able to link the aggressive and spawning behavior of fishes to their sound pro-
duction using in situ and tank studies. For example, Myrberg (1972) and Myrberg et al. (1986) has
described the behavioral ecology of the bicolor damselfish Stegastes partitus, which uses sounds
both in mating and in defense of its territories. A similar pattern of sound production “popping” has
been recorded by Lobel and Mann (1995) and Mann and Lobel (1998) for the domino damselfish
Dascyllus albisella in the Pacific. The domino damselfish produces a visual “signal jump” display in
conjunction with the sound production during courtship. The sound production and spawning fre-
quency can thus be monitored remotely over time using a hydrophone wired to a land-based
microcomputer, a system that has been termed a “spawn-o-meter” (Mann and Lobel 1995). Mok and
Gilmore (1983) established that spotted seatrout Cynoscion nebulosus (Sciaenidae) sounds are asso-
ciated with spawning by using both tank recordings of mature ripe seatrout and passive acoustic
hydrophone surveys combined with ichthyoplankton surveys. This approach has also been extend-
ed to the weakfish C. regalis by Luczkovich et al. (1999). Some work describing the sounds produced
in association with spawning in haddock Melanogrammus aeglefinus has been described by
Hawkins and Amorim (2000), Hawkins et al. (2002), and Casaretto and Hawkins (2002). These authors
described the complete mating and courtship behavior of the haddock, with a detailed analysis of
the sound production at each step in the mating sequence. This sort of basic behavioral biology is
still lacking for most fishes detected in passive acoustic surveys. Without this type of behavioral
study, we may know that a fish is present in an area, but not what it is doing there. So, improve-
— 162 —
Proceedings from the International Workshop on the Applications of Passive Acoustics to Fisheries
ments in our ability to simultaneously observe fish and listen to them are needed, including better
research aquaria and underwater video techniques.
Passive acoustics approach provides a rapid way of establishing the spawning component of essen-
tial fish habitat (EFH). Delineation of spawning areas has been done (Mok and Gilmore 1983, Saucier
and Baltz, Luczkovich et al. 1999, Roumillat et al., Collins et al., Holt et al., these proceedings). But how
far away are the fish? Need to set standards for the different levels of EFH data. Baltz (these pro-
ceedings) described the different levels of EFH data and suggested that passive acoustics can be
used to establish Level 1 data (presence or absence in an area).
What do we need to do in the future that will help fishery managers and fish biologists to
learn more about fishes and their sound production?
Sound propagation in the marine environment, especially in shallow water, is a very complex prob-
lem. Some of the workshop participants gave some hints of what may be done by researchers in the
area of passive acoustics and fisheries in the future. Susan Jarvis explained how sound propagation
was studied by Navy scientists following sperm whales in the Bahamas swimming through the large
hydrophone array set in place there for submarine sonar studies; although these whales make
sounds with higher source sound pressure levels, similar approaches could be used with fishes
swimming through fixed hydrophone arrays. Scott Holt described the use of towed arrays to locate
spawning areas of red drum along the Texas coast. By monitoring the sound levels of a very loud
and close by individual red drum, the multiple hydrophone elements on the towed array was useful
in localizing the individual sound-producing fish. Some new approaches to making captive and in
situ recordings came out of the workshop. Joe Blue suggested using “butterfly” shaped tanks in cap-
tive fish recordings, because they reduce tank echoes. Tony Hawkins warned against the use of thin-
walled fiberglass tanks surrounded by air, which can increase the echo effect. Hawkins then
described his combination approach of using an enclosure in the field to record haddock sounds,
which provided a more natural acoustic environment without tank noise and echo problems. But,
recorded sounds must be assumed to come from the fish, as one cannot screen out ambient sounds
in the marine environment. Blue suggested putting the fish and the hydrophone in a narrow diam-
eter pipe that is less than the wavelength of the sound that you are interested in recording. It may
be difficult to get the fish to produce sounds in such an unnatural situation, however. Workshop par-
ticipants described new acoustic devices for monitoring fish sounds, including the NURC ROVs fitted
with hydrophones, ECU and Navy Sonobuoys, and the NOAA/NMFS remote underwater device
acoustic recording (RUDAR), and various AUVs. One such AUV was a “glider”, which produces very lit-
tle sound itself because it uses a motor only to get to the surface, then glides to the bottom.
Because aquatic environments cover huge areas and great depths, acoustics holds great promise in
locating fish that cannot be easily seen using ROVs, submarines, SCUBA or underwater video.
Because light is attenuated more rapidly in water than sound, and sound waves in water travels 5
times the speed of sound waves in air, the detection of a fish species in an area where habitat sur-
veys are conducted is far more likely than detection with nets and visual means.
— 163 —
Proceedings from the International Workshop on the Applications of Passive Acoustics to Fisheries
All workshop participants agreed that there was a great need to conduct studies of fishes using pas-
sive acoustics in the future. Some areas of future research needs were suggested at the workshop,
including:
1). Quantification of fish aggregations size by use of passive and active acoustics used together.
2). Linking the passive acoustical work to behavioral work (with more video and audio recordingsmade together where visibility allows).
3). Modelling sound propagation of fish sounds in different environments.
4). Correlation of sounds from specific habitats with overall environmental quality
5). Development of directional arrays and beam-forming technologies to precisely locate thesound sources at dark or in turbid waters.
6). Determination of the sizes of fishes making sounds and if both males and females make sounds(in some species).
7). The need to establish what proportion of the fish are calling at a given time.
8). The need to determine and model how sound pressure levels (SPLs) vary with shoal size anddistance from sound source.
9). Modelling of chorusing behavior. Are individual fishes calling together, i.e., are the chorusessynchronized?
10). The need to secure funding for establishment of long-term remote listening stations at estab-lished sites so that spatial and temporal (diurnal and seasonal) variations in sound are charac-terized.
11). The need to establish a national center in the US for the study of bioacoustics of fishes.
12). The need to do conduct these studies in ways that will allow testing of specific scientifichypotheses in collaborations with physical, chemical, and biological oceanographers.
This partial list of future research directions will be undertaken by individuals at the workshop and
their colleagues from traditional grant funding sources (the National Science Foundation, Sea Grant
Program, NOAA).
Some obstacles must be overcome in the future: cases of mistaken identity have occurred in the
past (e.g. the striped cusk-eel chatter sound was long confused with weakfish, Sprague and
Luczkovich 2001) and unknown sounds exist. Thus, there is an urgent need to have an archive of
known sounds that can be reliably associated with fish species and particular behaviors. Such an
archive has been funded by ONR and is being assembled by bioacousticians from the Library of
Natural Sounds at Cornell University from thousands of hours of underwater recordings of fishes
and the aquatic environments made by scientists (Bloomgarden and Bradbury 2002). There is a
need to establish a set of standards for voucher sounds, which should be separated in the archive in
terms of the species taxonomic affiliations, environmental conditions, and recording environment.
For example, in the archive we should differentiate between:
(1) Captive/tank recordings - these are routinely done for “sound truthing”. When there is only onespecies in the tank, there is no question as to which species produced the sounds. But, whatstandards should be used for aquarium design, reduction of tank echoes and noises?
— 164 —
Proceedings from the International Workshop on the Applications of Passive Acoustics to Fisheries

(2) In situ recordings - these can be done with modern video and audio technology. But how do weavoid the problem with location of the sound source, so as not to confuse fishes making thesounds with the ones that just happen to be in the area (the cusk-eel weakfish problem).
Even when all the fish are of the same species in a tank or in situ, we are often interested in which
individual fish produced a given sound. This allows us to relate the size or behavior of the fish to the
sound and gives an understanding of what the social environment was in which it produced the
sound (mating behavior, foraging, aggression etc.).
One area of great importance in the future is determining the impact of noise pollution in the
marine environment. If fishes rely on sound for communication, are the noises produced by human
activities interfering with the fishes ability to mate, fight, and locate food or predators? We need to
do more research on the impact of fishing gear, boats, pipelines, dredging, petroleum exploration
seismic surveys, and military operations on soniferous fishes. Should these be noises regulated? At
what levels? Can the fish hear these sounds? Do they respond to the sounds? McCauley et al. (2002)
have shown that a fish’s ability to hear is affected by prolonged exposure to the sounds produced
by air guns used in seismic surveys by geologists. American shad are affected by echo-sounders
using high frequency sounds, which they can hear (Mann et al. 1997, Mann et al. 1998) apparently
because bottleneose dolphins, a shad predator, also use these frequencies for echo location. Is
spawning interrupted? Bottlenose dolphin disrupt the spawning of silver perch (Luczkovich et al.
2000), but we know little of how echo sounders and fishing vessel noises affect this species and its
relatives in the Sciaenidae. Are migration routes blocked? For example, American shad migrate
upstream to spawn, but turn away at places where underwater gas pipelines cross the estuary or
river, due to the acoustic environment produced by the rushing fluids and gasses in the pipe (Art
Popper pers comm.).
The passive acoustics approach can provide fish biologists and fishery scientists with a non-destruc-
tive sampling tool that can provide a unique perspective of the biology and ecology of soniferous
species of fishes.
Literature Cited
Aristotle’s Historia Animalium, 4: 9. Translated by D’A Thompson. Oxford: Clarendon Press, 1910.
Casaretto, L. and Hawkins, A. D. 2002. Spawning behavior and the acoustics repertoire of haddock.
Bioacoustics 12: 250-252.
Fine, M.L. 1978. Seasonal and geographical variation of the mating call of the oyster toadfish
Opsanus tau L. Oecologia 36:
Fish, Marie Poland, Alton S. Kelsey, Jr., William H. Mowbray. 1952. Studies on the Production of
Underwater Sound by North Atlantic Coastal Fishes. Journal of Marine Research 6: 180-193.
Fish, M. P. and W. H. Mowbray. 1970. Sounds of Western North Atlantic Fishes. The Johns Hopkins
Press. Baltimore. 207 pp.
— 165 —
Proceedings from the International Workshop on the Applications of Passive Acoustics to Fisheries

Hawkins, A. D, and M. C. P. Amorim. 2000. Spawning sounds of the male haddock, melanogrammus
aeglefinus. Environ. Biol. Fish. 59: 29-41.
Hawkins, A. D, L. Casaretto, M. Picciulin, K. Olsen. 2002. Locating spawning haddock by means of
sound. Bioacoustics 12: 284-286.
Kaatz, I. M. 2002. Multiple Sound-Producing mechanisms in teleost fishes and hypotheses regarding
their behavioural significance. Bioacoustics 12:230-233.
Lobel, P.S. & D.A. Mann. 1995. Spawning sounds of the domino damselfish, Dascyllus albisella
(Pomacentridae), and the relationship to male size. Bioacoustics 6: 187-198.
Lobel, P. S. 2001. Fish bioacoustics and behavior: passive acoustic detection and the application of a
closed-circuit rebreather for field study. Marine Technology Society Journal, 35:19-28.
Luczkovich. J. J., Sprague, M. W., Johnson, S. E., and Pullinger, R.C. 1999. Delimiting spawning areas of
weakfish Cynoscion regalis (Familiy Sciaenidae) in Pamlico Sound, North Carolina using passive
hydroacoustic surveys. Bioacoustics, 10, 143-160.
Luczkovich, J. J., H. J. Daniel III, M. Hutchinson, T. Jenkins, S. E. Johnson, R. C. Pullinger and M. W.
Sprague. 2000. Sounds of sex and death in the sea: bottlenose dolphin whistles suppress mating
choruses of silver perch. Bioacoustics, 10, 323-334.
Mann, David A. and Phillip S. Lobel. 1995. Passive Acoustic Detection of Sounds Produced By the
Damselfish, Dascyllus. Bioacoustics 6: 199-213.
Mann, David A., and Lobel, Phillip S. 1997. Propagation of damselfish (Pomacentridae) courtship
sounds. Journal of the Acoustical Society of America 101: 3783-3791.
Mann, David A., Jeanette Bowers-Altman, Rodney A. Rountree. 1997. Sounds Produced by the Striped
Cusk-eel Ophidion marginatum (Ophidiidae). Copeia 3: 610-612.
Mann, David A., Zhongmin Lu, Arthur N. Popper. 1997. A Clupeid Fish Can Detect Ultrasound. Nature
389:341.
Mann, David A., Zhongmin Lu, Mardi C. Hastings, Arthur N. Popper. 1998. Detection of Ultrasonic
Tones and Simulated Dolphin Echolocation Clicks by a Clupeid fish. J. Acoust. Soc. Am. 104: 562-568.
Mann, D. A. and P. S. Lobel. 1998. Acoustic behavior of the damselfish Dascyllus albisella: behavioral
and geographic variation. Environ. Biol. Fish. 51: 421-428.
McCauley, R. D., J. Fewtrell, A. J. Duncan, and A. Adhitya. 2002. Behaviroral, physiological and patho-
logical response of fishes to air gun noise. Bioacoustics 12: 318-312.
Myrberg, A.A., Jr. 1972. Ethology of the bicolor damselfish, Eupomacentrus partitus (Pisces:
Pomacentridae): a comparative analysis of laboratory and field behavior. Anim. Behav. Mon. 5: 197-
283.
— 166 —
Proceedings from the International Workshop on the Applications of Passive Acoustics to Fisheries
Myrberg, A.A., Jr., M. Mohler & J.D. Catala. 1986. Sound production by males of a coral reef fish
(Pomacentrus partitus): its significance to females. Anim. Behav. 34: 913-923.
Sprague, M. W. and J. J. Luczkovich. 2001. Do striped cusk eels, Ophidion marginatum (Ophidiidae)
produce the ‘chatter’ sound attributed to weakfish, Cynoscion regalis (Sciaenidae)? Copeia 2001 (3):
854-859.
Sprague, M. W., Luczkovich, J. J., Pullinger, R. C., Johnson, S. E., Jenkins, T., & Daniel, H. J III. (2000). Using
spectral analysis to identify drumming sounds of some North Carolina fishes in the family
Sciaenidae. J. Elisha Mitchell Soc. 116(2): 124-145.
Wood, M., Casaretto, L., G. Horgan, and A. D. Hawkins. 2002. Discriminating between fish sounds - a
wavlet approach. Bioacoustics 12:337-339.
— 167 —
Proceedings from the International Workshop on the Applications of Passive Acoustics to Fisheries
Working Group on Technology Issues
David Mann
University of South Florida, College of Marine Science. 140 7th Ave. South, St. Petersburg, FL 33701
Introduction
The purpose of this report is to summarize the findings of the Technology Working Group that was
held on the third day of the workshop. The Technology Working Group was tasked with reviewing
papers presented during the workshop, and information from the literature, and to summarize our
state-of-knowledge on passive acoustics applications to fisheries and the census of marine life. In
addition, the group was tasked with providing recommendations on areas of technology develop-
ment that were deemed by the participants to be of highest priority and most likely to facilitate
advances in the application passive acoustics to fisheries issues.
The success and development of fish bioacoustics depends on high quality recording systems and
analysis software. It is important that the technology is matched to the questions being asked. This
document provides an overview of existing technologies with the purpose of identifying technolo-
gies that can be applied to specific fish bioacoustics questions. It is not meant as an exhaustive sur-
vey of existing academic and commercial products. The main conclusion is that for most questions
the needed technology exists for advancing fish bioacoustics. The main impediments are the level
of education on the use of technology within the field and a general awareness by funding agen-
cies of the great potential that studies of fish bioacoustics can provide to research studies on fish
and fisheries. This workshop has been a first step to removing both of these impediments, and for
identifying ways to break them down further.
Hydrophones
Hydrophones are the most basic element of any recording system. They are underwater micro-
phones that typically convert sound pressure into an electrical signal that can be recorded by a data
acquisition system. There are many commercial suppliers of hydrophones that are appropriate for
fish sound recordings.
Simple Systems
Perhaps the most important technology area identified by participants are simple systems to record
— 168 —
Proceedings from the International Workshop on the Applications of Passive Acoustics to Fisheries
and analyze sounds. Simple recording and analysis systems are useful for recording fish sounds to
identify the sounds produced by different species and for performing surveys of locations of sound-
producing fishes. A simple system consists of a hydrophone with a data acquisition device. Data
acquisition systems include audio and digital tape recorders, audio-video recorders (Lobel), and
computers with sound cards. Digital systems provide obvious advantages over analog systems in
terms of greater frequency bandwidth and dynamic range, and will be the most commonly used
systems in the future. Which system is chosen will depend on the recording situation. Computer
systems that may be practical for recordings made in the laboratory, may not be practical in a field
situation, because of power and portability issues. One important development is the use of
remotely operated vehicles (ROVs) and permanent underwater listening stations for monitoring
sound producing fishes (Blue and Rountree; Luczkovich and Sprague; Brower and Barans). These
systems will be important in characterizing which species produce which sounds, especially for
species that will be difficult to maintain in a laboratory tank. They will also prove useful for docu-
menting behavior of fish aggregations when multiple fish call simultaneously.
Several caveats of recording systems were brought up that one needs to be aware of including:
1. Data compression: Some recorders (such as mini-disc and MP3) use data compression tech-niques that alter the recorded sound frequency and level. These would not be appropriate foruse in cataloguing known fish sounds, but could be very useful for ecological surveys of sound-producing fishes.
2. Automatic Gain Control (AGC): Many systems (especially many audio tape recorders and videocameras) use automatic gain control to keep the recorded volume within the same range. If asystem uses AGC, it will not be possible to determine the received sound level.
3. Bit resolution: Systems that record with a higher bit-resolution will have a larger dynamic range(the range of the quietest and loudest sounds that can be recorded).
One issue that many participants have encountered are problems with boat-induced noise on
recording systems, either through electrical noise on the boat, or the physical movement of the boat
causing the hydrophone to move. Bungee cords have been successfully used to decouple boat
movement and hydrophone movement, and acceleration canceling hydrophones are commercially
available. One other technique is to use telemetry buoys from the ship (see below).
Dataloggers
Audio dataloggers are useful for recording over long periods of time in many locations simultane-
ously. Dataloggers provide a way to gather information on the distributions of sound-producing
fish that would not be possible otherwise without considerable investment of human resources. A
good example of this are the pop-ups recorders (Clark).
Computers are the best option for recording as an audio datalogger where continuous power is
available, such as from shore or on a boat. Commercial software (such as Avisoft) exists for record-
ing on a given duty cycle. However, continuous power is rarely available in field situations where
— 169 —
Proceedings from the International Workshop on the Applications of Passive Acoustics to Fisheries

one would like to make recordings. In these situations low-power battery-operated dataloggers are
required.
To date all audio dataloggers that have been used for fish bioacoustics have been engineered by
individual laboratories to perform this task. These include analog tape recorders that have been
modified to record on a particular duty cycle (Luczkovich), and digital dataloggers that have been
programmed to record as desired (Clark; Mann). There is no commercially available datalogger that
can be purchased and used directly without either engineering or software programming (usually
both). This lack of an off-the-shelf product has greatly limited their use in fish bioacoustics.
Telemetry
Telemetry systems broadcast a hydrophone signal to a boat or shore-based receiver. They perform
the same function as dataloggers in allowing recordings over a large area for long periods of time.
Several types of telemetry systems are available including sonobuoys (VHF), cell phone systems, and
short range microwave systems. All of these systems require line-of-site between the transmitter
and receiver, and a relatively high-level of engineering to setup and maintain. Telemetry is also
capable of delivering video to document behavior during sound production (Øvredal).
Satellite systems generally do not support the bandwidth needed for transmitting acoustic data. At
this point, some amount of preprocessing would be required, so that limited data on sound charac-
teristics (e.g. RMS level, frequency spectra) could be transmitted.
Hydrophone Arrays
Hydrophone arrays could be used for localizing sound producing fishes and for producing a direc-
tional receiver to improve the signal to noise ratio (Forsythe). They have been used for determining
the locations of vocalizing whales in many different situations, but have not yet been applied to
fishes (Jarvis). They require a high-level of sophistication for setting up, operating, and analyzing the
data. Hydrophone arrays hold promise in answering questions about fish distributions that could
not be otherwise obtained with single hydrophone recordings. Most participants recognized the
potential benefits of hydrophone arrays, and they were one area where further training and descrip-
tions of existing systems would be useful.
Speakers
Underwater speakers are useful in conducting playback experiments to determine the reaction of
fish to different types of sounds. The US Navy rents low-frequency projects (e.g. J-9, J-11) to research
projects, and there are also commercially available speakers for swimming pools that can be used in
research situations (although these usually do not produce good low-frequency responses below
100 or 200 Hz). All of these speakers require processing of the signals to be played to produce an
— 170 —
Proceedings from the International Workshop on the Applications of Passive Acoustics to Fisheries

accurate reproduction of a fish sound (Hawkins). That is they do not have a flat frequency response.
So, one can not merely play back a recorded sound and hope to get a perfect reproduction of it.
Signal Processing Software
There are many commercially available packages for data acquisition and signal processing. Some
such as MATLAB (Mathworks, Inc.) have a great deal of flexibility and power, but require a high level
of knowledge of signal processing. Others are targeted specifically at bioacousticians including
Signal (Engineering Design), Canary (Cornell University), and Avisoft. The manuals to these software
programs are often the clearest source of information for learning signal processing techniques and
their applications.
One area that was identified as an important area of research and development are tools for auto-
matic identification of species and for analyzing long data sets. Such tools would depend on the
development of a library of fish sounds (Bloomberg). They would have great value in making pas-
sive acoustics accessible to all fisheries researchers.
Education
Most fish bioacousticians are biologists first and engineers second. This is because we have arrived
at fish bioacoustics as a powerful way to study fishes that no other approach can provide. This
means that we have to pick up engineering and signal processing principles as we go along.
Unfortunately, there is no one good source of information about recording and signal processing
that is accessible and practical for the fish bioacoustician. This gap can be bridged both by produc-
ing these targeted materials and conducting training workshops, and by attracting engineers with a
biological interest to the field.
Literature Cited
1 Fish, M.P., and W.H. Mowbray. 1970. Sounds of Western North Atlantic fishes. Johns Hopkins Press,
Baltimore, MD. 205 p.
— 171 —
Proceedings from the International Workshop on the Applications of Passive Acoustics to Fisheries