liutu riina
TRANSCRIPT

Saimaa University of Applied Sciences Business Administration Lappeenranta Corporate and Financial Law
Riina Liutu
SUBWAY MARKET RESEARCH
Bachelor‟s Thesis 2010

ABSTRACT
Riina Liutu
Subway Market Research, 114 pages, 7 appendices
Saimaa University of Applied Sciences, Lappeenranta
Degree Programme in Business Administration
Corporate and Financial Law
Bachelor‟s Thesis 2010
Instructor: Sari Jokimies Manager of Degree Program
The main goal of this thesis is to find out whether Danish entrepreneurs can become successful in the Danish market as Subway franchisees. Three specific cities, namely Århus, Horsens and Vejle, are looked at in depth. In the thesis, these three cities will represent the Danish market. An evaluation of the most suitable location for a Subway restaurant is made. To reach the above objective, the Subway franchising concept, the market situation, the customers and the competitive situation will be analyzed and evaluated. In order to understand the market in which the franchisee would operate, the size of the market, historic growth, potential growth, trends and macro environmental factors will be analyzed. The analyses will show that the fast food market is mature, and that it still holds some growth potential. To find out who the potential customers of the Subway franchisee might be, a survey was made. A questionnaire was used as a main tool to analyze customer preferences and the prospects of opening a Subway restaurant in Århus, Horsens or Vejle. After evaluating the results of the questionnaire, Horsens was pointed out as the most attractive and suitable city to open a new Subway restaurant. The competitive situation is also analyzed. In doing so, the overall competitive situation within the fast food industry is assessed. Furthermore, three main competitors, namely McDonald‟s, Burger King and Sunset Boulevard, are analyzed in depth. The findings in the thesis show that the competition is fierce. There are many players within the fast food industry, and Subway is not well represented since it currently has only two restaurants in the Danish market. In addition, due to the expected slowdown in market growth, the competition can be expected to increase.
Keywords: Denmark, Subway, Market Research, Competition, Customers

TIIVISTELMÄ Riina Liutu Subway Market Research, 114 sivua, 7 liitettä Saimaan ammattikorkeakoulu Lappeenranta Liiketalous, yritysten ja taloushallinnon juridiikka Opinnäytetyö 2010 Ohjaaja: Koulutuspäällikkö Sari Jokimies
Tämän opinnäytetyön tarkoitus on selvittää, voivatko tanskalaiset franchise-yrittäjät menestyä suositun Subway-pikaruokaravintolan yrittäjinä. Opinnäytetyön tarkoituksena on antaa lukijalle mahdollisimman hyvä kuva siitä, miten Subway-ravintola perustetaan, miten sitä pyöritetään ja mitä hyötyjä ja mahdollisia haittoja siitä on tanskalaiselle Subway-yrittäjälle.
Vuonna 2009 Tanskan markkinoilla oli vain kaksi Subway-ravintolaa, toinen Aalborgissa ja toinen Sønderborgissa. 1990-luvulla markkinoilla oli kuitenkin yli 20- Subway ravintolaa, mutta kaikki vedettiin pois markkinoilta lähes samaan aikaan. 2000-luvulla Subway-ravintoloita alkoi kuitenkin taas ilmestyä Tanskan markkinoille ja tällä hetkellä ravintoloita on jo kahdeksan.
Tässä opinnäytetyössä lukijalle annetaan kattava kuva Subway-konseptin historiasta ja sen strategioista. Myös yksi tunnetuimpia johtamisen malleja, McKinseyn &Co:n malli ”7S”, tulee esille. Seuraavaksi käydään läpi Tanskan markkinatilannetta ja lähinnä sen kokoa ja tämänhetkisiä trendejä. Kuten Suomen markkinoilla, myös Tanskan markkinoilla on paljon pikaruokaketjuja. Opinnäytetyössä käydään läpi Tanskan markkinatilannetta ja arvioidaan Subwayn kolmea suurinta kilpailijaa, McDonaldsia, Burger Kingiä ja Sunset Boulevardia.
Yksi suurimmista haasteista tässä opinnäytetyössä oli kysely, joka tehtiin kolmessa Tanskan kaupungissa, Horsenssissa, Århusissa ja Vejlessa. Tämä oli hankalaa siksi, että kysely tehtiin katukyselynä ja se vei odotettua kauemmin aikaa. Kyselyn tulokset osoittavat, että Tanskan markkinoilla olisi tilaa uudelle Subway-ravintolalle ja parhaaksi paikaksi näistä kolmesta osoittautui Horsens.
Asiasanat: Tanska, Subway, markkinointitutkimus, kilpailu, asiakkaat

CONTENTS
1 INTRODUCTION ................................................................................................. 6
1.1 Background of the research ......................................................................... 6
1.2 Purpose........................................................................................................ 7
1.3 Research method ......................................................................................... 8
1.3.1 Quantitative and qualitative research ...................................................... 9
1.4 Limitations and structure .............................................................................. 9
2 THEORETICAL FRAMEWORK ......................................................................... 10
2.1 PEST-Analysis ........................................................................................... 10
2.2 7-S framework of McKinsey ....................................................................... 11
2.3 AIDA .......................................................................................................... 11
2.4 SWOT-analysis .......................................................................................... 12
2.5 Marketing mix ............................................................................................. 12
2.6 Porter‟s five forces ..................................................................................... 13
3 SUBWAY AND THE FRANCHISING CONCEPT .............................................. 14
3.1 History of the Subway chain....................................................................... 14
3.2 Current product portfolio ............................................................................ 17
3.3 Key competences ...................................................................................... 18
3.4 Subway‟s current strategies ....................................................................... 23
3.5 Franchisee benefits from Subway .............................................................. 24
3.6 Advantages and disadvantages of the Subway franchise concept ............ 26
4 THE FAST FOOD MARKET .............................................................................. 27
4.1 Market size ................................................................................................. 27
4.2 Market growth ............................................................................................ 28
4.3 Trends ........................................................................................................ 30
4.4 Macro environmental factors ...................................................................... 34
4.4.1 Political Environment ............................................................................. 34
4.4.2 Economical Environment ....................................................................... 34
4.4.3 Socio-Cultural Environment ................................................................... 35
4.4.4 Demographical Environment ................................................................. 36
4.5 Attractiveness of the Danish fast food market ............................................ 37
5 THE QUESTIONNAIRE ..................................................................................... 37
5.1 Test of the questionnaire ........................................................................... 38
5.2 The final questionnaire ............................................................................... 39
6 COMPETITIVE SITUATION .............................................................................. 41
6.1 Main competitors ........................................................................................ 41

6.2 Strength of the competition ........................................................................ 44
6.3 Competitor analysis ................................................................................... 46
6.4 Conclusion of the competitive situation ...................................................... 51
7 THE CUSTOMERS ............................................................................................ 52
7.1 Buying behavior ......................................................................................... 52
7.2 Target group .............................................................................................. 57
7.3 Data analysis ............................................................................................. 61
7.3.1 Horsens ................................................................................................. 61
7.3.2 Vejle....................................................................................................... 66
7.3.3 Århus ..................................................................................................... 70
7.4 Marketing-Mix ............................................................................................ 74
8 CONCLUSION AND RECOMMONDATIONS .................................................... 80
8.1 Conclusion ................................................................................................. 80
8.2 Recommendations ..................................................................................... 81
REFERENCES ......................................................................................................... 83
APPENDICES Appendix 1 The old questionnaire Appendix 2 The final questionnaire Appendix 3 Forecast Sales in Fast Food by Subsector: sales in DKr million Appendix 4 Forecast Sales in Fast Food by Subsector: in terms of value growth Appendix 5 Fast Food by Subsector, sales in DKr million Appendix 6 Fast Food by Subsector, in terms of value growth Appendix 7 Fast Food Denmark, Euromonitor international

6
1 INTRODUCTION
Subway chain is the third largest fast food chain in the world after McDonald‟s and
KFC. The first Subway was founded in 1965. The founder of the Subway chain, Fred
De Luca, started running his restaurant business when he was only 17 years old.
The first Subway restaurant was opened nine years after its foundation in
Connecticut where the headquarter is now situated. (Subway Denmark)
Now there are more than 30,000 Subway restaurants in 88 countries worldwide and
it is the world‟s fastest growing franchise chain. New Subway restaurants are
opening all the time. The franchise chain has employed more than 150,000 people.
(Subway 2009)
Subway offers customers many different kinds of fresh submarine sandwiches also
called “subs”. Customers always decide how they want their sandwiches to be
served. Subway‟s advertising is based on freshness. Slogan “Eat Fresh” tells that
Subway chain uses only freshly baked bread and fresh ingredients. Subway has a lot
of competitors for example McDonald‟s, Burger King and Sunset Boulevard.
There were more than 20 Subways in Denmark in the 1990s but 10 years ago they
withdrew from the Danish market. In 2009 Subway tried to strive for the Danish
market again. At the beginning of February they reopened Subway in 2 cities, in
Aalborg and Sønderborg. The Subway chain has also a lot of competitors in Danish
market. One of the main competitors is the Danish chain Sunset Boulevard. When
the Subway chain was withdrawing their restaurants from the Danish market, Sunset
Boulevard bought 3 of their branches. (Subway Denmark)
1.1 Background of the research
This thesis will give background information about the Subway chain, its customers
and Subway as a franchise concept. The fast food market in Denmark and the
competition between Subway and its three biggest competitors, McDonald‟s, Burger
King and Sunset Boulevard, are also included.

7
1.2 Purpose
The purpose of this thesis is to find out how attractive the Danish market is for
entrepreneurs to take up the Subway franchise concept. This means that the focus
of the thesis will be to analyze the Danish market and the opportunities that Subway
offers the entrepreneurs. The objective of the thesis is to find out which is the most
attractive location for a Subway restaurant. Three different cities are analyzed
namely Århus, Horsens and Vejle. The topic was chosen because it is interesting
that Subway is not well-represented in Denmark.
This thesis is made to find an answer for the following main question: Can
entrepreneurs take up the Subway franchise concept and become successful in the
Danish market?
The franchising concept of Subway:
A company needs to know which strings it can play on, meaning that it has to know
what its key competences and its overall capabilities are. By having this knowledge,
the company can decide on doing business within areas where it is most capable. To
find out the benefits of doing business with Subway, the following main question
could be asked:
What are the pros and cons of cooperating with Subway?
External analyses:
The market
For a company it is important to know the market it is operating in. Knowing the
possibilities for entering the market and the potential customers are vital.
Furthermore it is a good idea to look at the macro environmental factors that are
influencing the market. To get a better knowledge about a market, the following main
question is asked:
How attractive is the market for fast food?

8
Customers
A company needs to know who its customers are. To know the target group and its
preferences can be a huge advantage. Knowing this would make it easier to make
decisions concerning products, service and promotion. To get to know the customers
and their buying behavior, there is one main question namely:
What is the target group?
Competition:
It is important to know something about the competition within a given market, as it
serves as an indicator as to how difficult (or easy) it is to operate within that market.
Fierce competition will undoubtedly affect for example marketing expenses, thus it is
useful to know what kind of competition one can be expected to face within that
market. To cover this area the following main question is asked:
How is the competitive situation?
1.3 Research method
Market research is about gathering information about customers, competition,
market and its trends. Discussions, surveys and questionnaires are some of the tools
for market research. Many people confuse market research and marketing research.
Market research is simply a research into a specific market. It is a very narrow
concept. Marketing research is much broader. It not only includes 'market' research,
but also areas such as research into new products, or modes of distribution such as
via the Internet. (Marketing teacher)
The market research process has seven stages. First stage is to define the
marketing problems such as low awareness of the company or company image
problems. Second stage is to set objectives, budget and timetables. The researcher
has to know how much money and time he is willing to spend and also what the
main goal of the market research is. The next stage is to select the research types
and methods. There are two ways to do it, either secondary research which involves
analyzing information that has been gathered already or primary research which
involves collecting brand new information. Primary research can be qualitative or

9
quantitative. Fourth stage is research design. The most common tool is a
questionnaire which was used in this case also. Collecting data is the fifth one. There
are many ways that the data can be collected, for example questionnaires, surveys
or interviews. Sixth stage is to organize and analyze the data which was gathered.
The last stage is to use the findings and present it. In this case the findings are
reported in chapter seven. (Small Business Notes)
1.3.1 Quantitative and qualitative research
Researches can be either qualitative or quantitative or both. It is important to
understand the difference between qualitative method and quantitative method since
they are so different. Qualitative method is used when data can be observed and
quantitative when data can be measured. Quantitative method is a research method
which is used to collect data, modeling and analyzing customers, markets and
competition in the market. When the data is gathered, the results are evaluated.
Qualitative methods do not include statistics or measurements at all.
(Qualitative vs. Quantitative Data 2010)
Subway market research is quantitative as many of market researchers are. To find
out who the potential customers of the Subway franchisee might be, a survey is
made. A questionnaire is used as a main tool to analyze customer preferences and
the prospects of opening a Subway restaurant in Århus, Horsens or Vejle.
1.4 Limitations and structure
The focus should be on the Danish market and the relationship between the
franchiser and the franchisee. The main part of the thesis will strictly be marketing
analyses; therefore technical and financial issues will not be covered.
Furthermore price and distribution within the marketing mix will not be included, as it
is not relevant to this thesis.
Regarding the macro environmental factors, the analysis will focus on the
political/legal, economical, social/cultural and demographical issues. Technical and

10
natural/environmental factors will not be covered, as they are not considered to be of
importance in this context.
In the field of competitors, the analysis will narrow down the competitors to the three
most important ones; Mc Donald‟s, Burger King and Sunset Boulevard. Generally
these are the three competitors that pose the biggest threat. Obviously, there are a
lot of smaller competitors like pizzerias, hot dog stands, kebab houses, Chinese
take-away etc. but these will not be covered.
The three cities Århus, Horsens and Vejle will in this thesis represent the Danish
market. There are not enough resources available to look at every major city in
Denmark.
The thesis is divided into eight chapters, introduction, theoretical framework, Subway
and the franchising concept, the fast food market, the questionnaire, competitive
situation and the customers, which all leads to conclusion and recommendations.
2 THEORETICAL FRAMEWORK
In this chapter the theoretical framework of the thesis will be looked at. This will give
the reader a better image of what models and different theories are used in this
thesis.
2.1 PEST-Analysis
It is a huge advantage for a company that it considers its environment before
beginning the marketing process. Letters PEST comes from words political factors,
economic factors, social factors and technological factors. Although it is quite hard
for companies to control or influence the macro-environment, PEST is one of the
tools that help with becoming acquainted with the macro-environment. There is also
a PESTEL analysis which includes environmental factors and technical factors but
these two factors are not covered in this thesis.
Political factors can have either a huge impact or low impact depending on the way
business operates. It includes areas like tax policies, employment law and consumer

11
protection. Political factors include government‟s decisions and legal issues.
(MindTools, PEST analysis)
Economic factors have an effect on all businesses, nationally and globally. Economic
factors affect the purchasing power of the customers and the firm‟s cost of capital. It
includes areas like exchange rates, economic growth and inflation rate.
Social factors include also demographic changes. There are many factors that affect
our lifestyle since we live in a society. Some important factors are family, religion,
education and locality. Population growth rate, age distribution and career attitudes
are all included in social factors.
Technology is driving the businesses and reduces time to market. Some
technological factors are research and development activity, automation and
stakeholder expectation.
2.2 7-S framework of McKinsey
McKinsey‟s 7-S model was found out in the early 1980s. It has been a widely used
tool and well-known among people since it was created. This model includes seven
factors; strategy, structure, systems, shared values, style, staff and skills. The first
three factors are called the hard elements and the four last ones the soft elements.
Hard elements are easily identified while soft elements are fuzzier. The 7-S model is
used when current situation and future situation need to be analyzed. (McKinsey 7S
Framework)
2.3 AIDA
Aida stands for attention, interest, desire and action. It is a process of getting
customers to purchase products and services. It is believed that a consumer has to
pass these steps before buying a product or service. First the concept has to get
customers‟ attention by advertising and promotional campaigns. After they have
gotten the attention the interest rate has to rise. This is one of the most difficult tasks
during the process. When the customer finds out something interesting he wants to
take a closer look at the product or service. The product or service must be
packaged and priced right. If everything goes how the company wants, the customer
will act on his desire and buy the product or service. (Hollensen 2003, 565)

12
2.4 SWOT-analysis
Swot-analysis is a good method to understand businesses‟ strengths and
weaknesses but also look for opportunities and threats. The main goal of SWOT-
analysis is to recognize the key internal and external factors that are important for a
company to achieve the object. Strengths and weaknesses are internal factors.
Opportunities and threats are external factors. This works best for a company if it is
realistic and specific. (Hollensen 2003, 265-270)
2.5 Marketing mix
Marketing mix is also known as 4Ps. These four Ps stand for product, price,
promotion and place (distribution). This helps you to understand how to position your
market offering. This is very simple, the right product, at the right price, in the right
place, at the right time.
When an organization launch a product or a service into a market they have to be
aware about whom they are going to aim it at, what benefit they get and what
different advantage it offers over the competitors. A product or service the company
is trying to sell has to satisfy the customers‟ needs. (USC Marshall)
Pricing is one of the most important factors of the marketing mix. The company has
to price the product or the service right, not too low nor too high. It has to reflect
supply and demand relationship. When pricing, companies have to take into account
for example competition in the market, fixed and variable costs and the target group.
(USC Marshall)
Place is also known as channel or distribution. The company has to distribute the
product or the service to the end user at the right place. There are two types of
distribution, indirect and direct. Indirect distribution involves distributing the product
or the service to a wholesaler and then on to the retailer. Direct distribution involves
distributing directly from manufacturer to the end user. (USC Marshall)
Companies‟ promotion should be aimed at their target groups. This includes a lot of
weapons like advertising, sales promotions and direct marketing. It is like a
communication link between buyers and sellers. There are many ways companies

13
can promote their products or services, like newspapers, Internet and television.
Promotion is one of the most important marketing mix tools. (USC Marshall)
2.6 Porter’s five forces
Michael Porter came up with a framework called Porter‟s five forces. Porter wanted
to clarify that an industry is being influenced by five different forces. They are rivalry,
buyer power, threat of entry, supplier power and threat of substitutes. This
framework helps companies understand the strength of current competitive situation
and also the strength of a position the company likes to move into. (Hollensen 2003,
74-79)
It is important to a company to know how many competitors there are in the market.
If there are only few competitors, then you have a lot of power and vice versa, the
more competitors there are the less power you have. It also depends on what
competitors are offering to their customers. Customers do not come to you if they do
not get a good deal from you. (ibid. 74-79)
The number of buyers has a huge effect on this one but also how powerful a buyer
is. In this kind of market situation the buyers are the ones who set the price. (ibid. 74-
79)
New companies are entering the market all the time. Every company should be able
to enter and exit the market whenever they want. In reality there are some factors
which can make the entering really hard, for example, the cost of entry vary from
business to business, the competition in the market and the government which
creates barriers. (ibid. 74-79)
Suppliers play a big role also. Production companies need raw materials and they
get them from suppliers. This involves a relationship between the buyer and the
supplier. If there are only few suppliers in the market, suppliers can sell their
materials at a high price and buyers cannot do anything about it. (ibid. 74-79)
In this model, substitute products or services refer to products or services in other
industries. Companies have to think about how easily their products or services can
be substituted. So in other words, companies‟ owners have to look at also what their

14
competitors are doing and what other types of products or services customers could
buy from them instead. (Hollensen 2003, 74-79)
3 SUBWAY AND THE FRANCHISING CONCEPT
In the following chapter, a closer look will be taken at Subway. First the history and
the current product portfolio will be discussed and later on the key competences,
current strategies and franchisee benefits.
3.1 History of the Subway chain
Subway, the world‟s largest restaurant chain, was founded in 1965. The founder, 17-
year-old Fred DeLuca, wanted to go to college, but he could not afford it. A friend of
DeLuca‟s, Peter Buck, suggested him to open a small submarine sandwich shop so
he could earn some money. At first Deluca was not excited about the idea, but after
thinking about it for a while, he became more interested. Buck promised to invest
1000$. In the summer of 1965, Pete‟s Super Submarines opened in Connecticut,
USA. (Subway History 2009, Subway Studentguide)
Ten years later, in 1974, DeLuca and Buck decided to turn their business into a
franchise. Due to the lack of time and financial restraints, they did not want to hire
any consultants. They were determined to start finding franchisees by themselves.
Brian Dixon, a friend of Fred DeLuca‟s, was the very first Subway franchisee. The
restaurant was located in Wallingford, Connecticut, and it was opened in the summer
of 1974. The first international Subway restaurant was opened in Bahrain three years
later in 1977. During the last 44 years, Subway has expanded rapidly. Nowadays
there are more than 30,000 Subway restaurants in 90 countries (1st june 2009).
(Subway History 2009, Subway Studentguide)
The year 1974 was a big change for Subway. Turning into a franchise company
opened many doors. 35 years ago when DeLuca and Buck decided to go into
franchising, Subway was a small restaurant company. It was a big risk, but they
wanted to take it and it was worth it. As it can be seen on the chart below, Subway
keeps growing and it was the world‟s fastest growing fast food chain in 2009.
(Subway History 2009, Subway Studentguide)

15
Chart 1 Open restaurants 1965-2009 (Subway, Studentguide)
From the year 2000 and onwards, Subway has opened more restaurants than ever
before throughout its history. One reason for this growth was Jared S. Fogle, a 30-
year-old American man. At that time, Fogle was a high school student suffering from
being overweight. After Fogle found out that he might not live to see his 35th
birthday, he wanted to change his way of living. Fogle developed his own Subway
diet, which consisted of two subs, a footlong and a six-inch. He was also involved in
sports activities. In three months, Fogle lost almost 45 kilos, and at the end of the
diet, he had doubled that amount. Fogle‟s diet motivated many other people.
Thousands of people around the world wanted to change their lifestyle and tried the
Subway diet too. Since 2000, Jared S. Fogle has cooperated with Subway, and he is
one of the key persons in Subway‟s marketing. He travels around the world telling
his unbelievable story to people. Fogle has also participated in several Subway
campaigns.(Subway History 2009, Subway Studentguide)
When DeLuca started running his sandwich business in 1965, he promoted his
restaurant, “Pete‟s Submarines”, on the radio. A few years later, it was shortened to
Subway, as it is known today. The Subway chain has used many slogans during the
last 44 years, but one of the most well known slogans is “eat fresh”. It was launched
in 2004. “Eat fresh” tells customers that Subway uses only freshly baked bread and
fresh ingredients. Slogans might vary from country to country. Subway also has

16
clubs for its members, the sub club and the subway card; here subway card refers to
a club name. In the sub club people earn a different amount of stamps depending on
what they order. Being a subway-card owner, people earn a different amount of
points depending on how much money they spent. (Subway History 2009, Subway
Studentguide)
The franchise chain Subway employs many people. There are already more than
600 workers in Connecticut where Subway‟s headquarters and Doctor‟s Associates
Inc. (the franchisor of Subway restaurants) are situated. Approximately 150,000
people worldwide work for Subway. In 2006 Subway‟s revenue jumped to 9.05 billion
dollars (€ 6,85 billion), and it still keeps growing rapidly. Fred DeLuca has been a
leader of the chain for 44 years. (Subway, history 2009)
Chart 2 Subway restaurants in the world (Subway, Around the world)
As can be seen on the graph, most of the Subway restaurants are located in North
America. The second largest amount is situated in Europe. Here most of the
Subways are located in United Kingdom (1,322 restaurants), and the Subway chain
aims to have more than 2,010 restaurants in the United Kingdom and Ireland by
2010. Africa is the continent with the least restaurants. In Denmark, Subway was
represented in the 1990s. There were more than 20 Subway sandwich restaurants
around the country, but 10 years ago, they withdrew all the restaurants from the

17
Danish market. In 2009 two Subway restaurants have been reopened in Denmark,
one in Aalborg and one in Sønderborg. (Subway, history 2009)
3.2 Current product portfolio
Subway offers customers a wide selection of sandwiches also called “subs”.
Sandwiches are always freshly baked, and customers can choose if they want their
sandwiches toasted or non-toasted. There are two different sizes of sandwiches, a
six inch. (15cm) and a foot long (30cm). Subway also serves soft drinks along with
the sandwiches. Cookies, chips, coffee and chocolate can be ordered as
accompaniments.
In Denmark, there are four types of bread to choose from, the Italian white bread, the
honey oat bread, the parmesan/oregano bread and the 9-grain wheat. The 9-grain
bread is the only bread, which contains animal product if honey is considered an
animal-derived ingredient. Wheat free bread cannot be found in Danish Subways. All
of the breads are milk free except the parmesan/oregano bread, which contains
cheese. (Subway menu 2009)
Subway has a huge sandwich selection. There are more than two million different
sandwich combinations. Healthy and light subs can be enjoyed in Subway
restaurants as well. This fast food chain offers sandwiches, which contain only six
grams of fat or less. These sandwiches became more famous after “a Subway guy”
Jared S. Fogle lost weight of 240 pounds (109 kilos) due to the Subway diet (check
chapter 3.1 – history of the Subway chain). On the Danish menu, customers can find
15 different sandwiches. In the following, a variety of the menu will be presented.
(Subway menu 2009)
Customers decide what they want their sandwiches to include. The filling can be
ordered double or some things can be left out. The Subway chain also has a wide
range of dressings that can be chosen from. The customer can choose between
take-away and enjoying the meal at the restaurant. Any sub can also be turned into a
salad. Salads were added to the menu in 1980.In Denmark, Subway does not have
any special menu for children.

18
Birthdays and other occasions can be celebrated in Subway restaurants. On the
menu, customers can find a catering part, which contains sub platters, giant subs
and cookie platters. The giant sub can be made to any length depending on the
amount of people. Sub platters consist of 15 4 inch. portions and cookie platters
contain 36 (minimum) delicious cookies.
(Subway menu 2009)
3.3 Key competences
A short introduction to 7s-Model
McKinsey developed a framework for analyzing and improving organizational
effectiveness. This framework consists of seven aspects of an organization, which
need to be balanced. These factors differ in hard (strategy, structure and systems)
and soft (skills, staff, style and shared values) factors. In this regard, the hard factors
are easy to grasp, however the soft factors are difficult to estimate.
(Value Based Management 7-S framework of McKinsey)
Figure 1 7S-model

19
The Analysis
Strategy
The main goal of the Subway chain is to be ranked the number one restaurant by
consumers and in every market that Subway serves. Furthermore, Subway does not
specifically select the new countries it enters. All Subway restaurants are owned and
operated by local business people, who choose the place for their Subway
restaurant. The franchisee buys the right to run a Subway franchise according to
Doctor‟s Associates Inc contract. A development team will work with the new
entrepreneur to provide assistance in opening and running a Subway restaurant
within a new market. Subway will continuously provide assistance to make sure that
the franchisee gets all the basic information.
(Subway‟s Marketing strategies 2009)
Structure
The Subway chain is the biggest franchise chain in the world, and it employs about
150.000 people in more than 30,000 locations in 90 countries around the world. Due
to the size of the operation, Subway has more than 700 development and support
people employed at the chains world headquarters in Milford, Connecticut. The
company is divided into the following departments, franchise sales, new business
development, Subway real estate Corp, store design, franchisee services,
operations, creative services, customer care, public and community relations,
publications, profit building and local marketing, meeting and events, research and
development and Subway franchisee advertising fund trust.
(Subway Departments and Organizations 2009)
Subway is a registered trademark of Doctor‟s Associates Inc. (DAI). DAI owns the
operational business concept and trademark of Subway restaurants. From this
organization, the franchisee buys the right to operate with the Subway concept.

20
Systems
During a two week training, Subway provides the new franchisee with the required
information. The Subway franchise fee is exceptionally low for a chain of this size.
Subways franchise fee:
$15,000 (Local currency) in the United States & Canada,
$12,500(Australian) in Australia,
$10,000(US dollars) for all other international countries (including Denmark)
Danish restaurant owners have the opportunity to lease and/or get a loan from
Subway.
(Subway How we compare our competitors 2009)
Shared values
Shared values are the fundamental ideas of Subway; these can be identified by the
following key words:
Simplicity: Subway has an easy-to-run operation.
Support: Subway has systems and information resources to assist the
franchisees.
Control: Subway teaches methods to help run the business efficiently.
Shared values of the Subway chain:
Subway provides the tools and knowledge to allow entrepreneurs to successfully
compete in the quick service restaurant (QSR) industry worldwide.

21
The core values:
Subway is committed to customer satisfaction through offering high quality
food with exceptional service and good value.
Subway takes great pride in serving each other, the customers and the
communities.
Subway is seeking continuous improvement in everything.
Subway values a sense of urgency and emphasizes an innovative,
entrepreneurial approach to business.
Subway expects fairness and mutual respect in all the activities.
Subway knows that success depends upon the initiative is taken individually
and the ability to work as a team
(Subway Our Core Values and Philosophy 2009)
On a local basis Subway franchisees are involved with many schools and religious or
community organizations. Furthermore, Subway contributes many civic, educational
and charitable organizations, namely the American Heart Association, the American
Red Cross, Habitat for Humanity, Junior Achievement, March on Dimes and United
Way. (Subway, Frequently asked questions 2009)
Staff: The Subway chain offers a program and information resources to provide the
knowledge that the entrepreneurs need. The franchisee buys the rights to operate
under the concept of Subway. Why franchisees embrace the Subway franchise
system is formulated in the following four criteria:
Quality of the Product: Subway is very concerned about the quality of the products.
This is visible through the fresh products and the inspections.
Location flexibility: Subway does not look for new markets. Potential restaurant
owners contact Subway.

22
Lower investment: Subway has the lowest start up cost compared to other fast food
chains. Start up costs:
Subway: $69,300 to $191,000
Burger King: $240,000 to $2.5 million
McDonald‟s: $432,800 to $715,150
Operational support: Subway offers training courses and information resources to
franchisees.
(Subway How We Compare To Our Competitors 2009)
Skills: Subway provides the franchisee with marketing knowledge as well as the
necessary tools for him to operate his business efficiently. This is one of the
strengths of Subway. It knows the market and offers more healthy options than other
fast food chains for example McDonald‟s or Burger King.
Style: Subway guides the franchisees in the right direction with training courses and
necessary information. It supports its franchisees and helps to start up the business.
(Subway Steps to Apply 2009)
SWOT-analysis of Subway
The SWOT analysis is a framework to analyze the strengths, weaknesses,
opportunities and threats of the internal and external environment of a company.
(Marketing teacher SWOT analysis 2009)

23
Table 1 SWOT analysis of the Subway chain (Subway Our Support network 2009, Subway Studentguide Non-Traditional Development 2009, Subway Our Support network 2009)
STRENGHTS WEAKNESSES
Size and number of stores and channels
Menu reflects demand for fresh and healthy fast food
Extensive market, also in non-traditional locations (“airports, amusement parks, hospitals, military bases, supermarkets”)
Worldwide brand recognition: Subway has more than 30,000 locations in 90 countries
Customizable menu offerings: Customers can leave something out or order something double
Low franchisee start up costs compared to the main competitors
Franchisee training, courses and information is provided for a quick start up
Strong market position: Second largest restaurant operator
High quality products/services (daily baked bread)
Service delivery is inconsistent from store to store, this means that Subway has no influence on the service each restaurant offers the customer
If the market is satisfied there is still a possibility that people want to open a restaurant
OPPORTUNITIES THREATHS
Improve franchisee relations to provide better information sources
Expand packaged dessert offerings, so that customers also have the choice between desserts
Continue to revise and refresh menu offerings, this to stay up to date with trends within the market and to serve the best possible products
Room for growth in the sandwich market (Denmark)
Expand product/service lines
Financial crisis: Due to the fact of the economic slowdown, people have less money to spend
High competition: McDonald‟s, Burger King, Sunset Boulevard are big players
New competitors entering the market. The number of little restaurant like kebab places are growing
Price war between competitors
3.4 Subway’s current strategies
Growth strategies

24
By considering ways to grow, there are four possible product-market combinations.
Subway expands with its existing products to new markets (Market development).
This happens through the franchisees to whom Subway offers an easy concept.
Subway is not looking for new markets or places to open restaurants, the franchisee
contacts Subway.
(Tutor2u Market Matrix 2009)
Existing Products New Products
Existing Markets Market Penetration Product Development
New Markets Market Development Diversification
Porter‟s Generic Strategies
A differentiation strategy calls for the development of a good product or service that
offers unique attributes that are valued by customers. Subway does not focus on just
one segment; it has a broad target scope. Furthermore, the advantage of Subway is
the product uniqueness. The customer can select from a range of sandwiches and
customize them. The model below shows Subway‟s position.
(QuickMBA Porter‟s Generic Strategies 2009)
Target Scope Advantage
Low Cost Product Uniqueness
Broad (industry wide) Cost leadership strategy Differentiation strategy
Narrow (market segment) Focus strategy (low cost) Focusstrategy (differentiation)
3.5 Franchisee benefits from Subway
Subway has a lot to offer to potential franchisees. The company provides
franchisees with help both before and after they open a restaurant. Subway offers
the franchisees the following services before opening:
Training. Before opening the Subway restaurant the franchisee has to take
part in an intensive two-week training.
Site selection. Subway will help the franchisee to secure a location for the
new Subway restaurant.

25
Restaurant design. Subway provides the franchisee floor plans for the specific
location.
Equipment ordering. Subway provides the equipment that the franchisee will
need running the business.
Access to product formulas & operational systems. Subway offers training
courses and information resources.
(Subway Brochure Before You Open 2009)
As mentioned before Subway also provides a service to the franchisees after
launching the restaurant, namely:
Operations manual. The in-depth manual that Subway offers franchisees
covers a full range of topics important to running one‟s business.
Field support. The franchisee will be assisted by a representative, who will
help to get started and provides ongoing operational evaluations.
Franchisee services. The franchisee will be assigned a coordinator who will
serve as the main contact person, who is just a phone call or e-mail away.
Research and development. An executive chef, baking specialists, staff
nutritionist and product development team continually strive to make our
excellent food even better.
Continuing education. There will be periodic newsletters, e-mails and
voicemails. Videos, DVD‟s and additional training classes are also available.
(Subway Brochure After You Open 2009)
The franchisees are responsible for the following:
Initial franchise fee ($12,000)
Finding locations
Leasehold improvements
Leasing or purchasing equipment (possible through subway)
Hiring employees and operating the restaurant
Paying 8% royalty (for the franchising concept)

26
Paying 3.5% advertising fee into the advertising fund (4.5% in the US,
Canada, Australia)
(Subway Brochure the Franchisee is responsible for 2009)
3.6 Advantages and disadvantages of the Subway franchise concept
There are pros and cons in engaging in any cooperation or partnership. Apart from
the many benefits derived from the cooperation between Subway and the franchisee,
which have been considered in the previous sections, there are also some
disadvantages that need to be assessed.
Firstly, any bad news about Subway might have direct impact on the franchisee as
the brand/trademark could be affected in the process. If the value of the brand
decreases, the franchisee loses some of his competitiveness. Another disadvantage
is that the franchisee is highly dependent on the franchisor. As the franchisee is
using Subway‟s operations systems and relies on Subway to take care of the
promotion, a great deal of control is in the hands of Subway. In rough terms, it is
Subway‟s way or the highway, meaning that a franchisee only has limited influence
on strategic matters.
Furthermore, the franchisee carries most of the risk in the cooperation, as he is the
one investing most money in it. Even though the start-up costs for setting up a
Subway restaurant are relatively low, a financial investment must still be made by the
franchisee. If the cooperation between the two fails, it will hurt the franchisee most as
he has invested most resources in the cooperation.
Another issue is that the franchisee will have ongoing costs as he has to
continuously pay royalties and advertising fees to Subway.
The following lists the advantages and disadvantages seen from the franchisee‟s
viewpoint:
Table 2 List of advantages and disadvantages

27
Pros: Cons:
Trade mark strength
Technical advice
Support services
Employee training
Marketing resources
Advertising
Vulnerable to ill news about
Subway
High dependence on franchisor
Limited control
Risk carrier
Cost in terms of both initial start
up fees and ongoing costs
From a historical point of view, the advantages have been seen to up weigh any
disadvantages as more and more Subway restaurants have emerged and been
successful.
4 THE FAST FOOD MARKET
In the following chapter, the fast food market will be analysed. Market size and
market growth as well as the current trends will be the focus. Furthermore, the PEST
analysis will reveal any external factors that might affect the market for fast food.
4.1 Market size
The market size of fast food in Denmark can be accounted in different ways; one
being the total sales of fast food, but in this context another way could also be to look
solely at sales of fast food in chained restaurants. By isolating the sales made in
chained restaurants, a picture of the overall attractiveness of franchises should be
clearer. Both the total and the chained fast food sales will be considered in this
section.
Total sales of fast food from 2002-2007 can be seen in appendix five. Value growth
in percentage from 2002-2007 can be seen in appendix six.
Appendix four shows that total sales have grown 7.9 percent in compound annual
growth rate (CAGR). The total growth between 2002 and 2007 has been 46.3
percent. In other words this growth means that fast food sales in 2002 increased
from DKr million 5,413.5 to 7,922.1 in 2007. (Fast Food by Subsector, sales in DKr
million)

28
While the overall market for fast food has been performing well, times have been
even better for chained restaurants such as McDonald‟s, Burger King, Sunset
Boulevard etc. In 2002 sales were DKr million 2,145 and in 2007 the revenue was
3,613.3. This is a growth of 68.6 percent. The annual CAGR for chained restaurants
has been 11 percent from 2002-2007, which is a 3.1 percent bigger growth than that
of the overall fast food market. This indicates that chained restaurants are well
received in the Danish market. (Fast Food by Subsector, sales in DKr million)
The figures show that historically the market for fast food has been growing every
year. For Subway, this means that it can expand in a market that has been growing
over recent years. Market saturation has not happened yet which is definitely an
advantage as it decreases some of the pressure of performing within the market. A
saturated market usually leads to fierce competition since companies fight over the
very same customers.
Naturally, future sales and growth have to be taken into account in order to get a
fuller picture of the market - especially considering that the above-mentioned tables
only go as far as 2007. Future sales and market growth will be considered in the
following section.
4.2 Market growth
Appendices three and four are forecasts of sales and growth from 2007-2012.
To a large degree, the figures in these two tables are more important than those of
2002-2007 as they are more contemporary. Both total sales and chained restaurant
sales will be considered as in the foregoing section.
As can been seen from the forecast in appendix four, both the sector fast food and
the subsector chained fast food is expected to experience growth. However, the
growth rate is far lower than that of 2002-2007.
From 2007 to 2012 total sales are expected to rise from DKr million 7,922.1 to
8,575.5 which is a total growth of 8.2 percent. This is equal to a CAGR of 1.6
percent. The prospects, however, are somewhat better for chained restaurants. Here
sales are expected to rise from DKr million 3,617.3 in 2007 to 4,180.7 in 2012. This
is equal to a CAGR of 2.9 percent or a total growth of 15.6 percent.

29
Assessing these figures, it seems clear that although growth is not expected to rise
as significantly as in 2002-2007, the market is still expected to experience growth
especially within the subsector of chained restaurants. An analysis of the product life
cycle (PLC) will here be used to look more in depth at the development within the
market.
Chart 3 Illustration of a common product life cycle (Henrik Christensen)
Most product life-cycles are portrayed as bell-shaped, and the PLC for fast food is
not considered to be an exception. Keeping in mind the above-considered figures
about future market growth, it is valid to say that fast food is neither in the
introduction, the growth nor in the decline stage. The maturity stage is often divided
into three phases: growth, stable and decaying maturity. Although historically
chained restaurants have experienced higher growth rates than the overall market,
and, according to these forecasts, will continue to do so in the coming years, both
the overall fast food market and the market for chained fast food can be considered
to have the same PLC. (Kotler & Keller 2008, 318-325.)
Fast food is regarded to be in the first phase of the maturity stage. This means that
growth rates are beginning to decline which the forecasts also indicate. The
implications of being in the maturity stage are summarized by Kotler and Keller in the
following way:
Peak sales
Low cost per customer

30
High profits
Stable number of competitors beginning to decline
A company should maximize profit while defending market share
A company should diversify brands and items models
A company should price to match or best competitors
A company should build more intensive distribution
A company should stress brand differences and benefits
A company should increase sales promotion to encourage brand switching
(Kotler & Keller 2008, 328)
Since this summary covers the entire maturity stage, it is not completely accurate in
this context as the market for fast food is considered to be in the beginning stage of
maturity. This means that for example the number of competitors might not have
started to decline yet.
4.3 Trends
The general trends and prospects for the fast food market are a potential factor of
success. According to the “Euromonitor International: Country Sector Briefing –
October 2008” and the carried out survey, there are some specific trends, which
might affect Subway‟s success in the Danish fast food market.
Sales: In 2007, the sales grow was about 5%. Fast food sales forecast is expected to
reach DKr 8.6 billion, an increase of 8% in constant value terms from 2007.
(Euromonitor International: Country Sector Briefing)
Occasions: Convenience stores grow due to an increasing trend within fast food
sales in the morning. People tend to pick up some bakery products, mostly located in
petrol/gas stations or near train and bus stations on their way to work.
Eat-in accounts for 21% and takeaway for 79% of total fast food value sales in 2007.
Food accounted for 85% and drinks for 15%. (Euromonitor International: Country
Sector Briefing)
The slowing economy in Denmark could be a threat in an uncertain future. Faster
rising prices and labour costs can slow the expansions of fast food chains, and may

31
cause rising retail prices. (Euromonitor International: Country Sector Briefing –
October 2008).
The trend to organic and sustainable products is still a major trend within the food
market. Nevertheless, organic products are presently not that important for the fast
food sector as in the retail.
It is more important for the fast food sector, according to the health and wellness
trend, to have healthy options in the product range. The trend in low-fat products,
especially in the sandwich sector has high potential. Due to this trend, the success of
sandwich specialists will go on. According to the outcomes of the Euromonitor
research (see the table below) in the fast food sector, bakery products like
sandwiches will become more important within the next years.
As already explained in chapter 4.2, market growth, the table shows the forecasts of
sales in bakery products (sandwich specialists account for 51%, sweet bakery goods
for 45% and mixed bakery fast food for 4%) have the biggest potential within the
whole fast food sector. With a growth of 8.6 percent within the years 2007-2012, it
will be the most relevant trend in the coming years. According to this, the following
table shows the potential of growing fast food outlets in several sectors. Bakery
product outlets will increase by 16.7% from 2007 to 2012.

32
Table 3 Forecast Sales in Fast Food by Subsector
Forecast Sales in Fast Food by Subsector: % Units/Outlets Growth 2007-2012
% Units/Outlets growth
2007-12 CAGR 2007/12 TOTAL
Fast food 1.0 5.3
- Chained fast food 1.8 9.4
- Independent fast food 0.9 4.4
- Bakery products fast food 3.1 16.7
-- Chained bakery products fast food 7.3 42.1
-- Independent bakery products fast food 2.7 14.5
- Burger fast food 3.4 18.4
-- Chained burger fast food 3.4 18.4
-- Independent burger fast food - -
- Chicken fast food 9.5 57.1
-- Chained chicken fast food 0.0 0.0
-- Independent chicken fast food 11.6 72.7
- Ice cream fast food 2.5 13.2
-- Chained ice cream fast food - -
-- Independent ice cream fast food 2.5 13.2
- Fish fast food - -
-- Chained fish fast food - -
-- Independent fish fast food - -
- Latin American fast food - -
-- Chained Latin American fast food - -
-- Independent Latin American fast food - -
- Middle Eastern fast food 0.7 3.6
-- Chained Middle Eastern fast food - -
-- Independent Middle Eastern fast food 0.7 3.6
- Asian fast food 3.1 16.4
-- Chained Asian fast food - -
-- Independent Asian fast food 3.1 16.4
Source: Official statistics, trade associations, trade press, company research, trade interviews,
Euromonitor International estimates
Moreover, the results of the field research show that these prospects can be realistic
due to the high potential and likeliness of fresh and healthy food.
Chart 4 Like quick and healthy food (Based on the survey)

33
Even though there are some respondents in Århus, Vejle and very few in Horsens,
who do not like quick and healthy food, the forecast and the general trend are
supported by the field research. Subway is suggested as being the healthiest fast
food chain after Sunset Boulevard. This opinion offers high potential since the
Subway chain has not yet the same degree of awareness in Denmark, as can be
seen in the following graph according to the field research.
Chart 5 The most healthy fast food chain and knowing Subway (Based on the survey)
Once established and having the same knowledge as the market leader in the
sandwich fast food genre, Subway might be able to catch up many market shares

34
within the next few years, as the trend will help the chain to develop successfully
within the Danish fast food market.
4.4 Macro environmental factors
Subway in Denmark operates in a macro environment of forces and trends that shape
opportunities and pose threats. These macro environmental forces will be described by
analyzing the macro environment by using McKinsey‟s PEST analysis. Referring to the
delimitations, the technological factors will not be considered.
(Marketing teacher, PEST Analysis 2009)
4.4.1 Political Environment
Political life in Denmark is orderly and democratic. Political changes occur gradually
through a process of consensus, and political methods and attitudes are generally
moderate.
A report from the World Bank "Doing Business in 2004, Understanding Regulation"
reveals that Denmark is in a class of its own regarding costs associated with
establishing new businesses. The report charts barriers to operating businesses in
130 countries, of which Denmark is the only one where formal permission to open a
business is free of charge. (Doing Business 2004)
4.4.2 Economical Environment
All businesses are affected by national and global economic factors. The climate of
the economy dictates how consumers, suppliers and other organisational
stakeholders such as suppliers and creditors behave within society.
As the economy is in a recession due to the financial crisis right now, it has the
impact on the potential customers that they generally have less money to spend.
Due to that fact, people might tend to keep the money in their pockets and cut down
on expenses in their everyday life. One consequence may be that they reduce or cut
down on restaurant visits. That can be seen as an advantage that they reduce visits
to more expensive restaurants and instead visit less expensive fast food chains. In
that an opportunity would arise for fast food chains like Subway. People do not want
to renounce totally to go out for lunch or dinner and therefore they might choose

35
more affordable places. Besides that, compared to other nationalities, Danes earn
quite a lot. As a result they are not so affected by the crisis and do not have to cut
down so much in their everyday life.
Population changes also have a direct impact on organisations. Changes in the
structure of a population will affect the supply and demand of goods and services
within an economy.
The unemployment rate in Denmark with its 2,3% (December 2008) is very low.
Denmark has one of the highest gross domestic product (GDP) per person in the
world. In the same way, Denmark has one of the highest per capita incomes in the
world as well as the European Union. (Denmark Unemployment rate 2009)
Therefore, people have more money to spend. As a result, there are more potential
customers for visiting fast food chains.
Denmark's fiscal position is among the strongest in the EU. Economic growth gained
momentum in 2004 and the upturn continued through 2006. After a long
consumption-driven upswing, Denmark's economy began to slow down in early 2007
with the end of a housing boom. This cyclical slowdown has been exacerbated by
the global financial crisis through increased borrowing costs and lower export
demand, consumer confidence, and investment. The slowing global economy cut
growth to 0.3% in 2008. Because of high GDP per capita, welfare benefits, a low Gini
index, and political stability, the Danish living standards are among the highest in the
world. A major long-term issue will be the sharp decline in the ratio of workers to
retirees. (Intertrust 2009)
4.4.3 Socio-Cultural Environment
The third aspect of PEST focuses its attention on social forces affecting attitudes,
interests and opinions. These forces shape who we are as people, the way we
behave and ultimately what we purchase. Within Denmark, people‟s attitudes have
been changing towards their diet and health in the past few years. They have
become very conscious about their health. As a result, Denmark is seeing an
increase in the number of people joining fitness clubs and a massive growth for the
demand of organic/healthy food. Besides this trend towards healthy food, there is

36
also a trend towards quick food as people work a lot and do not have so much time
for cooking.
Organisations must be able to offer products and services that aim to complement
and benefit people‟s lifestyle and behaviour. If organisations do not respond to
changes in society, they will lose market share and demand for their product or
service.
Denmark holds a number one position in the world when it comes to their happiness
index. Therefore, one can interpret that many Danes give importance to spending a
holiday in sunny destinations, hanging out with friends in cafes or restaurants and
having a relaxed lifestyle. (The Medical News 2009)
4.4.4 Demographical Environment
Denmark has a total population of 5,500,510 million (July 2009 est.) with a rate of
growth of 0.29% (2008). (The World Factbook Denmark 2009)
Age structure:
0-14 years: 18.1% (male 511,882/female 485,782)
15-64 years: 65.8% (male 1,817,800/female 1,798,964)
65 years and over: 16.1% (male 387,142/female 498,940) (2009 est.)
Birth rate and death rate
10.54 births/1,000 population (2009 est.)
10.25 deaths/1,000 population (2008 est.)
Ethnic groups:
Scandinavian, Inuit, Faroese, German, Turkish, Iranian, Somali
Languages:
Danish, Faroese, Greenlandic (an Inuit dialect), German (small minority);
English is the predominant second language

37
Religions:
Evangelical Lutheran 95%, other Christian 3%, Muslim 2%
Furthermore, the three cities in Midtjylland, which are analyzed, have a
population as follows:
Århus 239.865 (2009); Horsens 80.102 (2008); Vejle 50.213 (2008)
(The World Factbook Denmark 2009)
4.5 Attractiveness of the Danish fast food market
After analysing the Danish fast food market in the previous subchapters an idea
about the attractiveness can be formulated. The current market situation, as well as
the growth potential in correlation with the trends lead to an optimistic conclusion.
However, there are on the other hand some uncertain factors, like the slowdown in
the economy due to the financial crisis, as well as the rising cost prices and the
growth strategies of several chains, that might influence Subway‟s success in the
Danish fast food market.
Moreover, the forecasts of a growing fast food market and the active trend towards
healthy food will lead Subway to success. The growing market for sandwich and
bakery products will help Subway to grow into the market, as well as to steal some
market share from competitors like Sunset Boulevard. As long as the trend still has
some potential, and the general fast food market is increasing, the market fits to
Subway‟s approach.
As long as Subway‟s competitors have not processed the whole market by exploiting
the whole market potential, there are great prospects for a new sandwich bakery
chain.
5 THE QUESTIONNAIRE
The old questionnaire and the final questionnaire will be analyzed in this chapter.
This chapter is considered necessary because there were some questions which
needed changes.

38
5.1 Test of the questionnaire
The test of the questionnaire has been carried out to prevent mistakes and to see if
the questions cover all needed information. The questionnaire was handed out to
thirty fellow students. The test indicated that changes needed to be made in the
following questions, questions number 2, 3, 9, 10 and also personal data.
Question 2, “Do you know Subway”, was changed into “Do you know the fast food
chain Subway?” as the test showed, there was one person who did not understand
that “Subway” was referring to a restaurant chain. He thought it was the subway for
trains – an underground.
In the question 3, “Do you like it”, a box with “Don‟t know” was added due to the fact,
that a person did know the chain, but had never tried it. It was therefore necessary to
add this box as the person could not answer if he/she liked it.
Question 9, “Rate how important price / quantity discounts are”, was rephrased,
since the respondents understood the question quite differently. Some even thought
that it said “quality” and not “quantity”. They interpreted that the question meant,
“Rate the importance of the relationship between price and quality”, which was not
the actual intent of the question. Hence, the question was changed to “Rate how
important it is to get a discount when you buy more than one sandwich or soda”. The
rephrased question emphasizes that it is about discount offers on specific items.
The problem with question 10, “If subway is not your first choice, would you prefer it
if they had offerings concerning price and quantity discounts”, is quite similar to
question 9. Here the test persons also interpreted the question quite differently
which, in turn, affected the results. Some again mistook “quantity” for “quality”. As a
result of this, the question was rephrased to “If Subway is not your first choice, would
you prefer it if it had special offers on menus, on certain sandwiches or if you for
example buy two or more sandwiches?” As with question 9, the rephrased question
stresses that, what people need to answer is whether they would find Subway more
attractive if it offered discounts.

39
In the section of personal data a question about, whether the interviewed person was
a Danish citizen or not, has been added. Therefore, a pattern might be found in the
answers of for example foreign students. For instance, the research might show that
more non-Danish than Danish people know Subway.
5.2 The final questionnaire
The questionnaire was made to find out if there is a market for Subway in Denmark
and which city, Horsens, Århus or Vejle, would be a suitable place for a Subway
restaurant. There were 14 questions about customers‟ buying behavior, to buying
motives and personal data. Answers were collected from the three cities namely
Horsens, Århus and Vejle. There were around 300 respondents of which 55% were
women and 45% men. All kind of people were asked, from a pupil aged 13 to a
houseman aged 53. 90% of respondents were Danish.
A question of liking quick and healthy food was the first question of the survey. It was
used as an “ice-breaking-question” and to get people‟s attention. 95% of the
respondents said yes which was expected.
The second question was about knowing the Subway chain. The question was asked
to find out how popular the Subway chain is in Denmark and if people are aware of it.
Boys filling out the questionnaire

40
If the respondent answered yes, there was an extra question whether they like
Subway and its sandwiches.
A rating of healthy and unhealthy fast food chains was also demanded. The question
of the healthiest fast food chain was made to find out if consumers see the fast food
companies the way they do themselves.
One of the questions was asked to find out how often people go out to eat. This
question was asked to find out how many potential customers would visit Subway in
each of the three cities.
As it was mentioned before, in some countries Subway offers kids‟ meals. Kids‟
meals always include fresh fruits and juice, never soft drinks, and contain less than
500 calories. In Denmark, customers cannot order kids‟ meals. There were two
questions about children in the questionnaire. One question was if there should be a
menu for kids and the other one was if there should be entertainment for kids. These
two questions were asked to discover if people who took this survey would like to
have children offers in restaurants.
Many fast food chains offer customers different kinds of club cards and discount
coupons, so does Subway. One part of the questionnaire was to find out how
important it is to customers to get discount when buying more than one sandwich or
drink and what they think about special offers for example the meal of the day. For
most of the people who took this questionnaire getting discount is important which
was expected. In Subway resraurants customers can collect a different amount of
stamps or stickers to get a free sandwich, drink, cookies etc. That is one way to gain
customer loyalty. Of course good food and friendly service are also needed. There
was also a rating question about the most important factors in fast food chains.
People had to rate food quality, food delivery, atmosphere, service, price and
opening hours from one, less important, to six, the most important. This question
was made to find out which factors people think are the most important ones.
It was also required to choose between Sunset Boulevard and Subway. Like it was
said before, Subway is not so well known in Denmark and it does not have many
supporters among the people, who took this questionnaire. Sunset Boulevard can be
found all over Denmark, also in Horsens, Århus and Vejle whereas Subway can be

41
found only in two cities. Moreover it was asked, if customers would visit Subway in
their own city to find out if Subway attracts people.
6 COMPETITIVE SITUATION
In this chapter, the competitive situation will be discussed. First, there is going to be
an overall look into the competitors and the market and after that a more specific
look into the three biggest competitors. This chapter is necessary to see how strong
the competitors are and if it is profitable to set up a Subway restaurant in the Danish
market. In addition, the marketing mix is going to be discussed. As the delimitations
describe, price and distribution are not included. The conclusion presented here will
be explained in the following paragraphs.
6.1 Main competitors
Three main competitors were chosen to be analyzed more closely since they are
considered to be the biggest threat. These three are McDonald‟s, Burger King and
Sunset Boulevard. Like Subway, they all are conceptual fast food chains. In addition,
all three have a considerable market position in Denmark. Obviously, there are many
more competing within the fast food industry. Some other big players in the Danish
market are Statoil, Shell and YX, which have the highest number of outlets and a fair
share of the fast food market. However, these three are not considered to be as big
of a threat since their business concepts are quite different from other fast food
chains. Surely, they also serve the fast food market, but to some extent other
customer segments. For instance, a family of four would often be seen at for
example Burger King, but it would be a somewhat rare sight to see the same family
eating together at the local gas station. Bearing this in mind, it can be argued that
McDonald‟s, Burger King and Sunset Boulevard are the most direct competitors
since they resemble Subway the most. For this reason, they will be looked at in
greater detail.
As shown on appendix seven, in 2007 McDonald‟s had with its 22 % by far the
highest market share of the fast food market. It had sales of DKr. 1,655 million from
its 83 outlets. At the same time Burger King had sales of DKr. 244 million which was

42
equal to 3 % of the total market. This sale was reached through only 15 outlets.
Burger King outlets are expected to rise in the future as their main franchisee,
Cresco Food, has announced that 5-10 new outlets will open every year in the
upcoming years. Also in 2007, Sunset Boulevard reached sales of DKr. 244 million
which is almost as much as what Burger King accounted for. Sunset Boulevard had
27 outlets at the time. These figures show that Subway‟s three main competitors
together held a market share of 28 % in 2007. The relatively low market share of the
three combined indicates that the Danish fast food market is characterized by many
players who, apart from McDonald‟s, all hold a relatively small percentage of the total
market.
Looking at the above figures, what shines through is that McDonald‟s by far
outperforms any of its competitors when it comes to total sales and thus market
share. This indicates that there is a strong preference for McDonald‟s. The
information gathered from the questionnaire indicates the same as the following will
show:
In Vejle 35 out of 99 people (35 %) prefer McDonald‟s
In Horsens 35 out of 99 people (35 %) prefer McDonald‟s
In Århus 20 out of 101 people (20 %) prefer McDonald‟s
In total 90 out of 299 people (30 %) prefer McDonald‟s
To compare the preferences for the other fast food chains, including Subway, will be
gone through similarly. All the following results can be extracted from the field
research done in Vejle, Horsens and Århus.
Firstly, Burger King will be considered:
In Vejle 30 out of 99 people (30 %) prefer Burger King
In Horsens 12 out of 99 people (12 %) prefer Burger King
In Århus 23 out of 101 people (23 %) prefer Burger King
In total 65 out of 299 people (22 %) prefer Burger King

43
Next, Sunset Boulevard will be looked at:
In Vejle 24 out of 99 people (24 %) prefer Sunset Boulevard
In Horsens 30 out of 99 people (30 %) prefer Sunset Boulevard
In Århus 24 out of 101 people (24 %) prefer Sunset Boulevard
In total 78 out of 299 people (26 %) prefer Sunset Boulevard
Lastly, the results for Subway will be considered:
In Vejle 6 out of 99 people (6 %) prefer Subway
In Horsens 20 out of 99 people (20 %) prefer Subway
In Århus 9 out of 101 people (9 %) prefer Subway
In total 35 out of 299 people (12 %) prefer Subway
As can be seen, all three competitors hold a high share of mind – a share which in
every case is considerably higher than Subway‟s. However, many factors have to be
taken into account when looking solely at this. For instance, Subway is generally
neither well-known nor well represented in Denmark as there are only two
restaurants in the market at the moment.

44
6.2 Strength of the competition
To assess the competition within the fast food industry, an analysis of Porter‟s five
forces will be used.
Porter’s five forces model
4-8
Market
Competitors
Intensity
of rivalry
New entrants
Suppliers Buyers
Substitutes
Market levelIndustry level
Figure 2 Porter's five forces model (QuickMBA Porter‟s five Forces 2009)
Market competitors:
As previously stated, there are numerous competitors within the industry that greatly
vary in size. The intensity of rivalry is rather fierce as the supply more than matches
the demand. This means that a potential customer can choose from numerous
options, whether it be a burger at McDonald‟s, a sandwich at Sunset Boulevard or a
hotdog at the local hotdog stand. The slowdown in market growth is also a factor that
serves to increase the intensity of rivalry since companies often have to fight over
the same customers. Euromonitor indicates in its report that Burger King expects to
steal customers from primarily McDonald‟s as they open new outlets. This indicates
that franchises such as these two are fierce rivals that to a large degree fight over
the same customers.
Suppliers:
Since Subway is one of the largest franchises in the world, it should hold a
considerable bargaining power in relation to its suppliers. It is able to set demands

45
on suppliers to comply with, and due to its many franchised restaurants, it can buy in
large volumes which makes a volume discount a possibility. Furthermore, there are
plenty of suppliers within the food industry so it would not be a major problem for
Subway to change supplier if deemed necessary. This serves to decrease the
bargaining power of the suppliers even further. Overall, suppliers are no immediate
threat in any way since Subway to a large extent can dictate demands and threaten
with switching to another supplier if they do not comply with specific demands. The
upside as a supplier, however, is that Subway needs to make sure that the potential
suppliers can live up to its standards. This means that a decision to switch to a
different supplier would not be taken lightly.
Buyers:
Generally, consumers rarely hold a very high bargaining power. In this case, their
bargaining power is limited to the possibility of choosing other restaurant to satisfy
their needs. If you are not satisfied with one option, you can go with the next. This is
the case since many suppliers of fast food exist.
Substitutes:
There are many substitutes for eating fast food such as eating fruit, preparing food at
home or fine dining. However, apart from grabbing for example a banana, these
options would probably consume more time than if one chose to order a sandwich,
hotdog or burger. In this case, substitute attractiveness would depend on the buyer‟s
willingness to substitute, meaning if the consumer is willing to buy some fruit instead
of a sandwich. The attractiveness will also depend on the relative price and
performance of the substitutes. For instance, do you feel as satisfied eating a
banana as you would have if you had eaten a burger instead?
Alternatives to fast food do not necessarily pose a threat, but instead they might
actually serve an opportunity since you can take better of two worlds and combine
them. This could be for example combining healthiness with swiftness which some
already have done.

46
New entrants:
It is very easy for someone to start up his own fast food business. The entry barriers
are quite low. Capital required for setting up a fast food business is relatively low
depending on the size of it. Many fast food suppliers, whether they are grill bars,
hotdog stands, kebab houses or bakeries, are privately owned and thus serve to
prove the point that it is not that difficult to set up one‟s own business within the fast
food industry. However, the success of these businesses naturally varies
significantly.
In conclusion, the fast food industry is characterized by having many small and large
businesses. As there are many suppliers, the competition within the industry is
fierce. Especially the larger franchises compete heavily to win over each other‟s
customers. The forecasts about a slowdown in market growth can be expected to
increase the intensity of rivalry even further.
6.3 Competitor analysis
Product
Competitors like McDonald‟s and Burger King have many similarities in their menus
for example french fries, burgers, salads and drinks. Taking a closer look at Sunset
Boulevard, it can be noticed that they offer healthier products to the customers, for
example smoothies instead of milkshakes or sandwiches instead of hamburgers.
Furthermore McDonald‟s and Burger King offer some special burgers/menu for
children same as Sunset Boulevard. For the children there are additional toys in all
the three competitors. For an overview look at table four.

47
Table 4 Competitors' product offerings (Burger King Menu and Nutrition 2009,
McDonald‟s Menu 2009, Sunset Boulevard Maden 2009)
Burgers
Children
Special burgers
Drinks
Fries
Salad
Desserts
Mc Donald’s
Big Mac McFeast Quarter Pounder Mc Chicken Hamburger Cheeseburger Filet-O-Fish Mc double Mc chicken junior Chicken „N bacon Big tasty junior Grilled chicken foccacia Chicken Nuggets (4, 6, or 9) Red hot chicken wings
Happy Meal
(Cheeseburger/ Hamburger/ Chicken nuggets +french-fries+ drink) + toy
Little Tasters
Little Mexican Chicken Fajita Wrap
Coca-Cola Coca-Cola light/zero Sprite zero Fanta Apple/Orange juice Spring water Milk Ice water Ice tea Café Espresso Double espresso Cappuccino Café latte Tea
Small Medium Large
Grilled Chicken Caesar Salad Crispy Chicken Caesar Salad Tuna Salad Greek Salad Side salad
Mc flurry Sundae Waffles Mc Donut Triple chocolate muffins Cinnamon bun
Burger King
Burgers
Whopper Double whopper Triple whopper Whopper jr. Steakhouse burger Loaded steakhouse burger Double hamburger Cheeseburger Double cheeseburger BK stacker Sandwiches Chicken sandwiches
Cheesybacon tendercrisp
Tendercrisp Spicy chick‟n crisp Tendergrill original
Hamburgers
Hamburger Cheeseburger Double hamburger/ cheeseburger Chicken Crown shaped chicken tenders French fries Soft drinks Apple juice Orange juice Chocolate low fat milk Low fat milk + toy
-BK veggie -BK big fish -BK chicken fries -Cheesy bacon -BK wrapper
Coca-Cola Coca-Cola light/zero Fanta Sprite zero Carlsberg sport Milk Orange/ apple juice Chocolate low fat milk Low fat milk BK joe Mocha BK Jou iced coffee Ice tea Nestle pure life purified water.
Small Medium Large
Tendercrisp garden salad Tendergrilled garden salad Side garden salad
Muffins (chocolate/ blueberry) Donuts (vanilla/ chocolate) Soft ice Milkshake Bkool (chocolate& caramel/ strawberry cheesecake)

48
Sunset Boulevard
Sandwiches Turkey filet with spicy paprika and bacon Ham with salami and Spanish chorizo Chicken Roast beef Ham Grilled Sandwiches Classic sandwich with chicken and bacon Classis with ham and cheddar cheese Xtra Exotic Italian Beef and Chili Snackwich
Fresh for kids meal: (a sandwich with tuna, chicken breast, ham or salami heated grilled snackwich+ sliced apples/ raisins/ strawberry yogurt+ 1% low fat milk, 2% chocolate milk, or a 100% juice)
+ toy
-
Pepsi Pepsi Max 7-up Mirinda Faxe Kondi Light Tropicana Spring water Milk Café Café au lait Espresso Cappuccino Hot chocolate Smoothies (Mango& apple/ Raspberry& Blue berries/ Strawberry& banana)
Small Medium Large
Caesar salad Pasta salad
Fruit salad Yoghurt Cake
Place
Place is also known as channel, distribution, or intermediary. It is the mechanism
through which goods and/or services are moved from the manufacturer/service
provider to the user or consumer.
McDonald‟s:
McDonald‟s gives careful consideration to the placement of its restaurants. The
construction of a McDonald‟s restaurant costs millions of dollars, and in order for the
operation to be profitable, placement must be in an area that maximizes the
customer exposure, there is always a McDonald‟s “right around the corner”.
McDonald's has its own supplier for distributing its products; the company uses only
a single channel, the McDonald‟s restaurants and McDrive‟s. These restaurants
(>30.000) are located in 119 countries all over the world. For example, in Denmark
restaurants are situated in airports, big cities and highways. Furthermore,
McDonald's is not using intermediaries they are serving directly to the customers.

49
(McDonald‟s Our story 2009)
Burger King:
Burger King distributes their products through the restaurants they own all over the
world. The restaurants can be found in airports, cities and highways, where people
can easily enter the restaurant for a quick snack, having lunch or dinner with friends
or family.
(Burger King 2009)
Sunset Boulevard:
Sunset Boulevard is slightly different from McDonald‟s and Burger King, namely they
offer healthier products. The sandwiches will be served in the Sunset Boulevard
restaurants, which are situated mostly in the big cities, but customers can also find
them in airports and train stations.
(Sunset Boulevard)
Comparing the numbers of restaurants and inhabitants in the three cities, the
following can be concluded:
Burger King is not situated in Vejle.
Vejle compared to Horsens: Vejle has less inhabitants per McDonald‟s than
Horsens does, Sunset Boulevard is showing the same results.
Århus is the biggest city (303.107 inhabitants), and counts only three
McDonald‟s.
This means each McDonald‟s counts for 101 035 inhabitants. Let‟s take a
closer look at the other cities. In Vejle there are 2 restaurants, every
McDonald‟s is good for each 52.943 inhabitants and Horsens for
approximately 80.102 inhabitants per restaurant. .McDonald's is from all the
three cities the most visible fast food chain.
Furthermore in every city there is one Sunset Boulevard.

50
Table 5 Nearby competitors (Horsens Kommune, Befolkninstal; Vejle Kommune,
Befolkning; Århus Kommune, Befolkning)
Vejle: Horsens: Århus:
105.884 (2009) inhabitants
Burger King: 0
McDonald's: 2
Sunset Boulevard: 1
80.102 (2009) inhabitants
Burger King: 0
McDonald's: 1
SunsetBoulevard:1
303.107 (2009) inhabitants
Burger King: 1
McDonald's: 3
SunsetBoulevard:1
Promotion
As a general statement, it is fair and accurate to say that promotion is one of the
pillars of McDonald‟s, Burger King and Sunset Boulevard success. People recognize
McDonald's and Burger King everywhere, this because of their promotion
campaigns. The same counts for Sunset Boulevard, but this restaurant is only well-
known in Denmark. The fast food chains focus on an overall experience but the one
who probably does this the most is McDonald's.
Sales promotion
Sales promotion is all kinds of promotions except advertising, personal selling and
public relations for example the BOGOF promotion, Buy One Get One Free. Others
include couponing, money-off promotions, competitions, free accessories. For
McDonald's sales promotion consists of coupons with discounts and coin offers. For
example, buy two burgers and get discount on the second burger. Furthermore
McDonald's adds toys to the happy meals which are mainly for children. This is to
make them to visit McDonald's again. For example, children can collect all of the
characters of a specific TV show. Burger King and Sunset Boulevard are both
offering the same kind of children‟s menu with little presents and discount coupons.

51
Advertising | brand globally act locally
Advertising is a 'paid for' communication, and it is used to develop attitudes, create
awareness and transmit information in order to gain a response from the target
market. McDonald's creates awareness through television commercials, highway
billboards and commercials in movie theaters. McDonald‟s knows that their
target market largely consists of families, who often need an affordable way to dine
out with the children. Because of this fact McDonald‟s invests a lot in advertising
towards children. The promotion that McDonald‟s utilizes takes many forms and has
developed over the years, for example Ronald McDonald, happy meals and
playgrounds. The Ronald McDonald character brings smiles to the faces of “children
of all ages” and make them feel at home. Another marketing tool that McDonald‟s
has used well is product placement. This means having McDonald‟s products and
logos clearly visible, such as people eating at McDonald‟s in TV shows. The same as
McDonald's, Burger King and Sunset Boulevard have commercials through television
and billboards. Burger King has the mascot “the Burger King” and Sunset Boulevard
has the mascots Sille and Sebastian for children. Another promotional tool that
McDonald‟s has used is the promotion of “healthy” menu items such as salads, fruits
and yogurts. If the traditional McDonald‟s customers‟ eating habits have changed,
the menu has to be changed as well.
6.4 Conclusion of the competitive situation
By taking a closer look at the Danish fast food market, there can be pointed out three
main competitors for Subway, namely McDonald's, Burger King and Sunset
Boulevard. These competitors together had a market share of 28% in 2007. There
are several fast food players in the market with many different sizes. In addition, the
research shows that people prefer McDonald's above the other three fast food
chains.
With the Porter‟s five forces in mind, it can be said that there is a strong market
competition due to the slowdown of the market growth. The fast food chains are
trying to win customers because there are a lot substitutes. Due to this fact, the

52
buyers (customers) have a strong position. Furthermore, for new entrants the entry
barriers are low since start-up costs can be relatively low.
The fast food chains are using the restaurants to bring the products to the
customers. These three competitors offer also menus for children and in addition,
Burger King, McDonald‟s and Sunset Boulevard are offering discount coupons.
Furthermore, Sunset Boulevard is only well-known in Denmark. The fast food chains
are creating awareness besides that McDonald‟s advertises a lot towards children.
7 THE CUSTOMERS
The following chapter describes Subway‟s customer buying behavior as well as its
target group. Afterwards the results of the field research will be analyzed and lead
into the marketing mix.
7.1 Buying behavior
Knowing the customers‟ buying behavior is a huge advantage. This chapter will
describe how Subway‟s customers might act during their buying process, by using
the 5-stages model of the consumer buying process.
Roles in the buying process:
Consumers are able to act in five different roles during a buying process.
Sometimes, different people act in these roles and sometimes only one person
covers all.
The five roles are:
Initiator: Communicates a purpose
Influencer: Makes suggestions and communicates opinions
Decision maker: Says what will be bought when and where
Purchaser: Executes the buying
User: Uses the product or the service
(Hollensen 2003, 144)

53
In complex buying decision, often many people act in different roles. The more
habitual the product is, the less people will take place within the roles. For example
buying a car often assumes different aspects, with different role players within the
buying process. Nevertheless, even in low-involvement buying‟s, each role will be
covered.
Buying decision process
Researchers found out, that customers go through a five-stage decision-making
process in any purchase. Considering this process is mandatory for marketers,
because it covers more than only the buying decision. Each customer passes
through the following five stages:
Figure 3 Buying decision process (Tutor2u 2009)
(1) Need recognition and problem awareness
Each buying process starts with a need, triggered by external or internal stimuli. In
the case of Subway, the internal stimuli will mostly be identified as hunger, whether
the external stimuli can be caused due to each kind of marketing (for example mass
media: TV, Radio etc.), or the cognition of a smell. (Hollensen 2003, 118-123.)

54
(2) Information search
The aroused customer will start to search more information to compose his need.
There are two different stages of arousal. The first and milder stage is a demanded
invigilation. In this stage, the customer is very comprehensive for information. During
a walk through the city, a customer in this phase will draw strong attention to food-
advertisement. The second and stronger stage is the active information search.
Customers within this phase search very actively, where they can fulfill their needs
(catch some food). (Hollensen 2003, 118-123.)
The information about fulfilling the need can be gained from different sources for
example, personal sources (family, friends), commercial sources (advertising, posters,
and flyers) public sources (mass media) and experimental (using the product). The
biggest amount of sources is obtained by commercial sources whether the independent
public and personal sources are more effective. (ibid. 118-123.)
Furthermore, while gaining information, the customer is only able to focus on the food, of
his choice, which is available. As the following graph shows, gaining information about
fast food is limited to the awareness. In the following example, the chain Pizza Hut is not
located in the customers‟ city. For this reason, he has to choose his preference between
the remaining food stores.

55
Figure 4 Awareness tree
Although there is a Burger King available, the customer is not in the mood to eat this
kind of fast food. Continuing from the processed set the customer has to make his
first (consideration set) and second (Sunset Boulevard) preference, while
McDonald's has been rejected. According to Subway‟s statement on their website
“The goal of the chain's current advertising campaign is to increase the brand
presence in the consumers‟ "consideration set"--that is, which fast-food restaurants
consumers consider when deciding where to eat.” This graphic shows an example
of how customers‟ information research during the buying process of fast food and
how it can take place and affects their buying behavior.
(3) Evaluation of alternatives
The next step is the cognitive process valuation, about the product and offers. The
consumer anticipated advantage convenience of one product. The review of the
Total set
Burger King, McDonald’s, Sunset
Boulevard, Subway, Pizza Hut
Awareness set
Burger King, McDonald’s,
Sunset Boulevard, Subway
Unawareness set
Pizza Hut
Processed set
McDonald’s, Sunset
Boulevard, Subway
Foggy set
Burger King
Consideration set
Subway
Hold set
Sunset Boulevard
Reject set
McDonald’s

56
advantages will be based on personal experience, the brand image and the weighing
of the product characteristics. (Hollensen 2003, 118-123.)
(4) Purchase decision
Previous purchasing decisions often sub decisions must be made concerning brand,
dealer, quantity, payment method and timing and risk avoidance. Because the fast food
industry covers only low-involvement purchasing, the risk avoidance factors will not be
considered.
However, two more factors can influence the buying process between the purchasing
purpose and the purchasing decision.
Positive or negative approach of a third
For example a customer of the target food stores complains that he did not enjoy his
meal; a visitor of another food restaurant (possibly hold set) says, that they have very
good offerings
Unforeseen events
Due to lack of money the customer might have to choose a cheaper restaurant; the
customer meets a friend who invites him to a dinner. (Hollensen 2003, 118-123.)
(5) Post purchase behavior
After buying the product, satisfaction or dissatisfaction will arise. This dements on what
has been suggested from the products and the actual outcome. Even if the customer
was enjoying the Subway sandwich during the stay in the restaurant, other criteria like
interior, cleanliness and service of the restaurant can influence his or her opinion. Even
afterwards, while leaving the restaurant satisfied, the frame of mind can change when
seeing a comparable offer for a lower price, at a competitor‟s restaurant. Awareness of
the fact that dissatisfaction leads into more communication than satisfaction, is
mandatory. Due to the word of mouth and opinion leaders, dissatisfaction in post
purchasing should be prevented due to after sales service customer hotlines and quality
guarantees. (Hollensen 2003, 118-123.)

57
Involvement:
The fast food industry and the offered products do not obtain high involvement like for
example the market of racing cars. This has two reasons. To buy fast food, the customer
must not be aware of any technical knowhow and does not have any risk (besides
several diseases which might occur when eating too much fast food) when choosing the
wrong product (meal). The price level is compared to other products, low. These factors
make the decision making process (with information research) not relevant compared to
high technical or high price products.
However, selling low-involvement products should be done by adding emotional and
cognitive aspects. Brand identity, image and how the customer can identify with the
brand are very important. Due to this, it is mandatory to define the right target group and
adjust the marketing mix to the target group‟s needs.
7.2 Target group
The total market is often too big that not all consumers could be reached. For this
reason a segmentation of the market, which means to make a selection of the
relevant target group, is necessary. The first step is market segmentation, the
classification of the market into a well-defined target group. The second part will be
definition of the target group, which includes the specification, and choice of the most
attractive market segment.
Segmentation is essentially to the identification of subsets of buyers within a market
who share similar needs and who demonstrate similar buyer behaviour. The market
can be segmented into four criteria which are geography, demography,
psychographics and behaviouristic. (Hollensen 2003, 313.)
Geography:
Nation: Denmark
Region: Jutland
City: Horsens, Vejle, Århus
District: City centre

58
Demography
Age: 15-39
Gender: Both, but generally more men visit fast food chains as
they like quick food; Health and fresh food is more
important to women
Family life cycle: Single young adults leave home, singles, young couples,
young children (<3 years), young couples with older
children (<16 years), young couples without children
Socioeconomic factors:
Education: Relevant, because educated people make a point on high
quality products
Occupation: Pupils, students, young professionals, employees, self-
employed, housewives/housemen
Income: Income does not play a big role in this case; therefore, all
Subway meals are relatively cheap
Nationality: Mainly Danes, but in Horsens and Århus also many
international customers, because of the universities
exchange programs in both cities.
Religion: Religion is irrelevant. It would be important for Islamic
countries, where many people do not eat all kinds of meat.
Psychographics:
Attitude: Wellness- and health-trend; trend to quick food, because of
career orientation

59
Value: “Dobys” (daddy older, baby younger)
“Yuppies” (young, upwardly mobile, urban professionals
“Global kids” (affect parents‟ buying-decision)
“Skippies” (school kids with income and purchasing
power)
“Yiffies” (young, individualistic, freedom minded, and few)
Value and Lifestyle: “Experiencers” (young, enthusiastic, impulsive)
“Actualizers” (successful, educated, active)
“Achievers” (successful, career-orientated)
Behaviouristic:
Occasions: Breakfast, lunch break, dinner, take-away, events
Benefit: Satisfy hunger and thirst, enjoyment, health, flavour, fast,
convenient
Use of media: Internet, print, radio, TV
Price behaviour: Bargain hunter, smart shopper, quality product shoppers
Shopping destination: Shopping streets, shopping centres, train stations
Usage status: Former users, potential users, first-time buyer, users of
competitors
Usage rate: Light users, heavy users
(Runia, Wahl & Geyer 2007)
Brand loyalty: Shared brand loyalty: Brand loyalty for two brands, for
example Subway and McDonald‟s
Migrating brand loyalty: changing brand loyalty to other
brands
60
Targeting includes the specification and choice of the most attractive market
segment as well as other relevant sub segments. The definition of the target group is
based on the questionnaire results and the previous segmentation.
The two main target groups of Subway:
Trendy Danish students and pupils with strong brand preferences, who want to enjoy
quick and low priced food with their friends in their free time.
Singles, aged 26-35, young professionals and employees who read daily
newspapers and are career orientated with hedonistic lifestyle and strong focus on
own appearance. They do not have the time or do not want to cook only for
themselves and prefer fast but healthy food.
Besides the two main target groups, the other segments which have been defined in
the segmentation part are relevant. The marketing activities will be focused on the
two main target groups.

61
7.3 Data analysis
The following chapter is an analysis and evaluation of the processed field research
with the aim to find the most attractive location for Subway‟s market penetration in
Denmark considering the cities Horsens, Århus and Vejle.
7.3.1 Horsens
The healthiest fast food chain
Overall Subway is seen as the healthiest fast food chain after Sunset Boulevard,
which has a higher awareness level according to its market share. Two-third of the
respondents know Subway, which is a high number regarding the company‟s limited
presence in Denmark.
Chart 6 Horsens: The most healthy fast food chain and know Subway

62
Popularity of Subway
Generally, the age groups 19-25, 26-35 and 36-49 of the male and 0-18, 26-35 and
50 and older of the female respondents like Subway the most.
Chart 7 Horsens: Like Subway
Subway or Sunset Boulevard
Only the age groups 19-25 and 26-35 of the male and 26-35 and 50 and older of the
female respondents prefer Subway to Sunset Boulevard.
Chart 8 Horsens: Subway or Sunset Boulevard

63
Visit Subway
Except of the respondents male 50+ and female 36-49, the majority of all other age
groups would visit subway if it is located in Horsens.
Chart 9 Subway in Horsens
Favorite fast food chain
More than 35% of the age groups of the males 36-49 and females 26-35, 36-49 and
50+ consider Subway as their favorite fast food chain.
Chart 10 Horsens: Favorite fast food chain

64
If they do not prefer Subway as their favorite fast food chain, more than two-third of
the male respondents in the age of 19-25, 26-35 and 36-49 would choose Subway if
it provides special offers. Even more than 80% of the female age groups 26-35 and
50+ would choose subway under appreciating special offers.
Frequency of consuming fast food
Nearly 60% of the males aged 0-18, 50% of the males aged 26-35, 40% of the
females aged 0-18 eat fast food weekly. Within these age groups, the remaining
respondents consume fast food monthly.
Chart 11 Horsens: How often
Discount importance
The groups male 0-18, 19-25 and female 0-18 consider discounts as very important.
Moreover, discounts are seen as very important to important in the age groups male
and female 26-35, 36-49. The discounts can be determined less importance in the
age group 50+.

65
Chart 12 Horsens: Discount importance
Kids’ menu and entertainment
Most of the respondents give importance to children‟s menus offered by fast food
chains. Even 100% of the age group 36-50+ agree.
Chart 13 Horsens: Kids' menu and entertainment
Generally, females see kids‟ entertainment as important. This approach rises with
the age. All male respondents besides the age group 19-25 (only 20%) share this
opinion with more than 50%.

66
7.3.2 Vejle
The healthiest fast food chain
In the age group 0-35 of female and male respondents, Subway is seen as the
second healthiest fast food chain. According to the question “Do you know Subway?”
the age group 36-50+ did not know the chain and therefore cannot say if it might be
the healthiest or not.
Chart 14 Vejle: The healthiest fast food chain and know Subway
Popularity of Subway
Generally, the age groups 0-18 and 19-25 of the male and 0-18 and 19-25 of the
female respondents like Subway the most.
Chart 15 Vejle: Like Subway

67
Subway or Sunset Boulevard
The age groups 0-18 and 19-25 of the male and the age group 19-25 of the female
respondents prefer Subway to Sunset Boulevard. No preference for Subway at all
show the age groups 36-50+.
Chart 16 Vejle: Subway or Sunset Boulevard
Visit Subway
If the Subway was located in Vejle, almost all age groups would visit the chain. As
there are not many respondents in the female age group 36-49, only 50% of them
would visit the chain.
Chart 17 Subway in Vejle

68
Favorite fast food chain
Only 20% of the females aged 19-25 consider Subway as their favorite fast food
chain.
Chart 18 Vejle: Favorite fast food chain
If they do not prefer Subway as their favorite fast food chain, 100% of the male and
female respondents aged 0-18 and two-third of the male age groups 19-26 and 26-
35 would choose Subway if it provides special offers. The age group 50+ of the
males and the age group 36-49 of the females still would not choose Subway.
Frequency of consuming fast food
More than 60% of the males aged 19-25, 26-35 and females aged 0-18 eat fast food
weekly. The remaining respondents consume fast food monthly.
Chart 19 Vejle: How often

69
Discount importance
Females aged 0-18 consider discounts as very important. Moreover, discounts are
seen as very important to important in the age group male 0-18. Less importance to
unimportance to the discounts can be determined in the age group female 36-49.
Chart 20 Vejle: Discount importance
Kids’ menu and entertainment:
100% of the female respondents in the age of 36-49 and 50+ and of the male
respondents aged 50+ give importance to children‟s menus offered by fast food
chains. Besides that, 65% of the males aged 36-49 and females aged 19-25 see
kids‟ menus as important. 80% of the male respondents in the age group of 0-18 feel
the same way.
Chart 21 Vejle: Kids' menu and entertainment

70
Kids‟ entertainment is generally seen as not that important. However, more than 50%
of the males aged 26-35 and 36-49 and females in the age group 36-49 consider
kids‟ entertainment as important.
7.3.3 Århus
The healthiest fast food chain
All age groups consider Subway as the second healthiest fast food chain, aside from
most of the age group 50+ as they do not know Subway according to the research.
Chart 22 Århus: The healthiest fast food chain and know Subway
Like Subway
Generally, the age groups 0-18, 26-35 and 36-49 of the male and 50% of the female
respondents like Subway. The age groups 50+ do not like Subway, as they do not
know the chain.
Chart 23 Århus: Like Subway

71
Subway or Sunset Boulevard
Sunset Boulevard is more popular in all age groups, but the most potential can be
seen in these groups: male 0-18 (more than 50%), 26-35 (more than 35%), female
26-35 (nearly 40%), and 19-25 (nearly 30%).
Chart 24 Århus: Subway or Sunset Boulevard
Visit Subway
If the Subway was located in Århus, almost all age groups would visit the chain. In
the age groups male 50+ 50% would visit Subway and in the female age group 50+,
only one-third would visit the chain.
Chart 25 Subway in Århus

72
Favorite fast food chain
Only 25% of the males aged 0-18, more than 10% of the females aged 19-25, and
26-35 consider Subway as their favorite fast food chain.
Chart 26 Århus: Favorite fast food chain
If they do not prefer Subway as their favorite fast food chain, more than 80% of the
female respondents aged 36-49 and round about 70% of the male respondents aged
0-18 and 26-35 would choose Subway if it provides special offers. Generally, all age
groups would choose Subway when considering special offers, besides the female
age group 50+.
Frequency of consuming fast food
More than 70% of the female respondents‟ aged 0-18 and 50% of the male
respondents aged 26-35 and 36-49 eat fast food weekly. The remaining respondents
consume fast food mainly monthly.

73
Chart 27 Århus: How often
Discount importance
More than 70% of the females aged 0-18, males aged 0-18, and 36-49 consider
discounts as very important and important. Less importance and unimportance to the
discounts can be determined in the age group 50+.
Chart 28 Århus: Discount importance

74
Kids’ menu and entertainment
For 100% of the females aged 36-49 and 50+ and males aged 50+, Kids‟ menus are
seen as important. 65% of the females in the age group 26-35 consider this as
important too.
Chart 29 Århus: Kids' menu and entertainment
50% of the male respondents and 65% of the female respondents in the age group
50+ and less than 25% of the remaining respondents consider kids‟ entertainment as
important.
7.4 Marketing-Mix
Product
The product policy of the Subway chain is international by using global branding and
a corporate identity. Every franchisee in the world should offer the core product
portfolio. In Denmark, Subway has a core product range of 15. The product line is
defined through its various kinds of sandwiches (program depth) but it is very close
program bredth (mainly sandwiches).
Moreover, Subway positioned itself as the healthier alternative within the fast food
sector. As the Euromonitor trends research showed (compare Euromonitor
international, chapter 9.2 Trends), the upcoming wellness and healthiness is still
ongoing.

75
The survey results of the field research also determined that customers in each city
of the research expect food quality as the most important factor. This need to quality
food, fits to Subway freshness (slogan: “eat fresh”) approach according to the
Danes.
Chart 30 The most important factor
Promotion – Communication
There are different individual components of the promotion mix to increase the
awareness of the brand and its products. Furthermore, it is the goal to increase the
brand presence in the consumers‟s “consideration set”, to create a need, and to
motivate the customer to buy the product or service.
For Subway, it is necessary to create a Unique Advertising Proposition (U.A.P.) as
they are part of a saturated market. It is the goal to create a one-of-a-kind advertising
message. To generate an advantage in competition, a selling proposition has to be
created by connecting the advertising message with the product. (Hollensen 2003,
757)
There should be one main objective to the promotion campaign. Therefore, Subway
has to focus its message on tasty, but healthy food, which is prepared quickly and
freshly in front of the eyes of the customer. Besides that, this healthy food is
affordable for everyone.

76
The promotion of the chain must be clearly focused towards the identified target
groups, as each target group has different interests and therefore different
communication channels have to be applied.
The promotion must have the right impact on the customers to be the most effective.
Therefore, it is necessary to know where they spend their time and what would
attract their attention. These questions have been answered in detail when defining
the two main target groups in the previous chapter.
The function of the aspired communication can be described with the AIDA-Model.
Aida stands for attention (attract attention), interest (arouse interest), desire (create
need/desire) and action (initiate purchase). (Articlesbase)
Online marketing
One of the main target groups of Subway has been identified as teenagers and
pupils. As they spend their free time hanging out with friends, online communities
like Facebook or MySpace would fit very well to this segment. One opportunity is to
add banners with hyperlinks and/or pop-ups on the most popular websites for
teenagers. They could show the weekly/daily specials.
In addition, the website of Subway gives information on the chain, the products and
services. Another direct marketing tool is direct mail. When people register with their
email on the website, they will get weekly newsletters about new products, special
offers or coupons.
Media advertising
Advertising can also be done via national TV, radio and print. However, it is
important to keep in mind that TV advertising is very expensive and has to be
planned very carefully. Local radio and newspapers are a much cheaper ways to
advertise.
Advertising in newspapers with coupons can be a good opportunity. This
communication channel addresses to the businessmen, who read the daily
newspaper and to many other people also.

77
Sales Promotion
Sales Promotion is addressing the target audience at the Point of Sale (POS) using
temporary campaigns. There are different ways of sales promotion which can be
adapted to the Subway chain, for example BOGOF promotion which means buy one
get one free, coupons attached in newspapers, money-off promotions, sampling,
displays, tasting and customer bonus system with coupon stickers. (Hollensen 2003,
585-587)
The Subway Franchisee Advertising Fund Trust - SFAFT
SFAFT is a centrally controlled promotion pool, which directs the advertising and
other marketing activities of Subway, to increase the awareness of the brand and its
products. (Subway Studentguide National Advertising 2009)
SFAFT works independently of Doctor‟s Associates Inc., which is the franchisor of
the SUBWAY® business franchise concept. Part of the advertising fee each
franchisee has to pay according to the Franchise Agreement, is placed into a
national advertising budget. (Subway Studentguide National Advertising 2009)
SFAFT manages the promotion for each Subway chain, as it provides the
franchisees with advertising materials that are the most effective. These materials
include point-of-sale materials, public relation promotion, and advertising on TV. Of
course, each franchisee can make individual advertising in the local area, where they
are located. If they hire a local advertising agency, the principles and criteria of the
SFAFT have to be respected. (Subway Studentguide National Advertising 2009)
Place
Subways concept of purchasing is direct selling to the customer. The advantage of
direct sell is the direct contact with the customers. Changes according to the
customers' needs can be identified easier and then adapt to these changes, e.g.
demand for price changes or overall demand for the products. In addition, the
complete control over the product range and prices is another advantage.
According to the delimitations, the cities, which are analyzed, are narrowed down to
the three big cities in Jutland: Århus, Horsens, Vejle. These cities do not represent

78
Denmark. There might be other good locations for opening a Subway, but in Jutland,
these three cities are the biggest and the most attractive places.
According to this research these locations have pros and cons. That leads to the
decision which city provides the most potential.
Rating and conclusion
To conclude the outcome of the data analysis (see chapter 7.3 data analysis), the
following table will be used. The columns represent the three cities, which are
analyzed. The rows on the left side correspond to the questions of the field research.
The rating is made in the perspective of what is the best and worst for Subway.
Table 6 Rating of the best location for a Subway restaurant
Horsens Århus Vejle
The healthiest fast food chain
++ + -
Like Subway +++ ++ -
Subway or Sunset Boulevard
+++ - ++
Visit Subway ++ ++ +++
Favorite fast food chain
++ + -
Frequency of consuming fast food
++ - +++
Discount importance + - +
Kids‟ menu and entertainment
++ - +
Total 17+ 7+ 10+
The Rating is divided from “++” (the best), “+” (second best) and “-“(the worst)
according to the outcome of the particular question. In addition, the importance of the

79
questions has been considered as well. Therefore, the most relevant questions (red)
gain more weighting.
As the table shows, Horsens (17+) will be the most potential and attractive location
for opening a Subway restaurant. Both, Vejle (10+) and Århus (7+) provide
preferences, but are not able to compete with Horsens.

80
8 CONCLUSION AND RECOMMONDATIONS
8.1 Conclusion
Considering Subway as a franchising concept, the advantages rank the
disadvantages as more and more Subway restaurants have emerged. According to
this, the biggest advantages might be their trademark strength connected to their
global marketing and their sophisticated franchise system. The cost in terms of initial
start up fee and ongoing costs, as well as the risk transfer can be seen as
disadvantages of this system.
Many micro and macro environmental factors influence the Danish fast food market.
The most important threats that affect the macro environmental situation might be
the economic slowdown due to the financial crisis and the growth strategy of other
fast food chains. The current market situation, as well as the growth forecast of the
fast food market in correlation with the trends towards healthy food provide high
potential for Subway to enter the Danish market.
By taking a closer look at the Danish fast food market and Subway‟s main
competitors, McDonald‟s, Burger King and Sunset Boulevard which are holding a
total market share of 28%, it can be said that the competition is fierce. The three
competitors hold a high share of mind – a share that in every case is considerably
higher than Subway‟s. According to the field research McDonald‟s is the most
popular fast food chain followed by Sunset Boulevard and Burger King. Since
Subway is not well known and represented, there might be a huge potential for a
new sandwich chain as already 12% of the respondents would prefer Subway.
According to the results of the field research, two main target groups can be defined.
The first group consists of trendy Danish students and pupils with strong brand
preferences, who want to enjoy quick and low priced food with their friends in their
free time.
The other group is made up of singles aged 26-35 who are career orientated with
strong focus on one‟s own appearance. They do not have the time or do not want to
cook only for themselves and prefer fast but healthy food.

81
The promotion of the chain must be clearly focused towards the identified target
groups, as each target group has different interests, therefore different
communication channels have to be applied. The advertising goal is to increase the
awareness of the brand and its products and to create a need. Subway has to focus
its message on tasty but healthy food, which is prepared quickly and freshly in front
of the customers.
Furthermore, the field research and the interpretation of the results pointed out that
comparing the three cities Århus, Horsens and Vejle, the most attractive place to
open a Subway restaurant is Horsens.
8.2 Recommendations
According to the conclusions, which have been described in the previous chapter,
the analysis lead into important recommendations, which can be used as a practical
plan of action for Danish entrepreneurs, who like to start up their own Subway
restaurant in Denmark.
Subway‟s franchising concept offers the franchisee many advantages. The
worldwide brand recognition and the slogan “eat fresh” is a benefit for every Subway
restaurant. Subway offers the franchisee all kinds of support, for example site
selection, restaurant design, equipment ordering. The present analysis offers a huge
advantage to find the right location, but also covers useful information about the
main competitors, the market and the target group. Furthermore, much information
can be assigned for other cities in Denmark.
According to the Danes‟ cosmopolitan nature and their health awareness, Subway‟s
fast food concept can be very successful. Franchisees should stress the brand
differences of their Subway restaurant by communicating their UAP, and how
Subway distinguishes from the main competitors. As they are part of a saturated
market, it is the goal to create a one-of-a-kind advertising message. To generate an
advantage in competition, a selling proposition has to be created by connecting the
advertising message with the product. There should be one main objective to the
promotion campaign. Therefore, Subway has to focus its message on tasty, but

82
healthy food, which is prepared quickly and freshly in front of the eyes of the
customer.
To get into the market, promotion activities according to the customers‟ expectations
like menu specials, free drinks and other performances should be considered, as a
tool to get awareness.
As discount importance and kids‟ menu and entertainment are seen as very
significant in the cities Horsens and Vejle, it is recommended to adjust the marketing
mix to the customers‟ preferences.
One of the main target groups of Subway has been identified as teenagers and
pupils. As they spend their free time hanging out with friends, online communities
like Facebook or chatting on the internet, online marketing would fit very well to this
segment. One opportunity is to add banners with hyperlinks and/or pop-ups on the
most popular websites. They could show the weekly and daily specials or promote
the opening event.
Due to the slowing down economy and fast food market growth, the conditions might
seem demanding. However, using this challenge as an opportunity to sell “quick and
healthy food” can lead entrepreneurs to good achievements. The upcoming and still
ongoing wellness and healthiness trend should be used as a steppingstone.

83
REFERENCES
Articlesbase. The AIDA Marketing Model 2009 http://www.articlesbase.com/printing-articles/the-aida-marketing-model-825021.html (Accessed on 20 October 2010)
Burger King Company Info http://www.bk.com/en/us/company-info/index.html (Accessed on 4 May 2009)
Burger King Menu and Nutrition 2009 http://www.bk.com/en/us/menu-nutrition/index.html (Accessed on 3 May 2009)
Denmark Unemployment rate 2009 http://www.indexmundi.com/denmark/unemployment_rate.html (Accessed on 20 May 2009)
Doing Business 2004 Understanding Regulations http://www.doingbusiness.org/Reports/Doing-Business/Doing-Business-2004 (Accessed on 15 May 2009)
Hollensen. 2003. Marketing management. A Relationship Approach. Financial Times/ Prentice Hall (2004) (Accessed on 26 October 2010)
Horsens Kommune. Befolkningstal 2009. http://www.horsenskom.dk/OmKommunen/Oekonomi/Budget2009/0Befolkningstal.aspx (Accessed on 17 May 2009)
Intertrust 2009. Denmark http://www.intertrustgroup.com/en/Our_offices/Denmark.aspx (Accessed on 22 April 2009)
Kotler & Keller. 2008. Marketing Management 13th edition 2008. Pearson Education. 318-328 (Accessed on 20 May 2009)
Kotler & Keller. 2008. Marketing Management 13th edition 2008. Pearson Education. 328 (Accessed 4 April 2009)
Marketing teacher. Introduction to Marketing Research http://marketingteacher.com/lesson-store/lesson-marketing-research.html (Accessed on 10 October 2010)
Marketing Teacher. PEST analysis. http://www.marketingteacher.com/lesson-store/lesson-pest.html (Accessed on 19 October 2010)
Marketing Teacher. SWOT analysis. http://marketingteacher.com/lesson-store/lesson-swot.html (Accessed on 14 May 2009)
McDonald‟s. McDonald‟s Menu 2009. http://www.mcdonalds.com/us/en/food.html (Accessed on 27 April 2009)

84
McDonald‟s.McDonald‟s Our Story. http://www.mcdonalds.com/us/en/our_story.html (Accessed on 28 April 2009)
Mindtools. The McKinsey 7S Framework. http://www.mindtools.com/pages/article/newSTR_91.htm (Accessed on 26 October 2010)
Qualitative vs. Quantitative Data 2010 http://www.regentsprep.org/Regents/math/ALGEBRA/AD1/qualquant.htm (Accessed 10 October 2010)
QuickMBA. Porter‟s five forces. http://www.quickmba.com/strategy/porter.shtml (Accessed on 14 April 2009)
QuickMBA. Porter‟s Generic Strategies. http://www.quickmba.com/strategy/generic.shtml (Accessed on 1 May 2009)
Runia, Wahl, Geyer. 2007. Marketing: Eine Prozess- und praxisorientierte Einfuhrung. Oldenbourg Wissenschaftsverlag GmbH. (Accessed on 10 March 2009)
Small Business Notes. The market research process 2010. http://www.smallbusinessnotes.com/operating/marketing/marketresearch/process.html (Accessed on 15 April 2010)
Subway Around the world. International SUBWAY ® Locations http://www.subway.com/subwayroot/Applications/Reports/CountryCount.aspx (Accessed on 18 October 2010)
Subway Brochure 2009. Support After You Open. Support Before You Open. Support The Franchisee is responsible for. www.subway.com (Accessed on 2 May 2009)
Subway Denmark. Om Subway http://subwaydanmark.dk/index.php?id=27 (Accessed on 18 April 2009)
Subway Department and Organizations 2009 http://www.subway.com/StudentGuide/ (Accessed on 10 April 2009)
Subway. Frequently asked questions 2009. http://www.subway.com/StudentGuide/faq.htm (Accessed on 1 April 2009)
Subway. Subway History 2009. http://www.subway.com/subwayroot/AboutSubway/history/subwayHistory.aspx (Accessed on 20 March 2009)
Subway. How We Compare to Our Competitors 2009. http://www.subway.com/StudentGuide/ (Accessed on 31 March 2009)
Subway. Marketing Strategies. http://www.oppapers.com/essays/Subways-Marketing-Strategies/161313 (Accessed on 18 March 2009)
Subway. Subway Menu 2009. http://www.subway.com/applications/Menu/index.aspx (Accessed on 21 March 2009)

85
Subway. Our Core Values and Philosophy 2009. http://www.subway.com/studentguide/s_e_welcome.htm (Accessed on 5 March 2009)
Subway. Our Support Network. http://www.subway.com/subwayroot/Development/why/index.aspx (Accessed on 20 May 2009)
Subway. Steps to Apply 2009. http://www.subway.com.au/info/franchise_information/Steps_to_Apply/ (Accessed on 20 May 2009)
Subway. Studentguide, How We Got Started 2009. http://www.subway.com/StudentGuide/ (Accessed on 22 April2009)
Subway. Studentquide, National Advertising. http://www.subway.com/StudentGuide/ (Accessed on 23 April 2009)
Subway Studentguide. Non-traditional Development. http://www.subway.com/StudentGuide/ (Accessed on 28 March 2009)
Sunset Boulevard. Historie. http://www.sunset-boulevard.dk/ (Accessed on 30 April 2009)
Sunset Boulevard. Maden 2009. http://www.sunset-boulevard.dk/ (Accessed on 29 April 2009)
The Medical News 2009. Denmark the happiest nation in the world, Zimbabwe the unhappiest. 30 June 2008. http://www.news-medical.net/news/2008/06/30/39599.aspx (Accessed on 10 April 2009)
The World factbook. Denmark 2009. https://www.cia.gov/library/publications/the-world-factbook/geos/da.html (Accessed on 1 June 2009)
Tutor2u. Buyer Behavior. http://tutor2u.net/business/marketing/buying_decision_process.asp (Accessed on 18 May 2009)
Tutor2u. Market Matrix 2009. http://tutor2u.net/business/strategy/ansoff_matrix.htm (Accessed on 4 April 2009)
USC Marshalls. The Marketing Mix, Product, Promotion, Pricing, Distribution. http://www.consumerpsychologist.com/intro_Product.html (Accessed on 27 October 2010)
Value Based Management. McKinsey 7-S Model. 7-S Framework of McKinsey http://www.valuebasedmanagement.net/methods_7S.html (Accessed on 21 May 2009)
Vejle Kommune. Statistik og Nogletal. Befolkning. http://www.vejle.dk/page27417.aspx (Accessed on 17 May 2009)

86
Århus Kommune. Befolkning. Hela Befolkning. http://www.aarhuskommune.dk/aarhus/Aarhus-i-tal/Befolkning.aspx (Accessed on 17 May 2009)

CHARTS
Chart 1 Open restaurants 1965-2009 p. 15 Chart 2 Subway restaurants in the world p. 16 Chart 3 Illustration of a common product life cycle p. 29 Chart 4 Like quick and healthy food p. 32 Chart 5 The most healthy fast food chain and knowing Subway p. 33 Chart 6 Horsens: The most healthy fast food chain and knowing Subway p. 61 Chart 7 Horsens: Like Subway p. 62 Chart 8 Horsens: Subway or Sunset Boulevard p. 62 Chart 9 Subway in Horsens p. 63 Chart 10 Horsens: Favorite fast food chain p. 63 Chart 11 Horsens: How often p. 64 Chart 12 Horsens: Discount importance p. 64 Chart 13 Horsens: Kids‟ menu and entertainment p. 65 Chart 14 Vejle: The most healthy fast food chain and knowing Subway p. 66 Chart 15 Vejle: Like Subway p. 66 Chart 16 Vejle: Subway or Sunset Boulevard p. 67 Chart 17 Subway in Vejle p. 67 Chart 18 Vejle: Favorite fast food chain p. 68 Chart 19 Vejle: How often p. 68 Chart 20 Vejle: Discount importance p. 69 Chart 21 Vejle: Kids‟ menu and entertainment p. 69 Chart 22 Århus: The most healthy fast food chain and knowing Subway p. 70 Chart 23 Århus: Like Subway p. 70 Chart 24 Århus: Subway or Sunset Boulevard p. 71 Chart 25 Subway in Århus p. 71 Chart 26 Århus: Favorite fast food chain p. 72 Chart 27 Århus: How often p. 72 Chart 28 Århus: Discount importance p. 73 Chart 29 Århus: Kids‟ menu and entertainment p. 73 Chart 30 The most important factor p. 74
FIGURES
Figure 1 7S-model p. 18 Figure 2 Porter‟s five forces model p. 44 Figure 3 Buying decision process p. 53 Figure 4 Awareness tree p. 55
TABLES
Table 1 SWOT-analysis of the Subway chain p. 23 Table 2 List of advantages and disadvantages p. 27 Table 3 Forecast Sales in fast food by Subsector p. 32 Table 4 Competitors‟ product offerings p. 47-48 Table 5 Nearby competitors p.50 Table 6 Rating of the best location for a Subway restaurant p. 78

APPENDIX 1
1 (2)
City:
The old questionnaire
1. Do you like quick and healthy food? Yes □ No□
Subway:
2. Do you know subway? Yes □ No □
3. If Yes: Do you like it? Yes □ No □
4. Would you like anything else on the menu?
Assessment of fast food chains:
5. Rate the following restaurants in terms of how healthy they are with 1 being
the healthiest and 4 being the least healthy.
Burger King □ Mc Donald‟s □ Sunset Boulevard □ Subway □
Customer preference and buying behavior:
6. How often do you eat fast food?
Weekly □ Monthly □ Annually □
7. What are the most important criteria when visiting a fast food restaurant?
Rate the following six factors from 1 being the most important to 6 being the
least important. (Write 1 in the box of the most important, 2 in the second
most important etc.)
Food delivered fast □ Food quality □ Service □ Price □ Atmosphere □
Opening hours□
8. What is your favorite fast food restaurant? (Choose only one option)
Mc Donald‟s □ Burger King □ Sunset Boulevard □ Subway □
other □

APPENDIX 1
2 (2)
9. If you had the choice between sunset boulevard and subway, which
restaurant would you choose? (Choose one of the two options)
Subway □ Sunset boulevard □
10. Rate how important price / quantity discounts are.
Very important 1 □ important 2 □ less important 3 □
unimportant 4 □
11. If subway is not your first choice, would you prefer it if they had offerings
concerning price and quantity discounts?
Yes □ No □
Fast food for children:
12. Is it important that a fast food restaurant offers children‟s menus?
Yes □ No □
13. Is it important that a fast food restaurant offers entertainment for children?
Yes □ No □
Subway located in the city:
14. Would you visit Subway if it was located in this city?
Yes □ No □
Personal data
Gender: M F
Age: < 18 □ 19 – 25 □ 26 – 35 □ 36 – 50 □ 50 > □
Occupation:
Pupil □ Student □ Employed □ Self-employed □ Housewife/-man □
Unemployed □

APPENDIX 2
1 (2)
The final questionnaire
City:
1. Do you like quick and healthy food?
Yes □ No□
Subway:
2. Do you know the fast food chain Subway?
Yes □ No□
3. If Yes: Do you like it?
Yes □ No □ Don‟t know □
4. Would you like anything else on the menu?
_______________________________________________
Assessment of fast food chains:
5. Rate the following restaurants in terms of how healthy they are with 1 being the healthiest and 4 being the least healthy.
Burger King □ McDonald‟s □ Sunset Boulevard □ Subway □
Customer preference and buying behavior:
6. How often do you eat fast food?
Weekly □ Monthly □ Annually □
7. What are the most important criteria when visiting a fast food restaurant?
Rate the following six factors from 1 being the most important to 6 being the least important. (Write 1 in the box of the most important, 2 in the second most important etc.)
Food delivered fast □ Food quality □ Service □ Price □ Atmosphere □ Opening hours□
8. What is your favorite fast food restaurant? (Choose only one option)
McDonald‟s □ Burger King □ Sunset Boulevard □ Subway □ other □

APPENDIX 2
2 (2)
9. If you had the choice between Sunset Boulevard and Subway, which restaurant would you choose? (Choose one of the two options)
Subway □ Sunset Boulevard □
10. Rate how important it is to get a discount when you buy more than one sandwich or soda.
Very important 1 □ important 2 □ less important 3 □
unimportant 4 □
11. If Subway is not your first choice, would you prefer it if it had special offers on menus, on certain sandwiches or if you for example buy two or more sandwiches?
Yes □ No □
Fast food for children:
12. Is it important that a fast food restaurant offers children‟s menus?
Yes □ No □
13. Is it important that a fast food restaurant offers entertainment for children?
Yes □ No □
Subway location:
14. Would you visit Subway if it was located in this city?
Yes □ No □
Personal data
Gender: Male □ Female □
Age: < 18 □ 19 – 25 □ 26 – 35 □ 36 – 49 □ 50 > □
Occupation:
Pupil □ Student □ Employed □ Self-employed □ Housewife/-man □
Unemployed □
Are you a Danish citizen? Yes □ No □

APPENDIX 3
1 (1)
8.2.1.1.1 Table 12 Forecast Sales in Fast Food by Subsector: Foodservice Value 2007-
2012 DKr million
2007 2008 2009 2010 2011 2012
Fast food 7,922.1 8,094.2 8,247.2 8,374.9 8,485.5 8,575.5
- Chained fast food 3,617.3 3,756.3 3,882.6 3,991.7 4,089.2 4,180.7
- Independent fast food 4,304.8 4,337.9 4,364.6 4,383.2 4,396.3 4,394.8
- Bakery products fast 889.0 931.3 973.3 1,012.4 1,049.6 1,084.4
food
-- Chained bakery 248.8 274.8 301.6 327.2 352.3 376.4
products fast food
-- Independent bakery 640.1 656.5 671.7 685.3 697.3 708.0
products fast food
- Burger fast food 1,898.8 1,978.5 2,047.7 2,103.4 2,149.3 2,191.2
-- Chained burger fast 1,898.8 1,978.5 2,047.7 2,103.4 2,149.3 2,191.2
food
- Chicken fast food 99.4 106.1 109.0 113.0 120.5 127.3
-- Chained chicken fast 34.8 35.4 36.0 36.5 37.0 37.5
food
-- Independent chicken 64.7 70.7 73.0 76.5 83.5 89.9
fast food
- Ice cream fast food 23.8 24.4 25.1 25.7 26.4 27.1
fast food
-- Independent ice 23.8 24.4 25.1 25.7 26.4 27.1
cream fast food
- Middle Eastern fast 198.6 200.5 203.5 205.8 209.8 210.5
food
-- Independent Middle 198.6 200.5 203.5 205.8 209.8 210.5
Eastern fast food
- Asian fast food 44.8 46.8 49.0 51.4 53.8 56.5
food
-- Independent Asian 44.8 46.8 49.0 51.4 53.8 56.5
fast food
- Pizza fast food 387.3 390.1 391.8 393.6 395.4 397.3
-- Independent pizza 387.3 390.1 391.8 393.6 395.4 397.3
fast food
- Convenience stores 1,461.8 1,490.1 1,517.3 1,542.1 1,565.7 1,588.1
fast food
-- Chained convenience 1,416.3 1,443.2 1,469.1 1,492.7 1,515.0 1,536.3
stores fast food
-- Independent 45.6 46.9 48.1 49.4 50.6 51.9
convenience stores fast
food
- Other fast food 2,918.8 2,926.4 2,930.4 2,927.5 2,915.1 2,893.2
-- Chained other fast 18.8 24.4 28.1 31.9 35.6 39.4
food
-- Independent other 2,900.0 2,902.0 2,902.3 2,895.6 2,879.4 2,853.8
fast food
Source: Official statistics, trade associations, trade press, company research, trade interviews,
Euromonitor International estimates

APPENDIX 4
1 (1)
8.2.1.1.2 Table 15 Forecast Sales in Fast Food by Subsector: % Foodservice Value Growth
2007-2012
2007-12 CAGR 2007/12 TOTAL
Fast food 1.6 8.2
- Chained fast food 2.9 15.6
- Independent fast food 0.4 2.1
- Bakery products fast food 4.1 22.0
-- Chained bakery products fast food 8.6 51.3
-- Independent bakery products fast food 2.0 10.6
- Burger fast food 2.9 15.4
-- Chained burger fast food 2.9 15.4
-- Independent burger fast food - -
- Chicken fast food 5.1 28.1
-- Chained chicken fast food 1.5 7.8
-- Independent chicken fast food 6.8 39.0
- Ice cream fast food 2.6 13.9
-- Chained ice cream fast food - -
-- Independent ice cream fast food 2.6 13.9
- Fish fast food - -
-- Chained fish fast food - -
-- Independent fish fast food - -
- Latin American fast food - -
-- Chained Latin American fast food - -
-- Independent Latin American fast food - -
- Middle Eastern fast food 1.2 6.0
-- Chained Middle Eastern fast food - -
-- Independent Middle Eastern fast food 1.2 6.0
- Asian fast food 4.8 26.2
-- Chained Asian fast food - -
-- Independent Asian fast food 4.8 26.2
- Pizza fast food 0.5 2.6
-- Chained pizza fast food - -
-- Independent pizza fast food 0.5 2.6
- Convenience stores fast food 1.7 8.6
-- Chained convenience stores fast food 1.6 8.5
-- Independent convenience stores fast food 2.6 13.8
- Other fast food -0.2 -0.9
-- Chained other fast food 16.0 110.0
-- Independent other fast food -0.3 -1.6
- Fast casual dining - -
Source: Official statistics, trade associations, trade press, company research, trade interviews,
Euromonitor International estimates

APPENDIX 5
1 (1)
8.2.1.1.3 Table 3 Fast Food by Subsector: Foodservice Value 2002-2007 DKr million
2002 2003 2004 2005 2006 2007
Fast food 5,413.5 5,910.9 6,518.1 7,015.0 7,540.3 7,922.1
- Chained fast food 2,145.0 2,433.0 2,810.7 3,054.2 3,355.0 3,617.3
- Independent fast food 3,268.5 3,477.9 3,707.4 3,960.8 4,185.2 4,304.8
- Bakery products fast 682.3 734.0 769.0 784.4 827.4 889.0
food
-- Chained bakery 112.1 150.4 184.2 196.5 233.1 248.8
products fast food
-- Independent bakery 570.2 583.7 584.9 587.8 594.3 640.1
products fast food
- Burger fast food 1,436.1 1,453.5 1,500.6 1,512.8 1,712.3 1,898.8
-- Chained burger fast 1,436.1 1,453.5 1,500.6 1,512.8 1,712.3 1,898.8
food
- Chicken fast food 68.1 74.0 81.5 87.8 92.7 99.4
-- Chained chicken fast 32.0 32.5 33.3 34.0 34.1 34.8
food
-- Independent chicken 36.1 41.5 48.2 53.8 58.6 64.7
fast food
- Ice cream fast food 19.8 20.8 21.6 22.5 23.1 23.8
-- Chained ice cream - - - - - -
fast food
-- Independent ice 19.8 20.8 21.6 22.5 23.1 23.8
cream fast food
American fast food
- Middle Eastern fast 191.7 193.4 195.1 196.3 197.4 198.6
food
-- Independent Middle 191.7 193.4 195.1 196.3 197.4 198.6
Eastern fast food
- Asian fast food 39.4 40.0 40.8 41.6 42.8 44.8
-- Independent Asian 39.4 40.0 40.8 41.6 42.8 44.8
fast food
- Pizza fast food 373.0 378.0 383.3 386.1 385.3 387.3
-- Independent pizza 373.0 378.0 383.3 386.1 385.3 387.3
fast food
- Convenience stores 608.1 840.1 1,136.3 1,354.8 1,410.4 1,461.8
fast food
-- Chained convenience 564.8 796.7 1,092.7 1,310.9 1,366.2 1,416.3
stores fast food
-- Independent 43.3 43.4 43.6 43.9 44.2 45.6
convenience stores fast
food
- Other fast food 1,995.0 2,177.1 2,389.9 2,628.8 2,848.7 2,918.8
-- Chained other fast - - - - 9.4 18.8
food
-- Independent other 1,995.0 2,177.1 2,389.9 2,628.8 2,839.3 2,900.0
fast food
Source: Official statistics, trade associations, trade press, company research, store checks, trade
interviews, Euromonitor International estimates

APPENDIX 6
1 (1)
8.2.1.1.4 Table 6 Fast Food by Subsector: % Foodservice Value Growth 2002-2007
2006/072002-07 CAGR 2002/07 TOTAL Fast food 5.17.9 46.3 - Chained fast food 7.811.0 68.6 - Independent fast food 2.95.7 31.7 - Bakery products fast food 7.45.4 30.3 -- Chained bakery products fast food 6.717.3 122.0 -- Independent bakery products fast food 7.72.3 12.3 - Burger fast food 10.95.7 32.2 -- Chained burger fast food 10.95.7 32.2 - Chicken fast food 7.27.9 46.0 -- Chained chicken fast food 2.01.7 8.6 -- Independent chicken fast food 10.212.4 79.1 - Ice cream fast food 2.73.7 20.0 -- Independent ice cream fast food 2.73.7 20.0 - Middle Eastern fast food 0.60.7 3.6 -- Independent Middle Eastern fast food 0.60.7 3.6 - Asian fast food 4.52.6 13.6 -- Independent Asian fast food 4.52.6 13.6 - Pizza fast food 0.50.8 3.8 -- Independent pizza fast food 0.50.8 3.8 - Convenience stores fast food 3.619.2 140.4 -- Chained convenience stores fast food 3.720.2 150.7 -- Independent convenience stores fast 3.01.0 5.3 food - Other fast food 2.57.9 46.3 -- Independent other fast food 2.17.8 45.4
Source: Official statistics, trade associations, trade press, company research, store
checks, trade interviews, Euromonitor International estimate

APPENDIX 7
1 (19)
Fast Food – Denmark
Euromonitor International : Country Sector Briefing
October 2008

APPENDIX 7
2 (19)
List of Contents and Tables
Headlines 1
Trends 1
Competitive Landscape 2
Prospects 3
Sector Data 4
Table 1 Fast Food by Subsector: Units/Outlets 2002-2007 4
Table 2 Fast Food by Subsector: Transactions 2002-2007 5
Table 3 Fast Food by Subsector: Foodservice Value 2002-2007 6
Table 4 Fast Food by Subsector: % Units/Outlets Growth 2002-2007 8
Table 5 Fast Food by Subsector: % Transaction Growth 2002-2007 8
Table 6 Fast Food by Subsector: % Foodservice Value Growth 2002-2007 9
Table 7 Sales of Bakery Products Fast Food by Type 2006-2007 10
Table 8 Global Brand Owner Shares of Chained Fast Food 2003-2007 10
Table 9 Brand Shares of Chained Fast Food 2004-2007 10
Table 10 Forecast Sales in Fast Food by Subsector: Units/Outlets 2007-2012 11
Table 11 Forecast Sales in Fast Food by Subsector: Transactions 2007-2012 12
Table 12 Forecast Sales in Fast Food by Subsector: Foodservice Value 2007-2012 13
Table 13 Forecast Sales in Fast Food by Subsector: % Units/Outlets Growth 2007-2012 14
Table 14 Forecast Sales in Fast Food by Subsector: % Transaction Growth 2007-2012 15
Table 15 Forecast Sales in Fast Food by Subsector: % Foodservice
Value growth 2007-2012 16

12
APPENDIX 7
3 (18)
9 Fast Food in Denmark
9.1 Headlines
Fast food sales grow 5% in current value terms in 2007, to reach DKr7.9 billion
The number of fast food outlets increases by 2% in 2007, to reach 4,420 outlets
The continued rise of convenience stores fast food and the increasing impact of healthier fast food
options across all categories are the most important trends in 2007
Chained burger fast food was the fastest growing category in 2007, with sales up 11% in current
value terms, which is double the fast food average
Multinational burger fast food chains McDonald’s and Burger King record strong growth in value
sales and Burger King also increases its number of outlets significantly in 2007. Multinational
convenience stores fast food chains 7-Eleven, Statoil, Shell and YX, all with a large presence in
Denmark, as well as the domestic chain Kort & Godt also record continued strong growth
Fast food sales are expected to reach DKr8.6 billion in 2012, which represents an increase of 8% in
constant value terms from 2007
9.2 Trends
Sales of fast food through chained convenience stores continued to healthily grow in 2007. These
chains comprise the petrol/gas station operators Statoil, Shell and YX and the train station-based
convenience store chain Kort & Godt, and, not least, 7-Eleven which is in a phase of rapid outlet
expansion in the cities, petrol/gas stations and train stations. Convenience stores fast food is to a large
degree “traditional” Danish sausage fast food, which in 2006 and in 2007 recorded estimated annual
value sales growth of 5% – and thus maintained the total Danish value sales of sausages, even though
sales are falling in traditional grill bars (categorised under other fast food) and in mobile street stalls
known as pølsevogne. But also various bake off and coffee varieties make up a large share of value
sales in convenience stores fast food and sales are growing twice as fast as for sausage fast food.
Finally, value sales of sandwiches have started to grow very fast, at 10-20% per annum, albeit from a
low level.
Health and wellness became a major trend. Not only has the market leader McDonald’s continued its
healthier options strategy, but also almost all other kinds of chained and independent outlets have
introduced healthier option sandwiches. Even in traditional sausage fast food, a healthier option low-
fat sausage has been introduced by Steff Houlberg along with a baguette higher in fibre (to make a
healthier fransk hotdog, which is the best-selling item in sausage fast food). Organic products and
sustainability were still not issues in fast food in 2007, which is in contrast to other consumer
foodservice categories, such as FSR and cafés/bars, but also especially packaged food.
The 5% current value growth in fast food sales in 2007 was over two percentage points lower than in
2006 and three percentage points lower than the 2002-2007 period CAGR.
To a large extent the strong growth of convenience store sales of bake off and coffee reflects a trend
towards increasing fast food sales in the morning, primarily to people commuting to work. Thus, this
trend seems almost exclusively to affect convenience stores that are located in petrol/gas stations or
in or near train and bus stations. The other fast food categories have remained unaffected. Fast food
sold in the morning in petrol/gas stations is bake off, especially smurte rundstykker (halved buns with
butter and sometimes cheese or sliced meat on top) and various pastries. In contrast, in Kort & Godt
and 7-Eleven outlets, it is other kinds of bread and pastries, such as croissants.

13
APPENDIX 7
4 (19)
Fast food casual dining still did not exist in Denmark in 2007, but remained confined to North
American FSR.
In 2007, sandwich specialists accounted for 51% of bakery fast food outlets, sweet bakery goods
specialists for 45% and other including mixed bakery fast food for 4%. The major bakery fast food
chains Sunset Boulevard and The Bagel Co are sandwich specialists, while another chain, Emmerys,
is a peculiar mix of being primarily a high-end bakery but at the same time selling sandwiches and
sweet bakery products.
Burger fast food from the two big chains McDonald’s and Burger King remained very popular in
2007. So did traditional sausage fast food such as hot dogs and grilled sausages, which used to be
sold mostly by the large number of independent grill bars, as well as at various fixed and mobile
street stalls. Sales of traditional sausage fast food have been declining for a number of years at these
traditional outlets, but at the same time they have been growing at the convenience stores.
Chicken fast food of the KFC type continued to have only a marginal presence in Denmark in 2007.
Sales of chained fast food grew 8% in current value terms in 2007, compared with only 3% for the
independent fast food outlets, and in fact chained outlets recorded very strong growth in all existing
fast food categories, with chained chicken fast food as the only exception with growth of only 2%.
Eat-in accounted for 21% and takeaway for 79% of total fast food value sales in 2007.
Food accounted for 85% and drink for 15% of total fast food value sales in 2007.
9.3 Competitive Landscape
McDonald’s was still the leading fast food chain in Denmark in 2007, with sales of DKr1,655 million
from its 83 outlets. McDonald’s value share of fast food in 2007 was almost 22% and was also the
fastest growing from 2006. In comparison, Burger King still only had 15 outlets and sales of DKr244
million, or 3% of the total market in 2007. But Burger King’s main franchisee in Denmark, Cresco
Food, has announced that it and other franchisees will open 5-10 new outlets every year in the
upcoming years. They do not expect to gain new sales by expanding the Danish market for burger
fast food, but instead expect to take sales from the existing players, primarily McDonald’s. Thus,
newspaper headlines are describing this as the beginnings of a burger war in Denmark. Both chains
explain their growth is primarily due to Danes’ rising disposable income.
In terms of number of outlets, the three biggest fast food chains in Denmark are the petrol/gas station
convenience stores of Statoil, 203 outlets (2007), Shell 196 outlets and YX 123 outlets (of which 66
will be converted to Shell petrol/gas stations with 7-Eleven convenience stores in the upcoming
years). Statoil’s sales in 2007 reached DKr382 million, which translates into a 5% share of total fast
food. Shell’s convenience stores fast food sales totalled DKr341 million, equal to a near 5% share,
whilst YX’s sales were worth DKr210 million, for a 3% value share.
Two other big convenience stores fast food chains are 7-Eleven, operated by Reitan Servicehandel
Danmark, and Kort & Godt, operated by DSB Kort & Godt, which is a subsidiary of the Danish
national railroad company DSB. In 2007, 7-Eleven had 62 outlets across Denmark, with sales of
DKr234 million, or 3% of total fast food. Fast food’s share of 7-Eleven’s total value sales in
Denmark was 25%, which is five times as much as in the US. 7-Eleven plans to continue to expand
fast, not least in former YX petrol/gas stations, but also in a number of train stations in Northern
Zealand. All of Kort & Godt’s 57 convenience stores are based in Danish train and S-train stations
and generated sales of DKr210 million in 2007, for a near 3% value share. Within a few years there
will be 75 Kort & Godt outlets, thereby completing a transition plan, shutting down many older DSB
restaurants, street stalls and kiosks and creating instead a homogenous chain.
In 2007 the domestic sandwich specialist bakery fast food brand chain Sunset Boulevard, whose
national brand owner in 2007 became Danske Koncept Restauranter, a company created from former
brand owner KD Restaurants (which still is the national brand owner of Pizza Hut), had 27 outlets
across Denmark with estimated sales of DKr224 million. Sunset Boulevard was the only fast food

14
APPENDIX 7
5 (19)
chain in 2007, whose core concept and marketing strategy is low-fat fast food. Another fast emerging
brand, is the Danish sandwich bakery fast food chain The Bagel Co., which in 2007 operated 10
owned outlets in the greater Copenhagen area with sales of DKr19 million. The Bagel Co. also offers
freshly-made and healthier option bagel sandwiches primarily for lunch, but also in the early evening,
as well as coffee and bagels in the morning. The company plans to increase its number of outlets by
50% in 2008.
Other leading companies are Steff Houlberg and Tulip Fast Food, which are both owned by Danish
Crown. Each company supplies around 40% of the sausages and other meat products sold at street
stalls, as well as at grill bars and through convenience stores fast food in Denmark. Even though all
the grill bars and street stalls selling sausage fast food are independent, most of them, nevertheless,
are closely linked to one of the two main suppliers, which provide marketing material, menu
proposals, displays, courses, technical support etc. Recently both suppliers have started moving into
chain building through franchising with the chains Tulip Time Out grill bars and Steff’s Place street
stalls in Copenhagen airport. The Tulip Time Out chain has been growing very fast since it opened its
first five outlets in 2006 (three of them in previous Monarch traffic locations). Five more Tulip Time
Out outlets were opened in 2007, with sales reaching an estimated DKr19 million.
There were no noteworthy marketing campaigns in 2007.
A significant new fast food product introduced in 2007 was Steff Houlberg’s low-fat sausage in a
high-fibre baguette, which created a healthier fransk hotdog (the best-selling item within sausage fast
food). The product will be offered at 40% of all grill bars and street stalls, as well as in convenience
stores fast food outlets such as Kort & Godt. At the same time, the newly introduced freshly-made or
semi-produced sandwiches in convenience stores fast food outlets, as well as in traditional grill bars
and street stalls, also recorded growing sales. Fresh fruit and bottled water offered as part of menus
represented another growing trend, particularly in convenience stores fast food.
The convenience stores fast food outlets are focusing specifically on expanding their sales of fast
food in the morning to accommodate the changing consumer patterns of many Danes, which
increasingly have their breakfast and morning coffee on their way to work. In this regard, the
petrol/gas station convenience stores are targeting motorists and 7-Eleven and Kort & Godt the train
and bus commuters. The main products sold are bake off like sliced buns with butter, croissants,
various pastry and sandwiches, typically along with coffee. All these products are quite traditional
breakfast items in Denmark and trade sources mention a particular conservatism among Danish
consumers in this regard, which also explains the failure of previous new morning food product
launches, such as various toasted items. No other fast food category seems interested in morning
sales although morning sales are the largest part of sales for the Kort & Godt chain.
In 2007, 7% of all fast food value sales in Denmark were accounted for by domestic brands, whereas
domestic independent outlets comprised another 53% of total value sales, leaving 40% of value sales
to multinational chains.
In August 2007 Scandinavian 7-Eleven brand owner Reitangruppen and Reitan Servicehandel
announced an alliance with Shell throughout Scandinavia, whereby 112 of Shell’s petrol/gas station
convenience stores in Sweden will be taken over by 7-Eleven, while Shell will take over 91 of YX’s
petrol/gas stations in Norway and 66 YX stations in Denmark owned by Reitan, but leaving these
petrol/gas stations’ convenience stores to be operated by Reitan’s 7-Eleven. In Denmark this means
that the convenience stores, which trade sources describe as the 66 best-performing of YX’s 123
petrol/gas stations, will be converted to 7-Eleven outlets (10 of these had already been converted).
The remaining YX stations will continue to sell convenience stores fast food, but have announced
that they will change their convenience store concept in the forecast period by cutting down on the
variety of convenience products and fast food offered and instead refocusing on car-related products.
No plans have been revealed about 7-Eleven taking over convenience stores at Shell stations in
Denmark.

15
APPENDIX 7
6 (19)
9.4 Prospects
The success of convenience stores fast food is expected to continue for all the major chains. The success of
this concept can also be seen from the big transformation taking place in self-service cafeterias. Coop
Danmark is opening rapidly new 2GO outlets in all its 81 Kvickly supermarkets, which is a new hybrid
format somewhere between a self-service cafeteria and convenience stores fast food.
The health and wellness trend will not only be reflected in the continued success of sandwich specialist
outlets, but also in the still expanding variety of healthier options appearing in almost all fast food
categories.
Fast food sales are expected to grow at a near 2% CAGR, or 8%, in constant value terms over the 2007-
2012 period. This is significantly lower than the very strong growth over the 2002-2007 period, but a
certain saturation is setting in for most fast food categories as a result of the opening of many new outlets
in recent years, as well as the slowing down of the Danish economy.
Swedish burger fast food chain Max Hamburgerrestauranger has announced that it plans to open one or
more outlets in Denmark by 2012, following its expansion in Norway. In the long term, the company sees
potential for 40-50 restaurants in Denmark. Max Hamburgerrestauranger has a distinct “Healthy Choice”
strategy, through reducing the fat content in all its products and at the same time offering a special range
of healthier options called Max Delifresh, which to date accounts for 15% of its sales in Sweden. The
appearance of this chain in Denmark could result in even more pressure on the existing fast food chains to
further improve the health aspects of their products and concepts.
A trend with great potential impact has been the creation of franchised chained grill bars, as well as mobile
street stalls selling sausages from the two big suppliers, Steff Houlberg and Tulip Fast Food. Thus, this
could be the first steps in creating chains for the two companies which already have semi-chained
arrangements with 80% of all independent grill bars and street stalls selling sausage fast food and other
fast food as well.
The fast casual dining concept is expected to remain the domain of North American FSR.
A potential threat to the growth of fast food is the still uncertain development of Danish consumers’
willingness to continue purchasing fast food, whether for breakfast, lunch at work, dinner in the evening or
just on impulse, during the upcoming years of a slowing economy and rising costs.
McDonald’s has continued to expand its healthier options concept and in February 2008 the company
announced a new sponsorship deal with Team Danmark, which is the national Danish sports organisation
grooming elite athletes to win medals at international competitions such as the Olympic Games. The deal
makes McDonald’s the main financial sponsor of Team Danmark. Among other elements, the deal also
involves the development of a special healthy “Team Danmark Menu”, nutritious enough to feed a
sportsperson, to be sold at all Danish McDonald’s outlets in the months before and during the Olympic
Games to be held in Beijing in summer 2008. This menu will be developed jointly between McDonald’s
Denmark and Team Danmark nutritionalists. For every menu sold, DKr1 will be allocated to Team
Danmark’s work with elite Danish sportspeople. The deal generated much debate about fast food in the
Danish media in early 2008, challenging the widespread notion among many Danes of fast food being
synonymous with unhealthy “junk food”.
Specific advertising of Steff Houlberg’s low-fat sausage and franske hotdog is planned in all independent
grill bars and street stalls selling sausage fast food, but also mass advertising directly to consumers is
expected.
Faster rising foodstuff commodity prices and labour costs might slow the expansion of fast food and cause
retail prices to rise.
It remains to be seen how successful the new low-fat sausage from Steff Houlberg will be, as well as the
Team Danmark Menu offered by McDonald’s in summer 2008. Almost certain though, seems the
continued growth in sales of freshly-made and semi-produced sandwiches which now are being sold in
almost all chained convenience stores fast food outlets and in a growing number of independent other fast
food outlets, including grill bars.

16
APPENDIX 7
7 (19)
9.5 Sector Data
9.5.1.1.1 Table 1 Fast Food by Subsector: Units/Outlets 2002-2007 outlets
2002 2003 2004 2005 2006 2007 Fast food 4,008 4,196 4,236 4,286 4,343 4,420 - Chained fast food 656 796 795 812 832 839 - Independent fast food 3,352 3,400 3,441 3,474 3,511 3,581 - Bakery products fast food 625 635 644 650 663 700 -- Chained bakery 20 28 35 40 51 57 products fast food -- Independent bakery 605 607 609 610 612 643 products fast food - Burger fast food 92 93 93 93 94 98 -- Chained burger fast food 92 93 93 93 94 98 -- Independent burger - - - - - - fast food - Chicken fast food 8 9 10 11 12 14 -- Chained chicken fast food 3 3 3 3 3 3 -- Independent chicken 5 6 7 8 9 11 fast food - Ice cream fast food 32 34 35 36 37 38 -- Chained ice cream - - - - - - fast food -- Independent ice 32 34 35 36 37 38 cream fast food - Fish fast food - - - - - - -- Chained fish fast food - - - - - - -- Independent fish - - - - - - fast food - Latin American fast food - - - - - - -- Chained Latin - - - - - - American fast food -- Independent Latin - - - - - - American fast food - Middle Eastern fast food 205 211 215 217 219 221 -- Chained Middle - - - - - - Eastern fast food -- Independent Middle 205 211 215 217 219 221 Eastern fast food - Asian fast food 51 53 55 57 59 61 -- Chained Asian fast food - - - - - - -- Independent Asian 51 53 55 57 59 61 fast food - Pizza fast food 310 321 326 328 331 333 -- Chained pizza fast food - - - - - - -- Independent pizza 310 321 326 328 331 333 fast food - Convenience stores 633 765 759 772 777 772 fast food -- Chained convenience 541 672 664 676 679 671 stores fast food -- Independent 92 93 95 96 98 101 convenience stores fast food - Other fast food 2,052 2,075 2,099 2,122 2,151 2,183 -- Chained other fast food - - - - 5 10 -- Independent other 2,052 2,075 2,099 2,122 2,146 2,173 fast food - Fast casual dining - - - - - - Source: Official statistics, trade associations, trade press, company research, store checks, trade interviews,
Euromonitor International estimates
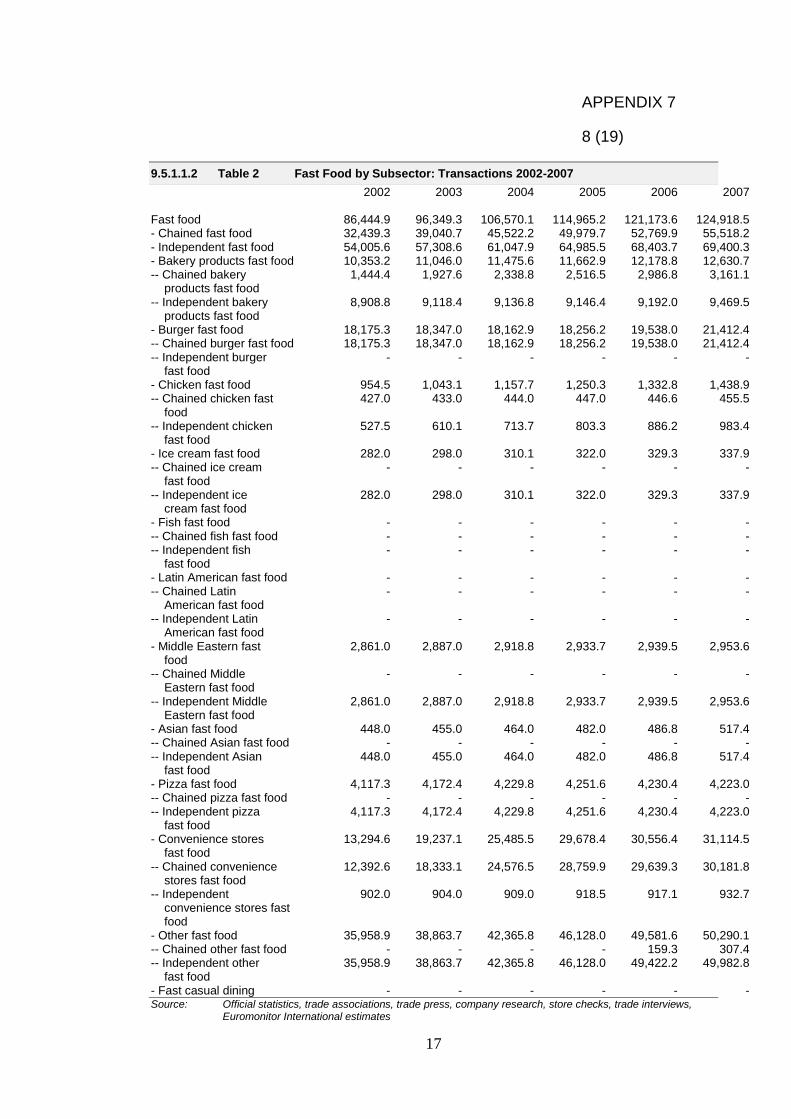
17
APPENDIX 7
8 (19)
9.5.1.1.2 Table 2 Fast Food by Subsector: Transactions 2002-2007
2002 2003 2004 2005 2006 2007 Fast food 86,444.9 96,349.3 106,570.1 114,965.2 121,173.6 124,918.5 - Chained fast food 32,439.3 39,040.7 45,522.2 49,979.7 52,769.9 55,518.2 - Independent fast food 54,005.6 57,308.6 61,047.9 64,985.5 68,403.7 69,400.3 - Bakery products fast food 10,353.2 11,046.0 11,475.6 11,662.9 12,178.8 12,630.7 -- Chained bakery 1,444.4 1,927.6 2,338.8 2,516.5 2,986.8 3,161.1 products fast food -- Independent bakery 8,908.8 9,118.4 9,136.8 9,146.4 9,192.0 9,469.5 products fast food - Burger fast food 18,175.3 18,347.0 18,162.9 18,256.2 19,538.0 21,412.4 -- Chained burger fast food 18,175.3 18,347.0 18,162.9 18,256.2 19,538.0 21,412.4 -- Independent burger - - - - - - fast food - Chicken fast food 954.5 1,043.1 1,157.7 1,250.3 1,332.8 1,438.9 -- Chained chicken fast 427.0 433.0 444.0 447.0 446.6 455.5 food -- Independent chicken 527.5 610.1 713.7 803.3 886.2 983.4 fast food - Ice cream fast food 282.0 298.0 310.1 322.0 329.3 337.9 -- Chained ice cream - - - - - - fast food -- Independent ice 282.0 298.0 310.1 322.0 329.3 337.9 cream fast food - Fish fast food - - - - - - -- Chained fish fast food - - - - - - -- Independent fish - - - - - - fast food - Latin American fast food - - - - - - -- Chained Latin - - - - - - American fast food -- Independent Latin - - - - - - American fast food - Middle Eastern fast 2,861.0 2,887.0 2,918.8 2,933.7 2,939.5 2,953.6 food -- Chained Middle - - - - - - Eastern fast food -- Independent Middle 2,861.0 2,887.0 2,918.8 2,933.7 2,939.5 2,953.6 Eastern fast food - Asian fast food 448.0 455.0 464.0 482.0 486.8 517.4 -- Chained Asian fast food - - - - - - -- Independent Asian 448.0 455.0 464.0 482.0 486.8 517.4 fast food - Pizza fast food 4,117.3 4,172.4 4,229.8 4,251.6 4,230.4 4,223.0 -- Chained pizza fast food - - - - - - -- Independent pizza 4,117.3 4,172.4 4,229.8 4,251.6 4,230.4 4,223.0 fast food - Convenience stores 13,294.6 19,237.1 25,485.5 29,678.4 30,556.4 31,114.5 fast food -- Chained convenience 12,392.6 18,333.1 24,576.5 28,759.9 29,639.3 30,181.8 stores fast food -- Independent 902.0 904.0 909.0 918.5 917.1 932.7 convenience stores fast food - Other fast food 35,958.9 38,863.7 42,365.8 46,128.0 49,581.6 50,290.1 -- Chained other fast food - - - - 159.3 307.4 -- Independent other 35,958.9 38,863.7 42,365.8 46,128.0 49,422.2 49,982.8 fast food - Fast casual dining - - - - - - Source: Official statistics, trade associations, trade press, company research, store checks, trade interviews,
Euromonitor International estimates

18
APPENDIX 7
9 (19)
9.5.1.1.3 Table 3 Fast Food by Subsector: Foodservice Value 2002-2007 Dkr million
2002 2003 2004 2005 2006 2007 Fast food 5,413.5 5,910.9 6,518.1 7,015.0 7,540.3 7,922.1 - Chained fast food 2,145.0 2,433.0 2,810.7 3,054.2 3,355.0 3,617.3 - Independent fast food 3,268.5 3,477.9 3,707.4 3,960.8 4,185.2 4,304.8 - Bakery products fast 682.3 734.0 769.0 784.4 827.4 889.0 food -- Chained bakery 112.1 150.4 184.2 196.5 233.1 248.8 products fast food -- Independent bakery 570.2 583.7 584.9 587.8 594.3 640.1 products fast food - Burger fast food 1,436.1 1,453.5 1,500.6 1,512.8 1,712.3 1,898.8 -- Chained burger fast food 1,436.1 1,453.5 1,500.6 1,512.8 1,712.3 1,898.8 -- Independent burger - - - - - - fast food - Chicken fast food 68.1 74.0 81.5 87.8 92.7 99.4 -- Chained chicken fast food 32.0 32.5 33.3 34.0 34.1 34.8 -- Independent chicken 36.1 41.5 48.2 53.8 58.6 64.7 fast food - Ice cream fast food 19.8 20.8 21.6 22.5 23.1 23.8 -- Chained ice cream - - - - - - fast food -- Independent ice 19.8 20.8 21.6 22.5 23.1 23.8 cream fast food - Fish fast food - - - - - - -- Chained fish fast food - - - - - - -- Independent fish - - - - - - fast food - Latin American fast - - - - - - food -- Chained Latin American - - - - - - American fast food -- Independent Latin - - - - - - American fast food - Middle Eastern fast food 191.7 193.4 195.1 196.3 197.4 198.6 -- Chained Middle - - - - - - Eastern fast food -- Independent Middle 191.7 193.4 195.1 196.3 197.4 198.6 Eastern fast food - Asian fast food 39.4 40.0 40.8 41.6 42.8 44.8 -- Chained Asian fast food - - - - - - -- Independent Asian 39.4 40.0 40.8 41.6 42.8 44.8 fast food - Pizza fast food 373.0 378.0 383.3 386.1 385.3 387.3 -- Chained pizza fast - - - - - - food -- Independent pizza 373.0 378.0 383.3 386.1 385.3 387.3 fast food - Convenience stores 608.1 840.1 1,136.3 1,354.8 1,410.4 1,461.8 fast food -- Chained convenience 564.8 796.7 1,092.7 1,310.9 1,366.2 1,416.3 stores fast food -- Independent 43.3 43.4 43.6 43.9 44.2 45.6 convenience stores fast food - Other fast food 1,995.0 2,177.1 2,389.9 2,628.8 2,848.7 2,918.8 -- Chained other fast food - - - - 9.4 18.8 -- Independent other 1,995.0 2,177.1 2,389.9 2,628.8 2,839.3 2,900.0 fast food - Fast casual dining - - - - - - Source: Official statistics, trade associations, trade press, company research, store checks, trade interviews,
Euromonitor International estimates

19
APPENDIX 7
10 (19)
9.5.1.1.4 Table 4 Fast Food by Subsector: % Units/Outlets Growth 2002-2007 % Units/Outlets growth
2006/072002-07 CAGR 2002/07 TOTAL Fast food 1.82.0 10.3 - Chained fast food 0.85.0 27.9 - Independent fast food 2.01.3 6.8 - Bakery products fast food 5.62.3 12.0 -- Chained bakery products fast food 11.823.3 185.0 -- Independent bakery products fast food 5.11.2 6.3 - Burger fast food 4.31.3 6.5 -- Chained burger fast food 4.31.3 6.5 -- Independent burger fast food -- - - Chicken fast food 16.711.8 75.0 -- Chained chicken fast food 0.00.0 0.0 -- Independent chicken fast food 22.217.1 120.0 - Ice cream fast food 2.73.5 18.8 -- Chained ice cream fast food -- - -- Independent ice cream fast food 2.73.5 18.8 - Fish fast food -- - -- Chained fish fast food -- - -- Independent fish fast food -- - - Latin American fast food -- - -- Chained Latin American fast food -- - -- Independent Latin American fast food -- - - Middle Eastern fast food 0.91.5 7.8 -- Chained Middle Eastern fast food -- - -- Independent Middle Eastern fast food 0.91.5 7.8 - Asian fast food 3.43.6 19.6 -- Chained Asian fast food -- - -- Independent Asian fast food 3.43.6 19.6 - Pizza fast food 0.61.4 7.4 -- Chained pizza fast food -- - -- Independent pizza fast food 0.61.4 7.4 - Convenience stores fast food -0.64.1 22.0 -- Chained convenience stores fast food -1.24.4 24.0 -- Independent convenience stores fast 3.11.9 9.8 food - Other fast food 1.51.2 6.4 -- Chained other fast food 100.0- - -- Independent other fast food 1.31.2 5.9 - Fast casual dining -- - Source: Official statistics, trade associations, trade press, company research, store checks, trade interviews,
Euromonitor International estimates

20
APPENDIX 7
11 (19)
9.5.1.1.5 Table 5 Fast Food by Subsector: % Transaction Growth 2002-2007 % transaction growth
2006/072002-07 CAGR 2002/07 TOTAL Fast food 3.17.6 44.5 - Chained fast food 5.211.3 71.1 - Independent fast food 1.55.1 28.5 - Bakery products fast food 3.74.1 22.0 -- Chained bakery products fast food 5.817.0 118.8 -- Independent bakery products fast food 3.01.2 6.3 - Burger fast food 9.63.3 17.8 -- Chained burger fast food 9.63.3 17.8 -- Independent burger fast food -- - - Chicken fast food 8.08.6 50.7 -- Chained chicken fast food 2.01.3 6.7 -- Independent chicken fast food 11.013.3 86.4 - Ice cream fast food 2.63.7 19.8 -- Chained ice cream fast food -- - -- Independent ice cream fast food 2.63.7 19.8 - Fish fast food -- - -- Chained fish fast food -- - -- Independent fish fast food -- - - Latin American fast food -- - -- Chained Latin American fast food -- - -- Independent Latin American fast food -- - - Middle Eastern fast food 0.50.6 3.2 -- Chained Middle Eastern fast food -- - -- Independent Middle Eastern fast food 0.50.6 3.2 - Asian fast food 6.32.9 15.5 -- Chained Asian fast food -- - -- Independent Asian fast food 6.32.9 15.5 - Pizza fast food -0.20.5 2.6 -- Chained pizza fast food -- - -- Independent pizza fast food -0.20.5 2.6 - Convenience stores fast food 1.818.5 134.0 -- Chained convenience stores fast food 1.819.5 143.5 -- Independent convenience stores fast 1.70.7 3.4 food - Other fast food 1.46.9 39.9 -- Chained other fast food 92.9- - -- Independent other fast food 1.16.8 39.0 - Fast casual dining -- - Source: Official statistics, trade associations, trade press, company research, store checks, trade interviews,
Euromonitor International estimates

21
APPENDIX 7
12 (19)
9.5.1.1.6 Table 6 Fast Food by Subsector: % Foodservice Value Growth 2002-2007 % value growth
2006/072002-07 CAGR 2002/07 TOTAL Fast food 5.17.9 46.3 - Chained fast food 7.811.0 68.6 - Independent fast food 2.95.7 31.7 - Bakery products fast food 7.45.4 30.3 -- Chained bakery products fast food 6.717.3 122.0 -- Independent bakery products fast food 7.72.3 12.3 - Burger fast food 10.95.7 32.2 -- Chained burger fast food 10.95.7 32.2 -- Independent burger fast food -- - - Chicken fast food 7.27.9 46.0 -- Chained chicken fast food 2.01.7 8.6 -- Independent chicken fast food 10.212.4 79.1 - Ice cream fast food 2.73.7 20.0 -- Chained ice cream fast food -- - -- Independent ice cream fast food 2.73.7 20.0 - Fish fast food -- - -- Chained fish fast food -- - -- Independent fish fast food -- - - Latin American fast food -- - -- Chained Latin American fast food -- - -- Independent Latin American fast food -- - - Middle Eastern fast food 0.60.7 3.6 -- Chained Middle Eastern fast food -- - -- Independent Middle Eastern fast food 0.60.7 3.6 - Asian fast food 4.52.6 13.6 -- Chained Asian fast food -- - -- Independent Asian fast food 4.52.6 13.6 - Pizza fast food 0.50.8 3.8 -- Chained pizza fast food -- - -- Independent pizza fast food 0.50.8 3.8 - Convenience stores fast food 3.619.2 140.4 -- Chained convenience stores fast food 3.720.2 150.7 -- Independent convenience stores fast 3.01.0 5.3 food - Other fast food 2.57.9 46.3 -- Chained other fast food 99.5- - -- Independent other fast food 2.17.8 45.4 - Fast casual dining -- - Source: Official statistics, trade associations, trade press, company research, store checks, trade interviews,
Euromonitor International estimates
9.5.1.1.7 Table 7 Sales of Bakery Products Fast Food by Type 2006-2007 % value
2006 2007 Sandwich specialists 51.2 51.2 Sweet bakery goods specialists 44.9 44.9 Other including mixed bakery fast food 3.9 3.9 Total 100.0 100.0 Source: Official statistics, trade associations, trade press, company research, store checks, trade interviews,
Euromonitor International estimates

22
APPENDIX 7
13 (19)
9.5.1.1.8 Table 8 Global Brand Owner Shares of Chained Fast Food 2003-2007 % value
Company 2003 2004 2005 2006 2007 McDonald's Corp 52.2 46.8 43.3 45.2 45.8 StatoilHydro ASA - - - - 10.6 Koninklijke Shell Groep/ 12.5 11.1 10.6 9.9 9.4 Royal Dutch Shell Group DSB Group 8.6 7.6 7.4 7.1 6.9 Burger King Holdings Inc 7.5 6.6 6.3 5.8 6.7 Seven & I Holdings Co, Ltd - - 6.2 6.1 6.5 Danske Koncept - - - - 6.2 Restauranter ApS Reitan Servicehandel - - - 6.8 5.8 Danmark A/S Yum! Brands Inc 1.3 1.2 1.1 1.0 1.0 The Bagel Co ApS 0.3 0.3 0.4 0.5 0.5 TFC Fast Food A/S - - - 0.3 0.5 Emmerys ApS 0.1 0.1 0.1 0.1 0.2 Statoil ASA - 11.9 11.4 10.9 - KD Restaurants I/S 5.8 6.1 5.9 6.3 - Hydro Texaco AS 8.4 7.5 7.3 - - Ito-Yokado Co Ltd 0.8 0.7 - - - Statoil Detaljhandel 2.5 - - - - Skandinavia AS Diageo Plc - - - - - Tricon Global - - - - - Restaurants Inc Total 100.0 100.0 100.0 100.0 100.0 Source: Trade associations, trade press, company research, trade interviews, Euromonitor International
estimates
9.5.1.1.9 Table 9 Brand Shares of Chained Fast Food 2004-2007 % value
Brand Global Brand Owner 2004 2005 2006 2007 McDonald's McDonald's Corp 46.8 43.3 45.2 45.8 Statoil StatoilHydro ASA - - - 10.6 Shell Select Koninklijke Shell Groep/ 11.1 10.6 9.9 9.4 Royal Dutch Shell Group Burger King Burger King Holdings Inc 6.6 6.3 5.8 6.7 7-Eleven Seven & I Holdings Co, Ltd - 6.2 6.1 6.5 Sunset Boulevard Danske Koncept - - - 6.2 Restauranter ApS Kort & Godt DSB Group 4.3 4.8 5.2 5.8 YX Energi Reitan Servicehandel - - 6.8 5.8 Danmark A/S DSB Kiosker DSB Group 3.3 2.6 1.9 1.1 KFC Yum! Brands Inc 1.2 1.1 1.0 1.0 The Bagel Co The Bagel Co ApS 0.3 0.4 0.5 0.5 Tulip Time Out TFC Fast Food A/S - - 0.3 0.5 Emmerys Emmerys ApS 0.1 0.1 0.1 0.2 Statoil Statoil ASA 11.9 11.4 10.9 - Sunset Boulevard KD Restaurants I/S 6.1 5.9 6.3 - Hydro Texaco Hydro Texaco AS 7.5 7.3 - - 7-Eleven Ito-Yokado Co Ltd 0.7 - - - Burger King Diageo Plc - - - - Statoil Statoil Detaljhandel - - - - Skandinavia AS KFC Tricon Global - - - - Restaurants Inc Total 100.0 100.0 100.0 100.0
Source: Trade associations, trade press, company research, trade interviews, Euromonitor International estimates

23
APPENDIX 7
14 (19)
9.5.1.1.10 Table 10 Forecast Sales in Fast Food by Subsector: Units/Outlets 2007-2012
2007 2008 2009 2010 2011 2012 Fast food 4,420 4,487 4,544 4,590 4,628 4,655 - Chained fast food 839 858 873 889 904 918 - Independent fast food 3,581 3,629 3,671 3,701 3,724 3,737 - Bakery products fast food 700 732 762 785 804 817 -- Chained bakery 57 63 68 74 78 81 products fast food -- Independent bakery 643 669 694 711 726 736 products fast food - Burger fast food 98 103 107 110 113 116 -- Chained burger fast food 98 103 107 110 113 116 -- Independent burger - - - - - - fast food - Chicken fast food 14 16 17 18 20 22 -- Chained chicken fast 3 3 3 3 3 3 food -- Independent chicken 11 13 14 15 17 19 fast food - Ice cream fast food 38 39 40 41 42 43 -- Chained ice cream - - - - - - fast food -- Independent ice 38 39 40 41 42 43 cream fast food - Fish fast food - - - - - - -- Chained fish fast food - - - - - - -- Independent fish - - - - - - fast food - Latin American fast - - - - - - food -- Chained Latin - - - - - - American fast food -- Independent Latin - - - - - - American fast food - Middle Eastern fast food 221 223 225 226 228 229 -- Chained Middle - - - - - - Eastern fast food -- Independent Middle 221 223 225 226 228 229 Eastern fast food - Asian fast food 61 63 65 67 69 71 -- Chained Asian fast food - - - - - - -- Independent Asian 61 63 65 67 69 71 fast food - Pizza fast food 333 336 338 340 342 344 -- Chained pizza fast food - - - - - - -- Independent pizza 333 336 338 340 342 344 fast food - Convenience stores 772 780 787 795 804 813 fast food -- Chained convenience 671 676 680 685 691 697 stores fast food -- Independent 101 104 107 110 113 116 convenience stores fast food - Other fast food 2,183 2,195 2,203 2,208 2,206 2,200 -- Chained other fast food 10 13 15 17 19 21 -- Independent other 2,173 2,182 2,188 2,191 2,187 2,179 fast food - Fast casual dining - - - - - - Source: Official statistics, trade associations, trade press, company research, trade interviews, Euromonitor
International estimates

24
APPENDIX 7
15 (19)
9.5.1.1.11 Table 11 Forecast Sales in Fast Food by Subsector: Transactions 2007-2012
2007 2008 2009 2010 2011 2012 Fast food 124,918.5 128,276.3 131,338.6 133,782.8 136,120.4 138,041.1 - Chained fast food 55,518.2 57,739.7 59,851.9 61,697.7 63,404.3 65,159.3 - Independent fast food 69,400.3 70,536.6 71,486.7 72,085.1 72,716.1 72,881.9 - Bakery products fast food 12,630.7 13,643.3 14,379.8 15,037.8 15,649.4 16,187.8 -- Chained bakery 3,161.1 3,627.2 4,093.3 4,496.7 4,885.9 5,260.7 products fast food -- Independent bakery 9,469.5 10,016.1 10,286.5 10,541.1 10,763.5 10,927.1 products fast food - Burger fast food 21,412.4 22,493.2 23,472.5 24,227.6 24,833.0 25,452.5 -- Chained burger fast food 21,412.4 22,493.2 23,472.5 24,227.6 24,833.0 25,452.5 -- Independent burger - - - - - - fast food - Chicken fast food 1,438.9 1,548.7 1,596.7 1,665.0 1,809.5 1,924.1 -- Chained chicken fast food 455.5 464.5 473.1 481.3 489.3 496.6 -- Independent chicken 983.4 1,084.3 1,123.6 1,183.7 1,320.2 1,427.6 fast food - Ice cream fast food 337.9 346.3 354.0 363.9 371.3 379.9 -- Chained ice cream - - - - - - fast food -- Independent ice 337.9 346.3 354.0 363.9 371.3 379.9 cream fast food - Fish fast food - - - - - - -- Chained fish fast food - - - - - - -- Independent fish - - - - - - fast food - Latin American fast food - - - - - - -- Chained Latin - - - - - - American fast food -- Independent Latin - - - - - - American fast food - Middle Eastern fast food 2,953.6 3,002.1 3,073.1 3,141.9 3,242.9 3,287.6 -- Chained Middle - - - - - - Eastern fast food -- Independent Middle 2,953.6 3,002.1 3,073.1 3,141.9 3,242.9 3,287.6 Eastern fast food - Asian fast food 517.4 544.3 571.3 599.9 631.8 664.6 -- Chained Asian fast food - - - - - - -- Independent Asian 517.4 544.3 571.3 599.9 631.8 664.6 fast food - Pizza fast food 4,223.0 4,264.1 4,297.5 4,329.6 4,373.0 4,407.5 -- Chained pizza fast food - - - - - - -- Independent pizza 4,223.0 4,264.1 4,297.5 4,329.6 4,373.0 4,407.5 fast food - Convenience stores 31,114.5 31,713.4 32,330.6 32,968.7 33,635.2 34,328.4 fast food -- Chained convenience 30,181.8 30,755.2 31,351.9 31,969.5 32,612.1 33,283.9 stores fast food -- Independent 932.7 958.2 978.7 999.2 1,023.1 1,044.5 convenience stores fast food - Other fast food 50,290.1 50,720.9 51,263.1 51,448.4 51,574.4 51,408.8 -- Chained other fast food 307.4 399.6 461.1 522.6 584.0 665.5 -- Independent other 49,982.8 50,321.3 50,802.0 50,925.9 50,990.4 50,743.3 fast food - Fast casual dining - - - - - - Source: Official statistics, trade associations, trade press, company research, trade interviews, Euromonitor
International estimates

25
APPENDIX 7
16 (19)
9.5.1.1.12 Table 12 Forecast Sales in Fast Food by Subsector: Foodservice Value 2007-2012 DKr million
2007 2008 2009 2010 2011 2012 Fast food 7,922.1 8,094.2 8,247.2 8,374.9 8,485.5 8,575.5 - Chained fast food 3,617.3 3,756.3 3,882.6 3,991.7 4,089.2 4,180.7 - Independent fast food 4,304.8 4,337.9 4,364.6 4,383.2 4,396.3 4,394.8 - Bakery products fast food 889.0 931.3 973.3 1,012.4 1,049.6 1,084.4 -- Chained bakery 248.8 274.8 301.6 327.2 352.3 376.4 products fast food -- Independent bakery 640.1 656.5 671.7 685.3 697.3 708.0 products fast food - Burger fast food 1,898.8 1,978.5 2,047.7 2,103.4 2,149.3 2,191.2 -- Chained burger fast food 1,898.8 1,978.5 2,047.7 2,103.4 2,149.3 2,191.2 -- Independent burger - - - - - - fast food - Chicken fast food 99.4 106.1 109.0 113.0 120.5 127.3 -- Chained chicken fast food 34.8 35.4 36.0 36.5 37.0 37.5 -- Independent chicken 64.7 70.7 73.0 76.5 83.5 89.9 fast food - Ice cream fast food 23.8 24.4 25.1 25.7 26.4 27.1 -- Chained ice cream - - - - - - fast food -- Independent ice 23.8 24.4 25.1 25.7 26.4 27.1 cream fast food - Fish fast food - - - - - - -- Chained fish fast food - - - - - - -- Independent fish - - - - - - fast food - Latin American fast - - - - - - food -- Chained Latin - - - - - - American fast food -- Independent Latin - - - - - - American fast food - Middle Eastern fast food 198.6 200.5 203.5 205.8 209.8 210.5 -- Chained Middle - - - - - - Eastern fast food -- Independent Middle 198.6 200.5 203.5 205.8 209.8 210.5 Eastern fast food - Asian fast food 44.8 46.8 49.0 51.4 53.8 56.5 -- Chained Asian fast - - - - - - food -- Independent Asian 44.8 46.8 49.0 51.4 53.8 56.5 fast food - Pizza fast food 387.3 390.1 391.8 393.6 395.4 397.3 -- Chained pizza fast food - - - - - - -- Independent pizza 387.3 390.1 391.8 393.6 395.4 397.3 fast food - Convenience stores 1,461.8 1,490.1 1,517.3 1,542.1 1,565.7 1,588.1 fast food -- Chained convenience 1,416.3 1,443.2 1,469.1 1,492.7 1,515.0 1,536.3 stores fast food -- Independent 45.6 46.9 48.1 49.4 50.6 51.9 convenience stores fast food - Other fast food 2,918.8 2,926.4 2,930.4 2,927.5 2,915.1 2,893.2 -- Chained other fast food 18.8 24.4 28.1 31.9 35.6 39.4 -- Independent other 2,900.0 2,902.0 2,902.3 2,895.6 2,879.4 2,853.8 fast food - Fast casual dining - - - - - - Source: Official statistics, trade associations, trade press, company research, trade interviews, Euromonitor
International estimates

26
APPENDIX 7
17 (19)
9.5.1.1.13 Table 13 Forecast Sales in Fast Food by Subsector: % Units/Outlets Growth 2007-2012
2007-12 CAGR 2007/12 TOTAL Fast food 1.0 5.3 - Chained fast food 1.8 9.4 - Independent fast food 0.9 4.4 - Bakery products fast food 3.1 16.7 -- Chained bakery products fast food 7.3 42.1 -- Independent bakery products fast food 2.7 14.5 - Burger fast food 3.4 18.4 -- Chained burger fast food 3.4 18.4 -- Independent burger fast food - - - Chicken fast food 9.5 57.1 -- Chained chicken fast food 0.0 0.0 -- Independent chicken fast food 11.6 72.7 - Ice cream fast food 2.5 13.2 -- Chained ice cream fast food - - -- Independent ice cream fast food 2.5 13.2 - Fish fast food - - -- Chained fish fast food - - -- Independent fish fast food - - - Latin American fast food - - -- Chained Latin American fast food - - -- Independent Latin American fast food - - - Middle Eastern fast food 0.7 3.6 -- Chained Middle Eastern fast food - - -- Independent Middle Eastern fast food 0.7 3.6 - Asian fast food 3.1 16.4 -- Chained Asian fast food - - -- Independent Asian fast food 3.1 16.4 - Pizza fast food 0.7 3.3 -- Chained pizza fast food - - -- Independent pizza fast food 0.7 3.3 - Convenience stores fast food 1.0 5.3 -- Chained convenience stores fast food 0.8 3.9 -- Independent convenience stores fast food 2.8 14.9 - Other fast food 0.2 0.8 -- Chained other fast food 16.0 110.0 -- Independent other fast food 0.1 0.3 - Fast casual dining - - Source: Official statistics, trade associations, trade press, company research, trade interviews, Euromonitor
International estimates

27
APPENDIX 7
18 (19)
9.5.1.1.14 Table 14 Forecast Sales in Fast Food by Subsector: % Transaction Growth 2007-2012
2007-12 CAGR 2007/12 TOTAL Fast food 2.0 10.5 - Chained fast food 3.3 17.4 - Independent fast food 1.0 5.0 - Bakery products fast food 5.1 28.2 -- Chained bakery products fast food 10.7 66.4 -- Independent bakery products fast food 2.9 15.4 - Burger fast food 3.5 18.9 -- Chained burger fast food 3.5 18.9 -- Independent burger fast food - - - Chicken fast food 6.0 33.7 -- Chained chicken fast food 1.7 9.0 -- Independent chicken fast food 7.7 45.2 - Ice cream fast food 2.4 12.4 -- Chained ice cream fast food - - -- Independent ice cream fast food 2.4 12.4 - Fish fast food - - -- Chained fish fast food - - -- Independent fish fast food - - - Latin American fast food - - -- Chained Latin American fast food - - -- Independent Latin American fast food - - - Middle Eastern fast food 2.2 11.3 -- Chained Middle Eastern fast food - - -- Independent Middle Eastern fast food 2.2 11.3 - Asian fast food 5.1 28.4 -- Chained Asian fast food - - -- Independent Asian fast food 5.1 28.4 - Pizza fast food 0.9 4.4 -- Chained pizza fast food - - -- Independent pizza fast food 0.9 4.4 - Convenience stores fast food 2.0 10.3 -- Chained convenience stores fast food 2.0 10.3 -- Independent convenience stores fast food 2.3 12.0 - Other fast food 0.4 2.2 -- Chained other fast food 16.7 116.5 -- Independent other fast food 0.3 1.5 - Fast casual dining - - Source: Official statistics, trade associations, trade press, company research, trade interviews, Euromonitor
International estimates
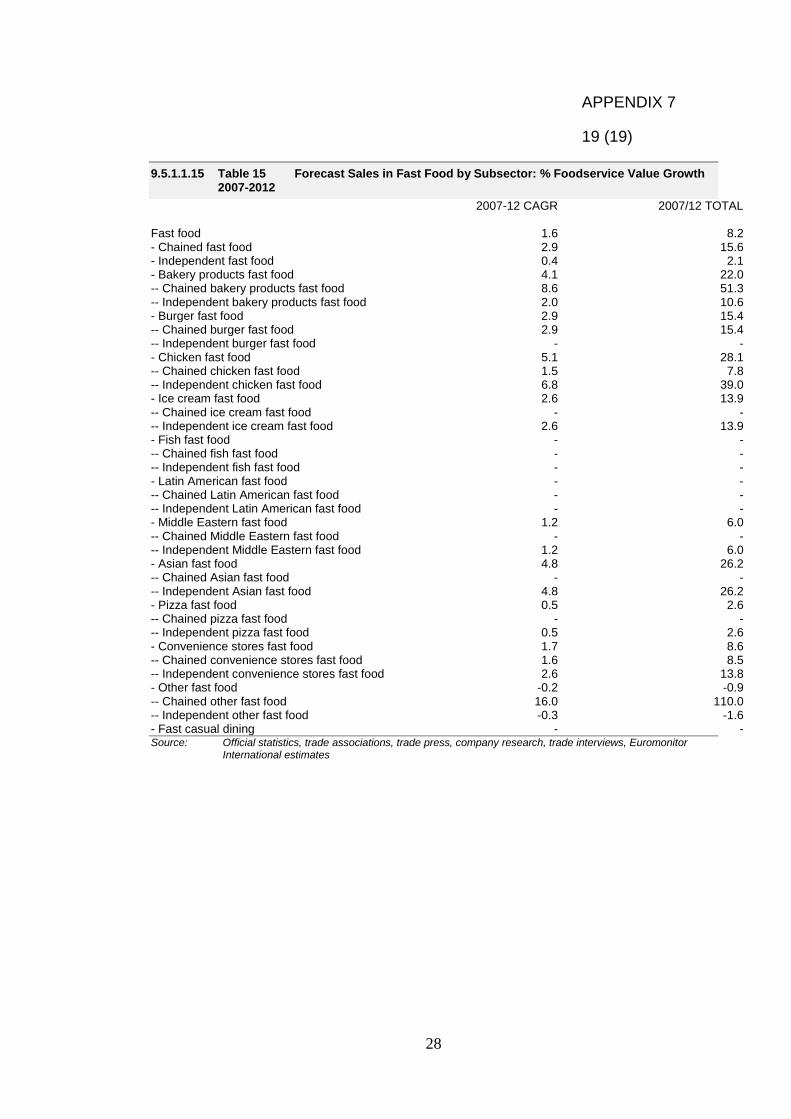
28
APPENDIX 7
19 (19)
9.5.1.1.15 Table 15 Forecast Sales in Fast Food by Subsector: % Foodservice Value Growth 2007-2012
2007-12 CAGR 2007/12 TOTAL Fast food 1.6 8.2 - Chained fast food 2.9 15.6 - Independent fast food 0.4 2.1 - Bakery products fast food 4.1 22.0 -- Chained bakery products fast food 8.6 51.3 -- Independent bakery products fast food 2.0 10.6 - Burger fast food 2.9 15.4 -- Chained burger fast food 2.9 15.4 -- Independent burger fast food - - - Chicken fast food 5.1 28.1 -- Chained chicken fast food 1.5 7.8 -- Independent chicken fast food 6.8 39.0 - Ice cream fast food 2.6 13.9 -- Chained ice cream fast food - - -- Independent ice cream fast food 2.6 13.9 - Fish fast food - - -- Chained fish fast food - - -- Independent fish fast food - - - Latin American fast food - - -- Chained Latin American fast food - - -- Independent Latin American fast food - - - Middle Eastern fast food 1.2 6.0 -- Chained Middle Eastern fast food - - -- Independent Middle Eastern fast food 1.2 6.0 - Asian fast food 4.8 26.2 -- Chained Asian fast food - - -- Independent Asian fast food 4.8 26.2 - Pizza fast food 0.5 2.6 -- Chained pizza fast food - - -- Independent pizza fast food 0.5 2.6 - Convenience stores fast food 1.7 8.6 -- Chained convenience stores fast food 1.6 8.5 -- Independent convenience stores fast food 2.6 13.8 - Other fast food -0.2 -0.9 -- Chained other fast food 16.0 110.0 -- Independent other fast food -0.3 -1.6 - Fast casual dining - - Source: Official statistics, trade associations, trade press, company research, trade interviews, Euromonitor
International estimates