lnbi 4453 - qnet: a tool for querying protein interaction ...roded/qnet.pdf · qnet: a tool for...
TRANSCRIPT

QNet: A Tool for Querying Protein InteractionNetworks
Banu Dost1,∗, Tomer Shlomi2,∗, Nitin Gupta1, Eytan Ruppin2,3,Vineet Bafna1, and Roded Sharan2
1 Computer Science and Engineering,Univ. of California, San Diego, CA 92093, USA
{bdost,ngupta,vbafna}@cs.ucsd.edu2 School of Computer Science, Tel Aviv University, 69978 Tel Aviv, Israel
{shlomito,ruppin,roded}@post.tau.ac.il3 School of Medicine, Tel Aviv University, 69978 Tel Aviv, Israel
Abstract. Molecular interaction databases can be used to study theevolution of molecular pathways across species. Querying such pathwaysis a challenging computational problem, and recent efforts have been lim-ited to simple queries (paths), or simple networks (forests). In this pa-per, we significantly extend the class of pathways that can be efficientlyqueried to the case of trees, and graphs of bounded treewidth. Our al-gorithm allows the identification of non-exact (homeomorphic) matches,exploiting the color coding technique of Alon et al. We implement a toolfor tree queries, called QNet, and test its retrieval properties in simu-lations and on real network data. We show that QNet searches querieswith up to 9 proteins in seconds on current networks, and outperformssequence-based searches. We also use QNet to perform the first large scalecross-species comparison of protein complexes, by querying known yeastcomplexes against a fly protein interaction network. This comparisonpoints to strong conservation between the two species, and underscoresthe importance of our tool in mining protein interaction networks.
1 Introduction
The study of biological networks has gained substantial interest in recent years.In particular, technological advances, such as the yeast two-hybrid [11] andco-immunoprecipitation assays [15], have enabled the large-scale mapping ofprotein-protein interactions (PPIs) across many model species. The newly avail-able PPI networks present a host of new challenges in studying protein functionand evolution. Key to addressing these challenges is the development of efficienttools for network database searches, much the same as sequence searches havebeen instrumental in addressing similar problems at the genome level.
Network queries call for searching a “template” subnetwork within a net-work of interest. Commonly, the query is a known pathway, and the network issearched for subnetworks that are similar to the query. Similarity is measured
* These authors contributed equally to this work.
T. Speed and H. Huang (Eds.): RECOMB 2007, LNBI 4453, pp. 1–15, 2007.c© Springer-Verlag Berlin Heidelberg 2007

2 B. Dost et al.
both in terms of protein sequence similarity and in terms of topological simi-larity. The hardness of the problem stems from the non-linearity of a network,making it difficult to apply sequence alignment techniques for its solution.
Several authors have studied the network querying problem, mostly focusing onqueries with restricted topology. Kelley et al. [13] devised an algorithm for query-ing linear pathways in PPI networks. While the problem remains NP-hard in thiscase as well (as, e.g., finding the longest path in a graph is NP-complete [7]), anefficient algorithm that is polynomial in the size of the network and exponentialin the length of the query was devised for it. Pinter et al. [17] enable fast queriesof more general pathways that take the form of a tree. However, their algorithmis limited to searching within a collection of trees rather than within a generalnetwork. Sohler and Zimmer [6] developed a general framework for subnetworkquerying, which is based on translating the problem to that of finding a clique inan appropriately defined graph. Due to its complexity, their method is applicableonly to very small queries. Recently, some of us have provided a comprehensiveframework, called QPath, for linear pathway querying. QPath is based on an ef-ficient graph theoretic technique, called color coding [1], for identifying subnet-works of “simple” topology in a network. It improves upon [13] both in speed andin higher flexibility in non-exact matches.
In this paper, we greatly extend the QPath algorithm to allow queries withmore general structure than simple paths. We provide an algorithmic frameworkfor handling tree queries under non-exact (homeomorphic) matches (Section 3.1).In this regard, our work extends [17] to querying within general networks, andthe results in [1] to searching for homeomorphic rather than isomorphic matches.More generally, we provide an algorithm for querying subnetworks of boundedtreewidth (Section 3.2). We implemented a tool for tree queries which we callQNet. We demonstrate that QNet performs well both in simulation of syn-thetic pathway queries, and when applied to mining real biological pathways(Section 5). In simulations, we show that QNet can handle queries of up to 9proteins in seconds in a network with about 5,000 vertices and 15,000 interac-tions, and that it outperforms sequence-based searches. More importantly, weuse QNet to perform the first large scale cross-species comparison of proteincomplexes, by querying known yeast complexes in the fly protein interactionnetwork. This comparison points to strong conservation of protein complexesstructures between the two species. For lack of space some algorithmic detailsare omitted in the sequel.
2 The Graph Query Problem
Let G = (V, E, w) be an undirected weighted graph, representing a PPI net-work, with a vertex set V of size n, representing proteins, an edge set E of sizem, representing interactions, and a weight function w : E → R, representinginteraction reliabilities.
Let GQ = (VQ, EQ) denote a query graph with k vertices. We reserve the termnode for vertices of GQ and use the term vertex for vertices of G.
QNet: A Tool for Querying Protein Interaction Networks 3
Let h(q, v) denote a similarity score between query node q ∈ VQ and vertexv ∈ V . In our context, vertices correspond to proteins, and their similarityscore is a function of their sequence similarity. A query node q is referred toas homologous to a graph vertex v, if the corresponding similarity score h(q, v)exceeds a predefined threshold.
A subdivision of an edge (u, v) in a graph H = (U, F ) replaces it with twoedges (u, w) and (w, v), where w �∈ U , i.e., creating a new graph H ′ = (U ∪{w}, F ∪ {(u, w), (w, v)} \ {u, v}). H is considered extendable to a graph G, ifG can be obtained from H by a series of subdivisions. In particular, H is thenhomeomorphic to G.
An alignment of the query graph GQ to G is defined as a pair of: (i) a subgraphGA = (VA, EA) of G, referred to as the alignment subgraph; and (ii) a bijection,σ : V S
Q → V SA , between a subset of query nodes, V S
Q ⊆ VQ, and homologousvertices in the alignment subgraph, V S
A ⊆ VA. The vertices in V SQ ∪ V S
A arecalled skeleton vertices. Pairs of associated vertices (q, σ(q)) ∈ V S
Q × V SA are
called aligned.An alignment is proper if there exists a pair of skeleton graphs SQ = (V S
Q , ESQ)
and SA = (V SA , ES
A) that satisfy the following conditions: (i) there is an isomor-phism between SQ and SA which respects the alignment (i.e., there is an edge(u, v) ∈ ES
Q iff there is an edge (σ(u), σ(v)) ∈ ESA); and (ii) SQ is extendable
to GQ and SA is extendable to GA. In particular, this means that GQ and GA
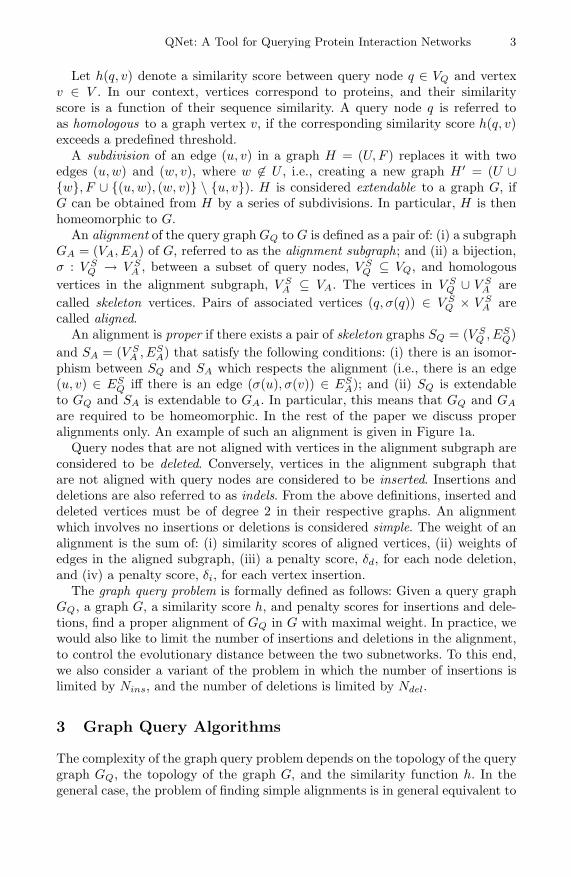
are required to be homeomorphic. In the rest of the paper we discuss properalignments only. An example of such an alignment is given in Figure 1a.
Query nodes that are not aligned with vertices in the alignment subgraph areconsidered to be deleted. Conversely, vertices in the alignment subgraph thatare not aligned with query nodes are considered to be inserted. Insertions anddeletions are also referred to as indels. From the above definitions, inserted anddeleted vertices must be of degree 2 in their respective graphs. An alignmentwhich involves no insertions or deletions is considered simple. The weight of analignment is the sum of: (i) similarity scores of aligned vertices, (ii) weights ofedges in the aligned subgraph, (iii) a penalty score, δd, for each node deletion,and (iv) a penalty score, δi, for each vertex insertion.
The graph query problem is formally defined as follows: Given a query graphGQ, a graph G, a similarity score h, and penalty scores for insertions and dele-tions, find a proper alignment of GQ in G with maximal weight. In practice, wewould also like to limit the number of insertions and deletions in the alignment,to control the evolutionary distance between the two subnetworks. To this end,we also consider a variant of the problem in which the number of insertions islimited by Nins, and the number of deletions is limited by Ndel.
3 Graph Query Algorithms
The complexity of the graph query problem depends on the topology of the querygraph GQ, the topology of the graph G, and the similarity function h. In thegeneral case, the problem of finding simple alignments is in general equivalent to

4 B. Dost et al.
subgraph isomorphism [8], which is computationally hard. In this paper, we focuson efficient query algorithms by exploiting the underlying biological constraints.Specifically, motivated by known pathways in KEGG [12], we consider restrictedquery topologies, i.e., the query graph being a tree, and a graph of boundedtreewidth (see also [17]). For these special structures, we adapt the color codingmethod of Alon et al. [1] to make the problem tractable.
Color coding is a randomized technique for finding simple paths and simplecycles of a specified length k within a given graph of size n. The basic idea isto randomly assign k colors to the vertices of the graph and then search forcolorful paths in which each color is used exactly once. Thus, rather than havingto maintain a list of vertices visited so far (of size O(nk)), one can maintain alist of colors at considerably lower complexity (O(2k)).
The use of the color coding technique within a query algorithm is intuitivelysimilar. We construct an optimal alignment by extending optimal sub-alignmentsusing dynamic programming. Adding a network vertex to the optimal alignmentcan be done only if this vertex is not already contained in the sub-optimal align-ment. Thus, naively, each potential sub-optimal alignment should maintain thelist of at most k vertices already matched. This yields O(nk) potential align-ments. In color coding, we apriori color each network vertex randomly withone of k colors, looking for a colorful alignment. Consequently, we only needto maintain a list of used colors (of size O(2k)), which significantly reduces thecomputation time. However, the computation returns a correct answer only ifthe optimum alignment is colorful, which happens with probability k!
kk � e−k.Therefore, if we repeat the experiment ln(1
ε )ek times, we get the optimum align-ment with probability at least 1 − ε for any desired value of ε.
3.1 Tree Query
We describe an algorithm for solving the graph query problem assuming that thequery graph is a tree. For ease of presentation, we start by presenting a simplifiedversion of the algorithm that limits the number of insertions only. The propertreatment of limiting both the number of insertions and deletions is deferred tothe end of the section.
First, we root GQ arbitrarily at a node r with degree 1. For each query nodeq, denote its children by q1, . . . , qnq , where nq denotes their number. Let Tq,j
denote the tree that includes q and the subtrees rooted at each of its first jchildren, for 1 ≤ j ≤ nq. The algorithm proceeds in a series of trials in whichevery vertex v ∈ V is independently assigned a color c(v) drawn uniformly atrandom from the set C = {1, 2, . . . , k + Nins}. Given the random vertex colors,we employ dynamic programming to identify an optimal colorful alignment. LetWM (q, v, S, j) denote the maximal score of an alignment of Tq,j in G, suchthat query node q is aligned with graph vertex v, with the aligned subgraphreceiving distinct colors from S ⊆ C. The recursion is initialized by settingWM (q, v, S, 0) = h(q, v) for leaf nodes q, and is formulated as follows:

QNet: A Tool for Querying Protein Interaction Networks 5
W M(q, v, S, j) = maxu : (u, v) ∈ E
S′ ⊂ S
⎧⎪⎪⎪⎪⎪⎪⎪⎪⎪⎪⎪⎪⎨
⎪⎪⎪⎪⎪⎪⎪⎪⎪⎪⎪⎪⎩
(* Match, child j *)W M (q, v, S′, j−1)+W M (qj , u, S−S′, nqj )+w(u, v),
(* Insertion, vertex u *)W M (q, v, S′, j − 1) + W I(qj , u, S − S′) + w(u, v),
(* Deletion, child j *)W M (q, v, S′, j − 1) + W D(qj , v, S − S′)
Here W I(q, v, S) denotes the optimal score of an alignment of Tq,nq in G, suchthat q is aligned with some vertex u that is a descendant of v in the alignedsubgraph. WD(q, v, S) denotes the optimal score of the alignment of Tq,1 in G,such that q is deleted and v is aligned with an ancestor of q. The recursions forthe insertion and deletions cases are given below. For query nodes q of degreeother than 2, we set WD(q, v, S) = −∞.
W I(q, v, S) = maxu : (u, v) ∈ E
{W M(q, u, S − {c(v)}, nq) + w(u, v) + δi,W I(q, u, S − {c(v)}) + w(u, v) + δi
W D(q, v, S) = maxu : (u, v) ∈ E
⎧⎨
⎩
W M(q1, u, S, nq1) + w(u, v) + δd,
W I(q1, u, S) + w(u, v) + δd,W D(q1, v, S) + δd
The maximal score of the alignment is maxv,S WM (r, v, S, 1). The optimalalignment is obtained through standard dynamic programming backtracking.An application of the dynamic programming recursions to a sample query isdemonstrated in Figure 1.
The running time of each trial is 2O(k+Nins)m. The probability of receivingdistinct colors for the vertices of the optimal matching tree is at least e−k−Nins .Thus, the running time of the algorithm is 2O(k+Nins)m ln(1
ε ) for any desiredsuccess probability 1 − ε (where ε > 0). We note that it is straightforward tolimit the number of deletions to Ndel by incorporating an additional variable inthe recursions to count the number of deletion in the optimal sub-alignment. Thecost in terms of running time is multiplicative in Ndel. When incorporating sucha variable, it is also easy to limit the number of insertions to Nins by choosingthe optimum solution based on its number of deletions and the cardinality of itscolor set.
3.2 Bounded Treewidth Graph Query
The algorithm for matching trees can be extended to subgraphs that have tree-like properties. We present an algorithm for the simpler case where no indelsare allowed and defer the description of an algorithm for the general case to theappendix. Intuitively, the treewidth of a graph indicates how close the graph isto being a tree, where a tree has treewidth 1. The maximal treewidth value for

6 B. Dost et al.
VQ (1 )
(a) Query Graph (b) Alignment subgraph
VQ (2 )
VQ (3 )
VQ (4 )
VQ (5 )
VQ (6 )
V(1)
V(2)
V(3)
V(4)
V(6)
V(5)
VQ (7 ) V(7)
h(1,1)
h(2,2)
h(3,3)
h(4,4)
h(6,6)
h(7,7)
1
1
1
1
23
(c ) Dynamic Programming steps
Step 1 W M(2,2{},0)=5
Step 2 W M(6,6,{},0)=5
Step 3 W M(7,7,{},0)=5
Step 4 W D(5,3,{})=5+1-3=3
Step 5 W M(3,3,{},0)=5
Step 6 W M(3,3,{},1)=5+3=8
Step 7 W I(7,5,{})=5+1-3=3
Step 8 W M(4,4{},0)=5
Step 9 W M(4,4,{},1)=5+3+1=9
Step 10 W M(1,1,{},0)=5
Step 11 W M(1,1,{},1)=5+5+1=11
Step 12 W M(1,1,{},2)=11+8+2=21
Step 13 WM(1,1,{},3)=21+9+3=33
Fig. 1. (a) An example of a tree query graph and the corresponding alignment sub-graph. Numbers on the query graph’s edges represent an arbitrary ordering of childrennodes. Aligned query nodes and graph vertices are connected with dashed lines. Nodesin the skeleton graphs appear in gray. (b) A simulation of the dynamic programmingrecursions. For simplicity, we denote color sets as {}. Matched vertices are awarded by+5, insertions and deletions are penalized by −3 and edge weights are as shown.
a graph with n vertices is n − 1 and this value is attained by an n-vertex clique.A formal definition of a treewidth and the associated tree-like structure follows.
A tree decomposition (X, T ) of the query graph GQ = (VQ, EQ) is defined asfollows (see, e.g., [14]): T = (I, F ) is a rooted binary tree, and X = {Xi ⊆ VQ :i ∈ I} is a collection of subsets of VQ, such that
⋃i∈I Xi = VQ and the following
conditions are satisfied:
1. For each edge (u, v) ∈ EQ there exists i ∈ I such that u, v ∈ Xi.2. If i, j, k ∈ I and j is on the path from i to k in T , then Xi
⋂Xk ⊆ Xj .
The treewidth of the tree decomposition is maxi∈I |Xi| − 1. An example of agraph and its tree decomposition is given in Figure 2a,b.
Let t denote a bound on the treewidth of GQ. We add a dummy node das a parent of the root of T , with Xd = ∅. To avoid confusion, we call thenodes of T , super-nodes. For a non-leaf tree super-node Xi ∈ X , denote itstwo children by Xi1 and Xi2 . Let Ti denote the subtree of T that is rooted atXi. The algorithm proceeds in a series of trials in which every vertex v ∈ Vis independently assigned a color c(v) drawn uniformly at random from the set{1, 2, . . . , k}. Given the random vertex colors, we employ dynamic programmingto identify an optimal colorful alignment.
The properties of the tree decomposition enable us to identify the optimalalignment by recursing on T and maintaining sub-optimal alignments of querynodes spanned by subtrees of T , similar to the tree query algorithm describedabove. However, there are two main difficulties to tackle: (i) A set of query nodes,Xi, may have an arbitrary topology (e.g., forming a clique), potentially requiringan exhaustive O(nt+1)-time search of an alignment subgraph for it. (ii) A querynode v may appear in more than a single super-node.

QNet: A Tool for Querying Protein Interaction Networks 7
VQ(1)
VQ(2) VQ(3)
VQ(4)
VQ(6)VQ(5)
VQ(7)
VQ(8)
VQ(1)
VQ(2) VQ(3)
VQ(4)
VQ(6)VQ(5)
VQ(7)
VQ(8)
VQ(2)
VQ(4)
VQ(3)
VQ(7)
(a) Query graph (b) Tree decomposition
V(1)
V(2) V(3)
V(4)
V(6)V(5)
V(7)
V(8)
sigma(X 3)
sigma(X 5)
(c ) Alignment subgraph
X 1
X 2 X 3
X 4 X 5
Fig. 2. (a) An example of a query graph with a treewidth of 2. (b) A tree decompositionof the query graph such that each super-node has no more than 3 query nodes associatedwith it. Non-active query nodes are grayed. (c) An alignment subgraph. σ(X3) andσ(X5) are mappings of the query nodes in X3 and X5 to graph vertices, respectively,that identify on the active query node VQ(6) in X5.
For the first issue, we exploit the fact that the treewidth is bounded by t.Large values of t would make the algorithm impractical. To cope with the seconddifficulty, we note that by definition, if v ∈ Xij and v �∈ Xi, then v �∈ Xl for allsuper-nodes Xl that are not descendants of Xi in the tree. Thus, when visitinga certain super-node Xij , it contains active query nodes XA
ij= Xi ∩ Xij that
are yet to be handled, and non-active nodes XNij
that can be removed fromconsideration when traversing up the tree (Figure 2b). We define a non-activeedge at a super-node Xi, as a query edge touching a non-active node in Xi. Welet EN
i denote the set of non-active edges in super-node Xi.We need some more notation before giving the main recurrence of the algo-
rithm. For each Xi ∈ X , let Σi denote the O(nt+1)-size set of all mappingsσ : Xi → V such that: (i) for all distinct q1, q2 ∈ Xi, c (σ(q1)) �= c (σ(q2)); and(ii) if (q1, q2) ∈ EQ then (σ(q1), σ(q2)) ∈ E. Figure 2b,c shows an example ofmappings between query nodes and graph vertices.
For computing the weight of an alignment, it is convenient to credit eachsuper-node i (when traversing up the tree) with the similarity scores associ-ated with its non-active nodes and the edge weights corresponding to its non-active edges. The node term is WS(i, σ) =
∑u∈XN
ih(u, σ(u)). The edge term is
WE(i, σ) =∑
(u1,u2)∈ENi
w(σ(u1), σ(u2)).Let W (i, σ, S) be the maximum weight of an alignment of a subgraph of GQ
that includes all super-nodes in Ti − Xi, identifies on the active query nodesin super-node i with the assignment σ ∈ Σi, and uses the colors in S ⊆ C.W (i, σ, S) can be recursively computed as follows. For a leaf i, W (i, σ, S) = 0.For all other super-nodes:

8 B. Dost et al.
W (i, σ, S) = maxS1 � S2 = S
σ1, σ2
2∑
j=1
[W (ij , σj , Sj) + W S(ij , σj) + W E(ij , σj)
]
where σ is consistent with σ1 ∈ Σi1 and σ2 ∈ Σi2 .The score of an optimal alignment of GQ is thus maxS W (d, ∅, S). The total
running time is 2O(k)nt+1.
4 Implementation Notes
We implemented a tool, QNet, for querying a given network with a tree subnet-work, following the algorithm given in Section 3.1. Bounded treewidth querieswill be supported in future versions. To allow higher flexibility in matching aquery, we slightly generalized the tree query algorithm to enable also deletions ofquery nodes of degree 1 (leaves of the tree). We also included in QNet a heuristicthat exploits the structure of the homology function to reduce the number ofcolor coding iterations needed. In the following we describe this heuristic andthe parameter setting employed in QNet.
Restricted Color Coding. We present a heuristic approach to color coding thattries to take advantage of queries whose protein members tend to have non-overlapping sets of homologs. First, we assign each query node a distinct matchcolor, and choose Nins additional insertion colors. Now, we color the networkvertices using the following rule: For each network vertex v, if v is not homologousto any query protein, then assign it with a random insertion colors. Otherwise,toss a coin with probability pt = Nins
k+Nins. If HEADS, choose a random insertion
color for it, else if TAILS, assign it with a random color from the set of querynodes it is homologous to.
The probability Ps to obtain a colorful alignment subgraph is at least theprobability that: (i) each aligned vertex is given a match color, and each insertedvertex is given an insertion color; and (ii) all colors are distinct. Let pm be theprobability that aligned vertices are colorful, and pi be the probability thatinsertion vertices are colorful. Then
Ps = (1 − pt)kpnit pipm =
(k
Nins + k
)k (Nins
k + Nins
)Nins
pipm
where pi ≥ Nins!Nins
Nins. It remains for us to compute a lower bound for pm. To
this end, we form a graph on the set of query nodes, in which for every pairq, q′ of query nodes, we add the edge (q, q′) if there exists a network vertex vthat is homologous to both. We then partition the query vertices into connectedcomponents Q1, Q2, . . . , Qk′ , and use the following bound: pm ≥
∏k′
u=1|Qu|!
|Qu||Qu| .We expect pm to be high since often query nodes are homologous to a singlevertex. When the probability of success with restricted coloring is greater thanthe probability of success with the standard color coding (i.e., (k+Nins)!
(k+Nins)k+Nins),
we use this procedure, and otherwise we use the standard color coding.

QNet: A Tool for Querying Protein Interaction Networks 9
Parameter Setting. QNet involves several parameters controlling sequence sim-ilarity, insertion/deletion penalties, and the relative weights of edge- and node-terms. The current settings are as follows:we used blastp with an E-value thresholdof 10−7 to compute sequence similarity, and set h(q, v) = −log(E-value). Inter-action reliabilities p(u, v) are assigned using a logistic regression scheme basedon the experimental evidences for the interactions, as described in [18]. We usew(u, v) = c · r(u, v), where c is chosen to ensure the same scale for the reliabilityand homology values. We allow at most two insertions and two deletions per query,i.e., Nins = Ndel = 2. Indel penalties are set to δd = δi = −100. We empiricallytested a range of penalties by querying perturbations of subtrees in the yeast net-work (see Section 5.1). A small set of queries were examined and the results did notchange over the range as long as the net influence of a deletion or insertion werekept negative. In all runs reported below, the number of color coding iterationswas set to ensure success probability ≥ 0.99.
5 Experimental Results
To evaluate the performance of QNet we measure its running time and accu-racy under various configurations. We start by applying QNet to query a setof synthetic trees in the PPI network of yeast, measuring its running time andaccuracy. Next, we show examples of querying known yeast and human signaltransduction pathways in the PPI network of fly. Finally, we apply QNet toquery known yeast complexes in fly.
Protein-protein interaction data for yeast S. cerevisiae and fly D. melanogasterwere obtained from the Database of Interacting Proteins (DIP) [20] (April 2005download). The fly data was complemented by PPI interactions from [19] and bygenetic interactions from FlyGRID (see also [18]). Altogether, the yeast networkconsists of 4,738 proteins and 15,147 interactions, and the fly network consistsof 7,481 proteins and 26,201 interactions.
5.1 Synthetic Query Trees
To measure the running time and estimate the accuracy of QNet, we applied itto query the PPI network of yeast with a set of synthetic query trees. This setconsists of 20 randomly chosen subtrees of sizes ranging from k = 5 to k = 9from the yeast PPI network. Each query tree was perturbed with up to 2 nodeinsertions and deletions, and by a pre-specified amount of point mutations inits proteins’ sequences of average length ∼ 500. QNet was applied to identify amatch for each query tree.
The running time measurements were performed on a standard PC (2GHz,1Gb). We find that the running time of QNet is a few seconds in all cases, reach-ing an average of 11 seconds for the largest tree queries with 9 nodes (Table 1).To measure the improvement in running time introduced by the restricted colorcoding heuristic, we applied QNet also without this heuristic. We find that re-stricted color coding significantly reduces the number of iterations required to

10 B. Dost et al.
Table 1. Number of color coding iterations and timing statistics for QNet. The lasttwo columns show the average time per query. The algorithm’s parameters are set asfollows: Nins = 2, Ndel = 2, and the probability of success is set to 0.99.
#Iterations Avg. time (sec.)Query Standard Restricted Standard Restrictedsize (k) color coding color coding color coding color coding5 752 603 1.71 1.586 1916 917 6.36 4.737 4916 1282 20.46 6.248 12690 1669 61.17 9.089 32916 2061 173.88 11.0310 85720 2509 1463 21.7411 223990 2987 5501 41.3912 1891868 4623 50455 97.93
identify the optimal match, while the running time of each iteration remainssimilar. Overall, restricted color coding reduces the running time by an order ofmagnitude on average (Table 1). The running time of the algorithm is signifi-cantly affected by the number of insertions allowed. If no insertions are allowed,the average number of iterations required for queries of size 9 is less than 100.When increasing the number of allowed insertions to above 2, the restricted colorcoding heuristic becomes less effective (data not shown).
To evaluate the accuracy of the matched trees, we computed the symmetricdifference between the protein set of a query and its match, termed their distanceherein. The results show that when perturbing protein sequences in up to 60%of the residues, the average distance between the matched tree and the originaltree is lower than 1 (Figure 3b). Moreover, we compared the accuracy of matchesobtained by QNet to matches that are based only on best BLAST hits. Wefound that matches obtained by QNet are markedly more accurate than purelysequence-based matches, showing that the topology of the query tree carriesimportant signal (Figure 3a). Evidently, the advantage of QNet over a sequence-based approach becomes more pronounced when the mutation rate increases.
5.2 Cross-Species Comparison of MAPK Pathways
The mitogen-activated protein kinase (MAPK) pathways are a collection of re-lated signal transduction pathways, which play a critical role in mediating thecellular response to various toxic stresses [5]. The pathways are known to beconserved across species and, hence, serve as controlled tests to QNet.
We queried MAPK pathways from the KEGG database [12] in the PPI networkof fly. The first pathway is a classical human MAPK pathway involved in cell pro-liferation and differentiation. Querying this pathway in fly resulted in detecting aknown MAPK pathway involved in dorsal pattern formation (Figure 4a). Specif-ically, 6 out of the 8 matched proteins in the target are members of the knownMAPK pathway in fly. Similar results were obtained by querying the yeast MAPKpathways from KEGG against the fly network. As an example, the top output for

QNet: A Tool for Querying Protein Interaction Networks 11
0 1 20
1
2
3
4
5
6
7
Total number of insertions and deletions
Ave
rage
dis
tanc
e
70% mutation60% mutation50% mutation0% mutation
0 1 20
1
2
3
4
5
6
7
Total number of insertions and deletions
Ave
rage
dis
tanc
e
70% mutation60% mutation50% mutation0% mutation
(a) (b)
Fig. 3. The average distance of the matched tree from the original tree is plotted againstthe total number of insertions and deletions introduced to the query for 4 differentmutation levels. (a) Performance of a sequence-based approach. (b) Performance ofQNet.
the starvation response pathway query (Figure 4b) is a fly MAPK pathway witha putative MAPK cascade (fray,Dsor1,rl), which includes the GTPases Cdc42,Ras64b that are homologous to the two GTPases in the query. These results sup-port the fidelity of QNet.
5.3 Cross-Species Comparison of Protein Complexes
As a large-scale validation of QNet we systematically queried known yeast pro-tein complexes, obtained from the MIPS database [16,9], in the fly network, andtested the biological plausibility of the identified matches. We included all handcurated complexes in MIPS, which are considered a reliable data source, ex-cluding complexes that were identified via high throughput measurements (cat-egory 550 in MIPS). Overall, we considered 94 complexes consisting of at least4 proteins each. As MIPS does not contain information on the topology of thecomplexes, we mapped each complex to the yeast network and used the in-duced subnetworks as queries. More accurately, for each complex, we extractedan average of 40 random query trees of size in the range 3 − 8 from its inducedsubnetwork. We applied QNet to systematically query all of the induced querytrees in fly. The resulting query matches were used to construct a consensusmatch, consisting of all proteins that appeared in at least half of the matches.
The biological plausibility of an obtained consensus matches was tested basedon functional enrichment of their member proteins w.r.t. the fly gene ontology(GO) process annotation [2]. Specifically, let n(t) denote the number of genes inthe consensus match that are annotated with term t. We compute the probabilityp(t) of obtaining a random set of genes, of the same size as the original path-way, with at least n(t) genes annotated with term t, assuming a hypergeometric

12 B. Dost et al.
EGFR
SOS1
GRB2
Gap1m
MEK1
ERK
Ras
Raf1
egfr
C3G
csw
Gap1
Dsor1
rl
Ras85D
phl
Ste20
Cdc42
Ras2
Ste11
Ste7
Kss1
msn
Cdc42
Ras64B
fray
Dsor1
rl
(a) (b)
Fig. 4. Querying the fly network using (a) a human MAPK pathway, and (b) a yeastMAPK pathway induced by starvation, taken from the KEGG database [12]. Matchednodes appear on the same horizontal line. A dotted edge represents inserted proteins(not shown).
Cdc28
CLB2
CLB1
CLB3
CLB4
CLB5
CLN3
CLN2
CLN1
Cdc2
CycB
CycE
CycB3
CycA
CycD
CycJ
CycK
png
CycC
Cdk5
(a) (b)
Fig. 5. (a) The MIPS Cdc28p complex. (b) The consensus match in fly. Matched nodesappear on the same horizontal line. Inserted proteins appear in white.
distribution. Having found a term t0 with minimal probability p(t0), we computea p-value for the enrichment under term t0 by comparing p(t0) with similarvalues computed for 10, 000 random sets of genes. The latter p-values are furthercorrected for multiple match testing via the false discovery rate procedure [3].
36 of the yeast complexes resulted in a consensus match with more than oneprotein in fly. We find that 72% of these consensus matches are significantlyfunctionally enriched (p < 0.05). For comparison, we computed the functionalenrichment of randomly chosen trees from the fly PPI network that have thesame distribution of sizes and interactions scores as the consensus matches. Wefind that only 17% of the random trees are functionally enriched, and that themean enrichment p-values is significantly lower for the true consensus matches(Wilcoxon rank test p-value< 6.5e − 9).

QNet: A Tool for Querying Protein Interaction Networks 13
Figure 5 illustrates the result of querying the Cdc28p complex. This complexis composed of cyclin-dependent kinases involved in regulating the cell cycle inyeast. The consensus match obtained in fly consists solely of cyclin-dependent ki-nases and significantly overlaps the cyclin-dependent protein kinase holoenzymecomplex (GO:0000307).
6 Conclusion
Data sets of protein-protein interactions are increasingly common, and will con-tinue to increase in number and complexity. In this paper, we address the problemof searching such data for specific pathways of interest. We provide efficient algo-rithms for querying trees and graphs of bounded treewidth within PPI networks.We implement the tree query algorithm, QNet, and demonstrate its efficiency andaccuracy. QNet can handle queries of up to 9 proteins in seconds on current net-works, and is shown to outperform sequence-based homology searches. More im-portantly, we use QNet to perform a large scale cross-species comparison of proteincomplexes, by querying known yeast complexes in the fly network. This compar-ison points to strong conservation between the two species.
While our work has helped in clarifying some algorithmic questions regardingefficient querying of biological networks, and has shown promising results inpractice, it leaves many aspects open for future research. One important directionis the development of appropriate score functions to better identify conservedpathways. Research in this direction could gain from probabilistic models ofnetwork evolution [4,10]. A second important direction is the application of themethods developed here to queries of more general structure. This entails boththe implementation and testing of a tool for querying bounded treewidth graphs,and the use of such a tool for querying arbitrary structures, perhaps in a waysimilar to that presented in Section 5.2.
Acknowledgments
We thank Eyal Kaplan for critical reading of the manuscript. B.D. and V.B.were supported in part by the NSF grant CCF-0425926, T.S. was supported bythe Tauber fund, and R.S. was supported by an Alon fellowship. This researchwas supported in part by a research grant from the Ministry of Science andTechnology, Israel.
References
1. N. Alon, R. Yuster, and U. Zwick. Color-coding. Journal of the ACM, 42(4):844–856,1995.
2. M. Ashburner et al. The gene onthology consortium. gene onthology: Toll for theunification of biology. Nature Genetics, 25:25–29, 2000.
3. Y. Benjamini and Y. Hochberg. Controlling the false discovery rate: a practicaland powerful approach to multiple testing. J. R. Stat. Soc. B, 57:289–300, 1995.

14 B. Dost et al.
4. J. Berg, M. Lassig, and A. Wagner. Structure and evolution of protein interactionnetworks: A statistical model for link dynamics and gene duplications. Bio. Med.Center Evolutionary Biology, 4:51, 2001.
5. P. Dent, A. Yacoub, P. B. Fisher, M. P. Hagan, and S. Grant. Mapk pathways inradiation responses. Oncogene, 22(37):5885–5896, Sep 2003.
6. S. F and Z. R. Identifying active transcription factors and kinases from expressiondata using pathway queries. Bioinformatics, 21(Suppl 2):ii115–ii122, Sep 2005.
7. M. R. Garey and D. S. Johnson. Computers and Intractability: A Guide to theTheory of NP-Completeness. W. H. Freeman and Co., San Francisco, 1979.
8. M. R. Garey and D. S. Johnson. Computers and Intractability: A Guide to theTheory of NP-completeness. W. H. Freeman and Company, 1979.
9. U. Guldener, M. Munsterkotter, M. Oesterheld, P. Pagel, A. Ruepp, H.-W. Mewes,and V. Stumpflen. MPact: the MIPS protein interaction resource on yeast. NucleicAcids Res, 34(Database issue):436–441, Jan 2006.
10. E. Hirsh and R. Sharan. Identification of conserved protein complexes based on amodel of protein network evolution. In Fifth European Conference on Computa-tional Biology (ECCB’06), 2006. To appear.
11. T. Ito, T. Chiba, and M. Yoshida. Exploring the yeast protein interactome usingcomprehensive two-hybrid projects. Trends Biotechnology, 19:23–27, 2001.
12. M. Kanehisa, S. Goto, S. Kawashima, Y. Okuno, and M. Hattori. The KEGG re-source for deciphering the genome. Nucleic Acids Res, 32(Database issue):277–280,Jan 2004.
13. B. P. Kelley, R. Sharan, R. M. Karp, T. Sittler, D. E. Root, B. R. Stockwell, andT. Ideker. Conserved pathways within bacteria and yeast as revealed by globalprotein network alignment. Proc Natl Acad Sci U S A, 100(20):11394–9, 2003.
14. T. Kloks. Treewidth: computations and approximations. Springer-Verlag, 1994.15. M. Mann, R. Hendrickson, and A. Pandey. Analysis ures of proteins and proteomes
by mass spectrometry. Annu. Rev. Biochem, 70:437–473, 2001.16. H. W. Mewes, D. Frishman, K. F. Mayer, M. Munsterkotter, O. Noubibou, P. Pagel,
T. Rattei, M. Oesterheld, A. Ruepp, and V. Stumpflen. MIPS: analysis and an-notation of proteins from whole genomes in 2005. Nucleic Acids Res, 34(Databaseissue):169–172, Jan 2006.
17. R. Y. Pinter, O. Rokhlenko, E. Yeger-Lotem, and M. Ziv-Ukelson. Alignment ofmetabolic pathways. Bioinformatics, 21(16):3401–8, 2005.
18. T. Shlomi, D. Segal, E. Ruppin, and R. Sharan. QPath: A Method for QueryingPathways in a Protein-Protein Interaction Network. BMC Bioinformatics, 7(199),2006.
19. C. A. Stanyon, G. Liu, B. A. Mangiola, N. Patel, L. Giot, B. Kuang, H. Zhang,J. Zhong, and J. Finley, R. L. A Drosophila protein-interaction map centered oncell-cycle regulators. Genome Biol, 5(12):R96, 2004.
20. I. Xenarios, D.W.Rice, L. Salwinski, M.K.Baron, E.M.Marcotte, andD.Eisenberg.DIP: the database of interacting proteins. Nucleic Acids Res, 28(1):289–91, 2000.

QNet: A Tool for Querying Protein Interaction Networks 15
Appendix: A General Alignment Algorithm for BoundedTreewidth Queries
In Section 3.2 we described an algorithm for identifying optimal simple align-ments of a bounded treewidth query graph. To generalize the algorithm to sup-port deletions, we modify the mapping σ to allow mapping to ‘0’. To supportinsertions, we allow σ to map connected query nodes to non-connected graphvertices, and use additional Nins color (as in Section 3.1).
Given the new definition of σ, the node term is modified as follows:
WS(i, σ) = δd|{u ∈ XNi : σ(u) = 0}| +
∑
u∈XNi ,σ(u) �=0
h(u, σ(u))
The edge term is more problematic as it depends on the subset of colors usedfor insertions, and requires some preprocessing. For a pair of vertices u, v ∈ Vand a set of colors S ⊆ C −{c(u), c(v)}, we denote by WP (u, v, S) the maximumweight of a path between u and v that visits the colors in S. Given a set of vertexpairs R = R(l) = {(r1
1 , r22), . . . , (r1
l , r2l )}, we define WP (R, S) as the maximum
weight of |R| simple paths between all vertex pairs that visit distinct colorsfrom S:
WP (R, S) = maxS1, S2, . . . Sq
⊎Sl = S
q∑
l=1
WP (r1l , r2
l , Sl)
In order to compute WP (R, S) efficiently, we use the following recurrence:
WP (R(l), S) = maxS′⊂S
[WP ((r1i , r2
i ), S′) + WP (R(l − 1), S − S′) ]
Define Ei(σ) as the set of graph vertex pairs that are mapped from non-activeedges in super-node i:
Ei(σ) = {(u, v) ∈ E : (u′, v′) ∈ ENi , σ(u′) = u, σ(v′) = v}
The edge term for super-node i under the mapping σ and colors S, is:
WE(i, σ, S) = WP (Ei(σ), S)
Finally, we modify the main recursion as follows:
W (i, σ, S)= maxS1 � S2 = S,
S′1 ⊂ S1, S
′2 ⊂ S2,
σ1, σ2
2∑
j=1
[W (ij , σj , Sj −S′
j) + W S(ij , σj) + W E(ij , σj , S′j)
]
To compute the running time of the preprocessing stage, note that WP ((u, v),S)) can be pre-computed for all S in O(n22k) time. Therefore, WP (Ei(σ), S)can be pre-computed in 2O(k)nt+1 time, and hence the total running time is2O(k)nt+1.