local authority carbon dioxide emissions estimates 2015
TRANSCRIPT

LOCAL AUTHORITY CARBON DIOXIDE EMISSIONS ESTIMATES 2015
Statistical Release: National Statistics
29 June 2017

© Crown copyright 2017
You may re-use this information (not including logos) free of charge in any format or medium, under the terms of the Open Government Licence.
To view this licence, visit www.nationalarchives.gov.uk/doc/open-government-
licence/version/3/ or write to the Information Policy Team, The National Archives, Kew,
London TW9 4DU, or email: [email protected].
Any enquiries regarding this publication should be sent to us at
The responsible statistician for this publication is Amanda Penistone. Contact telephone: 0300 068 8090.
This publication is available for download at
https://www.gov.uk/government/collections/uk-local-authority-and-regional-carbon-
dioxide-emissions-national-statistics.
Contents
Executive Summary ___________________________________________________ 3
Introduction _________________________________________________________ 5
Use of the Estimates __________________________________________________ 6
2015 Emissions _______________________________________________________ 7
2015 emissions by region ____________________________________________ 7
Methodological improvements since last year and revisions to the data for 2005 to
2015 _______________________________________________________________ 15
Emissions trends since 2005 ____________________________________________ 16
Regional trends since 2005 ___________________________________________ 16
Local Authority trends since 2005 ______________________________________ 18
Sub-Sectoral Trends since 2005 ________________________________________ 19
Carbon dioxide emissions within the scope of influence of Local Authorities ______ 21
Reconciliation with the UK inventory ______________________________________ 23
Reconciliation Table _________________________________________________ 23
Main differences between the Local Authority (LA) dataset and the Devolved
Administrations (DA) datasets _________________________________________ 24
UK maps ____________________________________________________________ 27
Further Information ___________________________________________________ 33
Future updates to emissions estimates ____________________________________ 34
Notes for Editors _____________________________________________________ 35
Executive Summary
3
Executive Summary
This National Statistics publication provides the latest estimates of carbon dioxide emissions
for Local Authority (LA) areas for 2005-2015. This report explains the background to the
estimates, summarises the key results, and discusses some of the issues which need to be
considered when using the data. Full details of the results and methodology are available in
the Technical Report and accompanying spreadsheet, which can be found at the link below:
https://www.gov.uk/government/collections/uk-local-authority-and-regional-carbon-dioxide-
emissions-national-statistics
Main Findings:
Emissions on an end-user basis (i.e. where emissions are distributed according to the
point of energy consumption or point of emission if not energy related) have been
assigned to all 391 Local Authorities in the UK: 326 of these are in England, 32 in
Scotland, 22 in Wales and 11 in Northern Ireland.
Since 2014, emissions have decreased in 325 out of the 391 Local Authorities (83
percent). This is consistent with the decrease in overall UK emissions from 2014 to 2015.
The main drivers of the decrease in UK emissions in 2015 were a change in the fuel mix
for electricity generation, with a decrease in the use of coal and more use of nuclear and
renewables.
Overall in 2015, 40 percent of end-user emissions assigned to Local Authority areas
(excluding emissions from Land Use, Land Use Change and Forestry (LULUCF)) were
attributed to the industry and commercial sector, 27 percent to the domestic sector, and 32
percent to transport. There are wide local variations on this mainly because of the
economy and geography of different local areas.
The transport sector had the highest share of end-user emissions in 42 percent of
authorities. The industrial and commercial sector had the highest share in 36 percent and
the domestic sector had the highest share in 22 percent of authorities.
In 2015, about 54 percent of domestic end-user emissions came from gas use and 36
percent were due to electricity consumption.
In 2015, domestic end-user emissions were less than 2 tonnes per person in 91 percent of
LAs, between 2 and 2.5 tonnes per person in 9 percent and above 2.5 tonnes per person
in 1 Local Authority.

Executive Summary
4
Figure 1: Summary of key findings
zxx
Greater London has the smallest and Wales has the largest CO2 per capita emissions for 2015
6.1
7.4
8.7
5.4 5.4
5.8
6.7
6.8 5.7
7.2
5.7
0 3.8
Emissions per capita (per person) allow comparison between areas of different population size. However, emissions are driven by many factors other than resident population.
The North East experienced the largest percentage reduction in CO2 emissions from 2005 to 2015
Northern Ireland has the
largest source of Land Use,
Land Use Change and
Forestry (LULUCF) per capita
emissions (0.3 t CO2 per
person) due to clearing of
grassland for the maintenance
and creation of settlements
and croplands which gives
rise to emissions as soil
carbon is lost.
Wales CO2 per capita emissions are
higher compared to other regions due
to large CO2 per capita emissions from
the industrial and commercial sector
(5.0 t CO2 per person) reflecting the
high level of industrial emissions
compared to the population.
Scotland has the second largest sink of
Land Use, Land Use Change and
Forestry (LULUCF) per capita
emissions (-0.4 t CO2 per person) due
to forest land occupying a large
proportion of land area.
North East has the largest sink of
LULUCF CO2 per capita emissions (-1.6 t
CO2 per person) due to its large area of
forest land. Also, the North East has the
highest CO2 per capita emissions from
the industrial and commercial sector (5.1 t
CO2 per person) reflecting the industrial
base.
Greater London has the lowest
CO2 per capita emissions
compared to other regions due
to the urban nature of the
transport system, a high
population density and a
greater proportion of residential
areas meaning large industrial
facilities are unlikely to be
located in the region.
Introduction
5
Introduction
The UK compiles an annual inventory of its greenhouse gas (GHG) emissions in order to
monitor progress against domestic and international targets such as the Kyoto Protocol.
Disaggregated versions of the UK inventory are also produced for England, Scotland, Wales
and Northern Ireland, along with maps estimating the geographical distribution of the sources
of emissions.
Carbon dioxide (CO2) is the main greenhouse gas, accounting for about 81 percent of the UK
greenhouse gas emissions in 2015. This publication combines data from the UK’s GHG
inventory with data from a number of other sources, including local energy consumption
statistics, to produce a nationally consistent set of carbon dioxide emissions estimates at
Local Authority level.
The statistics show emissions allocated on an “end-user” basis where emissions are
distributed according to the point of energy consumption (or point of emission if not energy
related). Except for the energy industry, emissions from the production of goods are assigned
to where the production takes place. Therefore, emissions from the production of goods
which are exported will be included, and emissions from the production of goods which are
imported are excluded.
The statistics are largely consistent with the UK national GHG inventory and with the
Devolved Administration GHG inventories, but there are some minor methodological
differences which are explained later in this publication. If you are looking for emissions
figures at UK or DA level, you should use the UK1 or DA2 inventories rather than this
publication.
These statistics cover the period from 2005 to 2015. A consistent time series has been
produced by re-calculating the 2005 to 2014 estimates to reflect the methodological changes
used in calculating the 2015 estimates. This is important as it allows changes to be monitored
over time.
Full details of the results and methodology are available in the supplementary reports and
files published alongside this statistical release.
1 Final UK greenhouse gas emissions, 1990-2015
https://www.gov.uk/government/collections/final-uk-greenhouse-gas-emissions-national-statistics 2 Devolved Administration Greenhouse Gas Inventories
http://naei.defra.gov.uk/reports/reports?report_id=932

Use of the Estimates
6
Use of the Estimates
The purpose of these estimates is to assist those wishing to understand and assess changes
in Local Authority emissions. Local Authorities are not mandated to have greenhouse gas
emissions reductions targets, but some Local Authorities do have such targets. These
statistics allow Local Authorities to track their GHG emissions trends over time, and measure
progress against any targets they have. While Local Authorities are the main users of the
statistics, other users include non-profit organisations, the Devolved Administrations,
government departments, and academia.
It is important to bear in mind that circumstances vary greatly between authorities, and that
Local Authorities have relatively little influence over some types of emissions. For all these
reasons, these statistics should be interpreted with caution. However, used with care they
can provide help in setting priorities. In particular, the dataset is sufficiently robust to set a
baseline against which action on climate change can be monitored at a local level.
It should be noted that the results for regional level, which are also available from the
dataset, are much more robust. Most of the difficulties in allocating data to Local Authorities
have little impact at regional level. Problems of interpretation, such as economic activity or
transport taking place across boundaries, still exist but are less acute at the regional level
than at the local level.
There are some important limitations that users of these estimates should be aware of.
These include:
Unallocated electricity where electricity sales within the sub-national dataset cannot be
successfully allocated to specific LAs, due to lack of information.
Transport emission estimates rely on national traffic statistics, and distribution of traffic on
minor roads has had to be imputed at local level from regional level data.
The local distribution of emissions from sources other than gas, electricity generation or
transport largely has to be estimated from proxy information such as population or
employment data.
Some of the key sources used for mapping emissions do not cover the whole of the UK,
and therefore alternative methods have had to be used for authorities in Northern Ireland.
Further details on data quality and the methods used are available in the supplementary
reports published alongside this statistical release.
2015 Emissions
7
2015 Emissions
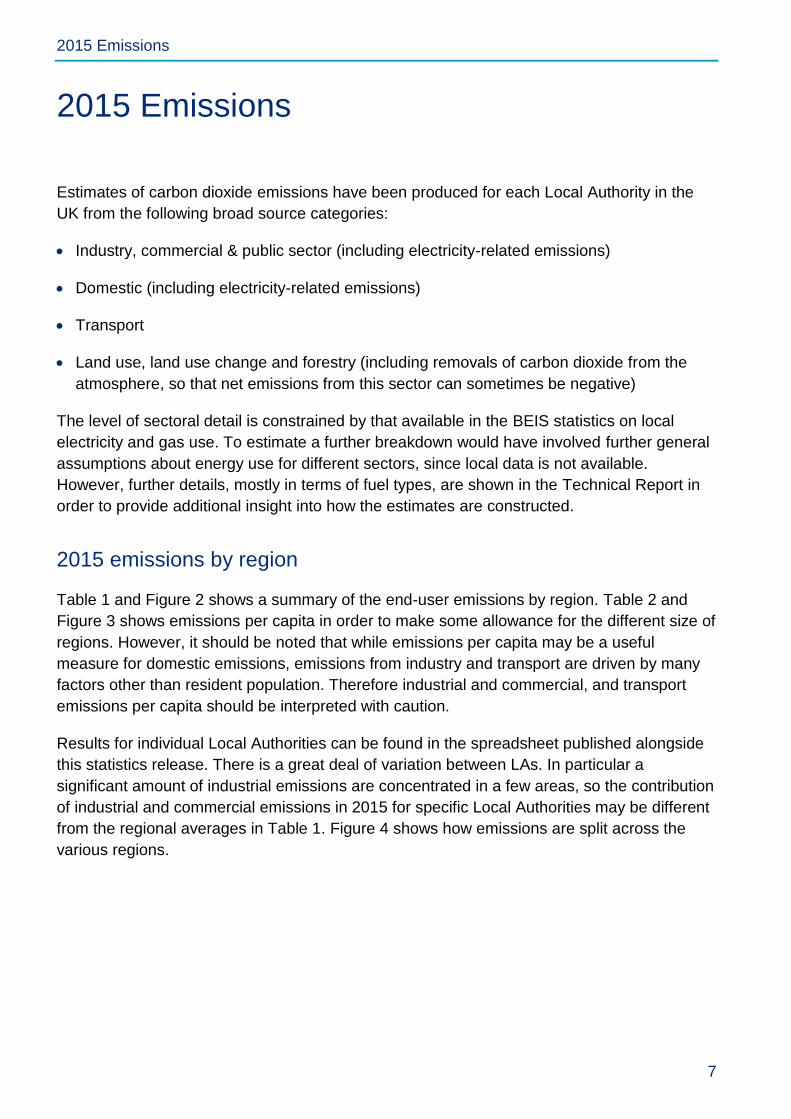
Estimates of carbon dioxide emissions have been produced for each Local Authority in the
UK from the following broad source categories:
Industry, commercial & public sector (including electricity-related emissions)
Domestic (including electricity-related emissions)
Transport
Land use, land use change and forestry (including removals of carbon dioxide from the
atmosphere, so that net emissions from this sector can sometimes be negative)
The level of sectoral detail is constrained by that available in the BEIS statistics on local
electricity and gas use. To estimate a further breakdown would have involved further general
assumptions about energy use for different sectors, since local data is not available.
However, further details, mostly in terms of fuel types, are shown in the Technical Report in
order to provide additional insight into how the estimates are constructed.
2015 emissions by region
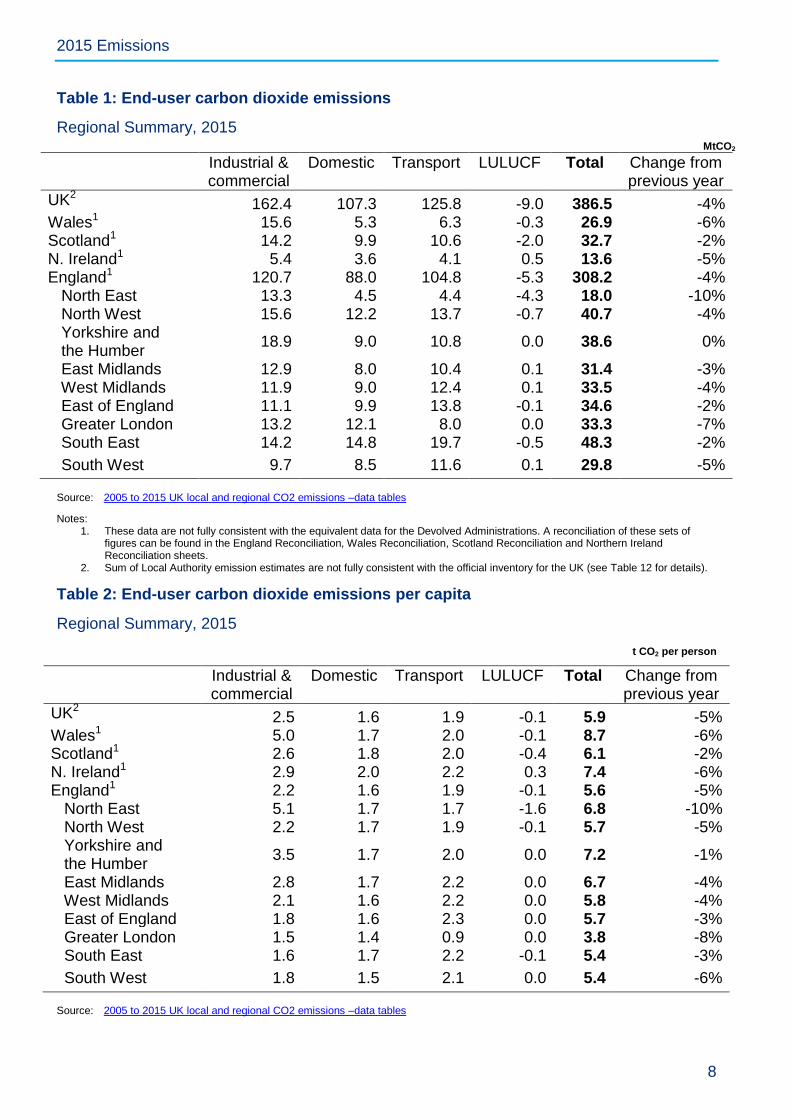
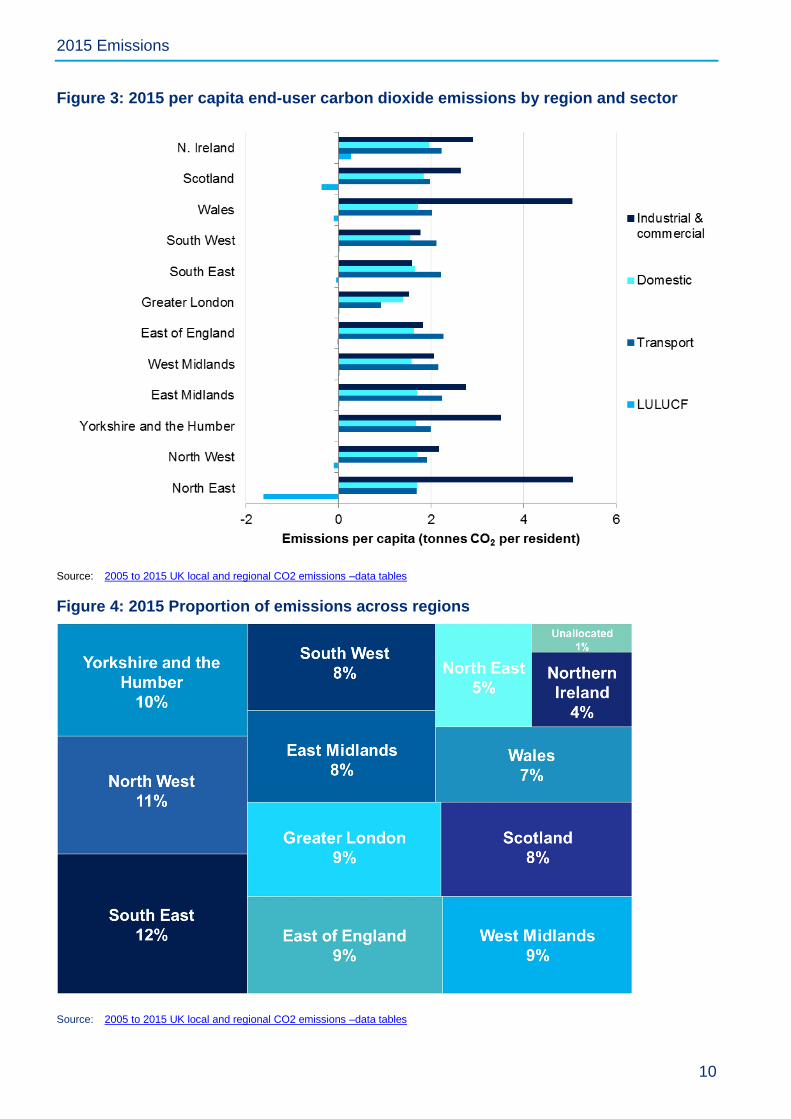
Table 1 and Figure 2 shows a summary of the end-user emissions by region. Table 2 and
Figure 3 shows emissions per capita in order to make some allowance for the different size of
regions. However, it should be noted that while emissions per capita may be a useful
measure for domestic emissions, emissions from industry and transport are driven by many
factors other than resident population. Therefore industrial and commercial, and transport
emissions per capita should be interpreted with caution.
Results for individual Local Authorities can be found in the spreadsheet published alongside
this statistics release. There is a great deal of variation between LAs. In particular a
significant amount of industrial emissions are concentrated in a few areas, so the contribution
of industrial and commercial emissions in 2015 for specific Local Authorities may be different
from the regional averages in Table 1. Figure 4 shows how emissions are split across the
various regions.
2015 Emissions
8
Table 1: End-user carbon dioxide emissions
Regional Summary, 2015 MtCO2
Industrial & commercial
Domestic Transport LULUCF Total Change from previous year
UK2 162.4 107.3 125.8 -9.0 386.5 -4% Wales1 15.6 5.3 6.3 -0.3 26.9 -6% Scotland1 14.2 9.9 10.6 -2.0 32.7 -2% N. Ireland1 5.4 3.6 4.1 0.5 13.6 -5% England1 120.7 88.0 104.8 -5.3 308.2 -4% North East 13.3 4.5 4.4 -4.3 18.0 -10% North West 15.6 12.2 13.7 -0.7 40.7 -4% Yorkshire and the Humber
18.9 9.0 10.8 0.0 38.6 0%
East Midlands 12.9 8.0 10.4 0.1 31.4 -3% West Midlands 11.9 9.0 12.4 0.1 33.5 -4% East of England 11.1 9.9 13.8 -0.1 34.6 -2% Greater London 13.2 12.1 8.0 0.0 33.3 -7% South East 14.2 14.8 19.7 -0.5 48.3 -2%
South West 9.7 8.5 11.6 0.1 29.8 -5% Source: 2005 to 2015 UK local and regional CO2 emissions –data tables
Notes: 1. These data are not fully consistent with the equivalent data for the Devolved Administrations. A reconciliation of these sets of
figures can be found in the England Reconciliation, Wales Reconciliation, Scotland Reconciliation and Northern Ireland Reconciliation sheets.
2. Sum of Local Authority emission estimates are not fully consistent with the official inventory for the UK (see Table 12 for details).
Table 2: End-user carbon dioxide emissions per capita
Regional Summary, 2015
t CO2 per person
Industrial & commercial
Domestic Transport LULUCF Total Change from previous year
UK2 2.5 1.6 1.9 -0.1 5.9 -5% Wales1 5.0 1.7 2.0 -0.1 8.7 -6% Scotland1 2.6 1.8 2.0 -0.4 6.1 -2% N. Ireland1 2.9 2.0 2.2 0.3 7.4 -6% England1 2.2 1.6 1.9 -0.1 5.6 -5% North East 5.1 1.7 1.7 -1.6 6.8 -10% North West 2.2 1.7 1.9 -0.1 5.7 -5% Yorkshire and the Humber
3.5 1.7 2.0 0.0 7.2 -1%
East Midlands 2.8 1.7 2.2 0.0 6.7 -4% West Midlands 2.1 1.6 2.2 0.0 5.8 -4% East of England 1.8 1.6 2.3 0.0 5.7 -3% Greater London 1.5 1.4 0.9 0.0 3.8 -8% South East 1.6 1.7 2.2 -0.1 5.4 -3%
South West 1.8 1.5 2.1 0.0 5.4 -6%
Source: 2005 to 2015 UK local and regional CO2 emissions –data tables
2015 Emissions
9
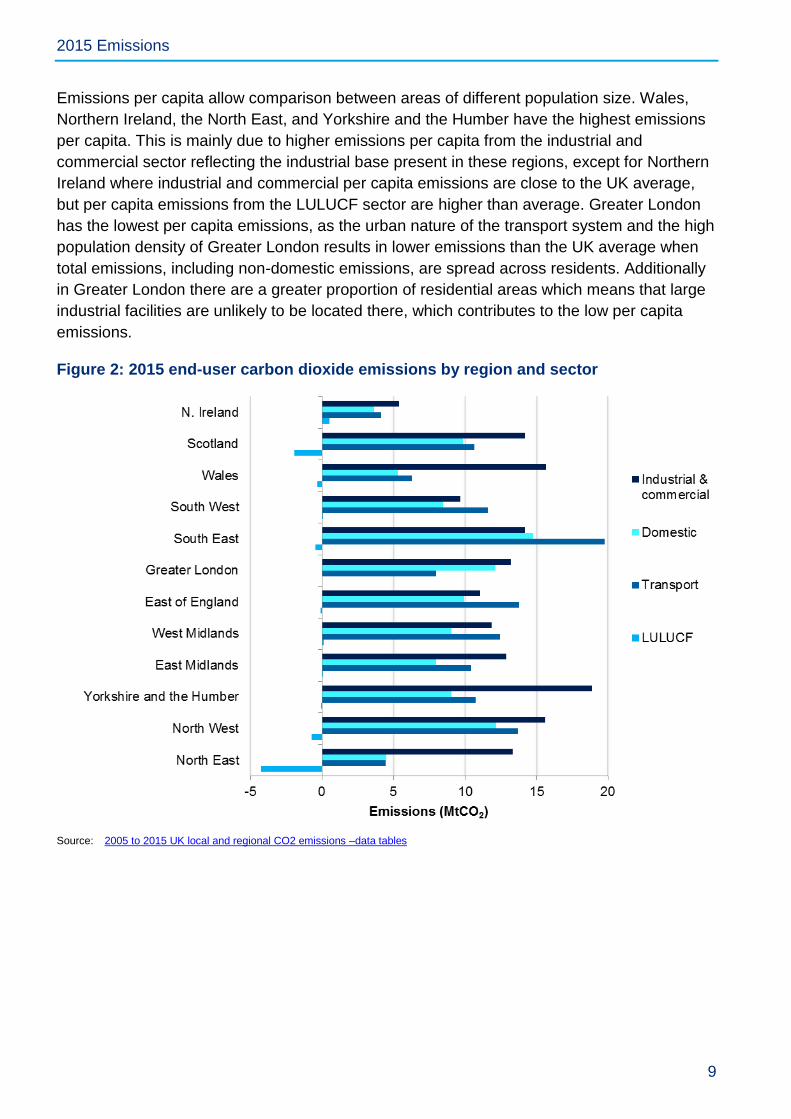
Emissions per capita allow comparison between areas of different population size. Wales,
Northern Ireland, the North East, and Yorkshire and the Humber have the highest emissions
per capita. This is mainly due to higher emissions per capita from the industrial and
commercial sector reflecting the industrial base present in these regions, except for Northern
Ireland where industrial and commercial per capita emissions are close to the UK average,
but per capita emissions from the LULUCF sector are higher than average. Greater London
has the lowest per capita emissions, as the urban nature of the transport system and the high
population density of Greater London results in lower emissions than the UK average when
total emissions, including non-domestic emissions, are spread across residents. Additionally
in Greater London there are a greater proportion of residential areas which means that large
industrial facilities are unlikely to be located there, which contributes to the low per capita
emissions.
Figure 2: 2015 end-user carbon dioxide emissions by region and sector
Source: 2005 to 2015 UK local and regional CO2 emissions –data tables
2015 Emissions
10
Figure 3: 2015 per capita end-user carbon dioxide emissions by region and sector
Source: 2005 to 2015 UK local and regional CO2 emissions –data tables
Figure 4: 2015 Proportion of emissions across regions
Source: 2005 to 2015 UK local and regional CO2 emissions –data tables
2015 Emissions
11
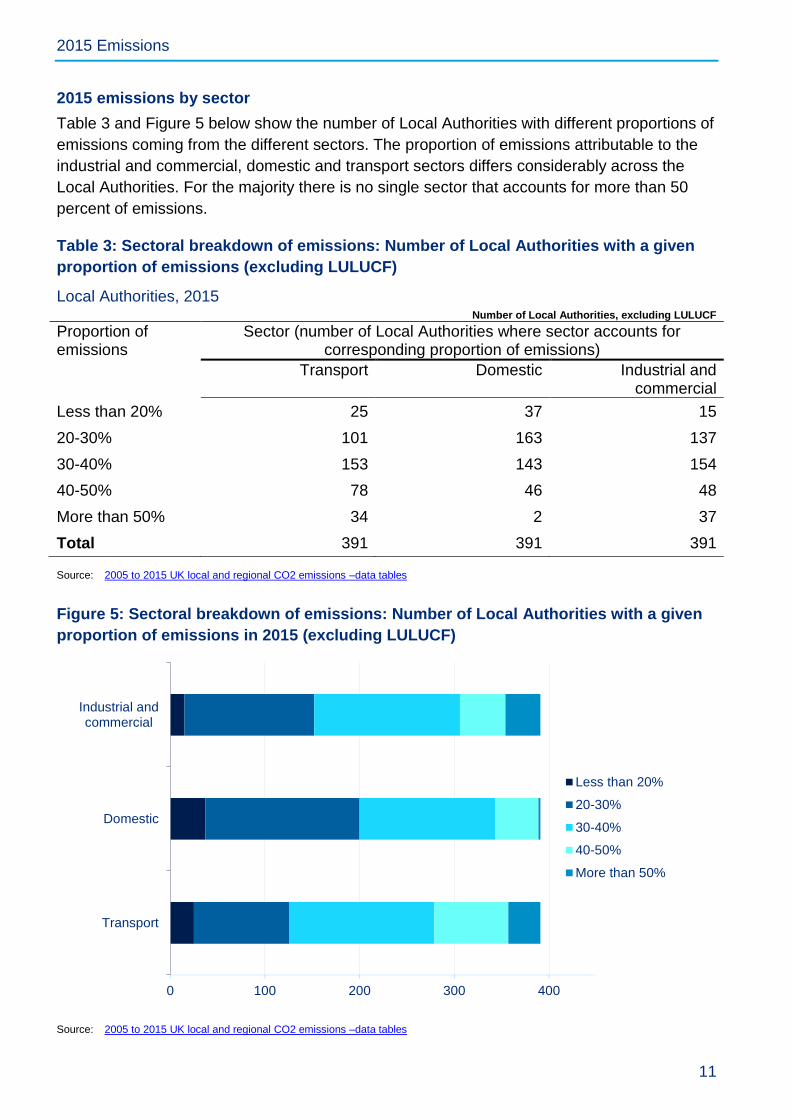
2015 emissions by sector
Table 3 and Figure 5 below show the number of Local Authorities with different proportions of
emissions coming from the different sectors. The proportion of emissions attributable to the
industrial and commercial, domestic and transport sectors differs considerably across the
Local Authorities. For the majority there is no single sector that accounts for more than 50
percent of emissions.
Table 3: Sectoral breakdown of emissions: Number of Local Authorities with a given
proportion of emissions (excluding LULUCF)
Local Authorities, 2015 Number of Local Authorities, excluding LULUCF
Proportion of emissions
Sector (number of Local Authorities where sector accounts for corresponding proportion of emissions)
Transport Domestic Industrial and commercial
Less than 20% 25 37 15
20-30% 101 163 137
30-40% 153 143 154
40-50% 78 46 48
More than 50% 34 2 37
Total 391 391 391 Source: 2005 to 2015 UK local and regional CO2 emissions –data tables
Figure 5: Sectoral breakdown of emissions: Number of Local Authorities with a given
proportion of emissions in 2015 (excluding LULUCF)
Source: 2005 to 2015 UK local and regional CO2 emissions –data tables
0 100 200 300 400
Transport
Domestic
Industrial andcommercial
Less than 20%
20-30%
30-40%
40-50%
More than 50%
2015 Emissions
12
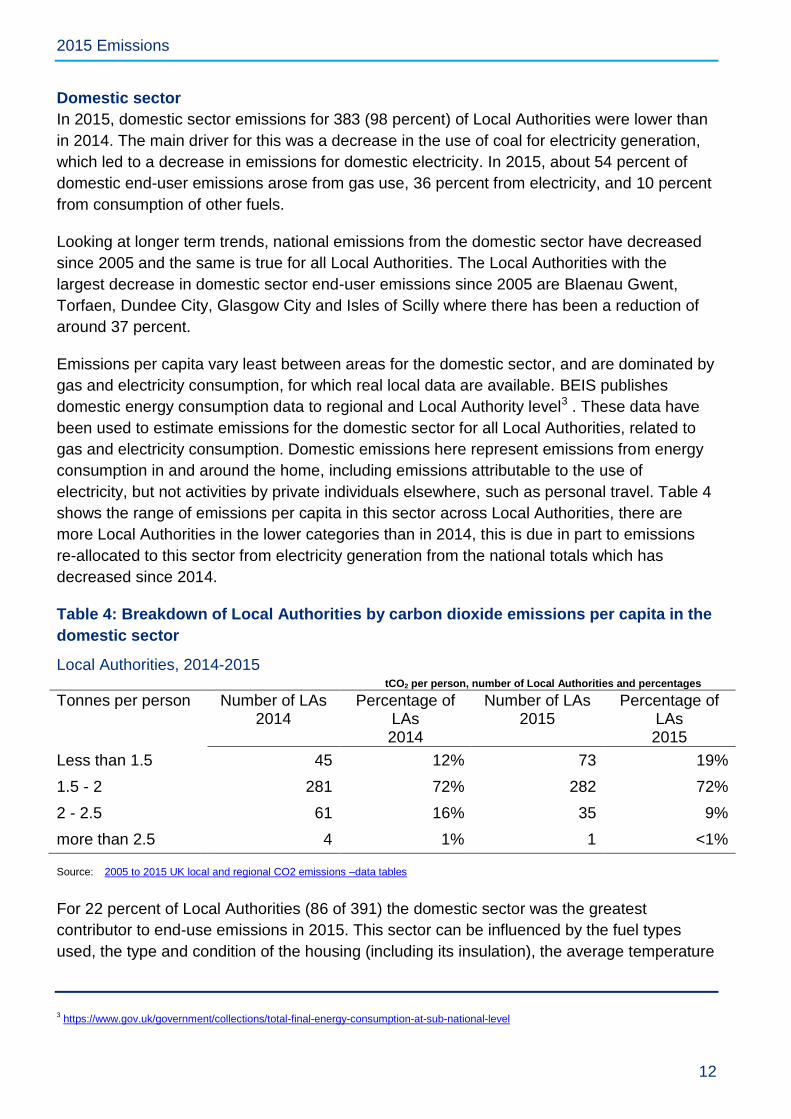
Domestic sector
In 2015, domestic sector emissions for 383 (98 percent) of Local Authorities were lower than
in 2014. The main driver for this was a decrease in the use of coal for electricity generation,
which led to a decrease in emissions for domestic electricity. In 2015, about 54 percent of
domestic end-user emissions arose from gas use, 36 percent from electricity, and 10 percent
from consumption of other fuels.
Looking at longer term trends, national emissions from the domestic sector have decreased
since 2005 and the same is true for all Local Authorities. The Local Authorities with the
largest decrease in domestic sector end-user emissions since 2005 are Blaenau Gwent,
Torfaen, Dundee City, Glasgow City and Isles of Scilly where there has been a reduction of
around 37 percent.
Emissions per capita vary least between areas for the domestic sector, and are dominated by
gas and electricity consumption, for which real local data are available. BEIS publishes
domestic energy consumption data to regional and Local Authority level3 . These data have
been used to estimate emissions for the domestic sector for all Local Authorities, related to
gas and electricity consumption. Domestic emissions here represent emissions from energy
consumption in and around the home, including emissions attributable to the use of
electricity, but not activities by private individuals elsewhere, such as personal travel. Table 4
shows the range of emissions per capita in this sector across Local Authorities, there are
more Local Authorities in the lower categories than in 2014, this is due in part to emissions
re-allocated to this sector from electricity generation from the national totals which has
decreased since 2014.
Table 4: Breakdown of Local Authorities by carbon dioxide emissions per capita in the
domestic sector
Local Authorities, 2014-2015 tCO2 per person, number of Local Authorities and percentages
Tonnes per person Number of LAs 2014
Percentage of LAs 2014
Number of LAs 2015
Percentage of LAs 2015
Less than 1.5 45 12% 73 19%
1.5 - 2 281 72% 282 72%
2 - 2.5 61 16% 35 9%
more than 2.5 4 1% 1 <1% Source: 2005 to 2015 UK local and regional CO2 emissions –data tables
For 22 percent of Local Authorities (86 of 391) the domestic sector was the greatest
contributor to end-use emissions in 2015. This sector can be influenced by the fuel types
used, the type and condition of the housing (including its insulation), the average temperature
3 https://www.gov.uk/government/collections/total-final-energy-consumption-at-sub-national-level

2015 Emissions
13
(urban areas can be much warmer and therefore easier to heat than rural areas), average
household size, type of household and the income and preferences of the occupiers.
Transport sector
Transport emissions include freight and passenger transport, both private and for business
purposes. The estimates are made on the basis of the distribution of traffic, therefore some of
the emissions within an authority represent through traffic, or part of trips into or out of the
area, whether by residents or non-residents. In some authorities this can be particularly
significant, and the issue has to be borne in mind when looking at either totals or per capita
estimates. The Technical Report shows how the estimates break down between major and
minor roads, to help with consideration of this point. On the end-user basis, transport
emissions include a share of emissions from oil refineries.
National transport emissions showed a small increase in 2015 and this is reflected in the
emission for Local Authorities where more than three-quarters (333 out of 391) had an
increase in emissions (average increase of 2.1 percent).
Since 2005 national transport emissions have showed a decrease, even though there has
been an increase in both the number of passenger vehicles and the vehicle kilometres
travelled4. This is due to lower petrol consumption by passenger cars and improvements in
fuel efficiency. This is reflected in Local authorities where 97 percent (381 out of 391) have
seen a decrease in emissions since 2005.
Industrial, commercial and public sector
These emissions are dominated by industrial and commercial electricity consumption. The
estimates are based on sub-national electricity consumption data published by BEIS5 , which
have been used to map carbon dioxide emissions from electricity generation to the point of
consumption. For some Local Authorities, emissions from large industrial installations will be
the dominant factor, and these have been mapped using the National Atmospheric Emissions
Inventory database of point sources.
Most Local Authorities (331 out of 391) in the UK have experienced a decrease in emissions
from this sector between 2014 and 2015. This is consistent with national trends where
emissions decreased due to a decrease in the use of coal for electricity generation. Looking
at longer term trends, all but 6 Local Authorities have seen decreases in emissions from this
sector since 2005.
4 http://www.dft.gov.uk/traffic-counts
5 https://www.gov.uk/government/collections/sub-national-electricity-consumption-data

2015 Emissions
14
Local Authorities with large changes in emissions since 2014
Overall, emissions decreased in 325 out of 391 Local Authorities since 2014 reflecting a 4.0
percent decrease in national emissions totals between 2014 and 2015. For many Local
Authorities the sub-sectors largely responsible for the changes in emissions from 2014 was
Industry and Commercial Electricity and Gas. This reflects changes in emissions at the
National level mainly due to a decrease in the use of coal for electricity generation. The
exceptions to this are those Local Authorities that have shown changes due to large industrial
installations. Table 5 shows some examples of Local Authorities that had particularly big
increases or decreases in emissions and the sub-sector(s) driving this change.
Table 5: Local Authorities that had the largest changes in emissions
Local Authorities, 2014-2015 Percentages
Local Authority Percentage change
Sub-sector most responsible for decreases and increases in that area
Carlisle 38% decrease Industry and Commercial Electricity
West Somerset 28% decrease Industry and Commercial Electricity and Gas
Redcar and Cleveland 25% decrease Large Industrial Installations
Stockton-on-Tees 22% increase Large Industrial Installations
Highland 28% increase Industry and Commercial Electricity Source: 2005 to 2015 UK local and regional CO2 emissions –data tables
Methodological improvements since last year and revisions to the data for 2005 to 2015
15
Methodological improvements since last year and revisions to the data for 2005 to 2015
In the production of the 2015 estimates, new data were introduced, together with some
improvements to the underlying methodology. In order to ensure that the data for 2005 to
2014 are consistent with the data now available for 2015, the estimates for these years have
been revised to incorporate both the new data and the improvements in the underlying
methodology. For some LAs, these revisions have resulted in noticeable changes to the
emissions estimates in the earlier years for some sectors. More information and specific
examples are given in the Technical Report.
Northern Ireland
Northern Ireland underwent boundary changes for its local authority districts, the dataset has
been updated to reflect the new boundaries and provide a consistent time-series back to
2005 for these new boundaries.
Large Industrial Installations
New data has been identified or modelled for point source emissions.
Industrial and commercial other fuels
A number of changes have been made to reflect changes at the national level that affect both
the overall emissions and the distribution of emissions.
Land Use, Land Use Change and Forestry
A number of changes have been made to reflect changes at the national level that affect both
the overall emissions and the distribution of emissions.

Emissions trends since 2005
16
Emissions trends since 2005
When the Local Authority emissions are aggregated, estimated total CO2 emissions
decreased by around 27 percent since 2005 (the earliest year for which data are available at
Local Authority level) – falling from 530.8 million tonnes to 386.5 million tonnes. Whilst
emissions have decreased over time there have been periods of fluctuation, with emissions
increasing between 2009 and 2010 (largely due to exceptionally cold weather in 2010 and
relatively low emissions in 2009 as a consequence of economic factors) and between 2011
and 2012 (largely due to variations in temperature). For information on the drivers of trends at
national level, see National Statistics on Final UK Greenhouse Gas Emissions6.
Regional trends since 2005
Table 6: End-user carbon dioxide emissions 2005 and 2015
Regional Summary, 2005 and 2015 MtCO2/tCO2
Region / country 2005 2015 Percentage change between 2005 and 2015 total emissions
Total emissions (MtCO2)
Per capita (tCO2)
Total emissions (MtCO2)
Per capita (tCO2)
UK2 531 8.8 387 5.9 -27%
Wales1 33 11.2 27 8.7 -19%
Scotland1 46 9.0 33 6.1 -29%
N. Ireland1 17 9.6 14 7.4 -18%
England1 430 8.5 308 5.6 -28%
North East 30 11.8 18 6.8 -40%
North West 59 8.6 41 5.7 -31% Yorkshire and the
Humber 53 10.4 39 7.2 -28%
East Midlands 41 9.6 31 6.7 -24%
West Midlands 45 8.4 33 5.8 -26%
East of England 46 8.2 35 5.7 -24%
Greater London 47 6.3 33 3.8 -29%
South East 67 8.1 48 5.4 -28%
South West 41 8.1 30 5.4 -28% Source: 2005 to 2015 UK local and regional CO2 emissions –data tables
Notes: 1. These data are not fully consistent with the equivalent data for the Devolved Administrations. A reconciliation of these sets of
figures can be found in the England Reconciliation, Wales Reconciliation, Scotland Reconciliation and Northern Ireland Reconciliation sheets.
2. Sum of Local Authority emission estimates are not fully consistent with the official inventory for the UK (see Table 12 for details).
6 https://www.gov.uk/government/collections/final-uk-greenhouse-gas-emissions-national-statistics
Emissions trends since 2005
17
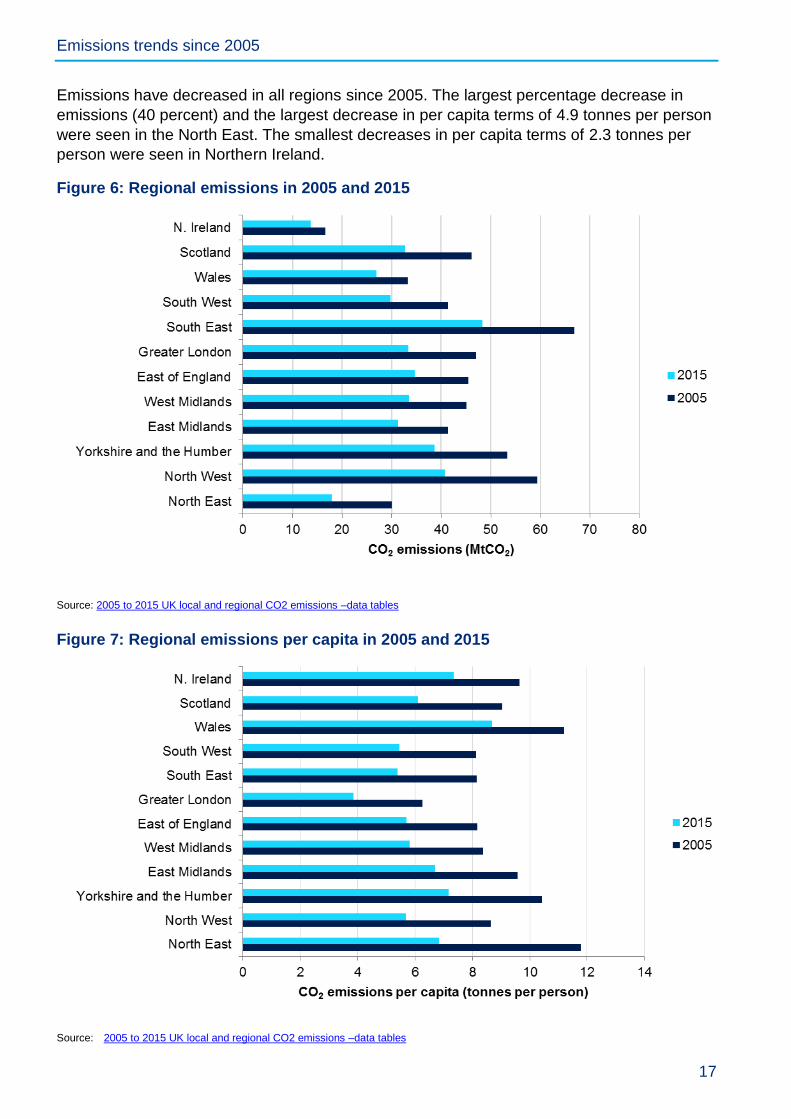
Emissions have decreased in all regions since 2005. The largest percentage decrease in
emissions (40 percent) and the largest decrease in per capita terms of 4.9 tonnes per person
were seen in the North East. The smallest decreases in per capita terms of 2.3 tonnes per
person were seen in Northern Ireland.
Figure 6: Regional emissions in 2005 and 2015
Source: 2005 to 2015 UK local and regional CO2 emissions –data tables
Figure 7: Regional emissions per capita in 2005 and 2015
Source: 2005 to 2015 UK local and regional CO2 emissions –data tables

Emissions trends since 2005
18
Local Authority trends since 2005
There is more variation in trends at Local Authority level than at regional level. In particular,
emissions for many Local Authorities are heavily influenced by activities at industrial sites,
and changes at a single site can have a big impact on emissions trends.
Out of 391 Local Authorities, 390 have shown a decrease in total emissions between 2005
and 2015. This reflects the decrease in overall emissions for the UK during this period driven
mainly by reductions in emissions from power stations, industrial combustion and passenger
cars. The reduction from power stations is driven by change in the fuel mix used for electricity
generation with a reduction in the amount of coal which is a carbon intensive fuel. The
reduction in industrial combustion is largely driven by the closure or reduced activity of
industrial plants, a large portion of which occurred during 2009, likely due to economic
factors.
From 2005 to 2015, the largest percentage decrease:
In total emissions was in Northumberland (down 261 percent) due to the conversion of a
large industrial power station from generating electricity for its own use, to exporting
electricity to national grid users. Following this, emissions from this site are reallocated to
final users, meaning the ‘Large industrial installations’ sector has virtually zero emissions
in 2015.
In emissions from the industrial and commercial sector was in Gravesham (down 86
percent) due to the closure of a cement works during 2008.
In emissions from the domestic sector was in Blaenau Gwent (down 37 percent) due to
reductions in electricity and gas consumption.
In emissions from transport was in Wandsworth (down 23 percent). This was due to
reduction in vehicle kilometres travelled on minor roads and a reduction in traffic counts7
on major roads.
From 2005 to 2015, the largest percentage increase:
In total emissions and industrial and commercial sector was in Neath Port Talbot (up 7
percent and 10 percent respectively); due to increased activity over the period at Large
Industrial sites.
In the domestic sector no local authorities showed an increase
In the transport sector was Eilean Siar (up 6 percent) due to an increase in vehicle
kilometres travelled and traffic counts4 on A-roads.
7 http://www.dft.gov.uk/traffic-counts

Emissions trends since 2005
19
Table 7: Breakdown of size of decrease in emissions since 2005
Local Authorities, 2005 – 2015
Change in emissions since 2005
Number of Local Authorities
Decrease of more than 40% 15
Decrease of 35-40% 17
Decrease of 30-35% 90
Decrease of 25-30% 104
Decrease of 20-25% 100
Decrease of 15-20% 48
Decrease of 0-15% 16
Increase 1 Source: 2005 to 2015 UK local and regional CO2 emissions –data tables
Only 1 Local Authority had higher emissions in 2015 than in 2005, driven by increases from
the industrial and commercial sector. However, for other Local Authorities there is a lot of
variation in the scale of the decrease seen, as shown by the above Table 7.
Sub-Sectoral Trends since 2005
When Local Authority figures are aggregated, 2015 emissions are lower than 2005 emissions
in all sectors and sub-sectors except for Transport Other (combustion of lubricants, LPG
vehicles, inland waterways, coal railways and aircraft support vehicles).
The 3 largest absolute decreases were in the following sub-sectors:
Industry and commercial electricity (-44.0 million tonnes)
Domestic electricity (-25.9 million tonnes)
Large industrial installations (-18.2 million tonnes)
Changes by sector at the Local Authority level Tables 8 and 9 below provide some information on the Local Authorities that have experienced the largest percentage decreases and increases in emissions since 2005, and the sub-sectors responsible.
Emissions trends since 2005
20
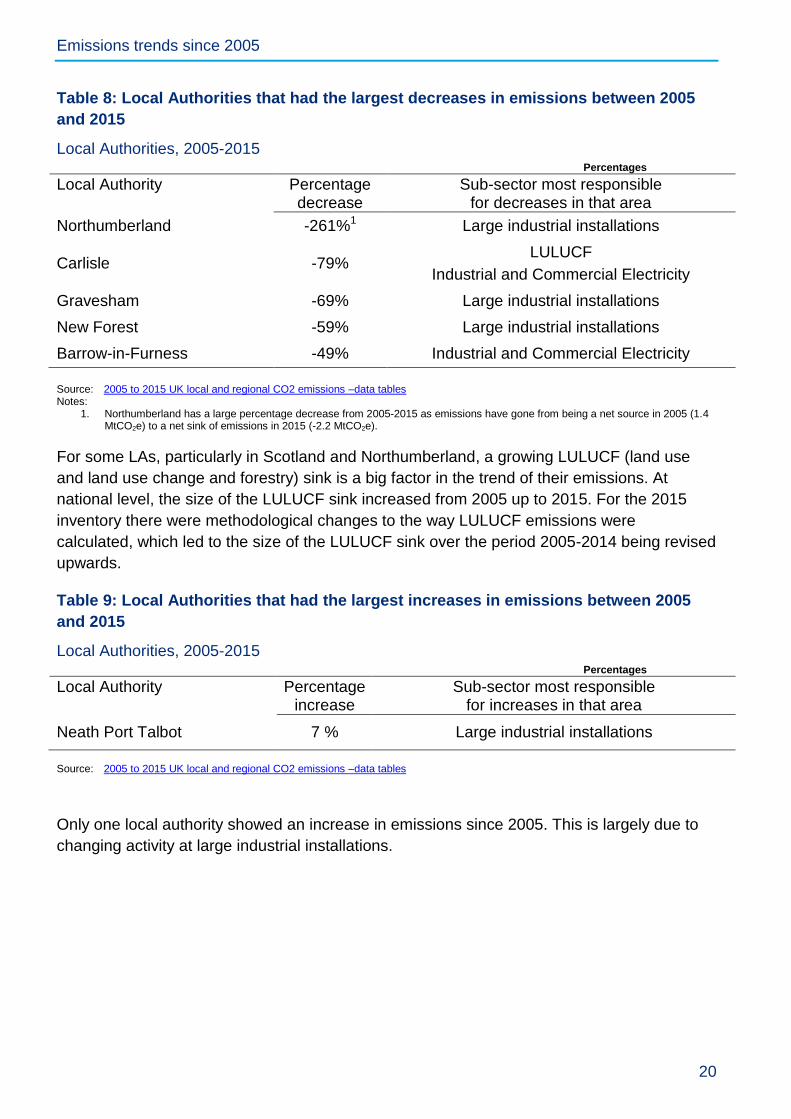
Table 8: Local Authorities that had the largest decreases in emissions between 2005
and 2015
Local Authorities, 2005-2015 Percentages
Local Authority Percentage decrease
Sub-sector most responsible for decreases in that area
Northumberland -261%1 Large industrial installations
Carlisle -79% LULUCF
Industrial and Commercial Electricity
Gravesham -69% Large industrial installations
New Forest -59% Large industrial installations
Barrow-in-Furness -49% Industrial and Commercial Electricity
Source: 2005 to 2015 UK local and regional CO2 emissions –data tables Notes:
1. Northumberland has a large percentage decrease from 2005-2015 as emissions have gone from being a net source in 2005 (1.4 MtCO2e) to a net sink of emissions in 2015 (-2.2 MtCO2e).
For some LAs, particularly in Scotland and Northumberland, a growing LULUCF (land use
and land use change and forestry) sink is a big factor in the trend of their emissions. At
national level, the size of the LULUCF sink increased from 2005 up to 2015. For the 2015
inventory there were methodological changes to the way LULUCF emissions were
calculated, which led to the size of the LULUCF sink over the period 2005-2014 being revised
upwards.
Table 9: Local Authorities that had the largest increases in emissions between 2005
and 2015
Local Authorities, 2005-2015 Percentages
Local Authority Percentage increase
Sub-sector most responsible for increases in that area
Neath Port Talbot 7 % Large industrial installations
Source: 2005 to 2015 UK local and regional CO2 emissions –data tables
Only one local authority showed an increase in emissions since 2005. This is largely due to
changing activity at large industrial installations.
Carbon dioxide emissions within the scope of influence of Local Authorities
21
Carbon dioxide emissions within the scope of influence of Local Authorities
Alongside the full dataset, we have also published a subset which represents carbon dioxide
emissions within the scope of influence of Local Authorities. The full dataset includes all the
emissions that occur within the boundaries of each Local Authority; however, the dataset of
emissions within the scope of Local Authorities excludes emissions that Local Authorities
don’t have direct influence over. The emissions that are removed from the full dataset are:
Motorways – all emissions from the “Transport (motorways)” sector have been removed.
EU Emissions Trading System (EU ETS) sites – these emissions have been removed from
the “Large industrial installations” sector, with the exception of energy suppliers (e.g.
power stations), whose emissions are indirectly included via the end-user estimates for
electricity use. Note that not all the emissions from the “Large industrial installations”
sector are produced by EU ETS installations, hence the fact that there are emissions
remaining in this sector in the subset.
Diesel railways – all emissions from the “Diesel Railways” sector have been excluded;
Land Use, Land Use Change, and Forestry – all emissions belonging to the “LULUCF Net
emissions” sector have been excluded.
Removing these emissions has a much bigger impact on some Local Authorities than others,
as some Local Authorities have a much bigger proportion of emissions from the above
sources than others. Table 10 shows the Local Authorities with the largest decrease in
emissions within the scope of influence of the Local Authority between 2005 and 2015. Only
one of these were among the top 5 Local Authorities for decreases in overall emissions
(which are shown in Table 8 in the previous section). This is because the largest decreases
in overall emissions were driven by the large industrial installations sub-sector, large aspects
of which are considered to be outside the scope of influence of LAs.

Carbon dioxide emissions within the scope of influence of Local Authorities
22
Table 10: Local Authorities that had the largest decreases in emissions within the
scope of influence of the Local Authority between 2005 and 2015
Local Authorities, 2005-2015 Percentages
Local Authority Percentage decrease
Sub-sector most responsible for decreases in that area
Redcar and Cleveland -60% Industrial and Commercial Electricity
Barrow-in-Furness -51% Industrial and Commercial Electricity
City of London -48% Industrial and Commercial Electricity and Gas
Thurrock -47% Industrial and Commercial Gas
Exeter -45% Industrial and Commercial Gas Source: 2005 to 2015 UK local and regional CO2 emissions –data tables
No Local Authorities had an increase in emissions within the scope of the Local Authority
between 2005 and 2015, and the one Local Authority that had an increase in their overall
emissions was due to industrial use which is covered by the EU ETS.
Looking at changes in emissions within the scope of influence of Local Authorities between
2014 and 2015, 48 Local Authorities had increases in their emissions over this period. Table
11 shows the Local Authorities with the biggest percentage changes to the emissions within
their scope of influence between 2014 and 2015. Some of these Local Authorities also
appear in the list of Local Authorities with the biggest changes to overall emissions over this
period (as shown in Table 5). Some do not as the drivers of some of the largest emissions
changes (such as the opening or closing of large industrial installations) may be outside the
scope of influence of Local Authorities.
Table 11: Local Authorities that had the largest increases or decreases in emissions
within the scope of influence of the Local Authority between 2014 and 2015
Local Authorities, 2014-2015 Percentages
Local Authority Percentage change
Sub-sector most responsible
for decreases and increases in that area
Redcar and Cleveland 35 % decrease Industry and Commercial Electricity
West Somerset 27 % decrease Industry and Commercial Gas
City of London 17 % decrease Industry and Commercial Electricity
Bexley 13 % increase Industrial and Commercial Electricity
Stockton-on-Tees 20 % increase Large Industrial Installations Source: 2005 to 2015 UK local and regional CO2 emissions –data tables

Reconciliation with the UK inventory
23
Reconciliation with the UK inventory
Reconciliation Table
These local estimates are designed to be as consistent as possible with the national
inventory for the UK. However, some differences are unavoidable.
A number of emission sources included in the UK inventory are not included in the local
estimates, as there is no obvious basis for doing so. Excluded sources are principally linked
to aviation and shipping.
A small proportion of the gas and electricity consumption allocated to the domestic sector in
these estimates is attributed to business in the UK inventory. This is because it is not
possible to distinguish between domestic customers and smaller businesses in the meter
point consumption data used in these local estimates.
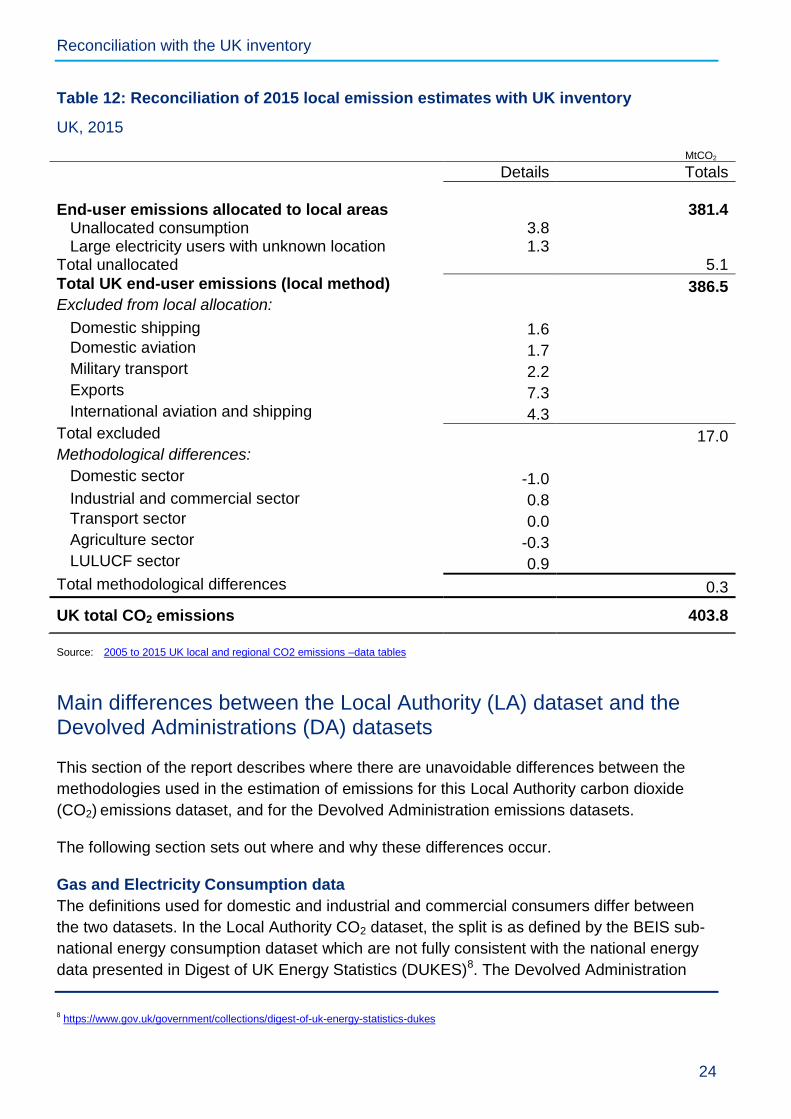
Table 12 shows a summary of the reconciliation between the UK inventory and the local
inventory. The different elements of this reconciliation should be interpreted as follows:
"Excluded" are the sectors that have been deliberately excluded from the local level
allocation, as it would not have been appropriate to include them;
"Unallocated methodological differences" are differences which have become apparent
due to the different methodological approaches used in deriving the UK Inventory and local
level estimates. These include gas and electricity consumption which cannot be allocated
to Local Authorities due to confidentiality concerns at high emitting sites, and harvested
wood products.
"Methodological differences" are the differences that have caused the discrepancies
between the national inventories and the Local Authority carbon dioxide dataset. These
are explained after the UK reconciliation table.
Reconciliation with the UK inventory
24
Table 12: Reconciliation of 2015 local emission estimates with UK inventory
UK, 2015
MtCO2
Details Totals
End-user emissions allocated to local areas
381.4
Unallocated consumption 3.8 Large electricity users with unknown location 1.3 Total unallocated 5.1
Total UK end-user emissions (local method) 386.5 Excluded from local allocation:
Domestic shipping 1.6 Domestic aviation 1.7 Military transport 2.2 Exports 7.3 International aviation and shipping 4.3
Total excluded 17.0 Methodological differences: Domestic sector -1.0
Industrial and commercial sector 0.8 Transport sector 0.0 Agriculture sector -0.3 LULUCF sector 0.9
Total methodological differences 0.3
UK total CO2 emissions 403.8
Source: 2005 to 2015 UK local and regional CO2 emissions –data tables
Main differences between the Local Authority (LA) dataset and the Devolved Administrations (DA) datasets
This section of the report describes where there are unavoidable differences between the
methodologies used in the estimation of emissions for this Local Authority carbon dioxide
(CO2) emissions dataset, and for the Devolved Administration emissions datasets.
The following section sets out where and why these differences occur.
Gas and Electricity Consumption data
The definitions used for domestic and industrial and commercial consumers differ between
the two datasets. In the Local Authority CO2 dataset, the split is as defined by the BEIS sub-
national energy consumption dataset which are not fully consistent with the national energy
data presented in Digest of UK Energy Statistics (DUKES)8. The Devolved Administration
8 https://www.gov.uk/government/collections/digest-of-uk-energy-statistics-dukes

Reconciliation with the UK inventory
25
greenhouse gas inventory (DA GHGI), however, is based on DA-wide electricity consumption
statistics which are available in the electricity generation and supply section of BEIS’s Energy
Trends9 publication and are fully consistent with DUKES data for major power producers.
These two underlying datasets are not fully consistent, and therefore result in differences
between the Local Authority dataset and the DA inventories for gas and electricity use, as
described below.
Unallocated Gas and Electricity Consumption data In the sub-national energy datasets, some gas data cannot be allocated to LAs, due to
reasons of confidentiality. In part, these gaps in the emissions estimates are filled through the
point source database (mentioned above). However, in doing so, this introduces some
uncertainty. In the DA inventory though, there is no unallocated consumption; point source
data is supplemented by employment and other surrogate data to allocate all of the national
fuel use between the four DAs.
In the Local Authority dataset, some electricity consumption data cannot be allocated to LAs.
This is due to both commercial confidentiality concerns for high-consuming sites, and also
where it is not possible to map these data. In these instances, these data are therefore
assigned to the ‘unallocated’ category. The DA inventory, on the other hand, reports
emissions against a wider geographical coverage, effectively negating the data disclosure
concerns, and hence there is no need to exclude specific emissions from the DA inventories.
Unallocated LULUCF data Harvested wood products can be allocated to particular DAs but not to particular Local
Authorities. Within the Local Authority carbon dioxide dataset, these emissions/removals are
therefore assigned to the 'unallocated' category. These are the differences which can be
seen in each of the DA reconciliation tables. All other LULUCF estimates are fully consistent
across UK, DA and Local Authority data.
Use of additional gas data for Northern Ireland Both datasets now include consideration of new gas consumption data supplied by Northern
Ireland energy suppliers, which shows a large growth in gas use within Northern Ireland from
2006 onwards. The DA inventory approach includes estimates for the fuel-switching from oil
and solid fuels that this growth in gas use has displaced. In the Local Authority carbon
dioxide data, these estimates of fuel switching have not been possible, given the greater level
of detail required by the data, and the UK emissions distribution grids have been used solely.
Distribution of 'Other Fuels' across DAs There are some areas where emissions mapping methods differ between the two datasets
due to the availability of data.
In the iron and steel sector, the methodology used for the Local Authority carbon dioxide
emissions assumes that all emissions from the iron and steel sector from industrial process,
process gases and solid fuels occur at large point sources. Emissions from the consumption
9 https://www.gov.uk/government/collections/energy-trends
Reconciliation with the UK inventory
26
of oil in the iron and steel sector are mapped using a combination of point sources and area
sources (as described in the Technical Report). In the DA inventory, fuel use data supplied
by the Iron and Steel Statistics Bureau (ISSB) is used, since it is available on a DA basis.
There is also a difference in the estimation of emissions from peat in the domestic sector. In
the Local Authority carbon dioxide emissions methodology, peat use is mapped using the
domestic fuel use mapping grids which are produced by Ricardo Energy and Environment as
part of the mapping process for the National Atmospheric Emissions Inventory programme.
For the DA inventory, this is mapped using a DA specific distribution calculated by Centre for
Ecology and Hydrology (CEH).
For domestic oil combustion, the allocation of emissions to Local Authorities uses separate
emissions distribution grids for LPG and other oils. The mapping grids are unchanged from
last year’s publication. For the DA inventory, LPG grids were not available therefore all
domestic oil emissions are mapped using the same distribution grid.
For domestic coal combustion, the DA inventory estimates have been revised in the latest
submission to use the energy modelling work based on the 2011 census which also
underpins the Local Authority CO2 estimates. This has resulted in more consistent reporting
between Local Authority CO2 emissions and the DA inventory emissions. However, some
differences remain for solid and liquid fuels due to different compilation methods and fuel
aggregations; the Local Authority CO2 dataset takes a more bottom-up approach to
disaggregating smokeless solid fuels according to the location of smokeless zones, for
example.
Point Sources
There are also some differences between the estimates of emissions at large point sources
and those in the national totals. An explanation for these differences is provided in the
Technical Report.

UK maps
27
UK maps
A range of maps showing 2015 carbon dioxide emissions per capita at Local Authority level
are presented on the following pages.
As Figures 8 to 12 show, emissions per capita can vary noticeably between regions in the
UK. This is particularly evident in the domestic and LULUCF sectors.
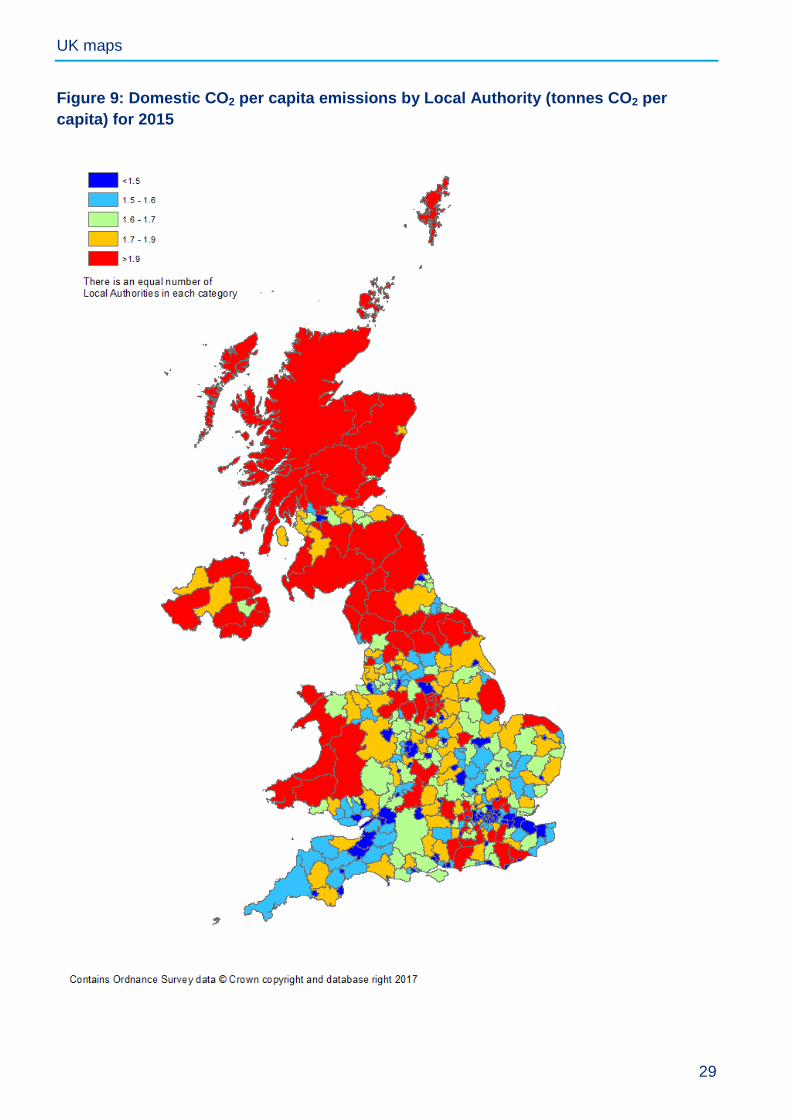
As Figure 9 shows, in 2015, for the domestic sector, emissions per capita were higher in
Scotland, Northern Ireland, and Wales compared than the rest of the UK. Per capita
emissions are high in Northern Ireland predominantly because there is limited availability of
natural gas in these areas; this results in the combustion of more carbon intensive fuels
instead, such as coal, burning oil and gas oil, which are assigned to the domestic ‘other fuels’
sector. Wales also has a higher proportion of emissions from ‘other fuels’ than the rest of the
UK, though to a lesser extent. In Scotland per capita emissions from both domestic gas and
domestic electricity use are higher than in the rest of the UK. The lowest per capita emissions
by region are in Greater London and South East England.
There are less clear trends in the industrial and commercial, and transport sectors. As
Figures 10 and 11 show, within all regions there is a mixture of areas with high, medium and
low carbon dioxide emissions per capita. With respect to the industrial and commercial
sector, this is expected, since emissions from this sector are heavily dependent on whether
there are large industrial sites situated in that area. It is more difficult to identify reasons
behind the variations observed in the transport sector, since there are numerous factors
(such as composition of the vehicle fleet and average annual daily statistics by vehicle type)
which feed into these estimates. Further information on how transport emissions have been
estimated is available in section 10 of the Technical Report.
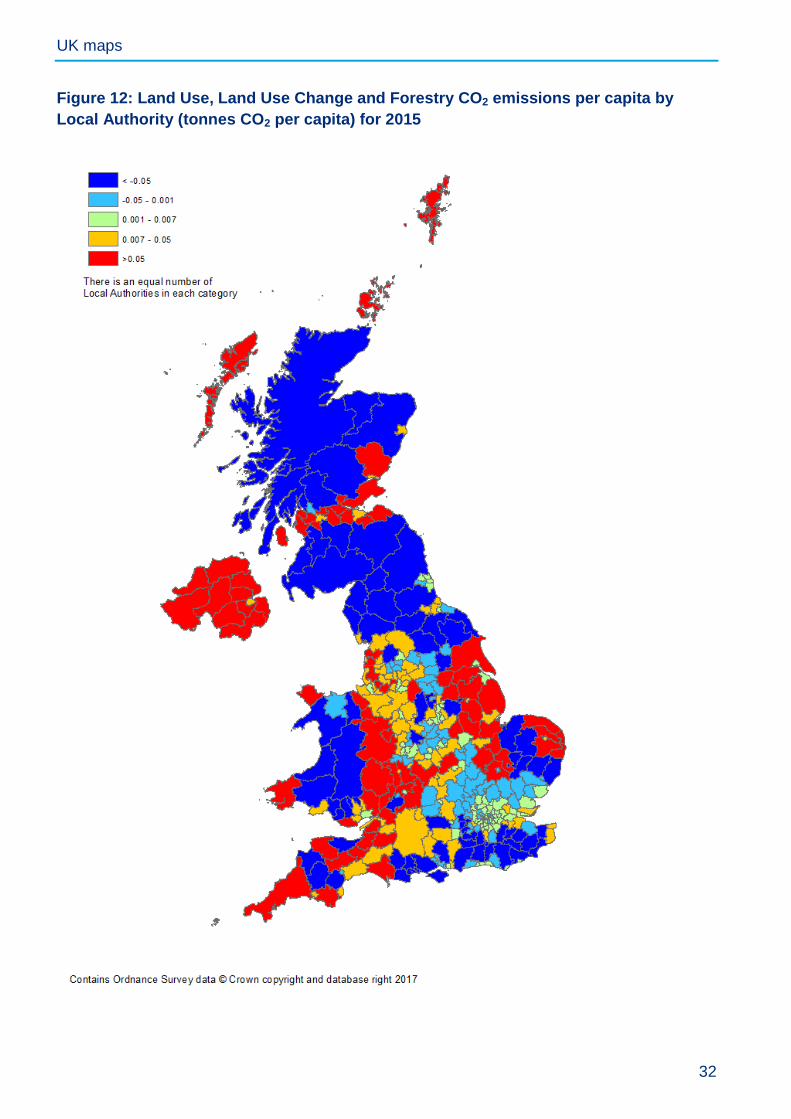
In the LULUCF sector, there are clear regional trends in per capita emissions (Figure 12). In
large parts of Scotland, Wales, and the North East in particular there are large sinks of
carbon dioxide. In other parts of the UK, such as in Northern Ireland, East England and South
West England, LULUCF is a large source of carbon dioxide emissions. Northern Ireland has
the highest LULUCF emissions per capita, due to the clearing of land for the maintenance
and creation of settlements and croplands.

UK maps
28
Figure 8: Emissions of carbon dioxide per capita by Local Authority (tonnes CO2 per
capita), excluding LULUCF for 2015
UK maps
29
Figure 9: Domestic CO2 per capita emissions by Local Authority (tonnes CO2 per
capita) for 2015

UK maps
30
Figure 10: Industrial and commercial per capita CO2 emissions by Local Authority
(tonnes CO2 per capita) for 2015

UK maps
31
Figure 11: Transport CO2 emissions per capita by Local Authority (tonnes CO2 per
capita) for 2015
UK maps
32
Figure 12: Land Use, Land Use Change and Forestry CO2 emissions per capita by
Local Authority (tonnes CO2 per capita) for 2015

Further Information
33
Further Information
The following information is available alongside this statistical release at the location below.
https://www.gov.uk/government/collections/uk-local-authority-and-regional-carbon-dioxide-
emissions-national-statistics
Datasets are available for Local Authority emissions:
2005 to 2015 UK local and regional CO2 emissions estimates Data tables
A number of supplementary reports are also available for Local Authority emissions. These
are for users to refer to if they want more information on the methodology for producing the
estimates:
2005 to 2015 UK local and regional CO2 emissions: technical report
Report on the methodology used to produce the emissions estimates.
Employment based energy consumption mapping in the UK
A report which outlines the methodology used to map emissions from smaller
industrial and commercial sources.
Mapping carbon emissions & removals for the Land Use, Land Use Change &
Forestry (LULUCF) sector
A report looking at LULUCF emissions and removals at the Local Authority level.
The following user guidance is available for sub-national emissions:
Sub-national emissions statistics: Frequently asked questions
The following emissions outputs may also be of interest:
Devolved Administration Greenhouse Gas Inventories
Greenhouse gas emissions inventories are available for England, Scotland, Wales and
Northern Ireland.
Final UK greenhouse gas emissions, 1990-2015
This publication provides the latest estimates of UK greenhouse gas emissions by
source sector from 1990-2015.
Given the number of LAs, this statistical release does not provide a detailed explanation of all
revisions to the historical data series or the year on year changes for each Local Authority.
However, explanations of the reasons for any changes are available on request; any such
requests should be sent to the following email address:

Future updates to emissions estimates
34
Future updates to emissions estimates
The next National Statistics on Local Authority carbon dioxide emissions estimates, covering
the period 2005-2016, will be published on 28th June 2018.

Notes for Editors
35
Notes for Editors
1. The full set of data tables and methodology documents that accompany this statistics
release can be found at: https://www.gov.uk/government/collections/uk-local-authority-
and-regional-carbon-dioxide-emissions-national-statistics
2. Further information on UK greenhouse gas emissions statistics, including Excel tables
with additional data on UK emissions, can be found on the Gov.uk website at:
https://www.gov.uk/government/collections/uk-greenhouse-gas-emissions-statistics
3. This Statistical Release and the related data tables are part of the National
Atmospheric Emissions Inventory (NAEI) for 1970-2015, produced for BEIS and the
Devolved Administrations by Ricardo Energy and Environment For further information
on the UK Greenhouse Gas Inventory, see the NAEI website http://naei.defra.gov.uk/.
4. The latest UK sub-national energy statistics including revisions to earlier years’ data,
can be found at the gov.uk website
https://www.gov.uk/government/organisations/department-of-energy-climate-
change/about/statistics.

© Crown copyright 2017 Department for Business, Energy & Industrial Strategy 1 Victoria Street, London, SW1H 0ET
www.gov.uk/beis