climate change: mitigation of carbon dioxide emissions
TRANSCRIPT

Office of Research and DevelopmentNational Risk Management Research Laboratory
Ravi K. SrivastavaChief, Air Pollution Technology Branch
Climate Change: Mitigation of Carbon Dioxide Emissions from Coal-fired Power
Plants
Presentation to Zhejiang University Hangzhou, ChinaNovember 2010
The views expressed in this presentation are those of the author and do not necessarily
reflect the views or policies of the U.S. Environmental Protection Agency.

Outline
• Climate change
• The importance of coal-fired power generation
• CO2 mitigation technologies for coal-fired power plants– More efficient generation– CCS
• Post-combustion CO2 capture• Oxy-combustion CO2 removal• IGCC with pre-combustion CO2 removal

Climate change, a challenge for this century
IPCC 4th Assessment, 2007• Human activities (fossil-fuel use,
land-use changes, and agriculture) are contributing to observed increase in atmospheric concentrations of greenhouse gases.
• Warming of the climate system is unequivocal as evidenced by melting polar ice, rising sea level, changes in precipitation patterns, droughts, heat-waves, etc.
• The earth is warming and it is very likely due to the increased anthropogenic GHG concentrations.
• Continued GHG emissions at or above current rates would cause further warming later in this century.

Projected impacts of Climate Change
1°C 2°C 5°C4°C3°C
Sea level rise threatens major cities
Falling crop yields in many areas, particularly developing regions
FoodFood
WaterWater
EcosystemsEcosystems
Risk of Abrupt and Risk of Abrupt and Major Irreversible Major Irreversible ChangesChanges
Global temperature change (relative to pre-industrial)0°C
Falling yields in many developed regions
Rising number of species face extinction
Increasing risk of dangerous feedbacks and abrupt, large-scale shifts in the climate system
Significant decreases in water availability in many areas, including Mediterranean and Southern Africa
Small mountain glaciers disappear – water supplies threatened in several areas
Extensive Damage to Coral Reefs
Extreme Extreme Weather Weather EventsEvents
Rising intensity of storms, forest fires, droughts, flooding and heat waves
Possible rising yields in some high latitude regions
Source: The Stern review on the economics of climate change, July 2007.
Climate Change: International Activities
• IPCC: In 1988, UNEP and WMO jointly established the Intergovernmental Panel on Climate Change (IPCC) as concern over climate change became a political issue. The purpose of the IPCC is to assess the state of knowledge on the various aspects of climate change.
• UNFCC: In 1992, most countries joined an international treaty -- the United Nations Framework Convention on Climate Change (UNFCCC) -- to start to consider what actions can be taken to reduce global warming and to adapt to whatever temperature increases may be inevitable.
• Kyoto Protocol: UNFCCC’s third meeting in 1997 adopted the “Kyoto Protocol” requiring industrialized countries to reduce their global average GHG emissions by 5.2% below 1990 level during 2008-2012
• IPCC 4th Assessment Report, 2007.
• United Nations Climate Change Conference, Copenhagen, December 7-18, 2009: In 2012 the Kyoto Protocol to prevent climate changes and global warming runs out. At the conference, the parties of the UNFCCC met on government level to address the need for a new climate protocol.

World Energy Demand
• World energy demand projected to expand by 45% between now and 2030
• Average rate of increase of 1.6% annually
• Coal accounting for more than a third of the growth
0
2 000
4 000
6 000
8 000
10 000
12 000
14 000
16 000
18 000
1980 1990 2000 2010 2020 2030
Mtoe
Other renewables
Hydro
Nuclear
Biomass
Gas
Coal
Oil
Source: World Energy Outlook 2008

Reductions in Energy-Related CO2 Emissions
While technological progress is needed to achieve some emissions
reductions, efficiency
gains and deployment of existing low‐carbon energy accounts for most of the reductions
20
25
30
35
40
45
2005 2010 2015 2020 2025 2030
Gigaton
nes
Reference Scenario 550 Policy Scenario 450 Policy Scenario
CCS Renewables & biofuels
Nuclear
Energy efficiency
550 Policy Scenario
450 Policy Scenario
54%
23%
14% 9%
Source: WEO, 2008

• More efficient generation – Efficiency improvements: range 0.1-2.6 percentage points; modest CO2 reduction
potential (each percentage point of efficiency gain equals approximately 2.5% CO2 reduction)
– State-of-the-art generation technologies: ultra supercritical plants can have plant efficiencies between 38-43%
• Use of natural gas or biomass
• Carbon capture and sequestration (CCS)
CO2 Mitigation Options for Coal-fired Power Plants
CO2 EmitterCO2 Capture & Compression
CO2 Transport
CO2 Storage
(Sequestration)
- Post-combustion- Pre-combustion- Oxy-fuel combustion
- Pipeline- Tanker
- Depleted oil/gas fields- Deep saline reservoirs- CO2 driven EOR- Unmineable coal seams- Ocean
CO2
Combustion sources such as power plants
Efficiency Improvement: Fuel Reduction and Pollution Prevention
0.0
5.0
10.0
15.0
20.0
25.0
30.0
35.0
40.0
30 35 40 45 50
Upgraded Net Efficiency (%)
Cha
nge
in F
uel C
onsu
mpt
ion
Rat
e (%
)
Base efficiency (%) = 33Base efficiency (%) = 35Base efficiency (%) = 37
0.00
0.20
0.40
0.60
0.80
1.00
1.20
1.40
Bituminous coal Subbituminous coal Lignite coal
CO
2 G
ener
atio
n R
ate
(tons
/MW
h)
SubcriticalSupercriticalUSCIGCCOxy-fuel with USC
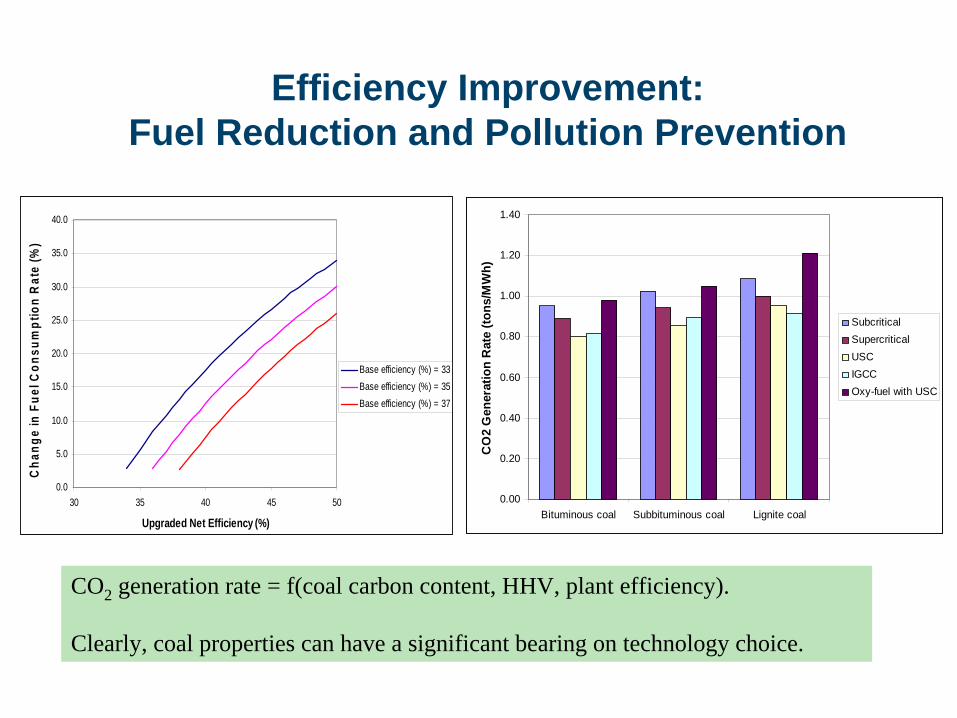
CO2 generation rate = f(coal carbon content, HHV, plant efficiency).
Clearly, coal properties can have a significant bearing on technology choice.

Efficiency Improvements Options
Source: DOE/NETL, 2008
• Strong correlation between plant efficiency and types of fuel and power generation technology used• Modest CO2 reduction potential (1.0% efficiency gain equals approximately 2.5% CO2 reduction)

Beyond Subcritical: Supercritical, Ultra-supercritical, and Advanced Ultra-supercritical Pulverized Coal (PC) Plants
• Supercritical plants: – Typical steam outlet pressures of 3500 psi (24.1 MPa) with 1050/1050 °F (566/566 °C)
double reheat – Typical plant efficiencies are in the 36 - 38 % range (HHV, net); newly constructed
supercritical plants should have an efficiency of approximately 41 %
• Ultra-supercritical (USC) plants:– Typical steam outlet pressures of 3700 psi (25.5 MPa) with 1100/1100 °F (593/593 °C)
double reheat – Plant efficiencies range from 38 to 43% (HHV, net)
• Advanced USC (AUSC) plants: – May have steam outlet pressures as high as 5080 psi (35 MPa) and steam outlet
temperatures as high as 1300 °F (704 °C) – Plant efficiencies (HHV, net) are estimated to be up to 46 %

Supercritical PC Plants
Source: IEA/CCC CoalPower 5 Database
• Approximately 90 GWe of supercritical capacity has been added worldwide since 2000.
• Total proposed supercritical capacity is 122.6 GWe (includes projects that are proposed, planned, or under construction).
0
10
20
30
40
50
60
70
Austral i
aCan
ada
ChinaGerm
any
Greece Ind
ia
Italy
Japa
nPola
nd
Russia
South Korea USA
SC C
apac
ity A
dded
Sin
ce 2
000,
GW
e Total worldwide supercritical added capacity is approx 90 GWe(added since 2000)
0
10
20
30
40
50
60
Austra
liaCa
nada
China
Germany Ind
iaInd
onesia
Mexico
Polan
dRu
ssia
South
Africa
South
Korea
Taiwan
Thaila
nd UK USA
Prop
osed
New
SC
Cap
acity
, GW
e
Total proposed new SC operating capacity = 122.6 GWe(includes projects that are proposed, planned, and under construction).
USC PC Plants
Source: IEA/CCC CoalPower 5 Database
0
2
4
6
8
10
12
14
China
Denmark
German
y
Japa
n
Netherl
ands
South
Korea
2009
Ope
ratin
g U
SC
Cap
acity
, GW
e Total worldwide USC operating capacity is approx 24.6 GWe
0
5
10
15
20
25
30
35
China
German
y
Italy
Japa
nNeth
erlan
ds
Polan
d
USA
Pro
pose
d A
dditi
onal
US
C C
apac
ity, G
We
Total proposed new USC operating capacity is 40.7 GWe(includes projects that are proposed, planned, and under construction).
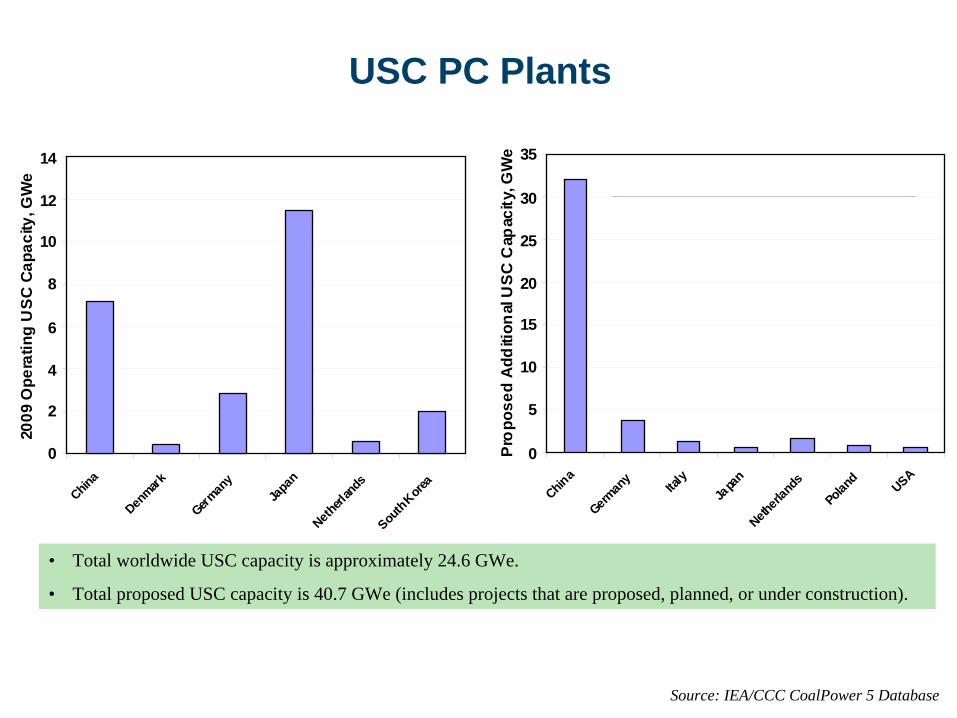
• Total worldwide USC capacity is approximately 24.6 GWe.
• Total proposed USC capacity is 40.7 GWe (includes projects that are proposed, planned, or under construction).

Fuel Prices and Deployment of Advanced PC Technologies
• Moving from subcritical generating conditions (e.g., 33% efficiency) to USC generating conditions (e.g., 40% efficiency) can reduce coal consumption per kWh of electricity generated by over 15 % - a substantial saving.
0.0
5.0
10.0
15.0
20.0
25.0
30.0
35.0
40.0
30 35 40 45 50
Upgraded Net Efficiency (%)
Cha
nge
in F
uel C
onsu
mpt
ion
Rat
e (%
)
Base efficiency (%) = 33Base efficiency (%) = 35Base efficiency (%) = 37
When fuel prices are driven upwards, more efficient generation technologies become more attractive.
Coal
Coal
Coal
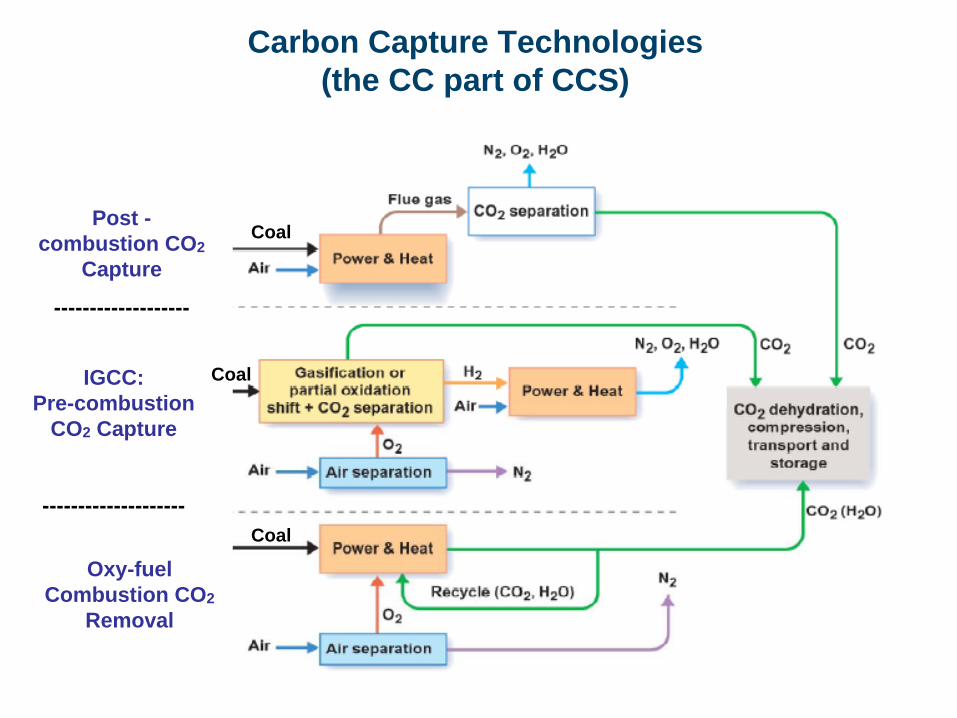
Post - combustion CO2
Capture
-------------------
IGCC: Pre-combustion
CO2 Capture
--------------------
Oxy-fuel Combustion CO2
Removal
Carbon Capture Technologies (the CC part of CCS)

PC Plants: Post-combustion Capture
Why post-combustion capture?• Key retrofit solution for pc-fired units, also envisioned for new applications
• Considerable experience with flue gas scrubbing
• Flexibility in switching between capture and no-capture operation
Source: http://www.europeanenergyforum.eu/archives/european-energy- forum/environmental-matters/co2-capture-and-storage-2013-part-of-the- solution-to-the-climate-change-problem

Post-combustion Capture: Amine Chemistry
Source: Progress in post-combustion CO2 Capture, Paul Feron, 2006
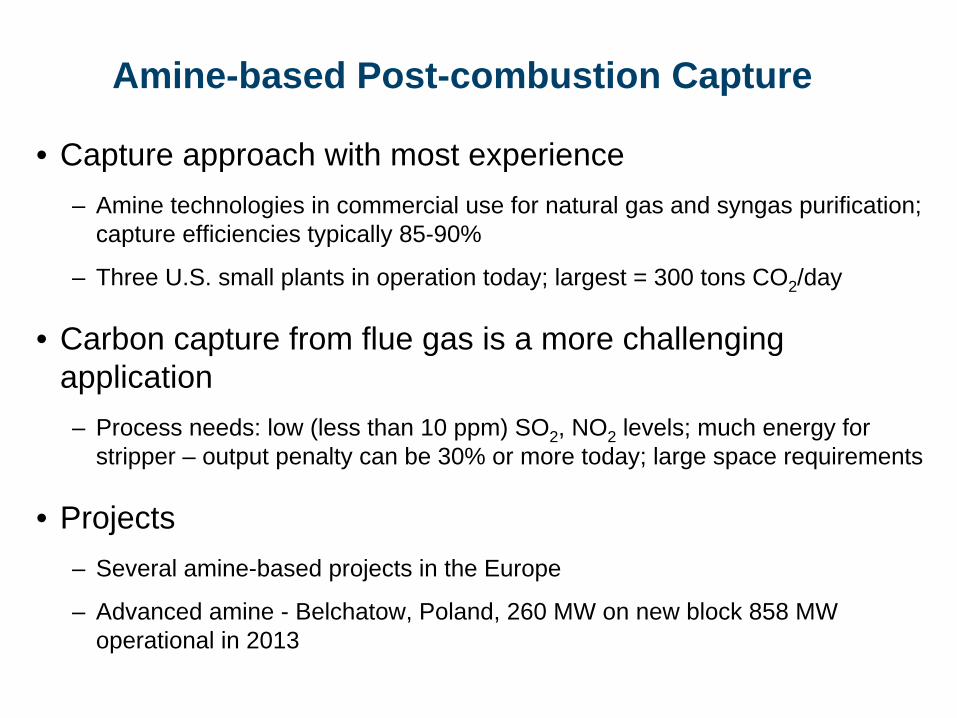
Amine-based Post-combustion Capture
• Capture approach with most experience– Amine technologies in commercial use for natural gas and syngas purification;
capture efficiencies typically 85-90%
– Three U.S. small plants in operation today; largest = 300 tons CO2 /day
• Carbon capture from flue gas is a more challenging application – Process needs: low (less than 10 ppm) SO2 , NO2 levels; much energy for
stripper – output penalty can be 30% or more today; large space requirements
• Projects– Several amine-based projects in the Europe
– Advanced amine - Belchatow, Poland, 260 MW on new block 858 MW operational in 2013

Amine-based Post-combustion Capture: Example Efficiency Loss
Losses cause the efficiency to drop by 9.2 points from 34.3% to 25.1%. For supercritical and USC plants, the same losses would be experienced in terms of category and quantity, and the losses are simply subtracted from a higher original efficiency. For example, an USC plant with an efficiency of 43.3% would lose 9.2 efficiency points to have an efficiency of 34.1% with capture.
Source: The Future of Coal, MIT, 2007

Post-combustion Capture: Development Needs
• Process improvements– Improved reagents for more efficient capture, tolerance against
corrosion from oxygen and trace contaminants, and lower degradation rates
• Integration with power plant – Maximizing MW, efficiency requires optimal thermal integration– Concepts for “capture readiness”
• Pilot and demonstration testing to build experience with power plant applications

Oxy-combustion
Why oxy-combustion?• Potential for new and retrofit applications
• With flue gas recycle can be engineered to be similar to existing air-fired pc units - use existing boiler heat transfer surfaces and turbine
Source: http://www.europeanenergyforum.eu/archives/european-energy- forum/environmental-matters/co2-capture-and-storage-2013-part-of-the- solution-to-the-climate-change-problem

Oxy-combustion: Example Efficiency Loss
Losses amount to 10.9 percentage points with the air separation unit accounting for more than half of these losses. The efficiency of a for a supercritical plant drops from 38.5 to 30.6 with addition of oxy-combustion and CO2 capture.
Source: The Future of Coal, MIT, 2007

Oxy-combustion: Overarching Considerations
• O2 supply energy penalty– 15-20% of energy penalty with the current cryogenic
technology
• Air in-leaks – Will dilute CO2 stream and increase compression volume
and costs
• Purity of CO2 exhaust gas– Corrosion during transportation – Impacts on compression costs
• Not suitable for partial CCS

Contaminant Chemistry and CO2 Purity
• Reactions involving contaminants– NO + NO + O2 = 2NO2 Slow (1)– 2NO2 = N2 O4 Fast (2)– 2NO2 + H2 O = HNO2 + HNO3 Slow (3)– 3HNO2 = HNO3 + 2NO + H2 O Fast (4)– NO2 + SO2 = NO + SO3 Fast (5)– SO2 + H2 O = H2 SO4 Fast (6)
• Rate of reaction (1) increases with pressure to the 3rd power – only feasible at elevated pressures
• No nitric acid is formed until all the SO2 is converted
• Hg, As, and other trace contaminants are dissolved in acid solution
• Pressure, reactor design, and residence times are important
• Is high NOx desirable for above reactions to take place?
• Can oxy-combustion operate without additional air pollution controls?
Source: Professor Jost Wendt, University of Utah, USA
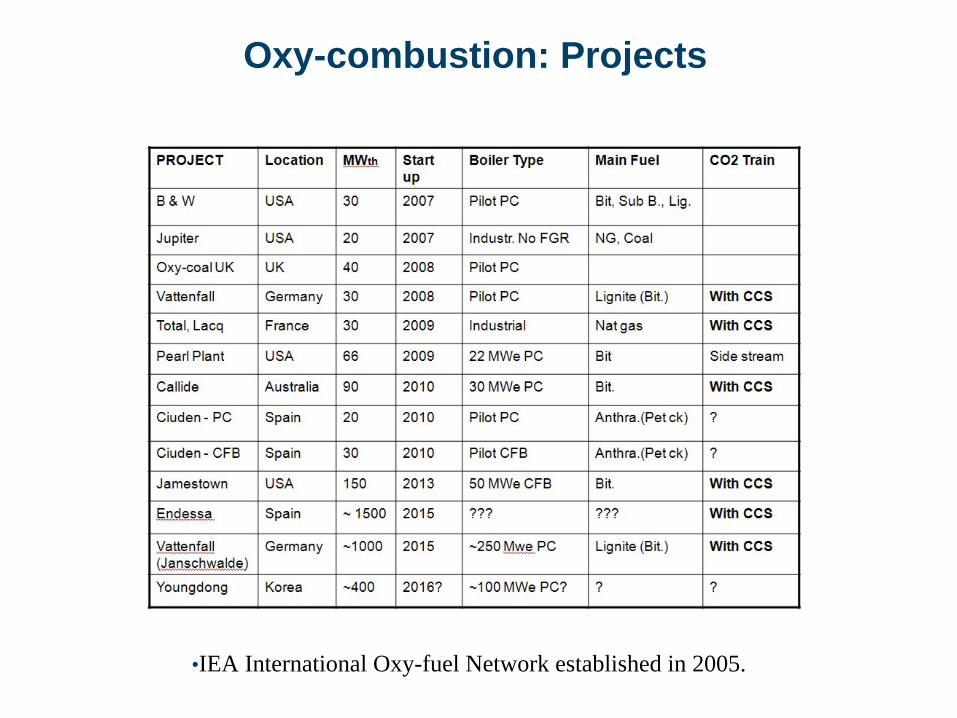
Oxy-combustion: Projects
•IEA International Oxy-fuel Network established in 2005.

Oxy-combustion: Development Needs
• Oxygen supplyCurrently cryogenic ASU has high capital and operating costsNew membrane technologies are under development
• Combustion behaviour with O2 /CO2 , impact on heat transfer and fouling
• Flue gas cleaning, water condensation and treatment• Pilot and demo-plant testing to develop experience base

Integrated Gasification Combined Cycle (IGCC) with Pre-combustion CO2 Capture
Source: http://www.europeanenergyforum.eu/archives/european-energy- forum/environmental-matters/co2-capture-and-storage-2013-part-of-the- solution-to-the-climate-change-problem
Why IGCC with pre-combustion CO2 Capture?• Potentially a cost-effective CCS approach, mainly for new applications
• Can be used to produce hydrogen, fuels and power

IGCC with Pre-combustion CO2 Capture: Pros and Cons
Pros:• Proven industrial scale technology in oil
refineries, but needs scale-up for power plants.• High level (90-95% of CO2 emissions) of
capture possible.• Can produce H2 and/or liquid fuels from coal.
Cons:• Requires a chemical plant in front of the gas
turbine – impact on reliability/availability.• High investment cost for dedicated new-build
plants.• Development of efficient H2 burning turbines.• Bypass of the capture process units is not
practical because everything downstream of the shift reactor is designed for a process with CO2 capture. RWE, Huerth, Germany: 450 MWe,
2.6 MtCO2/yr. stored; construction- 2010, completion- 2016.
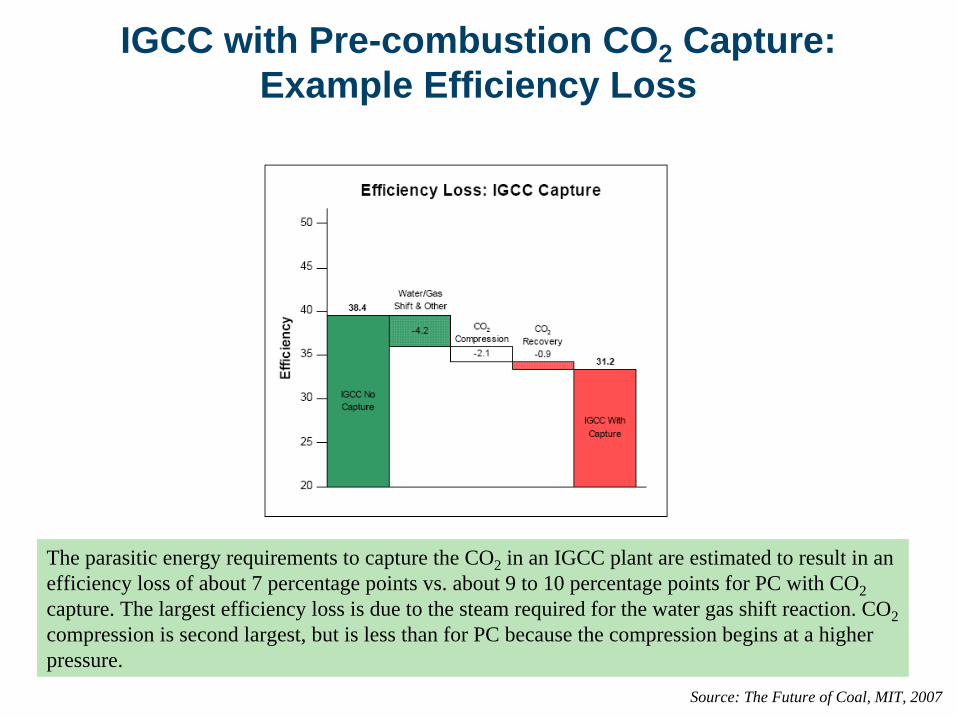
IGCC with Pre-combustion CO2 Capture: Example Efficiency Loss
The parasitic energy requirements to capture the CO2 in an IGCC plant are estimated to result in an efficiency loss of about 7 percentage points vs. about 9 to 10 percentage points for PC with CO2 capture. The largest efficiency loss is due to the steam required for the water gas shift reaction. CO2 compression is second largest, but is less than for PC because the compression begins at a higher pressure.
Source: The Future of Coal, MIT, 2007

IGCC with CO2 Capture: Status
• IGCC and CO2 removal offered commercially, but have not operated in an integrated manner at power plants.
• Several worldwide, physical solvent-based operating non-power installations (3 in U.S.) with largest plant ~340 MW equivalent in size.
– Captured CO2 from Great Plains gasification plant in North Dakota piped approximately 200 miles to Canada for enhanced oil recovery (EOR); 2.7 million tons CO2 per year.
• Several projects appear to be under way.
Capture
Technology
Technology Type Chemistry
Technology Provider / Developer
Phase of Development Remarks
Selexol Absorption Polyethyleneglycol,
dimethyl ether blend
UOP LLC
53 plants existed in 1992 for industrial
application
Must be operated at high pressure (typically 1000 psi, at least 300 psi) for practical solvent capacity.
Rectisol Absorption Methanol Linde AG, Lurgi AG
Must be operated at high pressure (1000 psi to 400 psi) and low temperature (-40 F) for practical solvent capacity.
SEWGS Adsorption
Combined WGS catalyst with hydrotalcite adsorbent
Air Products Product development
Desorption kinetics must be improved; some loss in capacity with cycling.
Hydrotalcites Adsorption Anionic, layered clay materials
EPA/ORD, U of South Carolina
and others
Academic, small-scale
testing; sorbent
development
Sorbent works best at elevated temperatures (200 – 400 C); slow desorption kinetics; some loss in capacity with cycling.
Pre-combustion Capture Technologies

IGCC with CO2 Capture: Projects
Project Status
Centrica, Teesside, U.K.: EOR offshore, North Sea oilfields; 800 MWe, 5 Mt/yr CO2 injected; construction- 2009, completion- 2012.
July 2008- pending decision on transportation and storage decisions, particularly pipeline versus rail transportation.
EPCOR, Alberta, Canada: EOR; 270 MWe, 1.2 Mt/yr CO2 injected, Siemens SFG-500 (Selexol); completion- 2015.
August 2008- EPCOR announced a design partnership with Siemens for the Genesee IGCC plant, currently running as a SCPC plant.
GreenGen, Tianjin, China: EOR offshore; 650 MWe, CO2 capture quantity undetermined; Phase 1 (250 MWe) online 2011, final phase (expansion to 650 MWe) by 2016.
September 2009- Phase 1 construction started in June 2009.
Powerfuel, Yorkshire, U.K.: EOR offshore, North Sea oilfields; 900 MWe, 4.7 MtCO2 /yr. stored, Shell SCGP WQ (Selexol); Phase 1: construction- 2009, completion- 2012; Phase 2 completion 2014..
February 2009- a phased development plan announced for proposed Hatfield Colliery IGCC plant. GE Energy CCGT turbines to power the plant through in Phase 1. Phase in IGCC with Shell’s proprietary technology by 2014. The goal of this approach is to give the plant greater fuel flexibility while CCS technology matures.
ZeroGen, Brisbane, Australia: offshore storage, Northern Denison Trough; 530 MWe, 420 KtCO2 /yr. stored, Mitsubishi technology; construction- 2009, demonstration- 2015, completion- 2017.
June 2009- ZeroGen Pty Ltd, a subsidiary of the Queensland state-owned Stanwell Corporation, has announced the reconfiguration of the ZeroGen project into two stages. The project will now involve the development of a world-class demonstration plant by 2012, followed by an equally advanced full-scale plant labeled ‘ZeroGen Mark II’ by 2017.
RWE, Huerth, Germany: CO2 destination undetermined; 450 MWe, 2.6 MtCO2 /yr. stored; construction- 2010, completion- 2016.
August 2008- RWE made a final decision to move forward with plans to build a state of the art IGCC plant in Huerth, Germany. The plant will be fueled with local lignite and will be equipped with CCS technology. RWE said broad public acceptance was integral to their decision.
Monash Energy, Latrobe Valley, Australia: offshore storage, Gippsland Basin; CTL project, 30 kBPD/yr. (synthetic hydrocarbons), 10 MtCO2 /yr. stored; construction- 2009, completion- 2016.
May 2008- Monash Energy has invested $20 million on preliminary work related to the commercial and technical feasibility of an IGCC CTL CCS-equipped plant in Australia’s Latrobe Valley. As of December 2008, the project has been put on hold.

IGCC with Pre-combustion CO2 Capture : Development Needs
• Gas turbine for H2 -rich fuel gas• Improvement of economics and reliability of IGCC-
technology • Pilot and demo-plant testing
Collateral Impacts
• Carbon capture and compression requires significant amount of energy– Post combustion: heat for regeneration; electricity for CO2
compression– Gasification: electricity for O2 production, solvent pumping and cooling,
CO2 compression; steam for water-gas shift – Oxy-fuel combustion: electricity for O2 production, CO2 compression,
purification– potential for increase in emissions
• Carbon capture requires very clean flue gas – decrease in emissions of SO2 , NOx, and PM
• Use of controls for SO2 , NOx, and PM requires energy – potential for increase in emissions
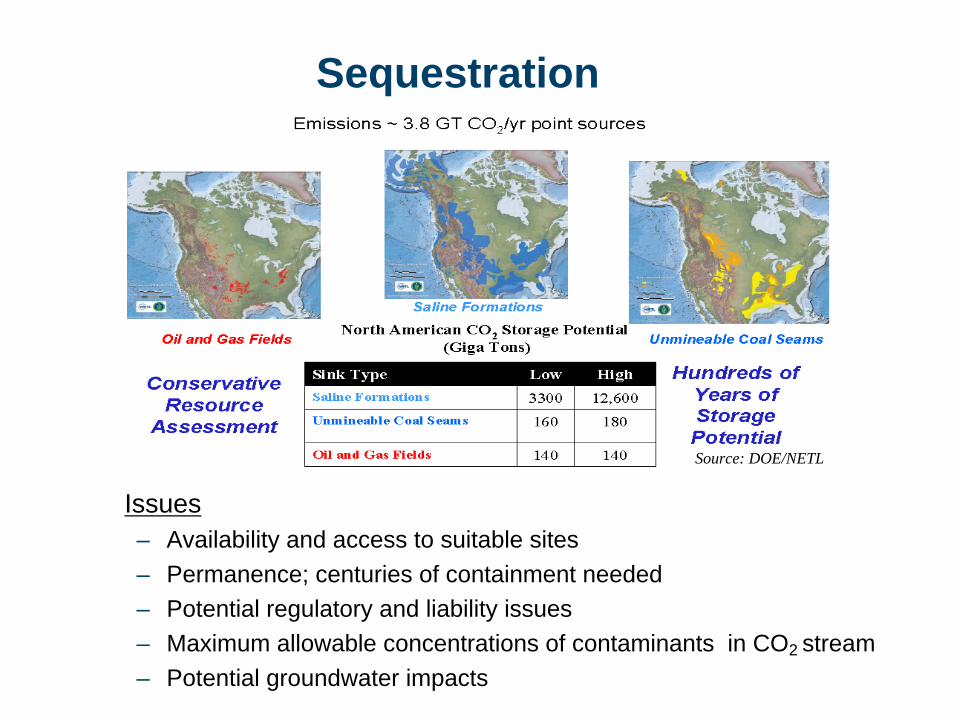
Sequestration
Issues– Availability and access to suitable sites– Permanence; centuries of containment needed– Potential regulatory and liability issues– Maximum allowable concentrations of contaminants in CO2 stream– Potential groundwater impacts
Source: DOE/NETL
Final Thoughts
• Demand for energy will expand due to increases in population and economic growth.• Anthropogenic activities are contributing to observed increase in atmospheric
concentrations of greenhouse gases and these increases are causing a warming of our planet.
• Worldwide energy-related CO2 emissions from coal use are expected to grow significantly through 2030.
• While technological progress is needed, efficiency gains and deployment of existing low-carbon energy will play a key role in meeting the needed CO2 reduction targets.
• Since coal-fired power plants are large sources, they potentially offer attractive opportunities for cost-effective reductions in CO2 .
• Development and use of more efficient generation technologies will reduce CO2emissions and save fuel costs at coal-fired power plants.
• Considering the climate change challenge, rapid development of mitigation approaches for coal-fired power plants is needed.
• Since climate change is a global concern, collective action is needed and the stakes are high from several vantage points.
• Climate change is forcing us to examine our needs and how we satisfy them. In this regard, it is providing an opportunity to move towards a more sustainable society.

Resources
• Intergovernmental Panel on Climate Change, Climate Change 2007: Climate Change Impacts, Adaptation, and Vulnerability, Summary for Policy Makers. April 2007. http://www.ipcc.ch/
• International Energy Agency: www.iea.org/
• U.S. EPA’s Climate Change site: www.EPA.gov/climate
• World Resources Institute: www.WRI.org
• Advanced Research Projects Agency: http://arpa-e.energy.gov/
• World Bank, World Development Report 2010: Climate Change and Development, Nov 2009. http://www.worldbank.org/wdr2010
• The Copenhagen Diagnosis, http://www.copenhagendiagnosis.com/

Our children and future generations are relying on us to be
responsible in preserving their environment.