local authority housing statistics: housing year ending ... authority housing statistics: year...
TRANSCRIPT

Introduction 2 Stock 3 Social Lettings 5 Stock amp Average Rent 6 Waiting Lists 7 Decent Homes delivery 9 Evictions 11 Accompanying Tables 12 Definitions 13 Technical Notes 15 Enquiries 20
Housing Statistical Release 18 January 2018
Responsible Statistician Peter Chapman Statistical enquiries Office hours 030344 40229 housingstatisticscommunitiesgsigovuk Media Enquiries 0303 444 1209 newsdeskcommunitiesgsigovuk Date of next publication January 2019
Local authority housing statistics Year ending March 2017 England
bull Local authorities in England owned 160 million dwellings on 1 April 2017 a decrease of 07 from the previous year There has been a decrease from 367 million on 1 April 1994 (Chart 2) This is due to Right to Buy sales and the large-scale voluntary transfer of local authority stock to Private Registered Providers
bull Local authority landlords in England made 112600 lettings
during 2016-17 This was a decrease of 7 compared with the 120500 lettings made in 2015-16 and follows a general decrease from 326600 in 2000-01 (Chart 3)
bull The average local authority social rent in England in 2016-17
was pound8720 per week (Table 1) This is 1 lower than in 2015-16 when the average local authority social rent in England was pound8781
bull There were 116 million households on local authority waiting
lists on 1 April 2017 a decrease of 2 on the 118 million on 1 April 2016 (Chart 4)
bull As at 1 April 2017 there were 79600 ldquonon-decentrdquo local
authority owned dwellings across England a decrease of 6 from 84900 compared to 1 April 2016 (Chart 6)
bull In 2016-17 local authorities reported that 5800 evictions
were carried out by court bailiffs a decrease of 10 compared to 2015-16 (Chart 7)
2 Housing Statistical Release
Introduction This statistical release covers social housing that is owned and managed by local authorities This is only part of social housing because Private Registered Providers (PRPs) formerly known as Housing Associations also own and manage social housing stock The lsquoSupplementary Informationrsquo section includes sources for information on Private Registered Provider Local authority stock is approximately 39 of all social stock with the remainder including PRPs and other public sector dwellings Stock owned by local authorities and private registered providers represent around 17 of the total stock of housing in England This is similar to the proportion of the stock at the beginning of the year (see chart 1)
Chart 1 Components of housing stock in England 1 April 2016
Source Live table 100 Dwelling stock Number of Dwellings by Tenure and district England 2016
This release presents information on local authority housing stock lettings average rents waiting lists decent homes delivery and evictions for England
For further info httpswwwgovukgovernmentstatistical-data-setslive-tables-on-dwelling-stock-including-vacants The table covering this topic is Live Table 100
3 Housing Statistical Release
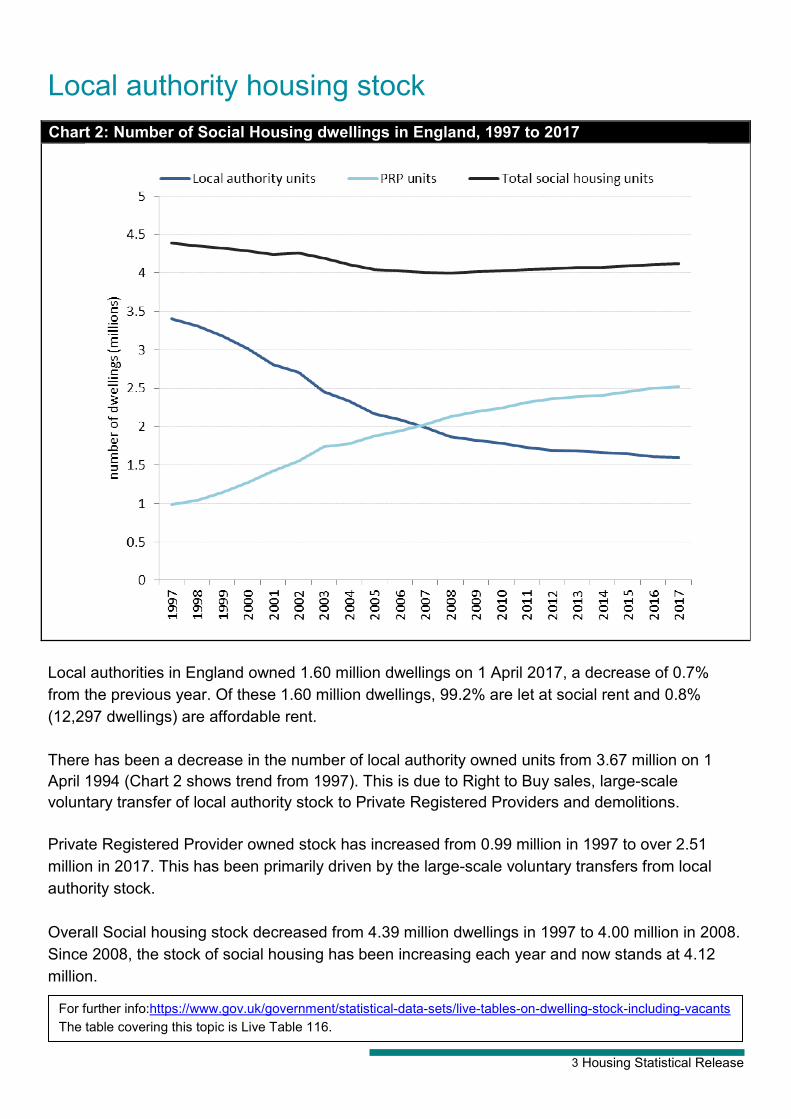
Local authority housing stock Chart 2 Number of Social Housing dwellings in England 1997 to 2017
Local authorities in England owned 160 million dwellings on 1 April 2017 a decrease of 07 from the previous year Of these 160 million dwellings 992 are let at social rent and 08 (12297 dwellings) are affordable rent There has been a decrease in the number of local authority owned units from 367 million on 1 April 1994 (Chart 2 shows trend from 1997) This is due to Right to Buy sales large-scale voluntary transfer of local authority stock to Private Registered Providers and demolitions Private Registered Provider owned stock has increased from 099 million in 1997 to over 251 million in 2017 This has been primarily driven by the large-scale voluntary transfers from local authority stock Overall Social housing stock decreased from 439 million dwellings in 1997 to 400 million in 2008 Since 2008 the stock of social housing has been increasing each year and now stands at 412 million
For further infohttpswwwgovukgovernmentstatistical-data-setslive-tables-on-dwelling-stock-including-vacants The table covering this topic is Live Table 116
4 Housing Statistical Release
Map 1 Number of local authority owned dwellings in England 1 April 2017
5 Housing Statistical Release
Lettings made by local authority landlords Chart 3 Number of lettings made to local authority owned dwellings 2001 to 2017
Local authority landlords in England made 112600 lettings in 2016-17 This was a decrease of 7 compared with the 120500 lettings made in 2015-16 and follows a decline from 326600 in 2000-01 (see Chart 3 above) Lettings have declined as stock has declined In 2016-17 the 112600 lettings represented 70 as a proportion of total stock (a slight decrease compared to lettings proportioning 75 of total stock in 2015-16) indicating less churn in the stock From 1st April 2012 local authorities were able to offer lsquoaffordable rentrsquo lettings There were approximately 2800 affordable rent lettings made to tenants new to social housing in 2016-17 which are included within the total reported here Affordable rent lettings to existing tenants are also included but have not been shown separately During 2016-17 69200 local authority lettings were made to new social housing tenants (a decrease of 7 from 2015-16) 32400 local authority lettings were made to existing social housing tenants (a decrease of 7 from 2015-16) and 11000 local authority lettings were made through mutual exchange schemes (an increase of 3 from 2015-16) Further information on the household type gender economic status ethnicity and nationality of lettings of both local authority and Private Registered Provider lettings can be found in the Social Housing Lettings release sourced from the CORE data collection They are available here httpswwwgovukgovernmentcollectionsrents-lettings-and-tenancies
For further info httpswwwgovukgovernmentstatistical-data-setslive-tables-on-rents-lettings-and-tenancies The live table covering this topic is Live Table 602
6 Housing Statistical Release
Local authority stock and average social rent by size of property Tables 1 and 2 show local authority social rented stock and average social rent by size of property for England and London respectively These tables exclude affordable rented properties and Houses in Multiple Occupation (HMO) hostel bed spaces
Table 1 Local authority social rented stock and average social rent by size of property for England 2016-17 Type Stock Average weekly rent (pound) Bedsits 38957 7438 One bedroom 457662 7689 Two bedrooms 530636 8682 Three bedrooms 513984 9554 Four bedrooms 39901 11330 Five bedrooms 3513 13255 Six or more bedrooms 798 14450 Total 1585450 8720
1 Figure does not include properties for affordable rent of HMO bed spaces so is lower than the total stock figure of 161 million The average local authority social rent in England in 2016-17 was pound8720 per week This is 1 lower than the average of pound8781 in 2015-16 This is in line with the Welfare Reform and Work Act 2016 ndash social rent reduction Details are available at httpswwwgovukguidancewelfare-reform-and-work-act-2016-social-rent-reduction The average local authority social rent in England in 2016-17 ranged from pound7438 per week for a bedsit to pound14450 per week for a property with six or more bedrooms As shown in Table 2 below the average social rent by property size for London is higher than the national average across all property sizes
Table 2 Local authority social rented stock and average social rent by size of property for London 2016-17 Type Stock Average weekly rent (pound) Bedsits 18643 8402 One bedroom 118090 9383 Two bedrooms 137511 10667 Three bedrooms 100012 12207 Four bedrooms 14656 14058 Five bedrooms 1926 15504 Six or more bedrooms 447 16788 Total 391285 10726
For further info httpswwwgovukgovernmentstatistical-data-setslive-tables-on-rents-lettings-and-tenancies The tables covering this topic are Live Tables 702 706 and 707
7 Housing Statistical Release
Households on the local authority housing waiting lists Chart 4 Number of households on local authority housing waiting lists in England 1997 to 2017
There were 116 million households on local authority waiting lists on 1 April 2017 a decrease of 2 on the 118 million on 1 April 2016 The Localism Act 2011 gave local authorities freedom to manage their own waiting lists so that they can decide who should qualify for social housing in their area and develop solutions which make best use of the social housing stock Since the Localism Act came into effect 95 of local authorities have reported changing their waiting list criteria due to the Act This change is partially responsible for the recent decrease in the number of households on waiting lists Waiting lists can be affected by other factors including reviews by local authorities to remove households who no longer require housing The frequency of local authority reviews varies considerably and therefore the total number of households on waiting lists is likely to overstate the number of households who still require housing Every local housing authority is required to have an allocation scheme for determining priorities and the procedure to be followed in allocating housing accommodation The scheme must be framed so that reasonable preference can be given to key vulnerable groups In 2016-17 there were 479000 households on local authority housing waiting lists in a reasonable preference category Five specified categories are shown in Chart 5 below In 2016-17 41 of the households on the local authority waiting list are in a Reasonable Preference category This is up from 38 in 2015-16
8 Housing Statistical Release
Chart 5 Households on local authority housing waiting list in specified Reasonable Preference categories 2013-14 to 2016-17
The largest Reasonable Preference group was ldquoPeople occupying insanitary or overcrowded housing or otherwise living in unsatisfactory housing conditionsrdquo which covered 250600 households The second largest group was ldquoPeople who need to move on medical or welfare grounds including grounds relating to a disabilityrdquo which covered 108900 households These groups were also the largest and second largest groups since 2013-14
For further info httpswwwgovukgovernmentstatistical-data-setslive-tables-on-rents-lettings-and-tenancies The table covering this topic is Live Table 600
9 Housing Statistical Release
Decent homes Chart 6 Number of non-decent local authority owned dwellings England 2001-2017
On 1 April 2017 there were 79600 ldquonon-decentrdquo local authority owned dwellings across England a decrease of 6 from 84900 on 1 April 2016 (see Chart 6 above) The proportion of ldquonon-de-centrdquo local authority dwellings remained the same between 1 April 2016 and 1 April 2017 at 5 These figures for non-decent homes are based on the number of properties that local authorities are directly aware of and do not include cases where tenants have refused improvement work An estimate of the total number of homes that are estimated to be non-decent including whether work has been refused or not is available in the English Housing Survey (EHS) httpswwwgovukgovernmentcollectionsenglish-housing-survey and the comparison between the figures is in Live Table 119
10 Housing Statistical Release
The numbers of dwellings in the Housing Revenue Account that received capital works and their associated expenditure are shown in Table 3 below
Table 3 Capital works on Housing Revenue Account (HRA) stock (installation replace-ment or major repairs) England 2016-17
Type Dwellings Spend (poundm) Average per dwelling (pound)
Rewiring 48762 84 1731 Roof structure 5488 37 6759 Roof covering 29169 163 5584 Doors 75338 66 873 Kitchens 54218 226 4177 Bathrooms 53146 151 2836 Replacement of windows 55616 123 2220 Replacement of boilers 74338 191 2576 Installation of insulation 22337 78 3500 Installation of renewable energies 3127 15 4748 Other 248048 772 3112 Total spend 1907
With the exception of ldquoOtherrdquo the most common types of capital work in 2016-17 were on doors (75338 dwellings) and replacement of boilers (74338 dwellings) However the largest amount of spending again with the exception of ldquoOtherrdquo was on kitchens (pound226m) The highest cost per dwelling of capital work is on roof structure and coverings and kitchens whereas the lowest cost per capital work is on doors
For further info hhttpswwwgovukgovernmentcollectionsdwelling-stock-including-vacants The table covering this topic is Live Table 119
11 Housing Statistical Release
Evictions carried out by local authority landlords Chart 7 Evictions carried out by local authority landlords England 2013-14 to 2016-17
In 2016-17 local authorities reported that 5800 evictions were carried out by court bailiffs a decrease of 10 compared to 2015-16 This represents less than 04 of the 160 million local authority dwelling stock Possession orders and evictions of local authority housing tenants can be obtained by local authority landlords under Sections 82 and 82A of the Housing Act 1985 and section 127 of the Housing Act 1996 The total number of evictions includes only properties recovered following the execution of a warrant of possession by the court bailiffs It does not include abandonment even where a property is abandoned in the period between a warrant of possession and the execution of that warrant
12 Housing Statistical Release
Accompanying Tables The complete set of Local Authority Housing Statistics (LAHS) data collected from local authorities can be found on this web page httpswwwgovukgovernmentpublicationscompleting-local-authority-housing-statistics-2016-to-2017-guidance-notes Associated live tables which are updated with LAHS data alongside this release can be accessed from the summary web pages Live tables on dwelling stock (including vacants) httpswwwgovukgovernmentstatistical-data-setslive-tables-on-dwelling-stock-including-vacants Table 100 Number of Dwellings by Tenure and district England 2008-09 to 2016-17 (This table
will be updated in April once private sector dwelling data are available) Table 115 Dwelling stock PRP stock by district England 1997-2017 Table 116 Local authority stock by district England1994-2017 Table 119 Stock of non-decent homes in the Social Rented Sector England 2001-2017 (This
table will be updated on 25 January 2018) Table 612 Local authority vacant dwellings England 1989 ndash 2017 (with chart) Live tables on rents lettings and tenancies httpswwwgovukgovernmentstatistical-data-setslive-tables-on-rents-lettings-and-tenancies Table 600 Numbers of households on local authorities housing waiting lists by district England
1997-2017 Table 602 Local authority owned dwellings let by local authority England 2000-01 to 2016-17 Table 701 Local authority housing average weekly rents by country (Discontinued 2017) Table 702 Local authority average weekly rents by district from 1998-99 Table 704 Rents Private Registered Provider (PRP) rents by district England 1997 to 2017 Table 705 Local authority average weekly rents United Kingdom 2004-05 to 2015-16 (Discon-
tinued 2017) Table 706 Local authority social rented stock and average social rent by size of property
England 2016-17 Table 707 Local authority social rented stock and average social rent by size of property London 2016-17operty
13 Housing Statistical Release
Definitions Housing stock data Further information on lsquoNotes and definitions for housing stock datarsquo is available from the Departments website at httpswwwgovukdwelling-stock-data-notes-and-definitions-includes-hfr-full-guidance-notes-and-returns-form This information explains the different data sources used to calculate total stock figures for Eng-land and stock figures by tenure as well as the associated data sources For total local authority stock figures LAHS is the preferred data source Live table 100 provides the number of local au-thority dwelling in each LA district by tenure Social housing stock in an area is made up of local authority owned stock and stock owned by Pri-vate Registered Providers The Homes and Communities Agency (HCA) took over responsibility for the regulation of social housing providers in England on 1 April 2012 The HCArsquos Statistical Da-ta Return (SDR) is the preferred data source This can be found here httpswwwgovukgovernmentstatisticsstatistical-data-return-2016-to-2017 Further information about local authority LSVT to Private Registered Providers can be found at httpwebarchivenationalarchivesgovuk20140805133148httpwwwhomesandcommunitiescoukourworkexisting-stocklsvt Further information and data about Right To Buy and other sales of social stock can be found in the Live Tables at httpswwwgovukgovernmentorganisationsdepartment-for-communities-and-local-governmentseriessocial-housing-sales-including-right-to-buy-and-transfers Waiting lists The English Housing Survey (EHS) asks questions on the number of households on housing wait-ing lists The numbers reported by households on the EHS are much lower than those reported by local authorities on the LAHS return See the EHS household report chapter 3 httpswwwgovukgovernmentcollectionsenglish-housing-survey Social lettings data Local authority lettings information is reported on the LAHS return and most local authorities as well as all Private Registered Providers also report information on the CORE (Continuous Record-ing of Lettings and Sales) data collection system which can be found here httpscorecommunitiesgovuk The latest statistical release provides information on lettings of social housing in England during 2014 to 2015 by local authorities and Private Registered Providers and can be found here httpswwwgovukgovernmentcollectionsrents-lettings-and-tenancies The 2016 to 2017 figures will be published on the 30 January 2018 Lettings made by Private Registered Providers are also collected on the HCArsquos SDR Types of social let Existing social tenant - immediately before the current let the tenant had a secure assured flexi-ble fixed term introductory starter demoted or family intervention tenancy New social tenant ndash tenantrsquos last dwelling was not a social housing dwelling (whether owned or managed by your local authority or another social landlord) Mutual exchange tenant ndash tenant swaps dwellings with another social tenant
14 Housing Statistical Release
Rents Local authorities can now offer social housing at two different rent levels social rent and afforda-ble rent Social rented housing is housing owned and managed by local authorities and other registered providers for which target rents are determined through the national rent regime Affordable rented housing is housing let by registered providers of social housing to households who are eligible for social rented housing Affordable rent is not subject to the national rent regime but is subject to other rent controls that require a rent of no more than 80 of the local market rent For more detailed information follow the link below httpswwwgovukhousingfunding-programmes Local authorities were not able to let properties at affordable rent until 2012-13 meaning the LAHS return for 2012-13 collected data on affordable rent lettings made by local authorities for the first time As such Table 3 is based on social rent stock only In addition the data quality of the afford-able rent stock lettings and rent figures are not as high as the social rented stock figures Decent homes programme In 2001 government established the decent homes standard for all social housing (set out in guid-ance updated in 2006) see link to decent homes guidance httpswwwgovukgovernmentpublicationsa-decent-home-definition-and-guidance Local authorities report information on decent homes activity through the LAHS return Private Registered Providers report similar information through the HCArsquos SDR In the LAHS return non-decent local authority housing stock includes stock owned by local authorities in other areas Estimates on the numbers of non-decent homes are also available from the English Housing Sur-vey httpswwwgovukgovernmentcollectionsenglish-housing-survey Decent homes figures from different sources are summarised in live table 119 httpswwwgovukgovernmentstatistical-data-setslive-tables-on-dwelling-stock-including-vacants Reported levels of decent homes have been consistently lower in LAHS than EHS There are a number of reasons for this For example EHS figures are based on a physical inspection of surveyed properties While in LAHS only properties that LAs have been made aware of are in-cluded Also in LAHS properties where the tenant refused work are excluded LAHS data should be used when accessing the decent homes standard for social housing Evictions The Ministry of Justice publishes quarterly National Statistics on possession actions issued in county courts by mortgage lenders and social and private landlords in England and Wales Whilst the LAHS return collects information on the evictions from properties owned by local authority landlords corresponding information is not collected from Private Registered Providers Therefore where a breakdown by type of social landlord is not required the best source would be the Minis-try of Justicersquos statistics on possession actions (see table 3 of their statistical tables) Please note that there are some differences as 1) the Ministry of Justice publishes data on the number of possession claims and number of possession claims leading to an order rather than the number of orders 2) the information is taken from courts administrative data rather than local au-thority returns and 3) the Ministry Of Justicersquos published tables include both England and Wales A link to the latest Statistical Release can be found at httpswwwgovukgovernmentstatisticsmortgage-and-landlord-possession-statistics-july-to-september-2017
15 Housing Statistical Release
Technical notes
Data collection
The information collected in the LAHS is a combination of snapshot and financial year information The snapshot information refers to 1 April following the end of the financial year For example in the 2016-17 data collections this is 1 April 2017 Other information refers to financial years so for the 2016-17 data collection the reporting period is 1 April 2016 to 31 March 2017 The LAHS data collection is a non-statutory annual return and is collected from all lower tier local authorities (including unitary authorities) in England that were in existence over the 2016-17 financial year (326 local authorities)
Data quality The response rates for 2016-17 were as follows
bull All 326 of the 326 local authorities provided some data for the LAHS return
bull 6 local authorities provided ldquounfinalisedrdquo returns Local authorities are required to sign off their return to confirm it passes a range of quality checks and these local authorities have not signed off the return
The LAHS return contains mandatory and voluntary questions Where there are mandatory questions these are completed by all local authorities that submit a return Some authorities may not report data for all voluntary parts of the return All returns undergo validation and cross-checking and late returns are chased to ensure overall response is as complete and accurate as possible Anomalous data are highlighted and verified by contacting the local authority Where the local authority has not responded to the query an assessment has been made as to the likelihood of the data being correct Where the figures are highly likely to be incorrect an imputation has been included for the purposes of producing the regional and national totals where possible Imputations attempt to take into account missing or incorrect data in order to provide national aggregates This method has been used in the LAHS (and previously HSSA and BPSA) data collection process for many years All of the national totals reported in this statistical release include imputed data for missing returns Approximately 78 of the 326 local authoritiesrsquo returns required imputation for at least one question This meant around 4 of all data were imputed In general terms one of five approaches to imputation are taken direct carry-over of the value reported in 2015-16 an assumption of 0 based on other sources of equivalent data (including adjusting values reported in 2015-16) calculations from data provided and based on values reported by similar authorities in 2016-17 The latter approach is particularly taken when calculating items which are sub-components of other reported items
16 Housing Statistical Release
How do the LAHS social rent figures compare to EHS SDR and Core data Social Rented Sector rents are consistently higher from the EHS compared with LAHS and SDR The reasons for this are unclear but are likely to be due to differences in methodology EHS data is reported by the tenant where as LAHS and SDR come from the social landlord The LAHS figures are consistently higher than those from CORE lettings LAHS figures represent general needs and supported housing whereas CORE only contains general needs As supported needs rents tend to be higher than general needs this could explain why LAHS figures are higher than from CORE Differences will also be caused by relative levels of turnover across local au-thorities since CORE only records new lettings The SDR figures on housing association rents are consistently higher than those from CORE let-tings Both sets of figures represent general needs housing only but differences will be caused by relative levels of turnover across local authorities since CORE only records new lettings All four sources show similar annual increases for the last few years
Revisions policy
This policy has been developed in accordance with the UK Statistics Authority Code of Practice for Official statistics and the Ministry of Housing Communities and Local Government Revisions Policy (found at httpswwwgovukgovernmentpublicationsstatistical-notice-dclg-revisions-policy) There are two types of revisions that the policy covers
Non-Scheduled Revisions Where a substantial error has occurred as a result of the compilation imputation or dissemination process the statistical release live tables and other accompanying releases will be updated with a correction notice as soon as is practical
Scheduled Revisions Revisions are scheduled to be made to the complete dataset to reflect changes to Sections I and A The changes to Section I will be due to representations made by local authorities as part of the New Homes Bonus allocation process The changes to Section A will be as part of the limit rent setting process These revisions will be made in early 2018 Any revisions made by local authorities to their figures after the dataset has been frozen (ie after the above two set changes are incorporated) due to either errors found in their submission or failure to meet the deadline will be validated and kept internally but no changes will be made to the published statistical release When the statistical release annual datasets and accompanying live tables for the following year are published these revisions will be incorporated Revisions will normally only be made to one year prior to the year that is being published
17 Housing Statistical Release
Where LAHS data are published in live tables these tables will be updated annually at the same time as the publication of this statistical release The exception to this is when a significant error has been identified as described previously In this case these tables will be updated as soon as the error is found and a note will be placed on the table to notify users of the reason for the change
Revisions to historic data (all years before the year previously published) should only be made where there is a substantial revision such as a change in methodology or definition Where there are small revisions that do not significantly change historic data internal updates are maintained
Uses of the data
The data in this Statistical Release are important for a number of different purposes They meet the requirements of informed decision-making by the Secretary of State for Communities and Local Government other government departments local authorities other public services business researchers and the public The data collected on the LAHS form provide an important part of the evidence base for the assessment of future housing requirements and are used to inform evidence-based policy decisions and as a basis for answering Parliamentary Questions and other requests for information by Ministers local authorities and the general public
User engagement
Users are encouraged to provide feedback on how these statistics are used and how well they meet user needs Comments on any issues relating to this statistical release are welcomed and encouraged Responses should be addressed to the Public enquiries contact given in the Enquiries section below The Departments engagement strategy to meet the needs of statistics users is published here httpswwwgovukgovernmentpublicationsengagement-strategy-to-meet-the-needs-of-statistics-users
Devolved administration statistics
Statistics relating to social housing stock in the other UK countries are published by the devolved administrations In all countries data are collected from returns made by the stock owning authori-ty (local authority Private Registered Provider or equivalent) The Scottish Government publishes statistics on social housing which are available through their website httpwwwgovscotTopicsStatisticsBrowseHousing-Regenerationutm_source=websiteamputm_medium=navigationamputm_campaign=statistics-topics
18 Housing Statistical Release
In particular they produce an annual Key Trend Summary This can be accessed at httpsbetagovscotpublicationshousing-statistics-scotland-2017-key-trends-summary The Welsh Assembly Government publishes statistics on social housing which are available at httpgovwalesstatistics-and-researchsocial-housing-stock-rentslang=en In Northern Ireland the Department for Social Development produces an annual publication which brings together housing statistics collected by the Department including statistics on social housing httpswwwcommunities-nigovuktopicshousing-statistics There are a number of differences between the statistics that are collected and published for local authorities in England through the LAHS return and the other UK countries These differences can arise for a number of reasons but the majority are a result of different legislation methodology or coverage Details describing these differences can be found at the following link httpswwwgovukgovernmentorganisationsdepartment-for-communities-and-local-governmentserieslocal-authority-housing-data The table below shows the main topics collected from the LAHS return and provides links to the corresponding statistics published by the devolved administrations
Appendix 1 Links to related statistics in devolved administrations Topic Scotland Wales Northern Ireland Council Housing Stock httpwwwgovscotTopicsSta
tisticsBrowseHousing-RegenerationHSfSStock
httpwalesgovukstatistics-and-researchsocial-housing-stock-rentslang=en
httpswwwfinance-nigovuktopicsstatistics-and-researchhousing-stock-statistics
Decent Homes Programme Scottish Housing Quality
Programme httpwwwgovscotTopicsBuilt-Environ-mentHousing16342shqsprogress
Welsh Housing Quality Standard httpwalesgovukstatistics-and-researchsocial-housing-quality-welsh-housing-quality-standard-data-collectionlang=en
httpswwwcommunities-nigovukdecent-homes-standard
Stock Condition amp Fitness Standards httpwwwscotlandgovuktop
icsstatisticsshcs
httpwalesgovukstatistics-and-researchwelsh-housing-quality-standardlang=en
httpswwwnihegovuknihcs_2016_preliminary_reportpdf
Council House Vacant Stock httpwwwscotlandgovukTo
picsStatisticsBrowseHousing-Regenera-tionHSfSStockManagement
httpwalesgovukstatistics-and-researchsocial-housing-vacancies-data-collectionlang=en
httpswwwnidirectgovukrating-empty-homes
Energy Efficiency SAP Ratings httpwwwscotlandgovuktop
icsstatisticsshcs
httpgovwalestopicsenvironmentcountry-sideenergyefficiencyenergy-efficiency-strategy-for-waleslang=en
httpswwwcommunities-nigovukpublicationsnorthern-ireland-housing-statistics-2016-17
Houses of Multiple Occupations httpwwwscotlandgovukTo
picsStatisticsBrowseHousing-RegenerationHSfSHMO
httpgovwalestopicsplanningpolicyguidanceandleafletshouses-in-multiple-occupation-practice-guidancelang=en
Not collected
19 Housing Statistical Release
Private Sector Renewal Assistance httpwwwscotlandgovukTo
picsStatisticsBrowseHousing-Regenera-tionHSfSImprovements
httpgovwalestopicshousing-and-regenerationlang=en
httpswwwcommunities-nigovukpublicationsnorthern-ireland-housing-statistics-2016-17
Affordable Housing Provision httpwwwscotlandgovukTo
picsStatisticsBrowseHousing-RegenerationHSfSNewBuild
httpwalesgovukstatistics-and-researchaffordable-housing-provisionlang=en
Not collected
Lettings Allocations httpwwwscotlandgovukTopicsStatisticsBrowseHousing-Regenera-tionHSfSStockManagement
httpwalesgovukstatistics-and-researchsocial-housing-lettings-data-collectionlang=en
httpswwwcommunities-nigovukpublicationsnorthern-ireland-housing-statistics-2016-17
Waiting Lists httpwwwscotlandgovukTopicsStatisticsBrowseHousing-Regenera-tionHSfSStockManagement
Not collected httpswwwcommunities-nigovukpublicationsnorthern-ireland-housing-statistics-2016-17
Landlord Possessions Evictions httpwwwscotlandgovukTo
picsStatisticsBrowseHousing-Regenera-tionHSfSStockManagement
httpwalesgovuktopicsstatisticsheadlineshousing2011111207lang=en
Not collected
Rent Arrears httpwwwscotlandgovukTopicsStatisticsBrowseHousing-RegenerationHSfSHRA2008-09
httpwalesgovukstatistics-and-researchsocial-landlord-possessions-evictionslang=en
httpswwwcommunities-nigovuktopicshousing-statistics
National Statistics
This Statistical Release is published at 930am on a date which has been pre-announced on the MHCLG Statistics Release Calendar httpswwwgovukgovernmentstatisticsannouncementsutf8=E29C93amporganisations5B5D=department-for-communities-and-local-government
A list of officials who have received pre-release access to this Statistical Release up to 24 hours in advance of publication is available on the Departments website httpswwwgovukgovernmentorganisationsdepartment-for-communities-and-local-governmentaboutstatisticspre-release-access-to-official-statistics
Next Publication
The next release Local Authority Housing Statistics will be released in January 2019 The precise date will be announced on the MHCLG Statistics Release Calendar httpswwwgovukgovernmentstatisticsannouncementsutf8=E29C93amporganisations5B5D=department-for-communities-and-local-government
20 Housing Statistical Release
Enquiries
Media enquiries 0303 444 1209 Email newsdeskcommunitiesgsigovuk Public enquiries and Responsible Statistician Peter Chapman Email housingstatisticscommunitiesgovuk Information on Official Statistics is available via the UK Statistics Authority website httpwwwstatisticsauthoritygovuk Information about statistics at MHCLG is available via the Departments website wwwgovukgovernmentorganisationsdepartment-for-communities-and-local-governmentaboutstatistics
21 Housing Statistical Release
copy Crown copyright 2018 Copyright in the typographical arrangement rests with the Crown
You may re-use this information (not including logos) free of charge in any format or medium under the terms of the Open Government Licence To view this licencehttpwwwnationalarchivesgovukdocopen-government-licenceversion3 or write to the Information Policy Team The National Archives Kew London TW9 4DU or email psinationalarchivesgsigovuk
This documentpublication is also available on our website at wwwgovukmhclg
If you have any enquiries regarding this documentpublication complete the form at httpformscommunitiesgovuk or write to us at
Ministry of Housing Communities and Local Government Fry Building 2 Marsham Street London SW1P 4DF Telephone 030 3444 0000 January 2018
For all our latest news and updates follow us on Twitter httpstwittercommhclg
ISBN 978-1-4098-5177-6

2 Housing Statistical Release
Introduction This statistical release covers social housing that is owned and managed by local authorities This is only part of social housing because Private Registered Providers (PRPs) formerly known as Housing Associations also own and manage social housing stock The lsquoSupplementary Informationrsquo section includes sources for information on Private Registered Provider Local authority stock is approximately 39 of all social stock with the remainder including PRPs and other public sector dwellings Stock owned by local authorities and private registered providers represent around 17 of the total stock of housing in England This is similar to the proportion of the stock at the beginning of the year (see chart 1)
Chart 1 Components of housing stock in England 1 April 2016
Source Live table 100 Dwelling stock Number of Dwellings by Tenure and district England 2016
This release presents information on local authority housing stock lettings average rents waiting lists decent homes delivery and evictions for England
For further info httpswwwgovukgovernmentstatistical-data-setslive-tables-on-dwelling-stock-including-vacants The table covering this topic is Live Table 100
3 Housing Statistical Release
Local authority housing stock Chart 2 Number of Social Housing dwellings in England 1997 to 2017
Local authorities in England owned 160 million dwellings on 1 April 2017 a decrease of 07 from the previous year Of these 160 million dwellings 992 are let at social rent and 08 (12297 dwellings) are affordable rent There has been a decrease in the number of local authority owned units from 367 million on 1 April 1994 (Chart 2 shows trend from 1997) This is due to Right to Buy sales large-scale voluntary transfer of local authority stock to Private Registered Providers and demolitions Private Registered Provider owned stock has increased from 099 million in 1997 to over 251 million in 2017 This has been primarily driven by the large-scale voluntary transfers from local authority stock Overall Social housing stock decreased from 439 million dwellings in 1997 to 400 million in 2008 Since 2008 the stock of social housing has been increasing each year and now stands at 412 million
For further infohttpswwwgovukgovernmentstatistical-data-setslive-tables-on-dwelling-stock-including-vacants The table covering this topic is Live Table 116
4 Housing Statistical Release
Map 1 Number of local authority owned dwellings in England 1 April 2017
5 Housing Statistical Release
Lettings made by local authority landlords Chart 3 Number of lettings made to local authority owned dwellings 2001 to 2017
Local authority landlords in England made 112600 lettings in 2016-17 This was a decrease of 7 compared with the 120500 lettings made in 2015-16 and follows a decline from 326600 in 2000-01 (see Chart 3 above) Lettings have declined as stock has declined In 2016-17 the 112600 lettings represented 70 as a proportion of total stock (a slight decrease compared to lettings proportioning 75 of total stock in 2015-16) indicating less churn in the stock From 1st April 2012 local authorities were able to offer lsquoaffordable rentrsquo lettings There were approximately 2800 affordable rent lettings made to tenants new to social housing in 2016-17 which are included within the total reported here Affordable rent lettings to existing tenants are also included but have not been shown separately During 2016-17 69200 local authority lettings were made to new social housing tenants (a decrease of 7 from 2015-16) 32400 local authority lettings were made to existing social housing tenants (a decrease of 7 from 2015-16) and 11000 local authority lettings were made through mutual exchange schemes (an increase of 3 from 2015-16) Further information on the household type gender economic status ethnicity and nationality of lettings of both local authority and Private Registered Provider lettings can be found in the Social Housing Lettings release sourced from the CORE data collection They are available here httpswwwgovukgovernmentcollectionsrents-lettings-and-tenancies
For further info httpswwwgovukgovernmentstatistical-data-setslive-tables-on-rents-lettings-and-tenancies The live table covering this topic is Live Table 602
6 Housing Statistical Release
Local authority stock and average social rent by size of property Tables 1 and 2 show local authority social rented stock and average social rent by size of property for England and London respectively These tables exclude affordable rented properties and Houses in Multiple Occupation (HMO) hostel bed spaces
Table 1 Local authority social rented stock and average social rent by size of property for England 2016-17 Type Stock Average weekly rent (pound) Bedsits 38957 7438 One bedroom 457662 7689 Two bedrooms 530636 8682 Three bedrooms 513984 9554 Four bedrooms 39901 11330 Five bedrooms 3513 13255 Six or more bedrooms 798 14450 Total 1585450 8720
1 Figure does not include properties for affordable rent of HMO bed spaces so is lower than the total stock figure of 161 million The average local authority social rent in England in 2016-17 was pound8720 per week This is 1 lower than the average of pound8781 in 2015-16 This is in line with the Welfare Reform and Work Act 2016 ndash social rent reduction Details are available at httpswwwgovukguidancewelfare-reform-and-work-act-2016-social-rent-reduction The average local authority social rent in England in 2016-17 ranged from pound7438 per week for a bedsit to pound14450 per week for a property with six or more bedrooms As shown in Table 2 below the average social rent by property size for London is higher than the national average across all property sizes
Table 2 Local authority social rented stock and average social rent by size of property for London 2016-17 Type Stock Average weekly rent (pound) Bedsits 18643 8402 One bedroom 118090 9383 Two bedrooms 137511 10667 Three bedrooms 100012 12207 Four bedrooms 14656 14058 Five bedrooms 1926 15504 Six or more bedrooms 447 16788 Total 391285 10726
For further info httpswwwgovukgovernmentstatistical-data-setslive-tables-on-rents-lettings-and-tenancies The tables covering this topic are Live Tables 702 706 and 707
7 Housing Statistical Release
Households on the local authority housing waiting lists Chart 4 Number of households on local authority housing waiting lists in England 1997 to 2017
There were 116 million households on local authority waiting lists on 1 April 2017 a decrease of 2 on the 118 million on 1 April 2016 The Localism Act 2011 gave local authorities freedom to manage their own waiting lists so that they can decide who should qualify for social housing in their area and develop solutions which make best use of the social housing stock Since the Localism Act came into effect 95 of local authorities have reported changing their waiting list criteria due to the Act This change is partially responsible for the recent decrease in the number of households on waiting lists Waiting lists can be affected by other factors including reviews by local authorities to remove households who no longer require housing The frequency of local authority reviews varies considerably and therefore the total number of households on waiting lists is likely to overstate the number of households who still require housing Every local housing authority is required to have an allocation scheme for determining priorities and the procedure to be followed in allocating housing accommodation The scheme must be framed so that reasonable preference can be given to key vulnerable groups In 2016-17 there were 479000 households on local authority housing waiting lists in a reasonable preference category Five specified categories are shown in Chart 5 below In 2016-17 41 of the households on the local authority waiting list are in a Reasonable Preference category This is up from 38 in 2015-16
8 Housing Statistical Release
Chart 5 Households on local authority housing waiting list in specified Reasonable Preference categories 2013-14 to 2016-17
The largest Reasonable Preference group was ldquoPeople occupying insanitary or overcrowded housing or otherwise living in unsatisfactory housing conditionsrdquo which covered 250600 households The second largest group was ldquoPeople who need to move on medical or welfare grounds including grounds relating to a disabilityrdquo which covered 108900 households These groups were also the largest and second largest groups since 2013-14
For further info httpswwwgovukgovernmentstatistical-data-setslive-tables-on-rents-lettings-and-tenancies The table covering this topic is Live Table 600
9 Housing Statistical Release
Decent homes Chart 6 Number of non-decent local authority owned dwellings England 2001-2017
On 1 April 2017 there were 79600 ldquonon-decentrdquo local authority owned dwellings across England a decrease of 6 from 84900 on 1 April 2016 (see Chart 6 above) The proportion of ldquonon-de-centrdquo local authority dwellings remained the same between 1 April 2016 and 1 April 2017 at 5 These figures for non-decent homes are based on the number of properties that local authorities are directly aware of and do not include cases where tenants have refused improvement work An estimate of the total number of homes that are estimated to be non-decent including whether work has been refused or not is available in the English Housing Survey (EHS) httpswwwgovukgovernmentcollectionsenglish-housing-survey and the comparison between the figures is in Live Table 119
10 Housing Statistical Release
The numbers of dwellings in the Housing Revenue Account that received capital works and their associated expenditure are shown in Table 3 below
Table 3 Capital works on Housing Revenue Account (HRA) stock (installation replace-ment or major repairs) England 2016-17
Type Dwellings Spend (poundm) Average per dwelling (pound)
Rewiring 48762 84 1731 Roof structure 5488 37 6759 Roof covering 29169 163 5584 Doors 75338 66 873 Kitchens 54218 226 4177 Bathrooms 53146 151 2836 Replacement of windows 55616 123 2220 Replacement of boilers 74338 191 2576 Installation of insulation 22337 78 3500 Installation of renewable energies 3127 15 4748 Other 248048 772 3112 Total spend 1907
With the exception of ldquoOtherrdquo the most common types of capital work in 2016-17 were on doors (75338 dwellings) and replacement of boilers (74338 dwellings) However the largest amount of spending again with the exception of ldquoOtherrdquo was on kitchens (pound226m) The highest cost per dwelling of capital work is on roof structure and coverings and kitchens whereas the lowest cost per capital work is on doors
For further info hhttpswwwgovukgovernmentcollectionsdwelling-stock-including-vacants The table covering this topic is Live Table 119
11 Housing Statistical Release
Evictions carried out by local authority landlords Chart 7 Evictions carried out by local authority landlords England 2013-14 to 2016-17
In 2016-17 local authorities reported that 5800 evictions were carried out by court bailiffs a decrease of 10 compared to 2015-16 This represents less than 04 of the 160 million local authority dwelling stock Possession orders and evictions of local authority housing tenants can be obtained by local authority landlords under Sections 82 and 82A of the Housing Act 1985 and section 127 of the Housing Act 1996 The total number of evictions includes only properties recovered following the execution of a warrant of possession by the court bailiffs It does not include abandonment even where a property is abandoned in the period between a warrant of possession and the execution of that warrant
12 Housing Statistical Release
Accompanying Tables The complete set of Local Authority Housing Statistics (LAHS) data collected from local authorities can be found on this web page httpswwwgovukgovernmentpublicationscompleting-local-authority-housing-statistics-2016-to-2017-guidance-notes Associated live tables which are updated with LAHS data alongside this release can be accessed from the summary web pages Live tables on dwelling stock (including vacants) httpswwwgovukgovernmentstatistical-data-setslive-tables-on-dwelling-stock-including-vacants Table 100 Number of Dwellings by Tenure and district England 2008-09 to 2016-17 (This table
will be updated in April once private sector dwelling data are available) Table 115 Dwelling stock PRP stock by district England 1997-2017 Table 116 Local authority stock by district England1994-2017 Table 119 Stock of non-decent homes in the Social Rented Sector England 2001-2017 (This
table will be updated on 25 January 2018) Table 612 Local authority vacant dwellings England 1989 ndash 2017 (with chart) Live tables on rents lettings and tenancies httpswwwgovukgovernmentstatistical-data-setslive-tables-on-rents-lettings-and-tenancies Table 600 Numbers of households on local authorities housing waiting lists by district England
1997-2017 Table 602 Local authority owned dwellings let by local authority England 2000-01 to 2016-17 Table 701 Local authority housing average weekly rents by country (Discontinued 2017) Table 702 Local authority average weekly rents by district from 1998-99 Table 704 Rents Private Registered Provider (PRP) rents by district England 1997 to 2017 Table 705 Local authority average weekly rents United Kingdom 2004-05 to 2015-16 (Discon-
tinued 2017) Table 706 Local authority social rented stock and average social rent by size of property
England 2016-17 Table 707 Local authority social rented stock and average social rent by size of property London 2016-17operty
13 Housing Statistical Release
Definitions Housing stock data Further information on lsquoNotes and definitions for housing stock datarsquo is available from the Departments website at httpswwwgovukdwelling-stock-data-notes-and-definitions-includes-hfr-full-guidance-notes-and-returns-form This information explains the different data sources used to calculate total stock figures for Eng-land and stock figures by tenure as well as the associated data sources For total local authority stock figures LAHS is the preferred data source Live table 100 provides the number of local au-thority dwelling in each LA district by tenure Social housing stock in an area is made up of local authority owned stock and stock owned by Pri-vate Registered Providers The Homes and Communities Agency (HCA) took over responsibility for the regulation of social housing providers in England on 1 April 2012 The HCArsquos Statistical Da-ta Return (SDR) is the preferred data source This can be found here httpswwwgovukgovernmentstatisticsstatistical-data-return-2016-to-2017 Further information about local authority LSVT to Private Registered Providers can be found at httpwebarchivenationalarchivesgovuk20140805133148httpwwwhomesandcommunitiescoukourworkexisting-stocklsvt Further information and data about Right To Buy and other sales of social stock can be found in the Live Tables at httpswwwgovukgovernmentorganisationsdepartment-for-communities-and-local-governmentseriessocial-housing-sales-including-right-to-buy-and-transfers Waiting lists The English Housing Survey (EHS) asks questions on the number of households on housing wait-ing lists The numbers reported by households on the EHS are much lower than those reported by local authorities on the LAHS return See the EHS household report chapter 3 httpswwwgovukgovernmentcollectionsenglish-housing-survey Social lettings data Local authority lettings information is reported on the LAHS return and most local authorities as well as all Private Registered Providers also report information on the CORE (Continuous Record-ing of Lettings and Sales) data collection system which can be found here httpscorecommunitiesgovuk The latest statistical release provides information on lettings of social housing in England during 2014 to 2015 by local authorities and Private Registered Providers and can be found here httpswwwgovukgovernmentcollectionsrents-lettings-and-tenancies The 2016 to 2017 figures will be published on the 30 January 2018 Lettings made by Private Registered Providers are also collected on the HCArsquos SDR Types of social let Existing social tenant - immediately before the current let the tenant had a secure assured flexi-ble fixed term introductory starter demoted or family intervention tenancy New social tenant ndash tenantrsquos last dwelling was not a social housing dwelling (whether owned or managed by your local authority or another social landlord) Mutual exchange tenant ndash tenant swaps dwellings with another social tenant
14 Housing Statistical Release
Rents Local authorities can now offer social housing at two different rent levels social rent and afforda-ble rent Social rented housing is housing owned and managed by local authorities and other registered providers for which target rents are determined through the national rent regime Affordable rented housing is housing let by registered providers of social housing to households who are eligible for social rented housing Affordable rent is not subject to the national rent regime but is subject to other rent controls that require a rent of no more than 80 of the local market rent For more detailed information follow the link below httpswwwgovukhousingfunding-programmes Local authorities were not able to let properties at affordable rent until 2012-13 meaning the LAHS return for 2012-13 collected data on affordable rent lettings made by local authorities for the first time As such Table 3 is based on social rent stock only In addition the data quality of the afford-able rent stock lettings and rent figures are not as high as the social rented stock figures Decent homes programme In 2001 government established the decent homes standard for all social housing (set out in guid-ance updated in 2006) see link to decent homes guidance httpswwwgovukgovernmentpublicationsa-decent-home-definition-and-guidance Local authorities report information on decent homes activity through the LAHS return Private Registered Providers report similar information through the HCArsquos SDR In the LAHS return non-decent local authority housing stock includes stock owned by local authorities in other areas Estimates on the numbers of non-decent homes are also available from the English Housing Sur-vey httpswwwgovukgovernmentcollectionsenglish-housing-survey Decent homes figures from different sources are summarised in live table 119 httpswwwgovukgovernmentstatistical-data-setslive-tables-on-dwelling-stock-including-vacants Reported levels of decent homes have been consistently lower in LAHS than EHS There are a number of reasons for this For example EHS figures are based on a physical inspection of surveyed properties While in LAHS only properties that LAs have been made aware of are in-cluded Also in LAHS properties where the tenant refused work are excluded LAHS data should be used when accessing the decent homes standard for social housing Evictions The Ministry of Justice publishes quarterly National Statistics on possession actions issued in county courts by mortgage lenders and social and private landlords in England and Wales Whilst the LAHS return collects information on the evictions from properties owned by local authority landlords corresponding information is not collected from Private Registered Providers Therefore where a breakdown by type of social landlord is not required the best source would be the Minis-try of Justicersquos statistics on possession actions (see table 3 of their statistical tables) Please note that there are some differences as 1) the Ministry of Justice publishes data on the number of possession claims and number of possession claims leading to an order rather than the number of orders 2) the information is taken from courts administrative data rather than local au-thority returns and 3) the Ministry Of Justicersquos published tables include both England and Wales A link to the latest Statistical Release can be found at httpswwwgovukgovernmentstatisticsmortgage-and-landlord-possession-statistics-july-to-september-2017
15 Housing Statistical Release
Technical notes
Data collection
The information collected in the LAHS is a combination of snapshot and financial year information The snapshot information refers to 1 April following the end of the financial year For example in the 2016-17 data collections this is 1 April 2017 Other information refers to financial years so for the 2016-17 data collection the reporting period is 1 April 2016 to 31 March 2017 The LAHS data collection is a non-statutory annual return and is collected from all lower tier local authorities (including unitary authorities) in England that were in existence over the 2016-17 financial year (326 local authorities)
Data quality The response rates for 2016-17 were as follows
bull All 326 of the 326 local authorities provided some data for the LAHS return
bull 6 local authorities provided ldquounfinalisedrdquo returns Local authorities are required to sign off their return to confirm it passes a range of quality checks and these local authorities have not signed off the return
The LAHS return contains mandatory and voluntary questions Where there are mandatory questions these are completed by all local authorities that submit a return Some authorities may not report data for all voluntary parts of the return All returns undergo validation and cross-checking and late returns are chased to ensure overall response is as complete and accurate as possible Anomalous data are highlighted and verified by contacting the local authority Where the local authority has not responded to the query an assessment has been made as to the likelihood of the data being correct Where the figures are highly likely to be incorrect an imputation has been included for the purposes of producing the regional and national totals where possible Imputations attempt to take into account missing or incorrect data in order to provide national aggregates This method has been used in the LAHS (and previously HSSA and BPSA) data collection process for many years All of the national totals reported in this statistical release include imputed data for missing returns Approximately 78 of the 326 local authoritiesrsquo returns required imputation for at least one question This meant around 4 of all data were imputed In general terms one of five approaches to imputation are taken direct carry-over of the value reported in 2015-16 an assumption of 0 based on other sources of equivalent data (including adjusting values reported in 2015-16) calculations from data provided and based on values reported by similar authorities in 2016-17 The latter approach is particularly taken when calculating items which are sub-components of other reported items
16 Housing Statistical Release
How do the LAHS social rent figures compare to EHS SDR and Core data Social Rented Sector rents are consistently higher from the EHS compared with LAHS and SDR The reasons for this are unclear but are likely to be due to differences in methodology EHS data is reported by the tenant where as LAHS and SDR come from the social landlord The LAHS figures are consistently higher than those from CORE lettings LAHS figures represent general needs and supported housing whereas CORE only contains general needs As supported needs rents tend to be higher than general needs this could explain why LAHS figures are higher than from CORE Differences will also be caused by relative levels of turnover across local au-thorities since CORE only records new lettings The SDR figures on housing association rents are consistently higher than those from CORE let-tings Both sets of figures represent general needs housing only but differences will be caused by relative levels of turnover across local authorities since CORE only records new lettings All four sources show similar annual increases for the last few years
Revisions policy
This policy has been developed in accordance with the UK Statistics Authority Code of Practice for Official statistics and the Ministry of Housing Communities and Local Government Revisions Policy (found at httpswwwgovukgovernmentpublicationsstatistical-notice-dclg-revisions-policy) There are two types of revisions that the policy covers
Non-Scheduled Revisions Where a substantial error has occurred as a result of the compilation imputation or dissemination process the statistical release live tables and other accompanying releases will be updated with a correction notice as soon as is practical
Scheduled Revisions Revisions are scheduled to be made to the complete dataset to reflect changes to Sections I and A The changes to Section I will be due to representations made by local authorities as part of the New Homes Bonus allocation process The changes to Section A will be as part of the limit rent setting process These revisions will be made in early 2018 Any revisions made by local authorities to their figures after the dataset has been frozen (ie after the above two set changes are incorporated) due to either errors found in their submission or failure to meet the deadline will be validated and kept internally but no changes will be made to the published statistical release When the statistical release annual datasets and accompanying live tables for the following year are published these revisions will be incorporated Revisions will normally only be made to one year prior to the year that is being published
17 Housing Statistical Release
Where LAHS data are published in live tables these tables will be updated annually at the same time as the publication of this statistical release The exception to this is when a significant error has been identified as described previously In this case these tables will be updated as soon as the error is found and a note will be placed on the table to notify users of the reason for the change
Revisions to historic data (all years before the year previously published) should only be made where there is a substantial revision such as a change in methodology or definition Where there are small revisions that do not significantly change historic data internal updates are maintained
Uses of the data
The data in this Statistical Release are important for a number of different purposes They meet the requirements of informed decision-making by the Secretary of State for Communities and Local Government other government departments local authorities other public services business researchers and the public The data collected on the LAHS form provide an important part of the evidence base for the assessment of future housing requirements and are used to inform evidence-based policy decisions and as a basis for answering Parliamentary Questions and other requests for information by Ministers local authorities and the general public
User engagement
Users are encouraged to provide feedback on how these statistics are used and how well they meet user needs Comments on any issues relating to this statistical release are welcomed and encouraged Responses should be addressed to the Public enquiries contact given in the Enquiries section below The Departments engagement strategy to meet the needs of statistics users is published here httpswwwgovukgovernmentpublicationsengagement-strategy-to-meet-the-needs-of-statistics-users
Devolved administration statistics
Statistics relating to social housing stock in the other UK countries are published by the devolved administrations In all countries data are collected from returns made by the stock owning authori-ty (local authority Private Registered Provider or equivalent) The Scottish Government publishes statistics on social housing which are available through their website httpwwwgovscotTopicsStatisticsBrowseHousing-Regenerationutm_source=websiteamputm_medium=navigationamputm_campaign=statistics-topics
18 Housing Statistical Release
In particular they produce an annual Key Trend Summary This can be accessed at httpsbetagovscotpublicationshousing-statistics-scotland-2017-key-trends-summary The Welsh Assembly Government publishes statistics on social housing which are available at httpgovwalesstatistics-and-researchsocial-housing-stock-rentslang=en In Northern Ireland the Department for Social Development produces an annual publication which brings together housing statistics collected by the Department including statistics on social housing httpswwwcommunities-nigovuktopicshousing-statistics There are a number of differences between the statistics that are collected and published for local authorities in England through the LAHS return and the other UK countries These differences can arise for a number of reasons but the majority are a result of different legislation methodology or coverage Details describing these differences can be found at the following link httpswwwgovukgovernmentorganisationsdepartment-for-communities-and-local-governmentserieslocal-authority-housing-data The table below shows the main topics collected from the LAHS return and provides links to the corresponding statistics published by the devolved administrations
Appendix 1 Links to related statistics in devolved administrations Topic Scotland Wales Northern Ireland Council Housing Stock httpwwwgovscotTopicsSta
tisticsBrowseHousing-RegenerationHSfSStock
httpwalesgovukstatistics-and-researchsocial-housing-stock-rentslang=en
httpswwwfinance-nigovuktopicsstatistics-and-researchhousing-stock-statistics
Decent Homes Programme Scottish Housing Quality
Programme httpwwwgovscotTopicsBuilt-Environ-mentHousing16342shqsprogress
Welsh Housing Quality Standard httpwalesgovukstatistics-and-researchsocial-housing-quality-welsh-housing-quality-standard-data-collectionlang=en
httpswwwcommunities-nigovukdecent-homes-standard
Stock Condition amp Fitness Standards httpwwwscotlandgovuktop
icsstatisticsshcs
httpwalesgovukstatistics-and-researchwelsh-housing-quality-standardlang=en
httpswwwnihegovuknihcs_2016_preliminary_reportpdf
Council House Vacant Stock httpwwwscotlandgovukTo
picsStatisticsBrowseHousing-Regenera-tionHSfSStockManagement
httpwalesgovukstatistics-and-researchsocial-housing-vacancies-data-collectionlang=en
httpswwwnidirectgovukrating-empty-homes
Energy Efficiency SAP Ratings httpwwwscotlandgovuktop
icsstatisticsshcs
httpgovwalestopicsenvironmentcountry-sideenergyefficiencyenergy-efficiency-strategy-for-waleslang=en
httpswwwcommunities-nigovukpublicationsnorthern-ireland-housing-statistics-2016-17
Houses of Multiple Occupations httpwwwscotlandgovukTo
picsStatisticsBrowseHousing-RegenerationHSfSHMO
httpgovwalestopicsplanningpolicyguidanceandleafletshouses-in-multiple-occupation-practice-guidancelang=en
Not collected
19 Housing Statistical Release
Private Sector Renewal Assistance httpwwwscotlandgovukTo
picsStatisticsBrowseHousing-Regenera-tionHSfSImprovements
httpgovwalestopicshousing-and-regenerationlang=en
httpswwwcommunities-nigovukpublicationsnorthern-ireland-housing-statistics-2016-17
Affordable Housing Provision httpwwwscotlandgovukTo
picsStatisticsBrowseHousing-RegenerationHSfSNewBuild
httpwalesgovukstatistics-and-researchaffordable-housing-provisionlang=en
Not collected
Lettings Allocations httpwwwscotlandgovukTopicsStatisticsBrowseHousing-Regenera-tionHSfSStockManagement
httpwalesgovukstatistics-and-researchsocial-housing-lettings-data-collectionlang=en
httpswwwcommunities-nigovukpublicationsnorthern-ireland-housing-statistics-2016-17
Waiting Lists httpwwwscotlandgovukTopicsStatisticsBrowseHousing-Regenera-tionHSfSStockManagement
Not collected httpswwwcommunities-nigovukpublicationsnorthern-ireland-housing-statistics-2016-17
Landlord Possessions Evictions httpwwwscotlandgovukTo
picsStatisticsBrowseHousing-Regenera-tionHSfSStockManagement
httpwalesgovuktopicsstatisticsheadlineshousing2011111207lang=en
Not collected
Rent Arrears httpwwwscotlandgovukTopicsStatisticsBrowseHousing-RegenerationHSfSHRA2008-09
httpwalesgovukstatistics-and-researchsocial-landlord-possessions-evictionslang=en
httpswwwcommunities-nigovuktopicshousing-statistics
National Statistics
This Statistical Release is published at 930am on a date which has been pre-announced on the MHCLG Statistics Release Calendar httpswwwgovukgovernmentstatisticsannouncementsutf8=E29C93amporganisations5B5D=department-for-communities-and-local-government
A list of officials who have received pre-release access to this Statistical Release up to 24 hours in advance of publication is available on the Departments website httpswwwgovukgovernmentorganisationsdepartment-for-communities-and-local-governmentaboutstatisticspre-release-access-to-official-statistics
Next Publication
The next release Local Authority Housing Statistics will be released in January 2019 The precise date will be announced on the MHCLG Statistics Release Calendar httpswwwgovukgovernmentstatisticsannouncementsutf8=E29C93amporganisations5B5D=department-for-communities-and-local-government
20 Housing Statistical Release
Enquiries
Media enquiries 0303 444 1209 Email newsdeskcommunitiesgsigovuk Public enquiries and Responsible Statistician Peter Chapman Email housingstatisticscommunitiesgovuk Information on Official Statistics is available via the UK Statistics Authority website httpwwwstatisticsauthoritygovuk Information about statistics at MHCLG is available via the Departments website wwwgovukgovernmentorganisationsdepartment-for-communities-and-local-governmentaboutstatistics
21 Housing Statistical Release
copy Crown copyright 2018 Copyright in the typographical arrangement rests with the Crown
You may re-use this information (not including logos) free of charge in any format or medium under the terms of the Open Government Licence To view this licencehttpwwwnationalarchivesgovukdocopen-government-licenceversion3 or write to the Information Policy Team The National Archives Kew London TW9 4DU or email psinationalarchivesgsigovuk
This documentpublication is also available on our website at wwwgovukmhclg
If you have any enquiries regarding this documentpublication complete the form at httpformscommunitiesgovuk or write to us at
Ministry of Housing Communities and Local Government Fry Building 2 Marsham Street London SW1P 4DF Telephone 030 3444 0000 January 2018
For all our latest news and updates follow us on Twitter httpstwittercommhclg
ISBN 978-1-4098-5177-6
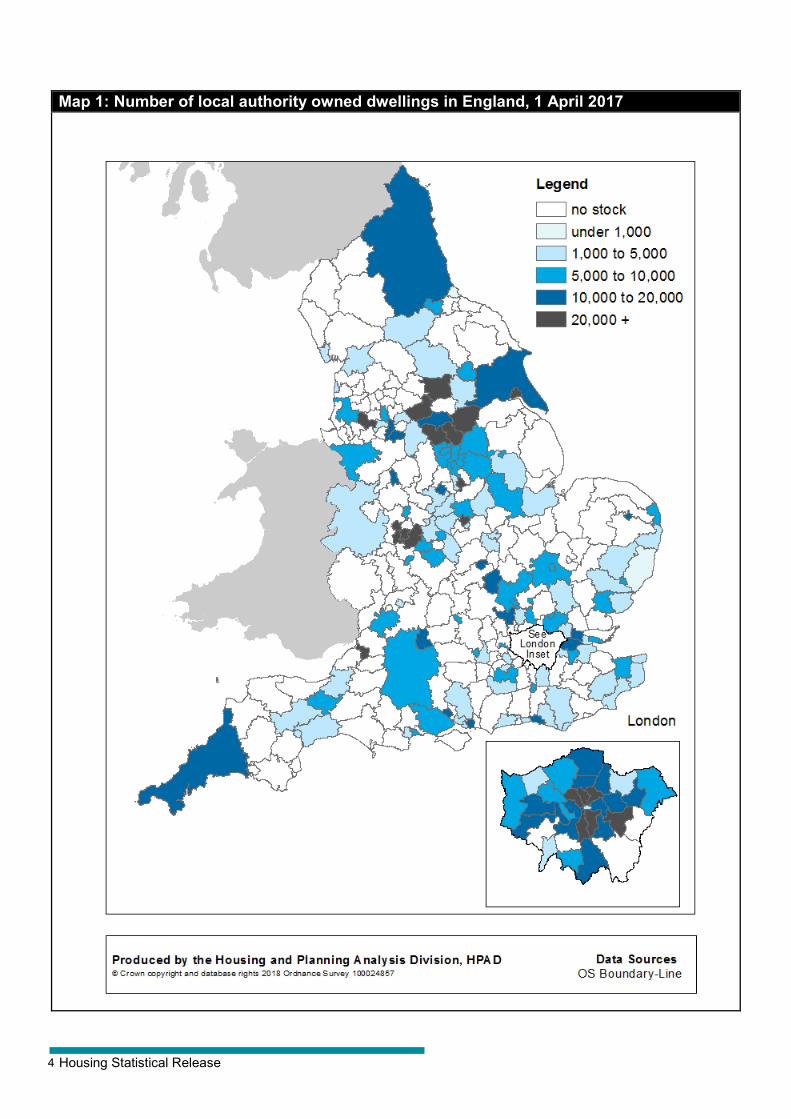
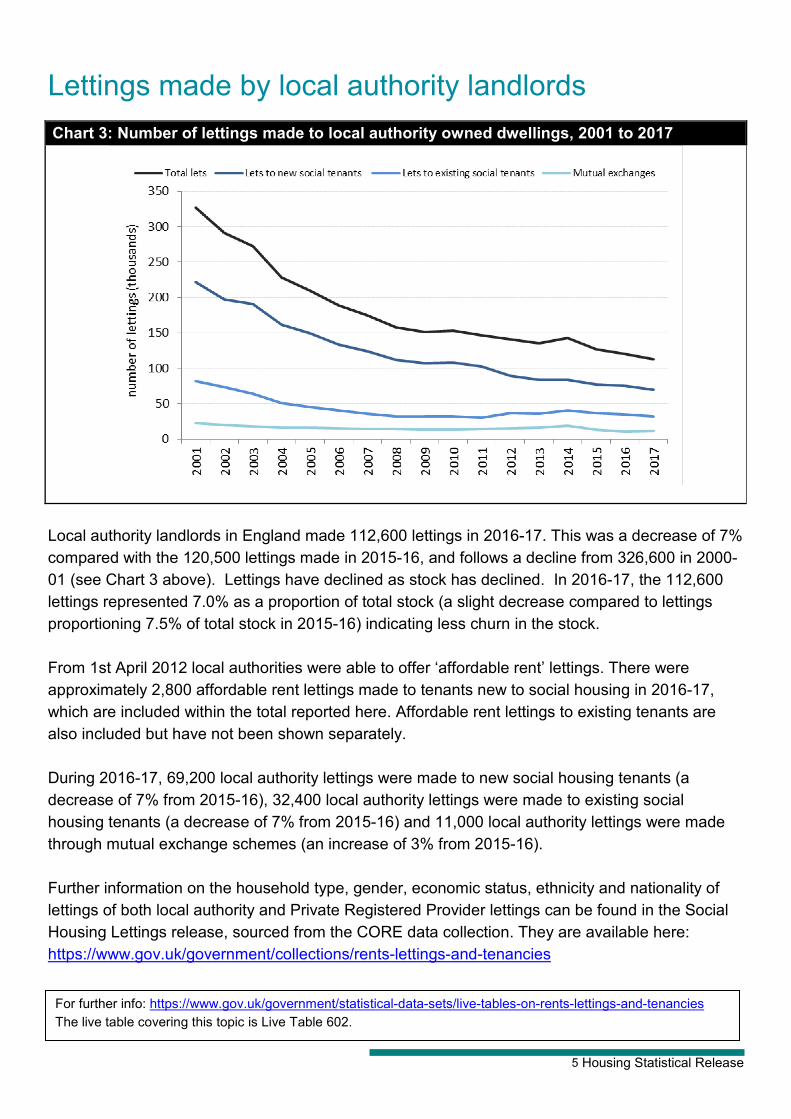
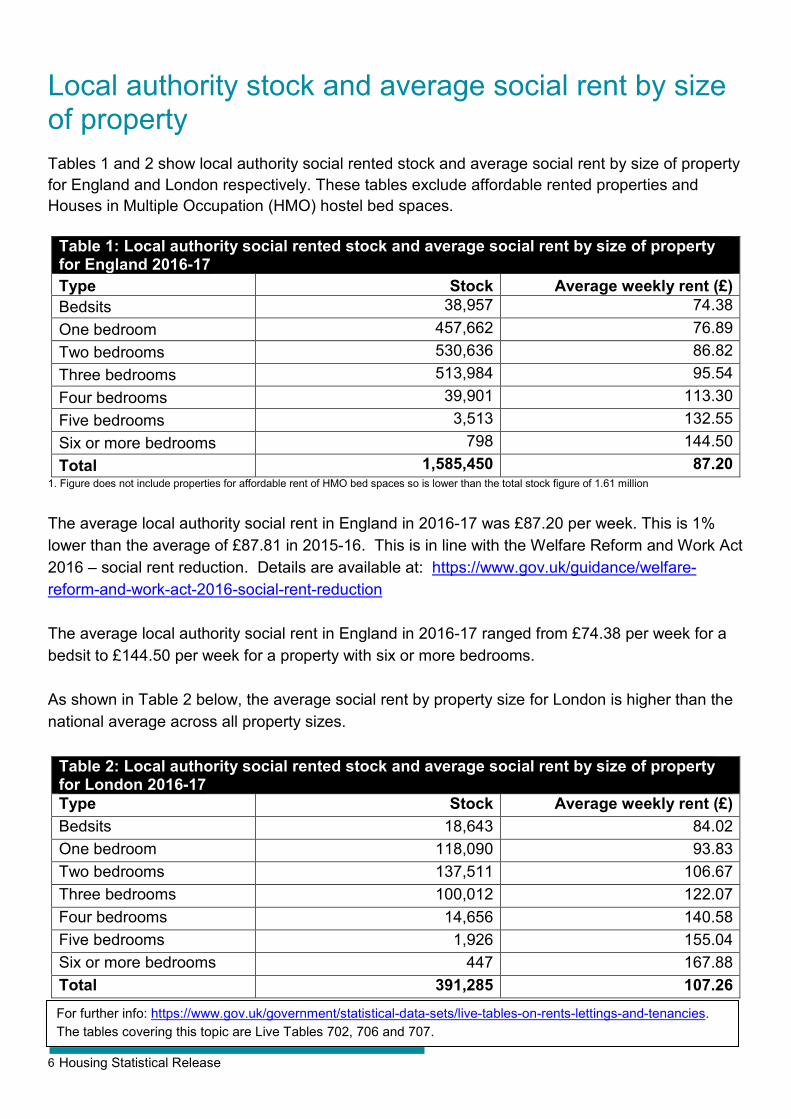
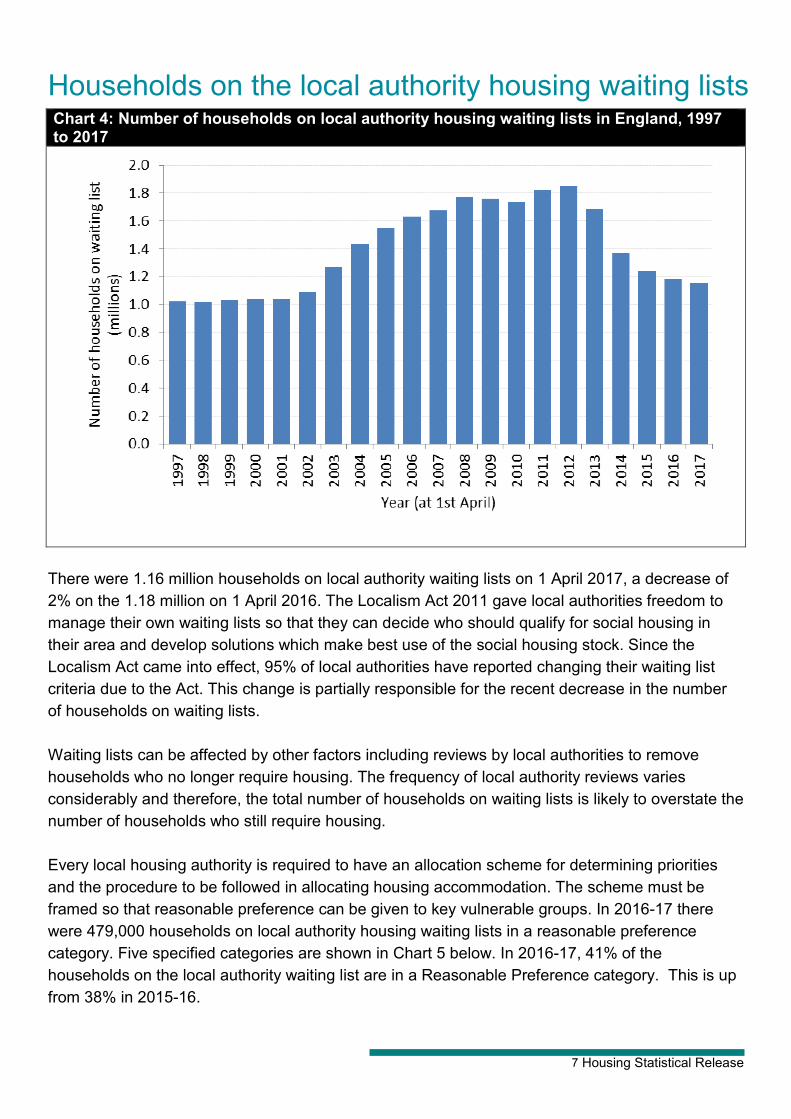
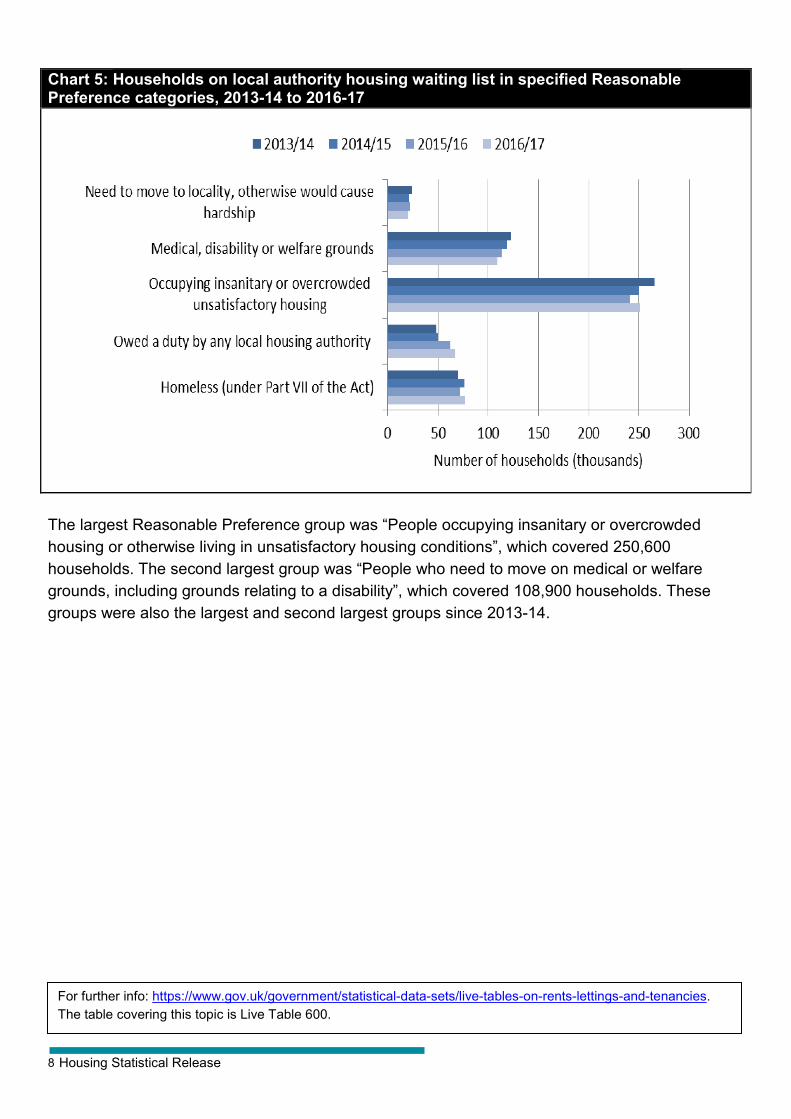
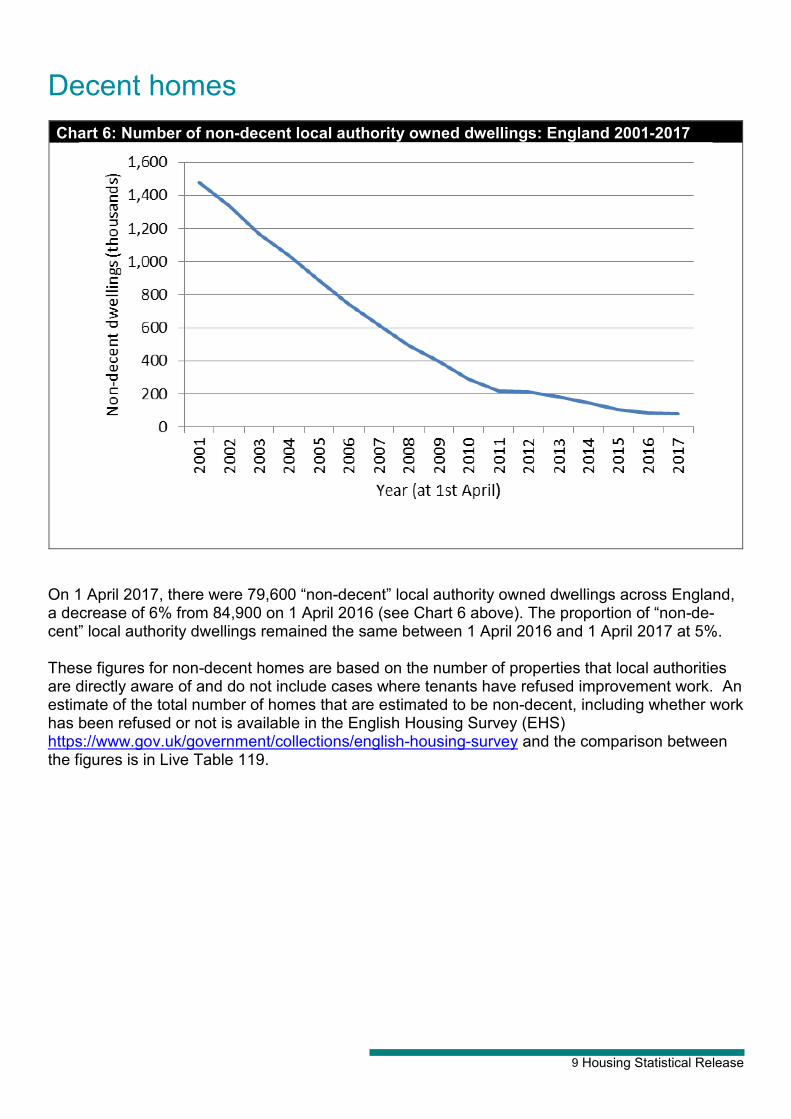
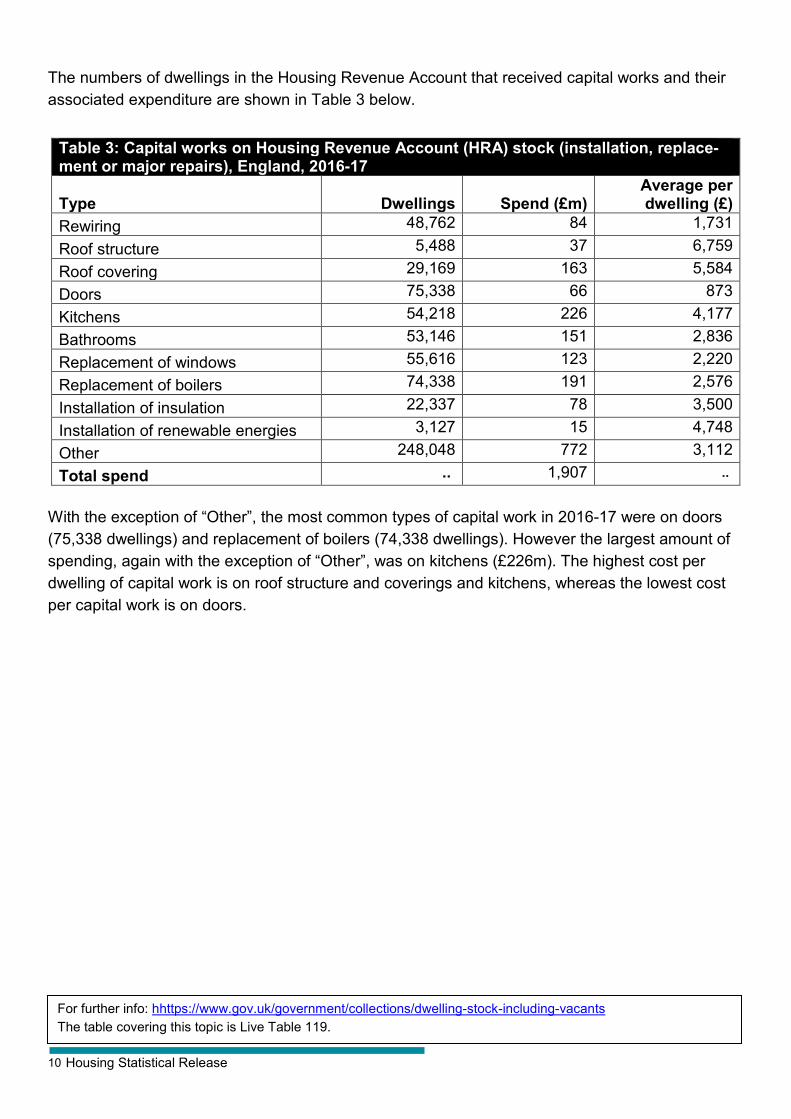
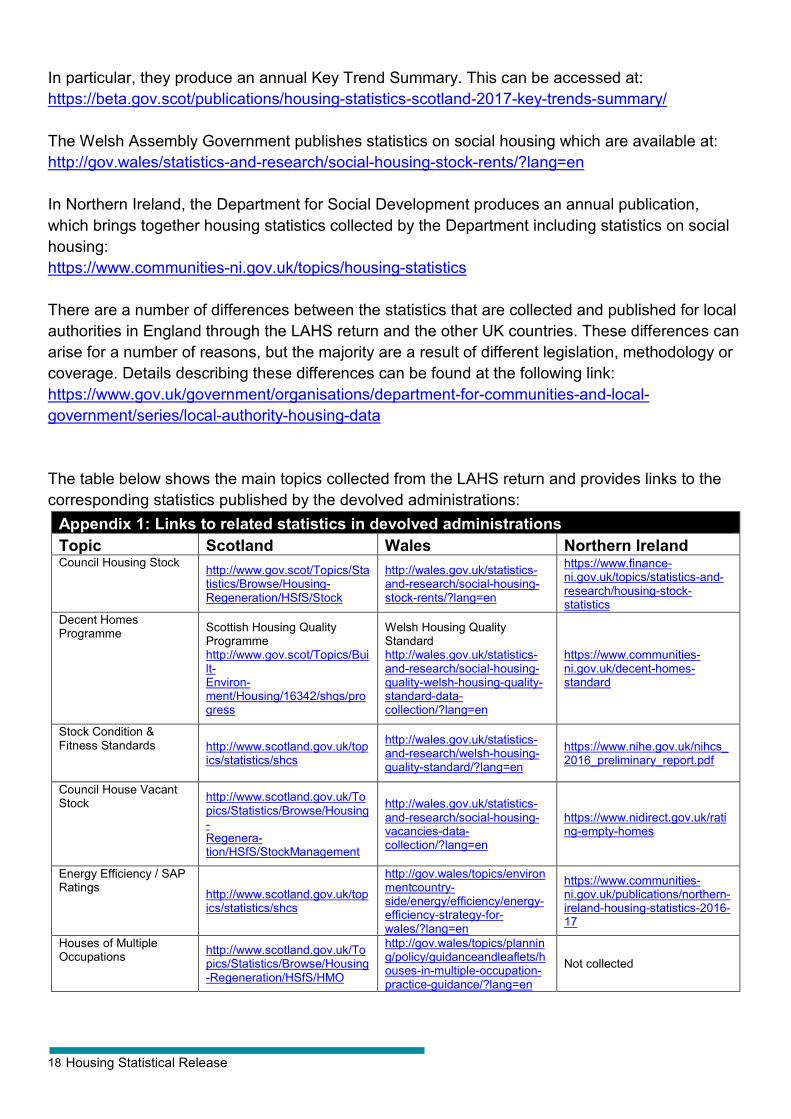
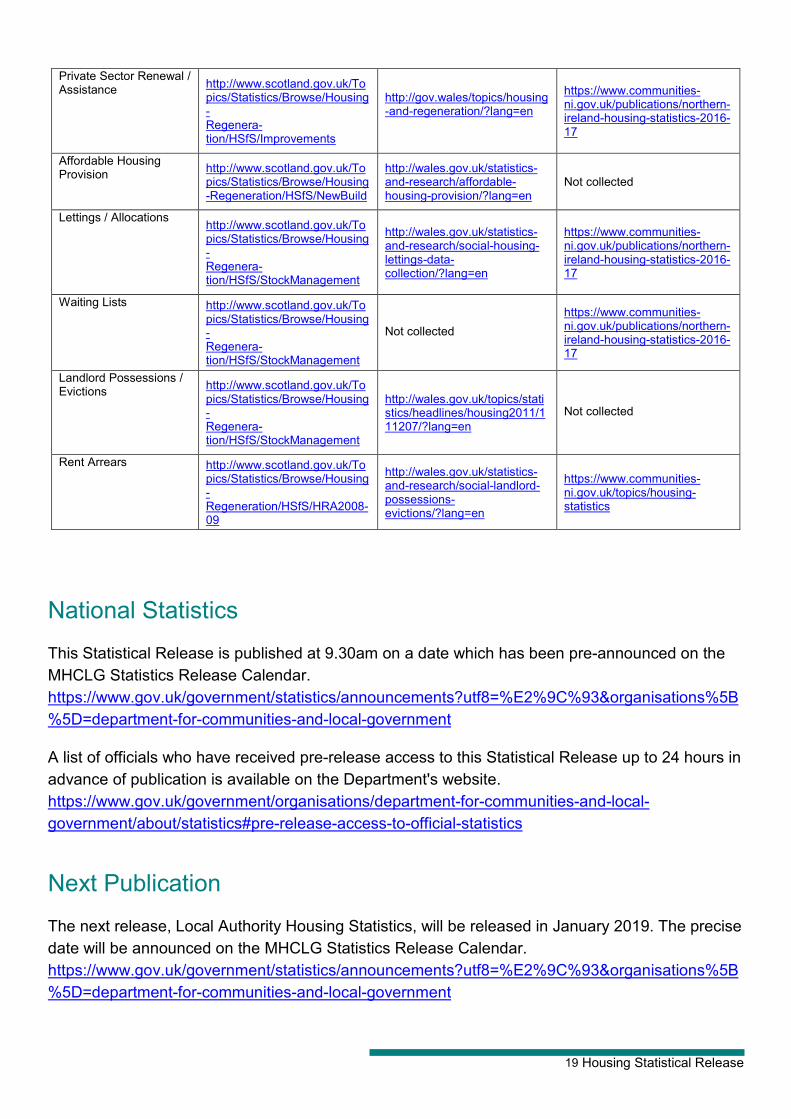