local government use of web gis in north carolina · local government use of web gis in north...
TRANSCRIPT

Local Government Use of Web GIS in North Carolina
Jon BreeceSchool of Information and Library Science
School of GovernmentUniversity of North Carolina at Chapel Hill

Introduction
The intersection of data and government– How does offering data-sharing e-Government
services through a map interface lead to organizational reorientation?
1. What web GIS services do North Carolina counties offer?2. How much are these services used and by whom?3. What organizational changes have resulted because of “going public”?

Agenda
• Background– Web GIS in Academia– E-Government– Web GIS in Government– Public Participatory GIS
• STUDY: “Local Government Use of Web GIS in North Carolina”– Methodology– Study Findings– Discussion
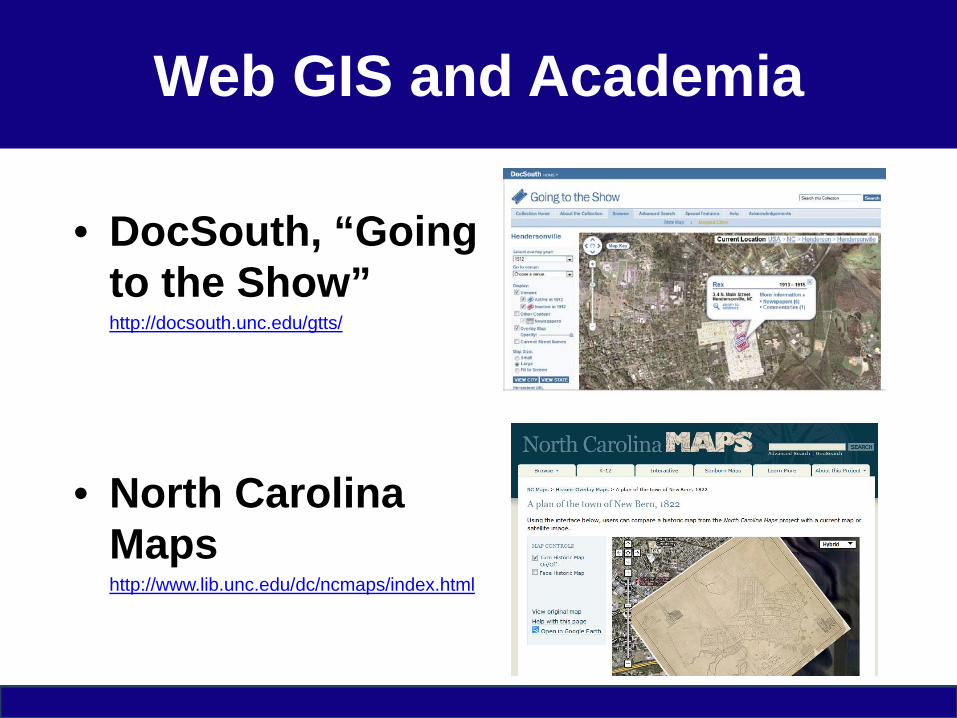
Web GIS and Academia
• DocSouth, “Going to the Show”http://docsouth.unc.edu/gtts/
• North Carolina Mapshttp://www.lib.unc.edu/dc/ncmaps/index.html
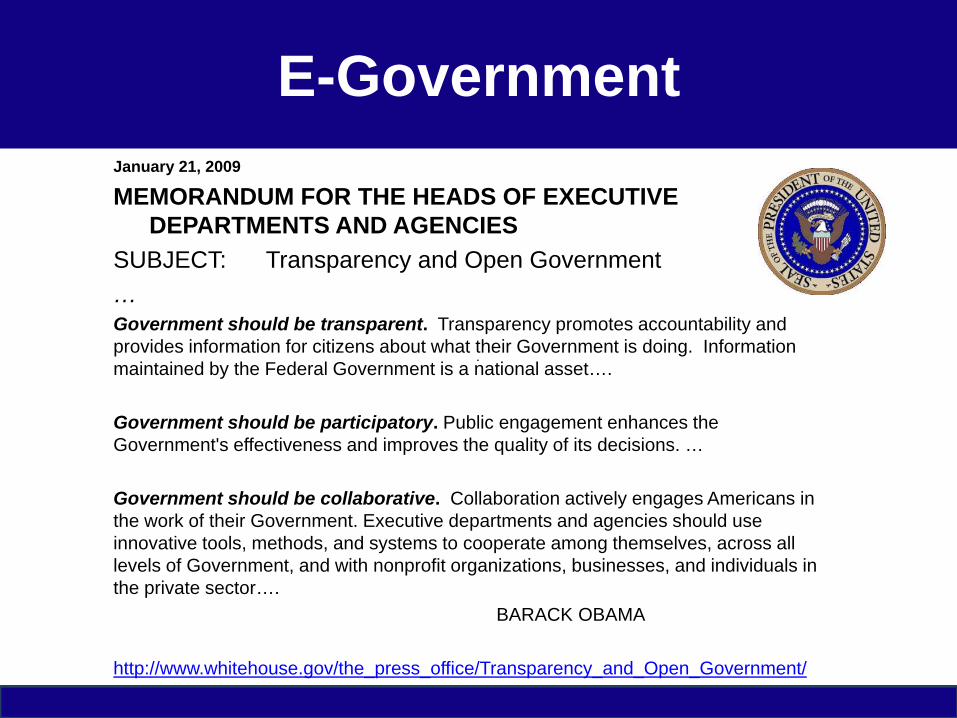
E-GovernmentJanuary 21, 2009
MEMORANDUM FOR THE HEADS OF EXECUTIVE DEPARTMENTS AND AGENCIES
SUBJECT: Transparency and Open Government…Government should be transparent. Transparency promotes accountability and provides information for citizens about what their Government is doing. Information maintained by the Federal Government is a national asset….
Government should be participatory. Public engagement enhances the Government's effectiveness and improves the quality of its decisions. …
Government should be collaborative. Collaboration actively engages Americans in the work of their Government. Executive departments and agencies should use innovative tools, methods, and systems to cooperate among themselves, across all levels of Government, and with nonprofit organizations, businesses, and individuals in the private sector….
BARACK OBAMA
http://www.whitehouse.gov/the_press_office/Transparency_and_Open_Government/

E-Government
“A new wave of technological innovation is allowing us to capture, store, process and display an unprecedented amount of information about our planet and a wide variety of environmental and cultural phenomena. Much of this information will be "georeferenced" -that is, it will refer to some specific place on the Earth's surface.”
- Vice President Al Gore (January 31, 1998)
NASA
“a framework for open government… and also for civic engagement” – ESRI President Jack
Dangermond (May 2010)
“80 percent of all information has a geographical component”
“The availability of free Web mapping applications may now help break down many of the long-standing barriers to the public use of geospatial technologies. Anyone with access to an Internet-enabled computer or mobile device now has the ability to display and interpret geospatial data and even add to that information without expert intervention.”
The Geospatial Web: How Geobrowsers, Social Software and the Web 2.0 are Shaping the Network Society.

Web GIS in Government
• Data visualization• Data sharing• Data exploration• “Crowdsourcing”
Counterclockwise from righthttp://www.colorado.gov/recovery/RecoveryMapping_2/index.htmlhttp://hubmaps1.cityofboston.gov/datahub/http://kygeonet.ky.gov/kydemographics/index.htmlhttp://mercator.nrel.gov/imby/

Public Participatory GIS (PPGIS/PGIS)
• Disaster relief– Deepwater Horizon– Haiti
• Zoning
• Public safety– CitySourced.com
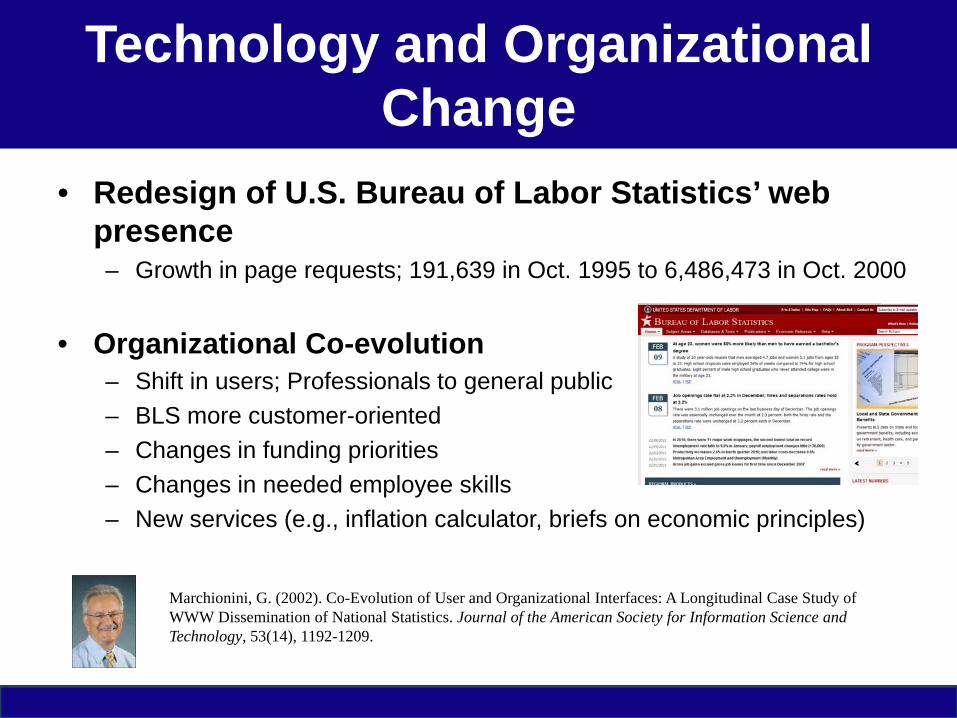
Technology and Organizational Change
• Redesign of U.S. Bureau of Labor Statistics’ web presence– Growth in page requests; 191,639 in Oct. 1995 to 6,486,473 in Oct. 2000
• Organizational Co-evolution– Shift in users; Professionals to general public– BLS more customer-oriented– Changes in funding priorities– Changes in needed employee skills– New services (e.g., inflation calculator, briefs on economic principles)
Marchionini, G. (2002). Co-Evolution of User and Organizational Interfaces: A Longitudinal Case Study of WWW Dissemination of National Statistics. Journal of the American Society for Information Science and Technology, 53(14), 1192-1209.

Study: Questions
Local Government Use of Web GIS in North Carolina
1. What web GIS services do North Carolina counties offer?
2. How much are these services used and by whom?
3. What organizational changes have resulted because of “going public”?

Study: Methodology
1. Examination of sites/publicly available information
2. Web Metrics– Unique Visitors– Page Views
3. Interviews– Semi-structured– IRB approved, Study #: 10-1714

Study: Background
• As of March 2010, 94 N.C. counties had an online mapping site– In 2002, only 10– In 2007, fewer than 50– State Property Office-mandated list:
http://www.doa.state.nc.us/spo/county.htm
Currituck Countyhttp://www.co.currituck.nc.us/Interactive-Online-MappingDup2.cfm
Town of Creedmoorhttp://maps.thewootencompany.com/creedmoor/viewer.htm
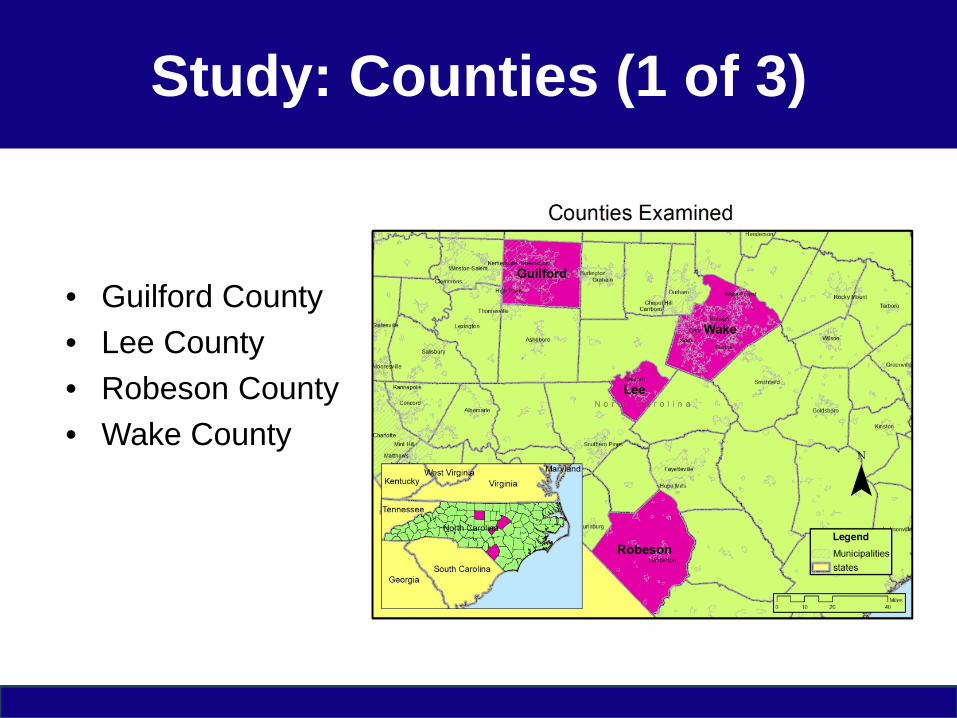
Study: Counties (1 of 3)
• Guilford County• Lee County• Robeson County• Wake County

Study: Counties (2 of 3)
Wake County Lee County Guilford County
Robeson County
Size of GIS staff (FY 2009-2010 Budget)
19* 5 5 7**
Date range of monthly traffic data provided
May 2003 to June 2010
July 2006 to June 2010
May 2009 to June 2010
February 2007 to June 2010
Number of months of data examined
86 48 14 41
FY 2009-2010 Appropriations
$1,662,887 $354,036 *** ***
*This number does not include the 8 staff members of Wake County’s iMAPS partner – the City of Raleigh.**Department does tax mapping as well as GIS. Staff includes: three mapping technicians; one tax clerk; one E911 Addressing Coordinator; and, one GIS Technician.***Unable to separate GIS budget from parent departmental budget

Study: Counties (3 of 3)North
CarolinaWake
CountyLee
CountyGuilford County
Robeson County
Population (2009) 9,036,449 897,214 60,477 480,362 129,559Population, percent change, April 1, 2000 to July 1, 2009
16.6% 42.9% 22.9% 14.1% 5.1%
High degree graduate or higher (2000)
82.9% 91.1% 77.7% 86.2% 68.6%
Bachelor’s degree or higher (2008)
25.6% 47.0% 15.7% 32.1% 12.5%
Median household income (2008)
$46,107 $64,527 $43,046 $47,308 $36,133
Median value of owner-occupied housing units (2008)
$145,600 $217,700 $129,800 $151,700 $72,900
Source: U.S. Census Bureau

Study: 1) What web GIS services do North Carolina counties offer?
Guilford County GIS Data Viewerhttp://gcgis.co.guilford.nc.us/guilford_new/
Administrative Boundaries, Aerial Photography, Elected Representation, Elevation, Environmental Health, Hydrology, Land Records, Soils, Transportation
Lee County ConnectGIShttp://lee.connectgis.com/Default/Default.aspx
Infrastructure, Schools, Political, Natural, Aerial Photography
Robeson County ConnectGIShttp://www.gis.co.robeson.nc.us/ConnectGISWeb/Robeson/
Orthophotography, Parcel Information, Streets, City Limits, Zoning, Overlays
Wake County-City of Raleigh iMAPShttp://maps.raleighnc.gov/imapsraleigh/index.html

Study: 2) How much are these services used?
10,874
14,447
27,583
35,003 35,424 35,634
32,567
41,725
0
5,000
10,000
15,000
20,000
25,000
30,000
35,000
40,000
45,000
50,000
May
-03
Sep
-03
Jan-
04M
ay-0
4S
ep-0
4Ja
n-05
May
-05
Sep
-05
Jan-
06M
ay-0
6S
ep-0
6Ja
n-07
May
-07
Sep
-07
Jan-
08M
ay-0
8S
ep-0
8Ja
n-09
May
-09
Sep
-09
Jan-
10M
ay-1
0
Unique Visitors to iMAPS: May 2003 to June 2010
Data labelsshown for May of each year
May 2003: 26,789
Aug 2007: 124,690
February 2010:
78,997
0
20,000
40,000
60,000
80,000
100,000
120,000
140,000
May
-03
Sep
-03
Jan-
04M
ay-0
4S
ep-0
4Ja
n-05
May
-05
Sep
-05
Jan-
06M
ay-0
6S
ep-0
6Ja
n-07
May
-07
Sep
-07
Jan-
08M
ay-0
8S
ep-0
8Ja
n-09
May
-09
Sep
-09
Jan-
10
Visits to /imaps/map.asp
Web trend analysis: Wake County

Study: 2) How much are these services used?
May 2007: 10,512
May 2010: 6,477
May 2008: 2,880
0
2,000
4,000
6,000
8,000
10,000
12,000
Jul-0
6O
ct-0
6Ja
n-07
Apr
-07
Jul-0
7O
ct-0
7Ja
n-08
Apr
-08
Jul-0
8O
ct-0
8Ja
n-09
Apr
-09
Jul-0
9O
ct-0
9Ja
n-10
Apr
-10
Lee County ConnectGIS web traffic
Hits
Visitors
Linear (Hits)
May 2009: 37,233
March 2010:
46,750
June 2010: 38,373
-
10,000
20,000
30,000
40,000
50,000
May
-09
Jun-
09
Jul-0
9
Aug
-09
Sep
-09
Oct
-09
Nov
-09
Dec
-09
Jan-
10
Feb-
10
Mar
-10
Apr
-10
May
-10
Jun-
10
Guilford County Data Viewer: Visits
January 2009: 9,894
June 2010: 5,262
0
2,000
4,000
6,000
8,000
10,000
12,000
Feb-
07A
pr-0
7Ju
n-07
Aug
-07
Oct
-07
Dec
-07
Feb-
08A
pr-0
8Ju
n-08
Aug
-08
Oct
-08
Dec
-08
Feb-
09A
pr-0
9Ju
n-09
Aug
-09
Oct
-09
Dec
-09
Feb-
10A
pr-1
0Ju
n-10
Robeson County ConnectGIS: Visits
Web trend analysis: Lee County, Guilford County, Robeson County

Study: 3) What organizational changes have resulted because of “going public”? (1 of 3)
• Decrease walk-ins– “Freeing up” of staff for QA/QC, other projects
• Increased customer/citizen expectations
• New staff roles– Information brokers– Technical troubleshooter– Information integrators– Data and application educator and trainer
Results from the intersection of data and government

Study: 3) What organizational changes haveresulted because of “going public”? (2 of 3)
• Reactive application development
• No dramatic shift in users– Different than Marchionini’s finding
• Evolving technology
• Relationship with vendors
• Cooperation with other agencies

Study: 3) What organizational changes haveresulted because of “going public”? (3 of 3)
• Future directions– Surveying of customers– Agency-specific applications– PPGIS?

Discussion and Conclusions
• Variation in website complexity
• Obscuring of real world political boundaries
• Privacy– The increase in the availability of this information, however, has led one constituency,
citizens, to complain that the information is readily available to anyone around the world… What has always been publicly available becomes publicly accessible once posted on the web, and citizen complaints have affected this effort of e-government. (Belanger and Hiller, 2006, p. 56-57)
Belanger, F. & Hiller, J. S. (2006). A framework for e-government: privacy implications. Business Process Management Journal, 12(1), 48-60.

Thank you
Brooks Jonathan Breece (Jon)[email protected]
Candidate, Master of Public AdministrationCandidate, Master of Science of Library ScienceFellow, “Educating Stewards of Public Information in the
21st Century”Graduate Certificate in Geographic Information Science,
Department of Geography