local hydrologic effects of introducing non-native...
TRANSCRIPT

ECOHYDROLOGYEcohydrol. 1, 13–22 (2008)Published online 20 February 2008 in Wiley InterScience(www.interscience.wiley.com) DOI: 10.1002/eco.3
Local hydrologic effects of introducing non-native vegetationin a tropical catchment
Maite Guardiola-Claramonte,1* Peter A. Troch,1 Alan D. Ziegler,2 Thomas W. Giambelluca,2
John B. Vogler3 and Michael A. Nullet2
1 Department of Hydrology and Water Resources, The University of Arizona, Tucson, Arizona, USA2 Geography Department, University of Hawaii at Manoa, Honolulu, Hawaii, USA
3 Program on Environmental Change, Vulnerability and Governance, East-West Center, Honolulu, Hawaii, USA
ABSTRACT
This study investigates the hydrologic implications of land use conversion from native vegetation to rubber (Hevea brasiliensis)in Southeast Asia. The experimental catchment, Nam Ken (69 km2), is located in Xishuangbanna Prefecture (22°N, 101 °E),in the south of Yunnan province, in southwestern China. During 2005 and 2006, we collected hourly records of 2 m deepsoil moisture profiles in rubber and three native land-covers (tea, secondary forest and grassland), and measured surfaceradiation above the tea and rubber canopies. Observations show that root water uptake of rubber during the dry season iscontrolled by day-length, whereas water demand of the native vegetation starts with the arrival of the first monsoon rainfall.The different dynamics of root water uptake in rubber result in distinct depletion of soil moisture in deeper layers. Traditionalevapotranspiration and soil moisture models are unable to simulate this specific behaviour. Therefore, a different conceptualmodel, taking in account vegetation dynamics, is needed to predict hydrologic changes due to land use conversion in thearea. Copyright 2008 John Wiley & Sons, Ltd.
KEY WORDS Rubber (Hevea brasiliensis); root zone water balance; evapotranspiration; land use change; hydrologic change
Received 24 July 2007; Accepted 19 November 2007
INTRODUCTION
Current global population growth and economic devel-opment is accelerating land-cover conversion in manyparts of the world at an unprecedented rate (Lambinet al., 2001). Impacts on the natural environment, suchas changes in water and carbon cycles, have been widelyreported (e.g. Brontstert, 2004). Land use change not onlydisturbs the atmospheric concentrations of CO2, CH4 andN2O (Moiser, 1998), but also plays an important rolein modifying the hydrological cycle (Huxman and Scott,2007). There is an urgent need to improve our knowl-edge about the ecological–hydrological interactions inboth natural and disturbed environments to assess theimplications of land use change on the hydrological cycle.These interactions and feedbacks can have important con-sequences for streamflow in humid environments, whereconnectivity between surface and subsurface hydrologyis strong, as well as in arid regions where vegetationchanges can affect local to regional water balances (New-man et al., 2006; Wilcox et al., 2006).
This study follows an ecohydrological approach tounderstand the hydrological implications of growingnon-native rubber in montane mainland Southeast Asia.Towards the end of the 1950s, China introduced rubberin the southern region of Yunnan Province (Chapman,
* Correspondence to: Maite Guardiola-Claramonte, Hydrology and WaterResources Department, University of Arizona, 1133 E. James E RogersWay, AZ 85721, Tucson, USA. E-mail: [email protected]
1991). Since then, native vegetation (mainly primaryand secondary forest) has been rapidly replaced byrubber plantations. In 1963 rubber occupied 6130 ha(Jiang, 2003), which increased to 136 782 ha by 1998(Wu et al., 2001) and to about 220 000 ha by 2004 (LiHaitao, personal communication). This increase followsthe global demand for natural rubber driven by theeconomic growth of China and other emerging countries.
Rubber (Hevea brasiliensis) is a tree native to the trop-ical rainforest of the Amazon Basin. Its habitat is charac-terized by small variations in air temperature (24–28 °C)and precipitation (1500–2000 mm) throughout the year.Rubber’s natural habitat extends between 10° north andsouth of the equator and to at most 600 m above mean sealevel (AMSL). However, because of its economic impor-tance, rubber is now cultivated at higher latitudes andaltitudes in South America, Southeast Asia and Africa. Inthese marginally suitable environments (colder and drier),the productive life of rubber, its yield and its growth arereduced (Chandrashekar et al., 1998; Devakumar et al.,1999).
In general, the effects of introducing a non-nativespecies on the local and regional hydrologic cycle arepoorly understood (Newman et al., 2006). Our studyfocuses on a humid environment with a distinctive dryseason followed by a strong wet monsoon season. Itcharacterizes root water uptake dynamics of three nativevegetation types (tea, secondary forest and grassland) andcompares them to rubber tree plantations. Our analysis is
Copyright 2008 John Wiley & Sons, Ltd.
14 M. GUARDIOLA-CLARAMONTE ET AL.
based on 2 years (2005 and 2006) of hourly soil mois-ture observations and other hydro-meteorological vari-ables measured in these four land-covers. The researchmethodology has been designed to answer the follow-ing question: how is the local root zone water balanceaffected by the introduction of rubber?
RESEARCH METHODOLOGY
Site description
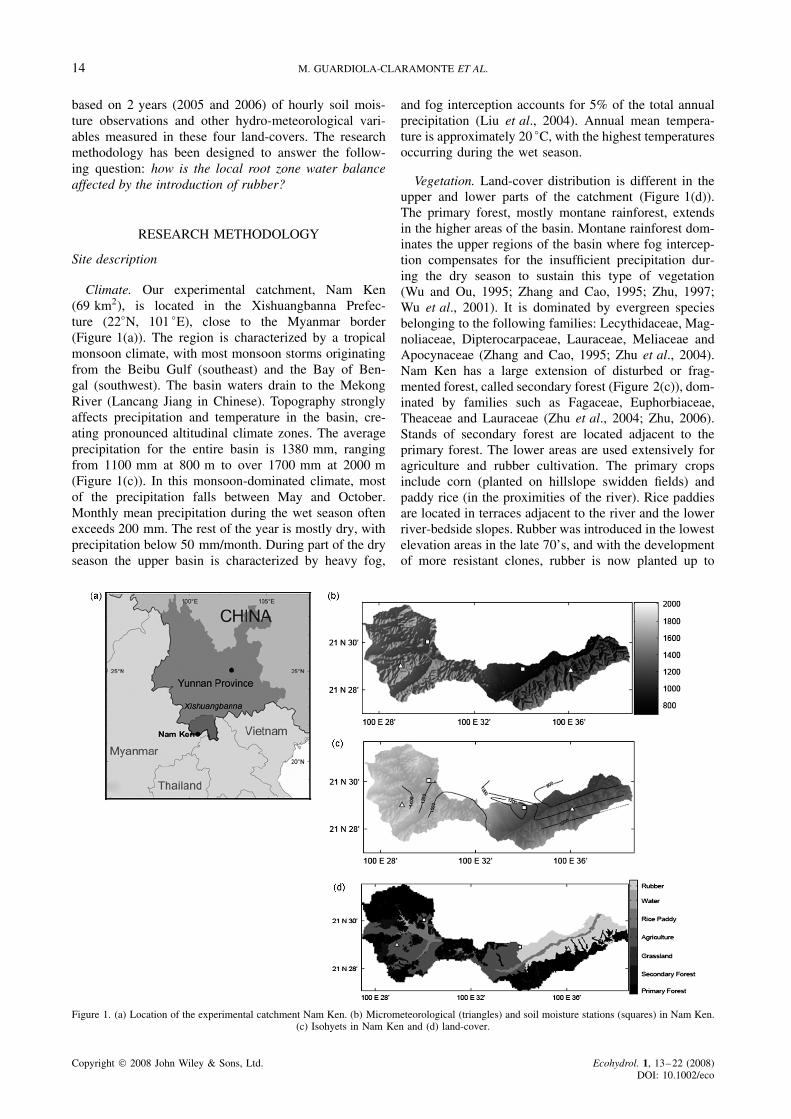
Climate. Our experimental catchment, Nam Ken(69 km2), is located in the Xishuangbanna Prefec-ture (22°N, 101 °E), close to the Myanmar border(Figure 1(a)). The region is characterized by a tropicalmonsoon climate, with most monsoon storms originatingfrom the Beibu Gulf (southeast) and the Bay of Ben-gal (southwest). The basin waters drain to the MekongRiver (Lancang Jiang in Chinese). Topography stronglyaffects precipitation and temperature in the basin, cre-ating pronounced altitudinal climate zones. The averageprecipitation for the entire basin is 1380 mm, rangingfrom 1100 mm at 800 m to over 1700 mm at 2000 m(Figure 1(c)). In this monsoon-dominated climate, mostof the precipitation falls between May and October.Monthly mean precipitation during the wet season oftenexceeds 200 mm. The rest of the year is mostly dry, withprecipitation below 50 mm/month. During part of the dryseason the upper basin is characterized by heavy fog,
and fog interception accounts for 5% of the total annualprecipitation (Liu et al., 2004). Annual mean tempera-ture is approximately 20 °C, with the highest temperaturesoccurring during the wet season.
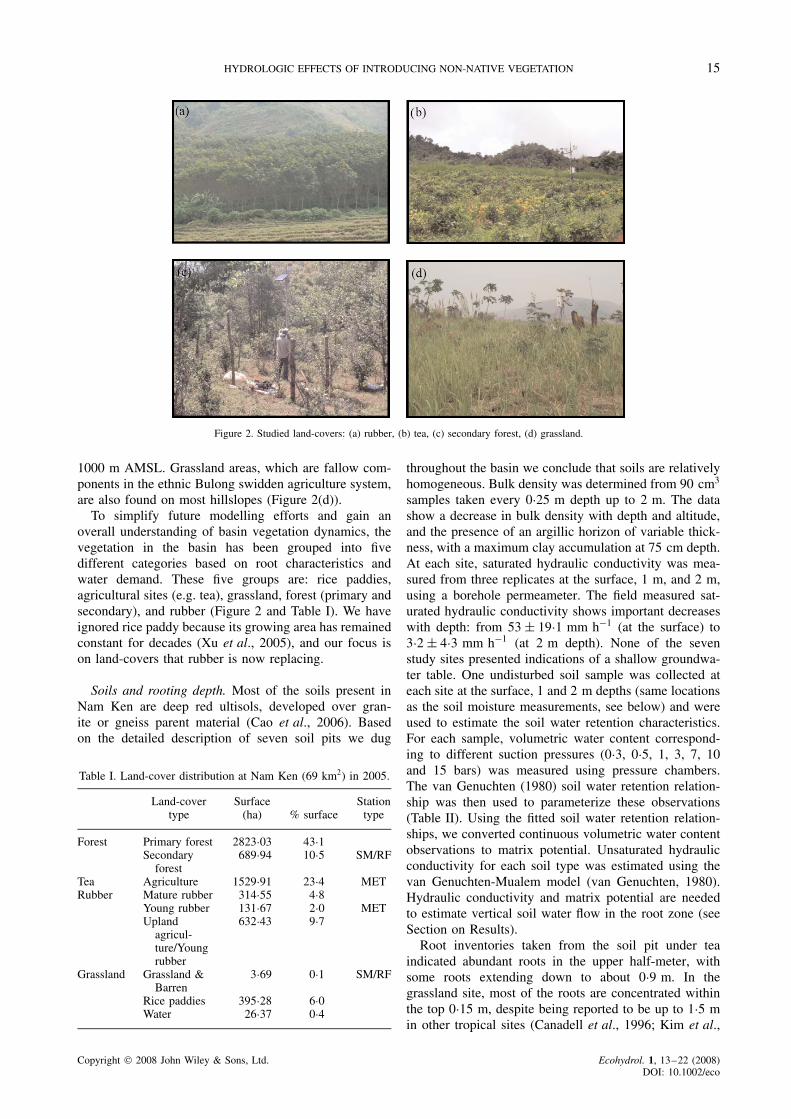
Vegetation. Land-cover distribution is different in theupper and lower parts of the catchment (Figure 1(d)).The primary forest, mostly montane rainforest, extendsin the higher areas of the basin. Montane rainforest dom-inates the upper regions of the basin where fog intercep-tion compensates for the insufficient precipitation dur-ing the dry season to sustain this type of vegetation(Wu and Ou, 1995; Zhang and Cao, 1995; Zhu, 1997;Wu et al., 2001). It is dominated by evergreen speciesbelonging to the following families: Lecythidaceae, Mag-noliaceae, Dipterocarpaceae, Lauraceae, Meliaceae andApocynaceae (Zhang and Cao, 1995; Zhu et al., 2004).Nam Ken has a large extension of disturbed or frag-mented forest, called secondary forest (Figure 2(c)), dom-inated by families such as Fagaceae, Euphorbiaceae,Theaceae and Lauraceae (Zhu et al., 2004; Zhu, 2006).Stands of secondary forest are located adjacent to theprimary forest. The lower areas are used extensively foragriculture and rubber cultivation. The primary cropsinclude corn (planted on hillslope swidden fields) andpaddy rice (in the proximities of the river). Rice paddiesare located in terraces adjacent to the river and the lowerriver-bedside slopes. Rubber was introduced in the lowestelevation areas in the late 70’s, and with the developmentof more resistant clones, rubber is now planted up to
Figure 1. (a) Location of the experimental catchment Nam Ken. (b) Micrometeorological (triangles) and soil moisture stations (squares) in Nam Ken.(c) Isohyets in Nam Ken and (d) land-cover.
Copyright 2008 John Wiley & Sons, Ltd. Ecohydrol. 1, 13–22 (2008)DOI: 10.1002/eco
HYDROLOGIC EFFECTS OF INTRODUCING NON-NATIVE VEGETATION 15
Figure 2. Studied land-covers: (a) rubber, (b) tea, (c) secondary forest, (d) grassland.
1000 m AMSL. Grassland areas, which are fallow com-ponents in the ethnic Bulong swidden agriculture system,are also found on most hillslopes (Figure 2(d)).
To simplify future modelling efforts and gain anoverall understanding of basin vegetation dynamics, thevegetation in the basin has been grouped into fivedifferent categories based on root characteristics andwater demand. These five groups are: rice paddies,agricultural sites (e.g. tea), grassland, forest (primary andsecondary), and rubber (Figure 2 and Table I). We haveignored rice paddy because its growing area has remainedconstant for decades (Xu et al., 2005), and our focus ison land-covers that rubber is now replacing.
Soils and rooting depth. Most of the soils present inNam Ken are deep red ultisols, developed over gran-ite or gneiss parent material (Cao et al., 2006). Basedon the detailed description of seven soil pits we dug
Table I. Land-cover distribution at Nam Ken (69 km2) in 2005.
Land-covertype
Surface(ha) % surface
Stationtype
Forest Primary forest 2823Ð03 43Ð1Secondary
forest689Ð94 10Ð5 SM/RF
Tea Agriculture 1529Ð91 23Ð4 METRubber Mature rubber 314Ð55 4Ð8
Young rubber 131Ð67 2Ð0 METUpland
agricul-ture/Youngrubber
632Ð43 9Ð7
Grassland Grassland &Barren
3Ð69 0Ð1 SM/RF
Rice paddies 395Ð28 6Ð0Water 26Ð37 0Ð4
throughout the basin we conclude that soils are relativelyhomogeneous. Bulk density was determined from 90 cm3
samples taken every 0Ð25 m depth up to 2 m. The datashow a decrease in bulk density with depth and altitude,and the presence of an argillic horizon of variable thick-ness, with a maximum clay accumulation at 75 cm depth.At each site, saturated hydraulic conductivity was mea-sured from three replicates at the surface, 1 m, and 2 m,using a borehole permeameter. The field measured sat-urated hydraulic conductivity shows important decreaseswith depth: from 53 š 19Ð1 mm h�1 (at the surface) to3Ð2 š 4Ð3 mm h�1 (at 2 m depth). None of the sevenstudy sites presented indications of a shallow groundwa-ter table. One undisturbed soil sample was collected ateach site at the surface, 1 and 2 m depths (same locationsas the soil moisture measurements, see below) and wereused to estimate the soil water retention characteristics.For each sample, volumetric water content correspond-ing to different suction pressures (0Ð3, 0Ð5, 1, 3, 7, 10and 15 bars) was measured using pressure chambers.The van Genuchten (1980) soil water retention relation-ship was then used to parameterize these observations(Table II). Using the fitted soil water retention relation-ships, we converted continuous volumetric water contentobservations to matrix potential. Unsaturated hydraulicconductivity for each soil type was estimated using thevan Genuchten-Mualem model (van Genuchten, 1980).Hydraulic conductivity and matrix potential are neededto estimate vertical soil water flow in the root zone (seeSection on Results).
Root inventories taken from the soil pit under teaindicated abundant roots in the upper half-meter, withsome roots extending down to about 0Ð9 m. In thegrassland site, most of the roots are concentrated withinthe top 0Ð15 m, despite being reported to be up to 1Ð5 min other tropical sites (Canadell et al., 1996; Kim et al.,
Copyright 2008 John Wiley & Sons, Ltd. Ecohydrol. 1, 13–22 (2008)DOI: 10.1002/eco
16 M. GUARDIOLA-CLARAMONTE ET AL.
Table II. Soil water retention parameters and observed saturatedhydraulic conductivity.
Rubber Surface 1 m 2 m
�res 0Ð10 0Ð16 0Ð17�sat 0Ð62 0Ð59 0Ð59n 1Ð40 1Ð13 1Ð17˛ 0Ð005 16Ð0 6Ð95m 0Ð28 0Ð11 0Ð15Ksat (mm h�1) 54 51 11
2ary forest Surface 1 m 2 m
�res 0Ð14 0Ð21 0Ð35�sat 0Ð77 0Ð67 0Ð75n 1Ð47 1Ð15 2Ð94˛ 0Ð002 1Ð87 0Ð0004m 0Ð32 0Ð13 0Ð66Ksat (mm h�1) 35 7 2
Where �res is the residual water content; �sat the saturated water content;n, ˛ and m van Genuchten-Mualem fitting model parameters’; and Ksatthe saturated hydraulic conductivity.
2005). The secondary forest site had roots up to 1Ð2 mdepth, and few below this depth. This is a shallowroot depth when compared to the 7 m depth reportedby Canadell et al. (1996) for tropical evergreen species.Part of this discrepancy results from our secondaryforest being a relatively young replacement land-cover(estimated <10 years old). Rubber tree roots are mainlyconcentrated within the first 1Ð1 m, but roots wereobserved throughout the 2Ð25 m soil profile. Literatureon rubber reports a high concentration of roots in theshallow layers (Devakumar et al., 1999; Cunha et al.,2000; Howell et al., 2005).
Data acquisition network
A hydro-meteorological data acquisition network wasestablished in the basin in May 2004 and removed inJanuary 2007. It consisted of two micrometeorological(MET) stations located one on a rubber plantation andthe other one on a tea plantation; and two soil mois-ture/precipitation (SM/RF) stations on a grassland fieldand on a secondary forest (Figure 2). Rainfall was alsomeasured at five other locations in the basin; Figure 1(c)shows the rainfall distribution in Nam Ken. Both METstations recorded hourly the four radiation components(incoming shortwave and long wave radiation, reflectedshortwave radiation and emitted long wave radiation),wind speed, air temperature, relative humidity, and pre-cipitation above the canopy. Soil heat flux was measuredat the soil surface together with soil moisture. Additionalsoil moisture measurements were taken at 1 and 2 mdepth. From the ratio of incoming and reflected short-wave radiation, surface (canopy) albedo is derived. Dailyalbedo values are calculated by averaging the hourly radi-ation from 10 : 00 to 14 : 00 local time and range from0Ð12 to 0Ð25 for the rubber and tea plantation respectively.The two SM/RF stations recorded hourly soil moisture at
three different depths (surface, 1 m, and 2 m) and pre-cipitation above canopy. Additional albedo measured onyoung secondary forest has been used to supplement thelack of energy flux measurements in the secondary foreststudy site.
Soil moisture was measured using thirty centime-tres long, vertically installed, time-domain reflectometry(TDR) probes. Measured time series of volumetric soilmoisture were calibrated based on five to seven gravi-metric soil moisture samples collected at each site, foreach depth and during both the dry and wet season.
Root zone water balance
During periods of zero precipitation with a deep groundwater table and assuming no significant drainage todeeper layers or lateral inflows, soil evaporation andtranspiration (root water uptake) are the only mechanismsfor depleting the moisture content in the root zone.Under these circumstances, estimates of (combined) soilevaporation and root water uptake can be derived fromsoil moisture measurements at different depths:
S�t� � S�t C t� D Et D∫ Z
0[��z, t� � ��z, t C t�]dz
�1�where S is water stored in the root zone, E representsthe evaporation losses from the root zone (both soilevaporation and root water uptake), � is volumetric soilmoisture, z is the depth of the root zone and t is anappropriate time step (in our case, 1 day). Equation (1)can be safely applied during the dry season in ourcatchment, when precipitation inputs are negligible anddeep percolation is restricted (see Section on Results).To apply (1) we have divided the soil profile into threelayers (surface to 0Ð75 m, 0Ð75–1Ð50 m and 1Ð50–2Ð25 mdepth). For each of these layers, we assume that thechange in water content is uniform and contributesequally to E. We therefore assume that soil evaporationis a negligible fraction of total evapotranspiration lossesduring the dry seasons. Based on Equation (1) we definethe evaporation reduction factor (Williams and Albertson,2004):
� D E
Emax�2�
where Emax is the maximal rate of evaporation (atmo-spheric demand), and E is the actual evaporation or rootwater uptake, derived from Equation (1). This reductionfactor can be computed for each soil layer, and allowsus to compare variability of root water uptake within theroot zone (see Section on Results).
The previous equations assume negligible deep per-colation. To verify this assumption, estimates of verticalwater flow were made using the Darcy-Buckingham law.Because of the lack of soil suction measurements, matrixpotential and unsaturated hydraulic conductivity wereestimated using soil moisture measurements and apply-ing the van Genuchten-Mualem model (van Genuchten,1980). An average hydraulic conductivity for each layer
Copyright 2008 John Wiley & Sons, Ltd. Ecohydrol. 1, 13–22 (2008)DOI: 10.1002/eco
HYDROLOGIC EFFECTS OF INTRODUCING NON-NATIVE VEGETATION 17
was calculated using the harmonic mean of the hydraulicconductivity of the top and bottom layer. Assuming thepositive z-axis pointing downwards and using the surfaceas the reference plane, vertical soil water flux for eachsoil layer is given by:
q D �KT�B���HB��� � HT���
dT�B�3�
where q is vertical flow rate, KT�B is the harmonicmean of the hydraulic conductivity of the top and bottomlayers, � is the volumetric water content, dT�B is the flowdistance between observations and HT and HB are thehydraulic heads at the top and the bottom of the studiedlayer, respectively.
RESULTS
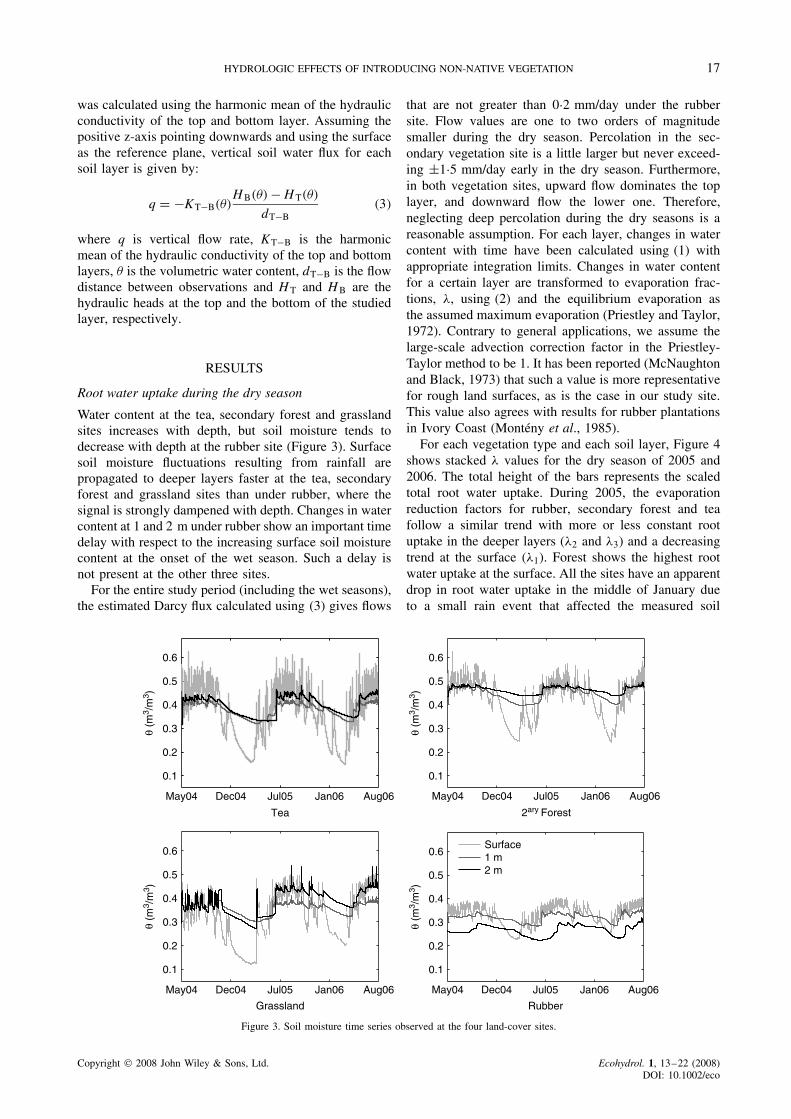
Root water uptake during the dry season
Water content at the tea, secondary forest and grasslandsites increases with depth, but soil moisture tends todecrease with depth at the rubber site (Figure 3). Surfacesoil moisture fluctuations resulting from rainfall arepropagated to deeper layers faster at the tea, secondaryforest and grassland sites than under rubber, where thesignal is strongly dampened with depth. Changes in watercontent at 1 and 2 m under rubber show an important timedelay with respect to the increasing surface soil moisturecontent at the onset of the wet season. Such a delay isnot present at the other three sites.
For the entire study period (including the wet seasons),the estimated Darcy flux calculated using (3) gives flows
that are not greater than 0Ð2 mm/day under the rubbersite. Flow values are one to two orders of magnitudesmaller during the dry season. Percolation in the sec-ondary vegetation site is a little larger but never exceed-ing š1Ð5 mm/day early in the dry season. Furthermore,in both vegetation sites, upward flow dominates the toplayer, and downward flow the lower one. Therefore,neglecting deep percolation during the dry seasons is areasonable assumption. For each layer, changes in watercontent with time have been calculated using (1) withappropriate integration limits. Changes in water contentfor a certain layer are transformed to evaporation frac-tions, �, using (2) and the equilibrium evaporation asthe assumed maximum evaporation (Priestley and Taylor,1972). Contrary to general applications, we assume thelarge-scale advection correction factor in the Priestley-Taylor method to be 1. It has been reported (McNaughtonand Black, 1973) that such a value is more representativefor rough land surfaces, as is the case in our study site.This value also agrees with results for rubber plantationsin Ivory Coast (Monteny et al., 1985).
For each vegetation type and each soil layer, Figure 4shows stacked � values for the dry season of 2005 and2006. The total height of the bars represents the scaledtotal root water uptake. During 2005, the evaporationreduction factors for rubber, secondary forest and teafollow a similar trend with more or less constant rootuptake in the deeper layers (�2 and �3) and a decreasingtrend at the surface (�1). Forest shows the highest rootwater uptake at the surface. All the sites have an apparentdrop in root water uptake in the middle of January dueto a small rain event that affected the measured soil
May04 Dec04 Jul05 Jan06 Aug06 May04 Dec04 Jul05 Jan06 Aug06
May04 Dec04 Jul05 Jan06 Aug06May04 Dec04 Jul05 Jan06 Aug06
0.1
0.2
0.3
0.4
0.5
0.6
Tea
θ (m
3 /m
3 )
θ (m
3 /m
3 )θ
(m3 /
m3 )
θ (m
3 /m
3 )
0.1
0.2
0.3
0.4
0.5
0.6
0.1
0.2
0.3
0.4
0.5
0.6
0.1
0.2
0.3
0.4
0.5
0.6
2ary Forest
Grassland Rubber
Surface1 m2 m
Figure 3. Soil moisture time series observed at the four land-cover sites.
Copyright 2008 John Wiley & Sons, Ltd. Ecohydrol. 1, 13–22 (2008)DOI: 10.1002/eco
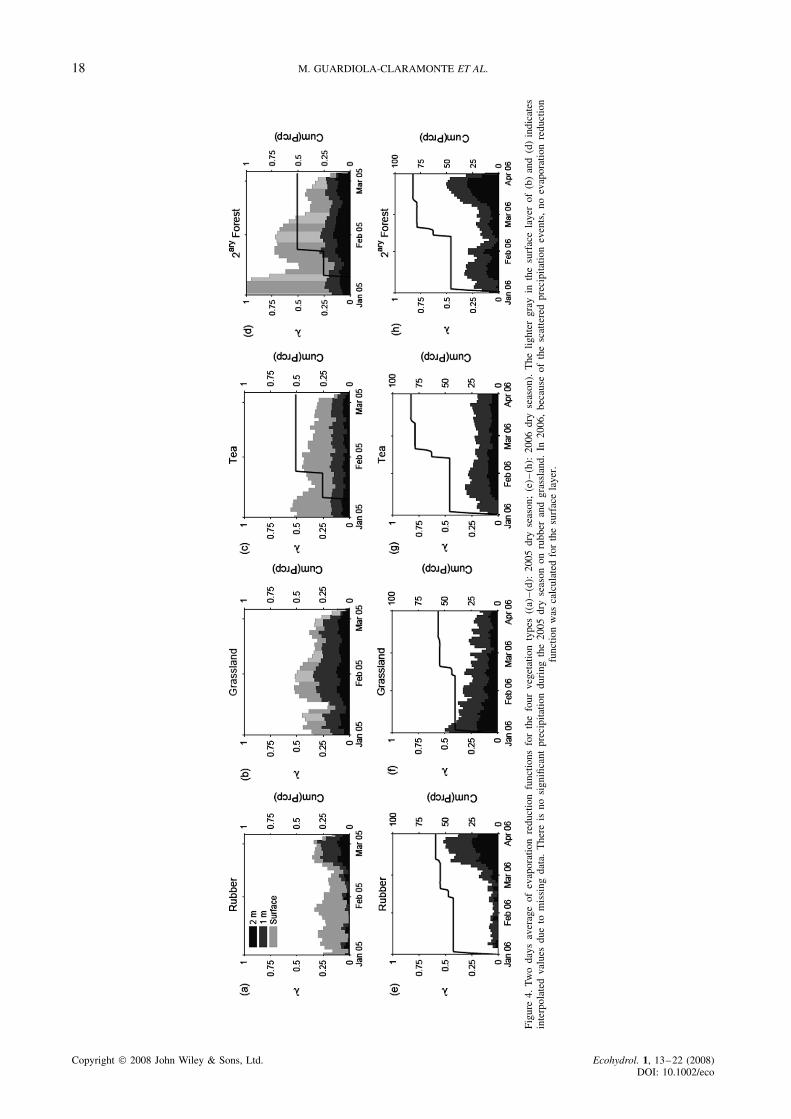
18 M. GUARDIOLA-CLARAMONTE ET AL.
Figu
re4.
Two
days
aver
age
ofev
apor
atio
nre
duct
ion
func
tions
for
the
four
vege
tatio
nty
pes
((a)
–(d
):20
05dr
yse
ason
;(e
)–(h
):20
06dr
yse
ason
).T
helig
hter
gray
inth
esu
rfac
ela
yer
of(b
)an
d(d
)in
dica
tes
inte
rpol
ated
valu
esdu
eto
mis
sing
data
.T
here
isno
sign
ifica
ntpr
ecip
itatio
ndu
ring
the
2005
dry
seas
onon
rubb
eran
dgr
assl
and.
In20
06,
beca
use
ofth
esc
atte
red
prec
ipita
tion
even
ts,
noev
apor
atio
nre
duct
ion
func
tion
was
calc
ulat
edfo
rth
esu
rfac
ela
yer.
Copyright 2008 John Wiley & Sons, Ltd. Ecohydrol. 1, 13–22 (2008)DOI: 10.1002/eco

HYDROLOGIC EFFECTS OF INTRODUCING NON-NATIVE VEGETATION 19
Figure 5. Daily albedo values and evaporation fraction (�) for 2005 and 2006 dry seasons. Average two days evaporation reduction function forrubber in 2005 and 2006.
moisture. Rubber shows a distinctive trend in the surfaceand subsurface layers. From January and throughout mostof February 2005, evaporation mainly depletes watercontent from the surface layer. Starting in mid-February,root water uptake from the deeper layers increases rapidlywhile no changes occur at the surface. The maximum rootwater uptake from the deeper layers occurs at the end ofFebruary, a few weeks before the arrival of the first rains.
The 2006 dry season is characterized by a fewsignificant rainstorms occurring at the beginning of Jan-uary (¾40 mm) and mid-February (¾30 mm)(Figure 4(e)–(h)). Again, the secondary forest site showsthe highest subsurface water uptake. Secondary foresthas increased root water uptake in both deeper layers afew days after the two main precipitation events. Rubbershows a similar response as in 2005, with very low rootwater uptake for the first two months of the dry seasonand a sudden increase from mid March through the endof March. During this dry season, � in tea and grasslandshows a similar pattern as in 2005. The most notable dif-ference is the pronounced decline of root water uptake inthe deepest soil layer under the grassland site.
Changes in surface albedo
Albedo values at the rubber plantation range from 0Ð12,measured early in the year, to over 0Ð20 in March
(Figure 5). Because vegetation cover at the 3-years oldtea plantation was low in 2004, albedo measurementsreflect, to some extent, soil moisture variations in addi-tion to vegetation phenology. Albedo was not measuredat the secondary vegetation and grassland site. Additionalalbedo measurements were recorded in a younger sec-ondary vegetation site located within the basin. Theselimitations in data availability were taken into consider-ation, and the major findings are not based on them.
DISCUSSION
The phenology of rubber is determined mainly by eitherthe annual course of photoperiod (the physiological reac-tion of vegetation to the length of day or night), orinsolation (Renner, 2007; Yeang, 2007). The time seriesin Figure 6 show rubber’s albedo, increase of day-length,noon insolation, and precipitation during the study period.Albedo measured above rubber, tea and secondary veg-etation was correlated with increase of day-length, inso-lation, precipitation and temperature. Rubber’s albedo ismost highly correlated with the increase in day-length,with a correlation coefficient of 0Ð56. No significant cor-relation was found between rubber phenology and the
Jan 05 Mar Jun Sep Dec Mar Jul 060
100
200
300
400
P [m
m]
Alb
edo
0.05
0.1
0.15
0.2
0.25
Jan 05 Mar Jun Sep Dec Mar Jul 061.5
0.75
0
0.75
1.5
Incr
ease
Day
leng
th [m
in]
Noo
n In
sola
tion
[Wat
s/m
2 ]
600
700
800
900
1000
Figure 6. The top panel shows precipitation (left axis) measured in rubber plantation (black) and secondary forest (grey); the lower panel presentsday-length increments (solid black line) and surface albedo (solid grey line) at the rubber plantation.
Copyright 2008 John Wiley & Sons, Ltd. Ecohydrol. 1, 13–22 (2008)DOI: 10.1002/eco
20 M. GUARDIOLA-CLARAMONTE ET AL.
other climatic variables. Insolation, theoretically calcu-lated incoming noon radiation (Figure 6), or similarly,measured incoming solar radiation, showed no correlationwith rubber albedo. These results highlight the impor-tance of increase in day-length on the dynamics of rubberin this environment. Other environmental variables sug-gested elsewhere (such as precipitation and temperature)play, at best, a minor role in the rubber phenology (Raoet al., 1990, 1998; Chandrashekar et al., 2002; Raj et al.,2005). Tea shows trends similar to rubber, with highercorrelation of tea’s albedo with the increase in day-length.However, albedo of secondary forest seems to correlatemore strongly with temperature.
In Nam Ken, Hevea is dormant from November toMarch and retains its foliage until the end of February,when leaves are shed within 2–4 weeks. Bud break andgrowth of new leaves start in late March, several (2–4)weeks before the arrival of the first monsoon rains. Shed-ding of old leaves results in an increase in albedo from0Ð12 (typical value of evergreen forest) to 0Ð20 (a typicalvalue for dry soil) in March; and flushing of new leavesdecreases albedo back to 0Ð12 in April (Figure 6). Rapidshoot growth during the late dry season (April) is accom-panied by increased water uptake from deeper soil layers(Figure 4(a), (e); cf. Borchert et al., 2002). This subsur-face water uptake is necessary to increase stem waterpotential above a certain threshold to allow bud break(Borchert et al., 2002). In support, a study in northernIndia showed girth perimeter increasing several weeksbefore the first rainfall, possibly indicating rehydrationof the tree from deep layer water uptake, associatedwith bud breaking (Chandrashekar et al., 1998). Further-more, flushing induced by increasing day-length duringthe late dry season has been observed in many tropicaltree species in monsoon forests around the globe (Riveraet al., 2002; Elliott et al., 2006). It depends on the avail-ability of adequate subsoil reserves, as observed earlierin Amazonian forests (Nepstad et al., 1994).
The causes of bud break and flushing of certaintropical species during the dry season (a phenomenonreferred to as the leaf flushing paradox; Rivera et al.,2002; Elliott et al., 2006) is under debate (Renner,2007). As pointed out by Rivera et al. (2002) and Elliottet al. (2006) rubber flushing is independent of climateconditions and is primarily associated with photoperiodicinduction (increase in day-length) and the availabilityof deeper subsurface water. Flushing occurs around theequinox, which corresponds to the maximum increasein day-length. Observations of changes in the albedo ofrubber together with increase of day-length (Figure 6)and with root water uptake (Figure 5) confirms thatrubber is indeed a brevideciduous spring flushing species.It seems that water availability plays a secondary rolein triggering rubber dynamics during the dry period,either for shedding or flushing new leaves. As shown inFigure 4, rubber exhibits a distinct behaviour comparedto the other land use types. Secondary forest, tea, andgrassland seem to depend primarily on water availabilityin the form of rain. In 2005 (the drier of the two dry
seasons) no increase in deep root water uptake wasobserved in the secondary forest site. However, the fewrain events in 2006 did trigger activation of vegetationand growth (Figure 4(h)). Tea and grassland do notshow any activation of deeper roots after the rainstorms,possibly because their water needs are fulfilled with near-surface water sources.
Rubber currently (in 2005) represents over 16% of theland-cover in the Nam Ken basin (Table I). Replacing16% of the native vegetation by rubber could have impor-tant implications on the local and regional hydrologi-cal cycle. Based on long-term observations, Liu (1990)(reported in Wu et al., 2001) shows a negative rela-tionship between the presence of fog and the increaseof rubber plantations in the Xishuangbanna region. Theauthor claims that the reduction of fog in the region is adirect consequence of replacing forest with rubber, giventhat rubber trees shed their leaves during the dry season(Wu et al., 2001), with a consequent reduction of leafinterception and drip. Liu et al. (2004) refer to this alter-ation of hydrologic partitioning by rubber as the mainreason for the observed reduction in soil water content.This could also explain our observations of lower watercontent with depth for rubber, as compared to secondaryforest (Figure 3). Soil moisture under grassland and teadoes not decrease with depth because of the absence ofdeep roots to deplete the water content at deeper lay-ers, as field observations and the literature suggest. Wenow know that rubber’s water demand is concentratedaround the equinox, when soil water availability is low-est and atmospheric demand is greatest. In similar settings(where precipitation and atmospheric demand are ‘out ofphase’) changes in native vegetation have resulted in dra-matic changes in streamflow and/or groundwater levels(Wilcox et al., 2006).
CONCLUSION
Observations of vegetation dynamics and soil mois-ture time series analysis suggest a dramatically differentbehaviour in terms of timing and rates of water consump-tion between the studied vegetation types. Albedo trendsand field observations indicate that rubber sheds its leavesfor a couple of weeks during the driest and hottest periodin the region. Leaves fall to minimize water loss throughevaporation and to allow the build-up of stem potentialto initiate next season’s bud break. The additional stempotential needed for flushing is acquired through deepsubsurface water uptake. Leaf flushing is triggered by theincrease in day-length. At the secondary forest site, rootwater uptake is linked to water availability in the formof rain. Native forest trees rehydrate after occasional rainevents during the dry season, or shortly after the start ofthe rainy season. Water extraction from deep soil layerswas not observed under shallow-rooted tea and grasslandcovers.
These results indicate that a specific conceptual modelis needed to predict hydrologic changes due to land-use changes. In general, evaporation reduction functions
Copyright 2008 John Wiley & Sons, Ltd. Ecohydrol. 1, 13–22 (2008)DOI: 10.1002/eco

HYDROLOGIC EFFECTS OF INTRODUCING NON-NATIVE VEGETATION 21
depend solely on soil water content; however, our resultsemphasize the importance of an ecohydrological perspec-tive for modelling purposes. We have shown that in thecase of rubber trees, the increase in day-length is thedeterministic variable that controls vegetation dynam-ics and water uptake in the dry season. The need tobuild an evaporation reduction function based on veg-etation dynamics and hydrologic information corrobo-rates the importance of bridging ecology and hydrologyto elucidate and solve common problems. Future workwill involve the development of a conceptual evapora-tion reduction model consistent with the ecohydrologicalobservations, and the application of the model at thecatchment scale.
ACKNOWLEDGMENTS
This research has been supported through NASA Grant# NNG04GH59G (Project ID: IDS/03-0365-0079), andthe Asia Pacific Network (grants ARCP2006-06NMY,ARCP2007-01CMY). The authors thank Li Haitao, Dr B.Nijssen and Dr J. Fox for their support. The reviewers arethanked for their comments within the reviewing process.
REFERENCES
Borchert R, Rivera G, Hagnauer W. 2002. Modification of vegetativephenology in a tropical semideciduous forest by abnormal drought andrain. Biotropica 34: 381–393.
Brontstert A. 2004. Rainfall-runoff modelling for assessing impacts ofclimate and land-use change. Hydrological Processes 18(3): 567–570,DOI:10.1002/hyp.5500.
Canadell J, Jackson RB, Ehleringer JR, Mooney HA, Sala OE, SchulzeE-D. 1996. Maximum rooting depth of vegetation types at the globalscale. Oecologia 108: 583–595.
Cao M, Zou X, Warren M, Zhu H. 2006. Tropical forest of Xishuang-banna, China. Biotropica 38(3): 306–309, DOI: 10Ð1111/j.1744–7429Ð2006Ð00146.x.
Chandrashekar TR, Nazeer MA, Marattukalam JG, Prakash GP, Anna-malainathan K, Thomas J. 1998. An analysis of growth anddrought tolerance in rubber during the immature phase in a drysubhumid climate. Experimental Agriculture 34: 287–300, DOI:10Ð1017/S0014479798343045.
Chandrashekar TR, Varghese YA, Alice J, Sailajadevi T, SaraswathyammaCK, Vijayakumar KR. 2002. Growth pattern of rubber trees (Heveabrasiliensis) in a tropical humid climate in India. Journal of RubberResearch 5(3): 191–198.
Chapman EC. 1991. The expansion of rubber in southern Yunnan, China.The geographical journal 157(1): 36–44.
Cunha TJF, Blancaneaux P, Filho BC, Ferreira de Santana do Carmo CA,Pinheiro Garcia NC, Bezerra Lima EM. 2000. Influencia dadiferenciacao pedologica no desenvolvimento da seringueira nomunicıpio de oratorios, MG. Pesquisa Agropecuaria Brasileira 35(1):145–155.
Devakumar AS, Prakash PG, Sathik MBM, Jacob J. 1999. Drought altersthe canopy architecture and micro-climate of Hevea brasiliensis trees.Trees 13: 161–167, DOI: 10Ð1007/PL00009747.
Elliott S, Baker PJ, Borchert R. 2006. Leaf flushing during the dryseason: the paradox of Asian monsoon forests. Global Ecology andBiogeography 15: 248–257, DOI: 10Ð1111/j.1466-822x.2006Ð00213.x.
Howell CJ, Schwabe KA, Samah AHA, Graham RC, Taib NI. 2005.Assessment of aboriginal smallholder soils for rubber growth in penin-sular Malaysia. Soil Science 170(12): DOI: 10Ð1097/01.ss.0000187346Ð30201Ð40.
Huxman TE, Scott RL. 2007. Climate change, vegetation dynamics, andthe landscape water balance. Southwest Hydrology 6(1): 28–37.
Jiang QN. 2003. Actualities of Yunnan natural rubber industry. YunnanTropical Sciences and Technology 25: 34–38.
Kim W, Kanae S, Agata Y, Oki T. 2005. Simulation of potential impactsof land use/cover changes on surface water fluxes in the Chaophrayariver basin, Thailand. Journal of geophysical research 110: DOI:10Ð1029/2004JD004825.
Lambin EF, Turner BL, Geist HJ, Agbola SB, Angelsen A, Bruce JW,Coomes OR, Dirzo R, Fischer G, Folke C, George PS, Homewood K,Imbernon J, Leemans R, Li X, Moran EF, Mortimore M, Ramakr-ishnan PS, Richards JF, Skanes H, Steffen W, Stone GD, Svedin U,Veldkamp TA, Vogel C, Xu J. 2001. The causes of land-use andland-cover change: moving beyond the myths. Global EnvironmentalChange 11: 261–269.
Liu WJ, Meng FR, Zhang YP, Liu YH, Li HM. 2004. Water inputfrom fog drip in the tropical seasonal rain forest of Xishuangbanna,southwest China. Journal of Tropical Ecology 20: 517–524, DOI:10Ð1017/S0266467404001890.
McNaughton KG, Black TA. 1973. A study of evapotranspiration fromDouglas fir forest using the energy balance. Water Resources Research9: 1579–1590.
Moiser AR. 1998. Soil processes and global change. Biology and Fertilityof Soils 27(3): 221–229, DOI: DOI10Ð1007/s003740050424.
Monteny BA, Barbier JM, Bernos CM. 1985. Determination of theenergy exchanges of a forest type culture: Hevea brasiliensis . InThe Forest–Atmosphere Interaction, Hutchinson BA, Hicks BB (eds).Reidel: Dordrecht; 211–233.
Nepstad DC, de Carvalho CR, Davidson EA, Jipp PH, Lefebvre PA,Negreiros GH, da Silva ED, Stone TA, Trumbore SE, Vieira S. 1994.The role of deep roots in the hydrological and carbon cycles ofAmazonian forests and pastures. Nature 372: 666–669.
Newman BD, Wilcox BP, Archer SR, Breshears DD, Dahm CN, DuffyCJ, McDowell NG, Phillips FM, Scanlon BR, Vivoni ER. 2006.Ecohydrology of water-limited environments: a scientific vision. WaterResources Research 42: DOI: 10Ð1029/2005WR004141.
Priestley CHB, Taylor RJ. 1972. On the assessment of surface heat fluxand evaporation using large scale parameters. Monthly Weather Review100(2): 81–92, DOI: 10Ð1175/1520-0493.
Raj S, Das G, Pothen J, Dey SK. 2005. Relationship between latexyield of Hevea brasiliensis and antecedent environmental parameters.International Journal of Biometeorology 49: 189–196, DOI:10Ð1007/s00484-004-0222-6.
Rao PS, Saraswathyamma CK, Sethuraj MR. 1998. Studies on therelationship between yield and meteorological parameters of pararubber tree (Hevea brasiliensis). Agricultural and Forest Meteorology90(3): 235–245, DOI: 10Ð1016/S0168-1923(98)00051-3.
Rao GG, Rao PS, Rajagopal R, Devakumar AS, Vijayakumar KR,Sethuraj MR. 1990. Influence of soil, plant and meteorologicalfactors on water relations and yield in Hevea brasiliensis .International Journal of Biometeorology 34(3): 175–180, DOI:10Ð1007/BF01048717.
Renner SS. 2007. Synchronous flowering linked to changes in solarradiation intensity. New Phytologist 175: 195–200.
Rivera G, Elliott S, Caldas LS, Nicolossi G, Coradin VTR, Borchert R.2002. Increasing day-length induces spring flushing of tropical dryforest trees in the absence of rain. Trees 16: 445–456, DOI:10Ð1007/s00468-002-0185-3.
van Genuchten MT. 1980. A closed-form equation for predicting thehydraulic conductivity of unsaturated soils. Soil Science Society ofAmerica Journal 44(5): 892–898.
Wilcox BP, Owens MK, Dugas WA, Ueckert DN, Hart CR. 2006.Shrubs, streamflow, and the paradox of scale. Hydrological Processes20: 3245–3259, DOI: 10Ð1002/hyp.6330.
Williams CA, Albertson JD. 2004. Soil moisture controls on canopy-scale water and carbon fluxes in an African savanna. Water ResourcesResearch 40: DOI: 10Ð1029/2004WR003208.
Wu X, Ou X. 1995. The Xishuangbanna Biosphere Reserve (China): ATropical Land of Natural and Cultural Diversity . Working Paper, 2.UNESCO (South-South Cooperation Progamme for EnvironmentallySound Socio-economic Development in the Humid Tropics), Paris.
Wu S-L, Liu H-M, Liu L-Y. 2001. Rubber cultivation and sustainabledevelopment in Xishuangbanna, China. International Journal ofSustainable Development and World Ecology 8(4): 337–345.
Xu J, Fox J, Vogler JB, Peifang Z, Yongshou F, Lixin Y, Jie Q.2005. Land-use and land-cover change and farmer vulnerabilityin Xishuangbanna prefecture in southwestern China. EnvironmentalManagement 36(3): 404–413, DOI: 10Ð1007/s00267-003-0289-6.
Yeang H-Y. 2007. Synchronous flowering of the rubber tree (Heveabrasiliensis) induced by high solar radiation intensity. New Phytologist175: 283–289.
Zhang J, Cao M. 1995. Tropical forest vegetation of Xishuangbanna,SW China and its secondary changes, with special reference to some
Copyright 2008 John Wiley & Sons, Ltd. Ecohydrol. 1, 13–22 (2008)DOI: 10.1002/eco

22 M. GUARDIOLA-CLARAMONTE ET AL.
problems in local nature conservation. Biological Conservation 73:229–238, DOI: 10Ð1016/0006-3207(94)00118-A.
Zhu H. 1997. Ecological and biogeographical studies on the tropicalrain forest of south Yunnan, SW China with a special reference toits relation with rain forest of tropical Asia. Journal of Biogeography24(5): 647–662.
Zhu H. 2006. Forest vegetation of Xishuangbanna, south China. ForestryStudies in China 8(2): 1–58, DOI: 10Ð1007/s11632-006-0014-7.
Zhu H, Xu ZF, Wang H, Li BG. 2004. Tropical rain forest fragmentationand its ecological species diversity changes in southern Yunnan. Biodi-versity and Conservation 13: 1355–1372, DOI: 10Ð1023/B : BIOC.0000019397Ð98407.c3.
Copyright 2008 John Wiley & Sons, Ltd. Ecohydrol. 1, 13–22 (2008)DOI: 10.1002/eco