local institutions and pandemics: city autonomy and the
TRANSCRIPT

http://peeg.wordpress.com
Local institutions and pandemics: City autonomy and the
Black Death
Han Wang & Andrés Rodríguez-Pose
Papers in Evolutionary Economic Geography
# 21.30
1
Local institutions and pandemics: City autonomy and the
Black Death
by
Han Wang a and Andrés Rodríguez-Pose a, b
a Department of Geography and Environment, London School of Economics, United Kingdom
b Cañada Blanch Centre, London School of Economics, United Kingdom
Abstract
Local institutions have long been regarded as key drivers of economic development. However, little is
known about the role of institutions in preparing places to cope with public health crises and pandemics.
This paper sheds light on how the nature of a local institution, city autonomy, influenced variations in
the incidence of the Black Death —possibly the worst pandemic ever recorded— across cities in
Western Europe between 1347 and 1352. We examine urban autonomy not only because it represented
a major political shift in medieval times, but because, more importantly, it also represents a key
prototype of modern political institutions. By exploiting data on the spatial variation of Black Death’s
mortality rates and duration using OLS and 2SLS methods, we uncover that city autonomy reduced
mortality rates by, on average, almost 10 percent. Autonomous cities were in a better position to adopt
swift and efficient measures against the pandemic than those governed by remote kings and emperors.
This relationship has been confirmed by a series of placebo tests and robustness checks. In contrast,
there is no evidence to suggest that city autonomy was a factor in reducing the duration of the pandemic
in European cities.
Keywords: Local institutions, pandemics, city autonomy, Black Death, Europe
JEL Codes: N43, N93, O17

2
1. Introduction
While the role of cities in promoting economic development has been widely acknowledged,
its negative externalities, such as air pollution, crime and pandemics, have only been taken
seriously when they endanger citizens’ health and lives (Duranton et al, 2015). The recent
outbreak of Covid-19 has cast the role of pandemics for cities in another light. It has become
evident that, as a consequence of the agglomeration of individuals and geographic proximity
in cities (often combined with a lack of preventative measures), urban dwellers are a highly
vulnerable group to the spread of disease. The high urban mortality and infection rates of SARS,
Ebola, and COVID-19 have reminded everyone how vulnerable cities are to pandemics, even
in modern times (Atkeson, 2020; Bowles et al., 2016; Desjardins et al., 2020; Qiu et al., 2018).
This observation has been confirmed through reviewing the impacts of historical pandemics,
including Justinian’s plague, the Black Death, and the 1918 influenza pandemic, on human
lives.
The sheer density of cities is considered by many a factor that limits the efficiency of any
measure taken against pandemics (Almond, 2006; Jedwab et al., 2019). Often, cities are at the
mercy of disease and their variations in performance during pandemics is often considered to
be dependent on luck. This has led some researchers on pandemics to treat them as exogenous
shocks (Weil, 2010; Young, 2005). In the field of applied economics,
it is becoming increasingly popular to treat the outbreak of epidemics as a natural experiment
to examine the impact of external shocks on the local economy (Almond, 2006; Dittmar &
Meisenzahl, 2020; Donaldson & Keniston, 2016; Jedwab et al., 2019). In this respect, there is
little differentiation between anti-pandemic efforts made by cities and those by their inhabitants.
However, are the short-term consequences of pandemics truly random? Are institutional factors
really unimportant to the control of pandemics? More importantly, are changes to city
governance while fighting epidemics futile?
In this paper, we intend to answer these questions by systematically reviewing how differences
in urban institutions affected the spread of the Black Death during its initial outbreak between
1347 and 1352. It should be noted that, although the biggest outbreak of the plague took place
during this period, there were recurrent outbursts later in the century and in the following
centuries. Numerous European cities, in particular, witnessed repeated episodes of the Black
Death, as was the case of London between the 14th and 17th centuries (Earn et al., 2020).
Nevertheless, the biggest shock and incidence took place during the initial outbreak. Taking

3
this into account, as well as a lack of complete pan-European data on the incidence of
subsequent outbreaks, we focus our attention on the initial mid-14th century outbreak.
The Black Death has been chosen for three reasons. First, it is possibly the largest demographic
shock in the history of mankind. It is estimated that one- to two-thirds of Europe’s population
died from the plague between 1347 and 1352 (Ziegler, 2013). Entire villages disappeared,
while many cities went into permanent decline. Although the Black Death has attracted
attention from many disciplines, research on the political rationale behind the large variation
in mortality rates across Western European cities remains limited. Most political research on
the Black Death emphasizes the interaction between wars and the plague in Eurasia (Caferro,
2018; Jackson, 2018). Only a few pieces of research (Ormrod, 1996; Palmer, 2000) have
specifically investigated into the plague from the perspective of rule of law or national
government. However, while all of these works examine how political influence evolved after
the outbreak of an epidemic, the political system’s response to the Black Death has largely
been ignored. Some cities were almost completely devastated, while others were mostly spared
by the plague. Differences in local institutions may have played a role in these variations.
Second, the Black Death is the first pandemic in history that was recorded in detail, with
information on mortality rates, durations of specific waves, and the impact on cities’
populations (Alfani & Murphy, 2017; Benedictow, 2004). The data available make it possible
to comprehensively analyse whether the different plague prevention measures adopted by cities
made a difference for the impact of the pandemic.
Third, the Black Death is often identified as a crucial turning point in history, which may still
have a profound impact on modern development (Herlihy, 1997). There is a popular view that
the Black Death is the key element in Europe’s divergence from the rest of the world (Diamond,
2013; Epstein, 2000; North & Thomas, 1973). Some even declare that the plague set Western
Europe on a path to faster economic development by contributing to the onset of a high-income
Malthusian equilibrium (Clark, 2008). However, without a deep understanding of what caused
significant variations in the Black Death’s impact from city to city, it is difficult to assess the
validity of these arguments.
We use new city level data stemming from Christakos et al. (2005) to uncover what has led to
the considerable variations in the Black Death’s impact across Western European cities
between 1347 and 1352. Based on our knowledge, although explorations of the Black Death
differ, few papers directly focus on the role of institutions in the Black Death, especially from

4
the perspective of the local government. In fact, we know next to nothing about the effects of
local institutions in dealing with the spread of the pandemic and its impact. However, in this
period, the autonomy and governance of European cities varied significantly from one city to
another. Did cities with greater autonomy, which may have enabled them to react faster and
differently against the spread of the plague, perform better than cities that were under the tight
control of remote kings and emperors?
To answer these questions, we will look at the link between city autonomy in Europe during
the Middle Ages and Black Death mortality rates during the initial outbreak of the plague. Our
results show that greater autonomy has led to a considerable reduction in pandemic death rates.
This finding is robust to the inclusion of a gamut of geographic, social, and political covariates.
The impact of city autonomy was therefore significant, but not seconded by the political factors
considered in this analysis. Urban autonomy facilitated a more nimble and effective adoption
of measures against the diffusion of the disease within the city. Nevertheless, the duration of
the Black Death pandemic in different cities was relatively random. Based on our results, none
of the variables considered have any impact on reducing the epidemic duration.
Our search contributes to literature on the geography of plague by bringing into light the local
institutional dimension. Most of the perspectives driven by politics focus on the direct impact
of the pandemic on local politics and political economy. In contrast, our research question
explores the political rationale behind variations in the impact of the plague. In addition, by
considering possible errors in historical local data, our paper explores whether this is the case
by means of different experiments and trials to ensure that the estimates are reliable.
The remainder of this paper proceeds as follows: section 2 describes the historical context of
the Black Death and the diversity of autonomous cities at that time. Section 3 introduces the
model and data used in this study. Section 4 presents the estimated results, and section 5 offers
a conclusion.
2. Historical context
2.1 The Black Death
The Black Death was one of the most devastating pandemics recorded in human history. The
plague reached Europe in October 1347, when 12 ships from the Black Sea were moored in the

5
Sicilian port of Messina (Hajar, 2012). The people on the dock found that most of the sailors
on the ship were dead and those still alive were dying, covered in blood and pus. The Sicilian
government decided to expel these ships immediately, but it was too late. Based on estimations,
over the following five years, the Black Death killed over 20 million people in Medieval Europe,
which is around one to two-thirds of the population at that time (Benedictow, 2004).
Scientists have understood the Black Death from an epidemiological perspective. It was spread
by a bacillus called Yersinia pestis (named after Alexandre Yersin, who discovered the germ
at the end of the 19th century). Under normal conditions, Yersinia pestis transmits poorly from
person to person, but it can have a high transmission rate under exceptional circumstances, as
has happened in the past in Manchuria (Nishiura 2006), Madagascar (Randremanana et al.,
2019), and arguably also in Europe during the Black Death (Dols, 1979). A series of recent
paleo-genomic studies have explored the paths of transmission and found that during the Black
Death, both natural rodent-based foci within Europe and repeated introductions from
Central/Eastern Asia contributed to its spread (Demeure et al., 2019).
The heterogeneous effects of the play remain, however, still inconclusive. Recent
bioarcheological research has shown that the impacts of the Black Death could have been
influenced by people’s age and pre-existing health status (DeWitte & Wood, 2008). Godde et
al. (2020) support this, suggesting that frail individuals were more vulnerable to the illness.
However, they find that the risk of death in the elderly did not increase at all. Gender could
have played a greater role in differences in incidence. Using data from Hainaut, Curtis and
Roosen (2017) found the Black Death was sex-selective, killing all women than men in its
initial stages. However, a synthetic study by Godde and Hens (2021) has come to the
conclusion that in London the plague killed both females and males indiscriminately. Overall,
variations in the transmission patterns of the plague may have been shaped by specific
conditions in different cities and countries.
Medieval cities were notorious for high levels of ill-health and bad living conditions, compared
to rural and nomadic lifestyles. Pest infestation was common. Water-supply infrastructure built
to ensure public access to clean water only existed in a few cities, such as medieval London
(Salzman, 2017). In most cities, water was transported from outside and then shared between
many people for different uses. Disease vectors, such as fleas and bedbugs, easily carried
bacteria between humans. Roundworms and whipworms were not restricted to the poor, who
might not have clean water or clean clothes in their house. Even Richard III, the king of

6
England, was infected by roundworms. Although privies have been built in Medieval Europe
for a long time, they were not in sufficient supply, meaning that faecal contamination of food
was rife (Mitchell, 2015). Furthermore, sewage ran in the gutter and people threw their faeces
and urine directly out of the window (Gottfried, 2010). These bad living environments in the
cities directly affected people’s health both before and during the Black Death era.
Bioarcheological evidence has shown that health conditions in London generally decreased in
the 13th century, which possibly contributed to the high mortality rates in the city during the
Black Death (DeWitte, 2015). By measuring heath conditions considering adult stature,
DeWitte and Hughes-Morey (2012) found that poor health —proxied by short stature— was
associated with higher mortality rate during the Black Death.1 Insalubrious living conditions
caused cities in Medieval Europe facilitated the spread of the Black Death.
The incidence of the Black Death across cities in Europe in its initial stages were, however, far
from homogenous. From 1347 to 1352, mortality rates varied greatly from city to city. In some
cities, such as Leuven, Arras, and Douai, reported mortality rates were lower than 10 percent.
In contrast, mortality rates in places including Yarmouth, Scicli in Sicily, and Ciudad Real
exceeded 70 percent of the city population. What factors explain such large variations in
mortality? Some scholars argue that ports and centres of trade routes were hit the hardest by
the Black Death (Yue et al., 2017). However, counterexamples abound and make it impossible
to reach a definite conclusion. For example, the Italian port of Genoa reportedly had a Black
and Death mortality of about 35 percent. This was lower than that of inland Verona (45 percent),
but also lower than in the port of Venice (60 percent) (Christakos et al., 2005: 163). Although
there are some rough descriptive statistics and case studies, historical accounts have not
rationalized the patterns in the data (Cohn & Alfani, 2007; Theilmann & Cate, 2007). More
importantly, when the Black Death appeared, European societies were unprepared to face the
threat. However, as it became clear that the plague was there to stay, a process of institutional
adaptation occurred. This institutional adaptation became an example of how humans react to
a change in their environment.
2.2 Urban autonomy
One factor that has generally been overlooked is the role of local institutions in confronting the
plague. Urban governments in Western Europe had been diverging for more than 200 years
1 has been argued that stature is positively related to the health condition of adults (DeWitte & Hughes-Morey, 2012).

7
before the Black Death hit.2 Following the collapse of the Carolingian Empire, some cities
started to develop forms of local participative government and demand representation in
national policymaking. The first occurrences of autonomous cities were in Spain and Italy in
the 11th century and quickly spread across Europe in the following centuries (Van Zanden et
al., 2012). Urban elites such as lawyers, merchants, and entrepreneurs became increasingly
influential in these cities (Belloc et al., 2016). Members of the elite soon began to form
associations and make agreements to cooperate on issues of common concern (Guiso et al.,
2016). As a result, autonomous cities started to slowly evolve (Jones, 2003). Citizens who had
previously been excluded from urban governance began to partake in the sessions of the city
government. Within the processes, citizens gradually learned how to regulate economic and
social issues and resolve their disputes with a decentralized approach. Citizen participation
improved across all of Europe and, in some cases, the need for central authority and
authoritarian leaders became redundant (Belloc et al., 2016). Within autonomous cities,
personal freedom was no longer threatened by distant kings and was protected by local laws.
City autonomy also brought about a greater scrutiny of government officials’ actions by local
citizens and new forms of regulation. It is worth noting that not all the people living in
autonomous cities had the qualification of citizenship and were allowed to participate in the
political process. Citizenship in Italy only awarded to men who owned a house after coming
of age. Women, servants and minorities (mostly Jews and Muslims at the time) were excluded
(Belloc et al., 2016). In some places citizenship was also linked to either patronage (by
religious authorities or nobles) or membership of associations (mainly guilds) (Alsayyad &
Roy, 2016).
The increase in the number of politically autonomous cities in the late Middle Ages has been
considered a factor in the economic and political rise of Europe at the time (Weber, 1956).
Research by Acemoglu et al. (2005), De Long and Shleifer (1993), and Jacob (2010) also points
to the positive effect that autonomous cities had on urban development. Acemoglu et al. (2005)
argued that rapid economic development mainly occurred in places with non-absolutist initial
institutions. The greater the level of local authority and the fewer the constraints on economic
activity imposed by the state, the higher the incentives and opportunities for economic and
urban expansion. As a key political institution, urban autonomy could effectively limit the
2 In this study, we have followed the definition and data provided by Bairoch et al. (1988), Christakos et al. (2005) and Stasavage (2014). The Western European countries considered include modern-day Austria, Belgium, Denmark, France, Germany, Italy, Netherlands, Portugal, Spain, Switzerland, and the UK.

8
power of the monarchy, secure property rights, and stimulate economic development (Frank,
1978; North, 1978; North & Thomas, 1973).
However, research so far has been limited to linking urban autonomy to economic outcomes.
How city autonomy affected reactions to a severe public health crises, such as the Black Death,
has attracted limited attention. Our knowledge of the topic is, so far, restricted to a number of
anecdotes that point to a more rapid and active reaction of self-governing cities relative to other
cities (Geltner, 2020). Autonomous cities seemed to have led the introduction of more effective
health measures and institutions. At a local level, within an infected community, human contact
was limited by quarantines and other temporary restrictions on freedom of movement (Alfani
& Murphy, 2017). Venice, considered a classic example of a well-organized autonomous city,
took a series of measures that illustrated they understood that the Black Death was not just bad
air. Specifically, officials in the city inspected wine, fresh meat, and the water; ships were
boarded and searched; new burial regulations were put in place, meaning that corpses were
thrown into barges; measures were also introduced to restrict population clustering. Houses
affected by the plague were painted with vinegar and fumigated with sulphur, while religious
processions were banned unless a license was granted. The city also established a command-
and-control centre where all decisions concerning the pandemic were centralised and
communicated to the population (CitiesX, 2018). Non-autonomous cities, by contrast, did not
have the luxury of adopting their own measures and had to wait for decisions to be made by
distant kings in, say, Paris, London, or Toledo, or by the Pope in Rome (Hohenberg & Lees,
1995). It is not always the case that autonomous cities made rapid and/or suitable decisions
against a pandemic everyone knew little about, but they at least had more initiative relative to
cities with no or a far lower degree of autonomy. In view of this we can formulate two basic
hypotheses:
H1: Within the European cities, autonomous cities fared better than non-autonomous cities in
terms of reported mortality rates during the initial outbreak of the Black Death.
H2: Within the European cities, autonomous cities adopted measures that shortened the
duration of the pandemic than those adopted by non-autonomous cities.

9
3. The model and data
3.1 The research design and model
As discussed, the primary objective of this paper is to investigate whether and to what extent
the urban autonomy could affect the severity of the Black Death. Considering that our data
structure is cross-sectional, to test the two hypotheses above, omitted variable bias and reverse
causality could be the most important problems in the empirical stage of our research. To
relieve these concerns, our empirical strategy takes both Ordinary Least Squares (OLS)
analysis and instrument variable strategy. Basic OLS regression helps us observe changes in
the coefficient of urban autonomy when different covariates are gradually added to the model.
Thus, Ordinary Least Squares (OLS), with a set of controlled variables and spatial fixed effects,
are introduced to explore the interactions between the Black Death and autonomous cities.
After the OLS analysis, we will use a suitable instrument to deal with the endogeneity more
thoroughly. The model adopts the following form:
!"#$%&'$(#%$)/+,#%$'"-!,#$%&'#$() = /#0,$"-"1",24'$(! + /)6! + /$7! + 8* + 9! (1)
where i represents a city, and the outcome variables are, !"#$%&'$(#%$)!,#$%&'#$(), which
stands for the Black Death-related mortality rates in percentages (the proportion of deaths in
the overall population) in the years between 1347 and 1352; *+#%$'",!,#$%&'#$() , which
depicts how long the Black Death lasted, measured in months. The independent variable of
interest, -+$","."+/1'$(! , is a dummy variable that measures whether a city had a high
degree of self-governance during the years of the plague.
2! represents a vector of economic, political, and socio-demographic characteristics of the city
(including whether the city was a capital city, or if it had a bishop, archbishop, or a university).
Specifically, urban population is chosen because we consider that the epidemic could spread
faster in populous cities; capital cities usually control abundant political and economic
resources and may be able to cope well when facing the plague; a parliament, a bishop and an
archbishop were all important political and religious institutions in medieval Europe. By
considering these factors, we compare the impacts of the plague with the impacts of urban

10
autonomy. Universities, as the proxy variable of human capital at the regional level, are likely
to provide more feasible strategies when dealing with diseases.
3! corresponds to a vector that includes the city’s geographic factors, such as whether the city
was on a river, the sea, along a Roman road, as well as indications of the soil quality and
elevation above sea level. Transportation methods and routes such as rivers, seas, hubs and
roman roads are included in the analysis because they tend to accelerate the spread of
pandemics, which lead to increases in mortality and in their duration. Soil quality and elevation
can help us, to some extent, analyse the impact of natural resources on the spread of the Black
Death.
To control regionally correlated unobserved variables, we include country dummies to add the
spatial fixed effects 8* into the regressions. Europe being a vast and diverse continent makes it
difficult to compare cities across countries directly due to weather, cultural, and geographical
differences. Introducing country fixed effects may help us capture other unobserved effects.
Furthermore, to deal with the potential within-country correlation of the error term, we cluster
the standard error at the country level for all specifications.
3.2 Data
In this section we outline the sources and attributes of the data. In our research, one of the
challenges is to quantify reasonably both explanatory and outcome variables —namely the
severity of the incidence of the Black Death and urban autonomy— in medieval times. Both
mortality and duration data of the Black Death is provided by Christakos et al. (2005), who
collected, processed, and verified the Black Death data for a large number of European cities
systematically. Regarding our explanatory variable, urban autonomy, we follow Bosker et al.
(2013) and Stasavage (2014), and use a dummy variable to distinguish whether a city is
autonomous or not. In the following section, we will introduce the data sources of the
dependent, independent, and control variables in more detail.
The Black Death. Data on the Black Death has been taken from Christakos et al. (2005). These
authors compiled data on reported mortality rates based on information from a wide array of
historical sources. They carefully examined each data point and judged between conflicting
estimates based on the best available information. They also collected information on the
duration of the Black Death in certain cities. According to their dataset, the average mortality

11
rate in European cities was approximately 42.57 percent, with the average duration of a wave
of the plague lasting 6.3 months. The distributions of mortality rates and duration within
Western European cities are shown in Figures 1 and 2.
Figure 1: Mortality rate of the Black Death
Although no geographical pattern emerges in terms of mortality, Figure 1 identifies a number
of hotspots where the wreck associated with the Black Death was higher than elsewhere. The
highest incidence was found in Sicily, central Italy, southern France, Catalonia, and southern
England.3 The incidence was lower in southern Germany, Belgium, and most of central and
northern France. In terms of the duration of the plague, the Black Death lasted longer in
Belgium, northern France, central Germany, Andalusia, and in isolated cities such as Toledo,
Barcelona, and Naples (Figure 2). There seems to be no correlation between reported mortality
rates in cities and the duration of the plague there (Figure A2 in appendix). Naples, for example,
3 To have a more intuitive understanding of the countries and boundaries we are discussing, we use the boundaries of modern countries.

12
suffered the plague for a long time, but its mortality rate was low. In the Sicilian cities of Scicli
and Syracuse, the pandemic was shorter, but its impact was far more devastating.
Figure 2: Duration of the Black Death
Autonomous cities. To measure the autonomy of cities, we use data provided by Bosker et al.
(2013) (Figure 3). These authors classified cities according to their degree of local participative
government. Cities were classed as autonomous if they had institutions for self-governance and
the members of these institutions were chosen by the inhabitants of the city itself, not by outside
rulers, i.e., if there was a local urban participative organization that made decisions about local
urban affairs. Evidence of the presence of consuls, official documents like notarial acts signed
by the representatives of cities, and the presence of imperial charters to grant self-governance
to cities, were the criteria used to indicate whether a city was autonomous. To further verify
the accuracy of our data and as a means to ensure robustness, we also adopt a stricter definition
of urban autonomy provided by Stasavage (2014).

13
Figure 3: The location of autonomous and nonautonomous cities
City population. The main source of city population data is Bairoch (1988). This source
reported population estimates for cities in 1300. The criterion for inclusion in the dataset is a
city population greater than 1,000 inhabitants at the beginning of the 14th century. To expand
the sample size, we also add the population of 14 cities that were mentioned by Christakos et
al. (2005) (Figure A1 in appendix).
Social and political controls. We consider whether a city was a capital city. We also register
whether it was a bishopric or an archbishopric, respectively, based on the information provided
by McEvedy and Jones (1977). Capitals and cities high up in the ecclesiastical hierarchy were
important seats of power and, therefore, more likely to attract people and economic activity
based on the presence of a sovereign or bishop. We use information provided by Bosker et al.
(2013) to establish whether a city had a university or not. In Europe, universities started to
appear from the twelfth century onwards across the continent. As a breeding ground for
knowledge and development, the effect of universities on urban development can be considered
essential (Cantoni & Yuchtman, 2010). Furthermore, we also document whether a city

14
belonged to a political entity where it could participate in the political process by having
representatives in an active parliament (Van Zanden et al., 2012).
Geographic controls. The geographical characteristics included in the analysis concern a
city’s opportunities for long-distance trade and its degree of agricultural development. Using
data from Nussli (2011), we capture a city’s potential for water-based trade in medieval times
by documenting whether it was located within ten kilometres of the sea or a river. In the case
of land-based transportation, we resort to Bosker et al.’s (2013) work to document whether a
city was on a former Roman road or a hub of a Roman road. An advantage of using Roman
roads was their uniformity across Europe. To capture the agricultural potential of a city, data
from Ramankutty et al. (2002) is utilised. These authors combine information on soil quality
into one index, indicating the probability of viable agriculture in a given place in medieval
times. Finally, we also collect each city’s elevation from Jarvis et al. (2008). The elevation is
reported in metres. It should be noted that these covariates were taken from data for the year
1300 because it is closest to the start of the pandemic.
Our primary sample consists of a total of 162 cities that had more than 1000 inhabitants in 1300
and for which records of Black Death mortality rates are available. These cities made up close
to 60 percent of the urban population of Western Europe in this period. Out of the 162 cities,
we have plague duration information for 83. The descriptive statistics of variables are
summarized in Table 1.
Table 1: Descriptive Statistics
Variable Obs. Mean S.D. Min Max Mortality rate 162 42.56864 14.96201 5 100 Duration 83 6.349398 1.889856 3 12 Autonomous city 162 0.62963 0.484401 0 1 River 162 0.759259 0.428859 0 1 Sea 162 0.234568 0.425042 0 1 Hub roman road 162 0.351852 0.479029 0 1 Roman road 162 0.234568 0.425042 0 1 Soil quality 162 0.724261 0.227047 0.117 0.999 Elevation 162 123.8148 168.0637 0 934 Population (logged) 162 2.164298 1.32459 -0.69315 5.010635 Capital 162 0.12963 0.336937 0 1 Parliament 162 0.345679 0.477064 0 1 Bishop 162 0.462963 0.500173 0 1 Archbishop 162 0.135803 0.343641 0 1 University 162 0.092593 0.29076 0 1

15
4. Empirical analysis
4.1 Ordinary Least Square (OLS) estimates
Table 2 reports the baseline results of the mortality rates of the Black Death. We begin by
considering the autonomy of a city as our variable of interest. To provide a benchmark, at first,
the only control introduced is country fixed effect in medieval times, which eliminates the
spatial correlations in column (1), before controlling for other covariates. The coefficient for
the autonomy of a city is negative and significant (Table 2, column (1)). City autonomy is
strongly related to lower Black Death mortality. Geographic, social, and political controls were
gradually added in columns (2) to (7). The result of adding these controls does not undermine
the significance of the coefficient for city autonomy. Once factors such as the size of the city,
its accessibility, the agricultural potential of surrounding areas, and its position in the political
and/or ecclesiastical hierarchy are controlled for, city autonomy remains a strong factor
connected to lower mortality rates during the Black Death. As column (7) suggests, being an
autonomous city could have reduced the mortality associated with the plague by 5.22 percent
on average, compared to non-autonomous cities.
When it comes to geographic factors, elevation is significantly linked to lower Black Death
mortality rates (column 2). Cities located at high altitudes are frequently less accessible and
have less convenient transportation than cities located along trade roads or at crossroads. This
is crucial for preventing the spread of a pandemic, as the cost of exchanging goods and trade
is higher and this limits the influx of travellers who may bring the disease in their carts. A lower
accessibility to other cities may have become an advantage during the Black Death and
elevation may have provided natural protection against the spread of the disease. Soil quality
is positively related to mortality in some of the regressions (Columns (5) - (7)), meaning that
areas with fertile land and markets for agricultural produce were more exposed to the plague
(Heinonen-Tanski & van Wijk-Sijbesma, 2005). Other geographic factors, such as being a port
or trade centre, do not appear connected with Black Death mortality during the first outbreak.
This is consistent with Christakos et al.’s (2005). However, it is worth noting that, according
to some authors (e.g., Yue et al., 2017), ports and trade centres remained more vulnerable to
the plague.

16
Table 2: City autonomy and mortality rate of the Black Death
Black death mortality rate (percent, 1347-1352) VARIABLES (1) (2) (3) (4) (5) (6) (7) Autonomous city -6.187** -6.278*** -4.598*** -4.526*** -4.855*** -5.200*** -5.222***
(2.334) (1.254) (0.799) (0.732) (0.832) (0.662) (0.652) River -2.318 -1.289 -1.292 -1.178 -1.252 -1.277
(3.236) (3.391) (3.409) (3.181) (3.043) (3.088) Sea -0.600 0.844 1.019 1.357 1.378 1.380
(3.048) (2.647) (2.907) (2.592) (2.574) (2.603) Hub roman road -3.512 -2.001 -2.035 -1.794 -2.561 -2.563
(2.019) (2.078) (2.030) (2.061) (2.929) (2.943) Roman road -0.414 -0.282 -0.289 0.0860 0.0122 0.0563
(2.137) (2.155) (2.139) (1.920) (2.205) (2.147) Soil quality 8.312 8.952 8.924 10.25** 10.92* 10.95*
(6.079) (5.795) (5.765) (4.419) (5.456) (5.448) Elevation -2.157** -2.456*** -2.405** -2.293** -2.257** -2.254**
(0.751) (0.786) (0.944) (0.777) (0.868) (0.874) Population -2.463*** -2.401*** -2.292*** -2.416*** -2.427***
(0.394) (0.503) (0.441) (0.362) (0.393) Capital -0.763 -0.613 -0.928 -0.897
(3.393) (3.689) (4.124) (4.176) Parliament 3.308 3.191 3.222
(4.850) (4.336) (4.191) Bishop 1.609 1.586
(2.015) (1.968) Archbishop 2.959 2.982
(4.865) (4.921) University 0.386
(2.688) Country FE Yes Yes Yes Yes Yes Yes Yes Observations 162 162 162 162 162 162 162 R-squared 0.276 0.336 0.366 0.367 0.371 0.374 0.374
Robust standard errors adjusted for clustering at the country level are given in parentheses *** p<0.01, ** p<0.05, * p<0.1
Columns (3) - (7) of Table 2 consider social and political factors. Column (3) shows that the
population size is both significantly and negatively related to mortality rates. This implies that
larger cities were, in contrast to expectations, less affected by high reported mortality rates
statistically. This is in line with Roosen (2017: 45-47), who using the Hainaut mortmain
accounts, rejected the previous widespread belief of an urban/rural divide in the incidence rates
of the plague. Our results support Roosen's (2018) view that rural areas did not fare better
during the Black Death. Carozzi et al. (2020) also report similar results during the COVID-19
pandemic, when checking the interactions between urban density and the severity of COVID-
19. Larger cities were often the seats of power and may have had better resources to combat

17
the consequences of the plague. Nevertheless, we find no association whatsoever between a
raft of political and religious factors and the incidences of the Black Death (Table 2, columns
(4) to (7)). While some institutionalists have argued that an active parliament is another key
element behind Europe’s rise (De Long & Shleifer, 1993; North & Weingast, 1989), we find
no evidence that hosting a parliament provided any protection against the spread of the Black
Death, once city autonomy has controlled for. Similar results emerge in the case of universities
(Table 2, column (7)). The fact that universities at the time were mostly concerned with
teaching theology and philosophy, rather than science and medicine, may help to explain this
result.
Table 3: City autonomy and Black Death duration
Duration of Black Death (month, 1347-1352) VARIABLES (1) (2) (3) (4) (5) (6) (7) Autonomous city -0.0509 0.00730 -0.257 -0.314 -0.343 -0.384 -0.392
(0.427) (0.635) (0.690) (0.676) (0.681) (0.660) (0.669) River 0.104 0.0221 -0.0309 0.00423 -0.0151 -0.0307
(0.836) (0.803) (0.771) (0.765) (0.770) (0.757) Sea 0.136 -0.0513 -0.208 -0.160 -0.112 -0.114
(0.827) (0.807) (0.769) (0.775) (0.692) (0.690) Hub roman road 0.813 0.615 0.647 0.644 0.387 0.391
(0.768) (0.751) (0.756) (0.773) (0.918) (0.925) Roman road -0.000975 0.0141 0.0104 0.0341 0.146 0.174
(0.362) (0.356) (0.358) (0.361) (0.180) (0.147) Soil quality 0.677 -0.128 0.00167 0.259 0.502 0.559
(1.049) (1.356) (1.257) (1.148) (1.442) (1.414) Elevation 0.0746 0.0962 0.0415 0.0562 0.0912 0.0906
(0.112) (0.0929) (0.101) (0.0836) (0.0615) (0.0633) Population 0.433* 0.374 0.395 0.313 0.297
(0.199) (0.210) (0.225) (0.172) (0.177) Capital 0.559 0.539 0.303 0.333
(0.339) (0.325) (0.371) (0.399) Parliament 0.388 0.331 0.353
(0.423) (0.293) (0.301) Bishop 0.324 0.306
(0.596) (0.606) Archbishop 1.439* 1.443*
(0.747) (0.764) University 0.168
(0.354) Country FE Yes Yes Yes Yes Yes Yes Yes Observations 83 83 83 83 83 83 83 R-squared 0.107 0.152 0.193 0.199 0.204 0.249 0.250
Robust standard errors adjusted for clustering at the country level are given in parentheses *** p<0.01, ** p<0.05, * p<0.1

18
In Table 3, we estimate the factors that may be connected to the duration of the Black Death
pandemic in different cities. In this case the information available is limited to 83 out of the
162 cities included in the original analysis. Here, virtually none of our variables are linked to
how long the city was affected by the Black Death, implying that the duration of the pandemic
in each city was relatively random. With the exception of the presence of an archbishopric,
none of the variables are significant. The negative sign for city autonomy points to a potential
reduction in the duration of the Black Death, but the coefficients of the OLS results are not
significant at any level. Interestingly, in Christakos et al.'s (2005) research, there is a positive
correlation between city size and the duration of an epidemic, which contradicts our findings.
In Table 3A (in appendix), we find that a positive relationship between urban population size
and the duration only exists when the regression is estimated without country FE or other
controls (shown in column (1) of Table A1). Thus, the positive relationship between population
and duration is likely to be biased and influenced by other characteristics of cities.
4.2 Two-Stage least squares (2SLS) estimates
Our variable of interest, whether a city was autonomous or not, is likely to be associated with
a myriad of factors. Although we have already controlled for many possible confounding ones,
the problem of omitted variables may remain. To tackle this challenge, we adopt a strategy
introduced by Persson and Tabellini (2009) and Acemoglu et al. (2014) in their analysis of
democratic transitions of countries. We instrument city autonomy with the proportion of other
cities with an urban autonomy status in the same region, leaving out the observation of the city
concerned. The regional polygon data represents a second-level administrative division of
Europe in the 14th century, which is the most precise regional level data available4. Transitions
into or out of autonomous cities occur in regional waves that reflect learning and spillover
effects in neighbouring localities and create a power vacuum at the regional level of
government. This variable meets the exclusion restriction that is conditional for other
covariates and country fixed effects, as we assume that regional waves of the autonomous
transitioning of political institutions could have influenced the impact of the Black Death. As
a result, the potential influence of omitted variable bias on the regression coefficients is largely
minimized.
4 Both the regional definition and data are provided by Nussli (2011) (http://www.euratlas.com/about.html).

19
Specifically, we posit that a city’s autonomous status, c, was influenced by the degree of
autonomy of neighbouring cities. Therefore, we consider 4* as the geographic region where a
city is located. The regional influence that city c experienced to become autonomous is defined
by:
5* = {1+: 1+ ≠ 1, 4*! = 4*} (2)
3* = #|-"|∑ ∈ 5**! (3)
The 2SLS estimates are shown in Table 4. The instrument, city autonomy in the region, is
always significant, both in the first stage and in the reduced form regression (F-statistics for
the excluded instrument range from 13.6–22.4). Specifically, column (1) in Table 4 shows that
city autonomy itself has a significant impact on Black Death mortality rates when country fixed
effects are introduced. Adding additional controls slightly decreases the magnitude of the
coefficient, but the causal relationship between the autonomy of a city and lower Black Death
mortality rates remains strong and highly statistically significant (columns (2) to (7)). The
instrumented coefficient for city autonomy is larger than the OLS estimate, indicating that the
Black Death mortality rate was 9.29 percent lower in cities with a substantial degree of self-
rule. This suggests that the OLS result underestimates the effect of the city autonomy on the
incidence of the pandemic. Overall, our 2SLS results are consistent with the OLS results and
demonstrate that autonomous cities performed much better than their more centrally governed
counterparts in their tackling of the pandemic.

20
Table 4: City autonomy and mortality rate of the Black Death, 2SLS results
Black death mortality rate (percent, 1347-1352) VARIABLES (1) (2) (3) (4) (5) (6) (7) Autonomous city -11.6243*** -8.7177*** -8.7944*** -8.5551*** -9.1506*** -9.2885*** -9.2885***
(3.9847) (2.5383) (2.9166) (3.0114) (2.8389) (3.0135) (3.0135) River -0.6611 -0.6510 -0.6106 -0.6906 -0.7322 -0.7322
(3.0064) (2.8405) (2.8393) (2.6348) (2.6109) (2.6109) Sea -1.6484 -1.6362 -1.4121 -2.3933 -2.3943 -2.3943
(1.9530) (1.8157) (1.7387) (2.7338) (2.7331) (2.7331) Hub roman road 0.6220 0.5831 1.0443 1.0072 1.0036 1.0036
(2.3518) (2.6566) (2.3103) (2.2972) (2.3191) (2.3191) Roman road 0.8159 0.8337 1.1092 0.9173 1.0331 1.0331
(2.2049) (1.8990) (2.1177) (2.4616) (2.4622) (2.4622) Soil quality 10.5854* 10.6156* 11.9200** 12.7423** 12.8609** 12.8609**
(5.9784) (5.7034) (5.0321) (6.0030) (6.0658) (6.0658) Elevation -2.4543*** -2.4647*** -2.3248*** -2.3101*** -2.3040*** -2.3040***
(0.6937) (0.8373) (0.6818) (0.7375) (0.7438) (0.7438) Population -2.0836*** -2.0906*** -2.0090*** -2.1514*** -2.1693*** -2.1693***
(0.6879) (0.6859) (0.5735) (0.4250) (0.4112) (0.4112) Capital 0.1556 0.1975 -0.0848 0.0019 0.0019
(3.3322) (3.2087) (3.4935) (3.4933) (3.4933) Parliament 3.8850 3.6355 3.7141 3.7141
(3.5677) (3.0940) (2.9035) (2.9035) Bishop 2.5127 2.4841 2.4841
(2.0286) (1.9889) (1.9889) Archbishop 3.4961 3.5582 3.5582
(4.6012) (4.6684) (4.6684) University 0.8283 0.8283
(1.8221) (1.8221) Country FE Yes Yes Yes Yes Yes Yes Yes Observations 162 162 162 162 162 162 162 R-squared 0.2519 0.3549 0.3545 0.3622 0.3644 0.3639 0.3639 First stage F 22.4 15.5 13.5 13 19 21.2 21.2
Robust standard errors adjusted for clustering at the country level are given in parentheses *** p<0.01, ** p<0.05, * p<0.1
4.3 Placebo tests and robustness checks
4.3.1 Placebo tests
So far, we have established that city autonomy in medieval times was an institution that helped
protect cities from the devastation of the Black Death. However, it is worth noting that dealing
with any type of data referring to medieval times involves a certain degree of uncertainty.
Although the data we use are the best available from a comparative perspective, the mortality
rate and duration of the Black Death may have been underestimated.5 For example, Roosen
5 We are grateful for reviewers’ kind reminders on the possible flaws in the data quality of the Black Death.

21
(2017) considers that the data by Christakos et al. (2005) for the case of Belgium may have
incurred in some errors during the process of extrapolation. This may challenge Christakos et
al.'s (2005) argument that cities in Belgium had the lowest mortality rates in the early stages of
the Black Death. As both of our mortality and duration data for the Black Death is extracted
from Christakos et al (2005), our estimates may also be affected by potential inaccuracies in
the data. To address concerns that our baseline results are not related to potential estimation
errors of historical data, we resort to Monte Carlo simulations to conduct a series of placebo
tests.
In the first set of Monte Carlo simulation trials, we compare the estimated effects with the
distribution of placebo treatment effects when the mortality rates of cities were randomly
assigned. Specifically, we randomly scramble the mortality rates of the 162 cities included in
the sample. We then estimate placebo treatment effects according to both OLS and 2SLS
models in the baseline analysis. Figures 4(a) and 4(b) plot the distribution of t-statistics from
the placebo treatment effects, after running the regressions 5,000 times. The vertical lines mark
the location of the t-statistics of the actual treatment effect. Among the 5,000 trials, we find
that cases in which the corresponding t value exceeds the baseline OLS and 2SLS results are
relatively few. The share of the placebo t-statistics that is larger than the actual statistic (P
(t<=T)) can be interpreted as analogous to a p-value. It represents the probability that a
randomly assigned mortality rate will present an effect at the same or higher level of
significance than the actual mortality rate. Our results show that both P(t<=T) for OLS and
2SLS are smaller than 0.001. These results are also supported by Figures 4(a) and 4(b).
Consequently, we can safely reject the null that our result is indifferent to the placebo treatment
effects at all significance levels.

22
Figure 4: The distribution of t-statistics from randomly assigned mortality placebo tests
(a) (b)
Another potential concern is that the same systematic data bias may also exist in our treatment
variable: city autonomy. To address this concern, we verify our baseline results by randomly
allocating the autonomous cities following the same approach. The simulations show that our
baseline results are stable as well (Figure 5) and that P(t<=T) for both OLS and 2SLS are
smaller than 0.001. This implies that our causal results are extremely unlikely to be caused by
systematic data errors.
Figure 5: The distribution of t-statistics from randomly assigned autonomous city
placebo tests
(a) (b)
However, it should be noted that even if no systematic errors in the data are detected, this does
not imply that the results of the baseline estimations are completely robust. It is common in

23
historical data that some records of observations may deviate from reality. To address this
concern, we conduct a second set of placebo tests. The logic behind this set of tests is to
randomly select a proportion of observations (i.e., 20 or 30 percent) in the sample and alter the
mortality data by a certain percentage (i.e., 1 - 20 percent). In practice, we first randomly select
one-third of observations and modify their value by a certain percentage. For instance, if we
hypothesize that one-third of the observations have a 5 percent measurement error, the
alteration (or perturbation) level is set at 5 percent. In this case, if a region’s reported mortality
rate is 10 percent, once being selected, its mortality rate would increase to 15 percent. Second
and to get the distribution of the random events, we perform Monte Carlo simulations, running
the regressions 5,000 times. Executing this trial helps us examine the distribution of t-statistics
by randomly altering the mortality rate by different percentages then. We can test how robust
our results are in the case where there is a certain degree of errors in the mortality data. If
manipulating the mortality rate by a small range (i.e., 1-3 percent) makes our results
insignificant, it means that the estimations are fragile and possibly affected by inaccuracies in
the mortality data. In Figures 6(a)-(d) we report the results of randomly altering one third of
reported mortality rates by 5 - 20 percent, respectively.
Figures 6(a) - (c) confirm that our baseline estimates are firmly robust when altering one third
of the mortality data randomly by between 5 and 15 percent. The mean results of a random
perturbation on morality by 5 and 10 percent are both greater than 2.5 (Figures 6(a) - (b)). As
Figure 6(c) shows, the mean of the distribution of t-value is greater than 2 even after changing
the mortality rate by 15 percent. According to the simulations, our results will only become
invalid when the mortality data is manipulated by 20 percent. Figure 6(d) shows, the average
of the distribution of the t-value is 1.63 when altering city mortality by 20 percent. However,
it is unlikely that the mortality data for one-third of the cities included in the sample have errors
greater than 20 percent, given the mean and standard deviation of mortality in the Black Death.
Therefore, this second set of placebo tests further confirms that our results are reliable.

24
Figure 6: Distribution of t-statistics by randomly assigned mortality by certain percentage-points in one third of cities
(a) (b)
(c) (d)
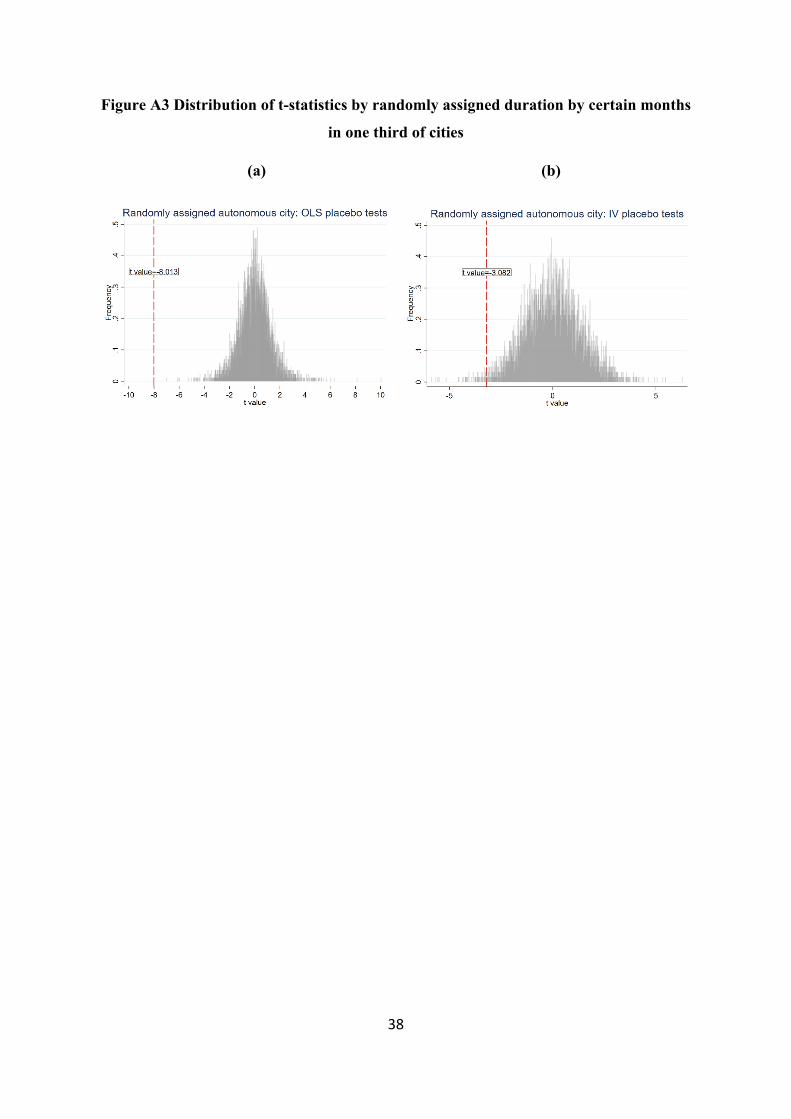
Similar experiments on the relationship between local institutions and the duration of the Black
Death are conducted in Figure A3 (in appendix), and we have also found that our baseline
results are credible.
4.3.2 Robustness checks
Concerns that our baseline results could be driven by bias and errors may not be fully solved
by the above placebo tests. To further verify our results, we implement several robustness
checks to resolve the concerns from the perspective of data measurement, sample selection,
and model design.

25
Firstly, there are two slightly different criteria being used currently to measure autonomous
cities. Our current measurement of city autonomy so far employed was collected by Bosker et
al. (2013). In this study, cities were considered as autonomous if there was an indication of the
presence of a local urban participative organization that made decisions about local urban
affairs. Stasavage (2014) provides an alternative indicator, using a more restrictive definition
of autonomy than Bosker et al. (2013). Therefore, the concern is that our significant results
could be false when we use a more stringent definition of urban autonomy.
Table 5: Robustness check of the measure of city autonomy
Black death mortality rate (percent, 1347-1352)
VARIABLES (1)
OLS (2)
OLS (3)
OLS (4)
2SLS (5)
2SLS (6)
2SLS Autonomous city -5.0368** -4.4568*** -4.0081*** -13.8824** -14.9301*** -10.1545***
(1.8674) (1.1838) (0.5651) (6.5676) (4.6051) (2.2042) River -2.7820 -1.3861 -0.8676 -0.4797
(3.5536) (3.3497) (2.4577) (2.7031) Sea -0.7974 1.4926 -1.2613 0.9239
(3.0169) (2.4686) (2.9523) (2.3525) Hub roman road -3.8534* -2.5212 -2.4176 -2.1250
(1.9946) (2.9784) (2.3392) (3.0228) Roman road -0.8405 -0.1232 2.4302** 1.5250
(2.2279) (2.0609) (1.2269) (1.9406) Soil quality 6.6294 9.7097 9.2953 11.5606*
(6.6541) (5.8718) (6.2422) (6.0379) Elevation -2.0814** -2.1896** -2.0711*** -2.1908***
(0.7457) (0.8573) (0.6795) (0.7413) Population -2.6179*** -2.4033***
(0.4469) (0.3509) Capital -1.4888 -0.6256
(4.0361) (3.7141) Parliament 3.2076 4.1530
(4.2674) (3.0223) Bishop 1.2892 2.6042
(2.0680) (1.9680) Archbishop 2.6840 3.3629
(5.1796) (4.8453) University -0.2098 -0.2512
(2.9098) (1.4790) Country FE Yes Yes Yes Yes Yes Yes Observations 162 162 162 162 162 162 R-squared 0.2666 0.3228 0.3687 0.1991 0.2377 0.3420 First stage F 49.8 21.2 12.8
Robust standard errors adjusted for clustering at the country level are given in parentheses *** p<0.01, ** p<0.05, * p<0.1

26
To relieve this concern, Table 5 replicates both OLS and 2SLS estimates of Tables 3 and 4 by
replacing the variable of interest, autonomous city, with Stasavage’s (2014) indicator. The
estimated coefficient of city autonomy remains negative and significant across all different
OLS and 2SLS specifications. The magnitude of the 2SLS coefficient of the autonomous city
is larger when using Stasavage's (2014) measure. The coefficients for the control variables, by
and large, do not change.
Table 6: Robustness check of ruling out small cities
Black death mortality rate (percent, 1347-1352) (1) (2) (3) (4) (5) (6) VARIABLES OLS OLS OLS 2SLS 2SLS 2SLS Autonomous city -6.2666** -6.6982*** -6.3029*** -16.6175*** -8.5776*** -6.0257**
(2.3523) (1.1259) (0.9851) (4.4059) (2.8146) (2.5797) River -1.9550 -1.6520 -1.6823 -1.6831
(3.2170) (2.7570) (2.7615) (2.4933) Sea 0.2185 1.7892 0.2212 1.8130
(3.3485) (2.8923) (3.0228) (2.5112) Hub roman road -2.0202 -2.1487 -1.7699 -2.1601
(2.2691) (3.2965) (1.9251) (2.7654) Roman road 1.8357 2.0992 2.3957* 2.0340
(1.6431) (1.8190) (1.3589) (1.7586) Soil quality 9.7289* 14.0955** 10.6314** 13.9735***
(4.7881) (4.7473) (5.1689) (5.0634) Elevation -2.3483** -2.3186** -2.3446*** -2.3157***
(0.8621) (1.0307) (0.7624) (0.8871) Population -2.7916*** -2.8095***
(0.4833) (0.3871) Capital -0.7178 -0.7800
(4.4259) (3.6542) Parliament 2.4999 2.4787
(3.1898) (2.7262) Bishop 2.2978 2.2346
(2.2088) (2.1071) Archbishop 4.2004 4.1609
(4.8487) (4.6225) University 1.1840 1.1618
(2.7566) (2.5823) Country FE Yes Yes Yes Yes Yes Yes Observations 148 148 148 148 148 148 R-squared 0.2661 0.3359 0.3663 0.0304 0.3335 0.3663 First stage F 76.3 55.6 38.5 Robust standard errors adjusted for clustering at the country level are given in parentheses *** p<0.01, ** p<0.05, * p<0.1

27
The second issue is that the population dataset from Bairoch (1988) only includes cities with
more than 1,000 inhabitants. For 14 cities, which were smaller than 1,000 inhabitants, we relied
on the population information provided by Christakos et al. (2005). There might be a concern
that our results are driven by the inclusion of these small cities. By ruling out cities that were
not included in Bairoch’s (1988) urban population records, Table 6 shows that excluding these
cities which were less than 1000 people indeed reduces the magnitude of our coefficients. The
coefficient of 2SLS estimation decrease from 9.29 to 6.03. However, the negative relationship
between the city autonomy and Black Death mortality rates still holds and the results are not
biased towards small cities.
Furthermore, it is also possible that our findings are affected by a lack of weather data from the
medieval era. For example, by drawing on the case of Azerbaijan, Morris et al. (2013) find the
climate and plagues are likely to be historically related. To reduce this concern, we replace the
contemporary country fixed effect with the historical sovereign state fixed effect. Compared to
modern European countries, there are more sovereign states in the Middle Ages. Thus,
replacing the current country fixed effect with the historical spatial fixed effects could help us
better control for weather-related effects . Table 7 shows that, although the magnitude of our
variable of interest has decreased to some extent, the results are still valid when using historical
boundaries as the fixed effect.
In addition to the impact of weather, the specific season of the initial plague outbreak may also
affect our estimates. We have further collected the data related to the starting dates of plague
released by Christakos et al. (2005). In Table A1, we find that the reported mortality rates in
cities where the plague hit dropped significantly in the summer, when compared with rates in
the spring. More importantly, adding the season dummies confirms our 2SLS results and
further enlarges the magnitude of the coefficient of autonomous cites by more than 7 percent
compared to 2SLS results in the baseline.

28
Table 7: Robustness check by using the boundary in the 14th century
Black death mortality rate (percent, 1347-1352) (1) (2) (3) (4) (5) (6) VARIABLES OLS OLS OLS 22SLS 2SLS 2SLS Autonomous city -4.4949** -5.2393** -3.1416* -4.7561*** -5.8014*** -3.0388*
(1.5309) (1.7070) (1.6739) (1.5933) (1.7132) (1.6875) River 0.4937 1.2626 0.5810 1.2535
(2.7741) (3.0736) (2.2722) (2.5345) Sea 1.8597 2.3713 1.9928 2.3545
(2.6710) (2.6173) (2.0731) (1.8751) Hub roman road -1.1269 0.1372 -1.0629 0.1375
(3.9400) (4.8908) (3.1202) (3.7703) Roman road -0.3340 0.3096 -0.2460 0.2988
(3.0486) (2.9872) (2.2730) (2.2049) Soil quality 13.7428 13.1637 13.8268** 13.1451*
(7.7321) (9.1442) (6.3222) (7.2614) Elevation -1.0075 -1.5040 -1.0184 -1.5022
(1.2182) (1.3416) (0.9940) (1.0673) Population -3.8821*** -3.8880***
(1.0604) (0.7493) Capital -1.0864 -1.1052
(4.3550) (3.4661) Parliament 2.1280 2.1410
(3.1664) (2.7543) Bishop 1.4125 1.3892
(2.2477) (1.7791) Archbishop 5.1373 5.1222
(5.9267) (4.5941) University -3.9977 -4.0077
(4.8697) (3.6105) Country FE Yes Yes Yes Yes Yes Yes Observations 162 162 162 162 162 162 R-squared 0.4233 0.4510 0.5162 0.4233 0.4508 0.5162 First stage F 16 16.3 15.6 Robust standard errors adjusted for clustering at the country level are given in parentheses *** p<0.01, ** p<0.05, * p<0.1
5. Conclusion
By proposing that both cities and their citizens are vulnerable to the short-term consequences
of pandemics, a number of economists have considered the variations in mortality rates from
infectious diseases to be largely random (Almond, 2006; Donaldson & Keniston, 2016). Hence,
it has often been the case that reported differences in the Black Death incidence have been
attributed mainly to chance and not to institutional or any other factors that may have
influenced the preparation and reaction of cities in medieval Europe, when confronted with a

29
plague of this dimension. However, were geographic and institutional factors really irrelevant
in determining the differential incidences of the Black Death across cities in Europe?
In this paper we have provided empirical evidence of the links between local institutions at the
time of the Black Death and the variation of the incidences of the pandemic across Western
Europe. We have shown that city autonomy was at the centre of differences in pandemic-related
mortality across cities. Comparing to their counterparts, autonomous cities performed better in
the face of one of the most devastating pandemics the Western world has ever faced.
Specifically, cities with a high degree of autonomy reduced —depending on estimations—
Black Death mortality rates by between 5.22 and 9.29 percent. A large set of placebo tests and
robustness checks confirms the robustness of this result.
City autonomy in medieval times was, moreover, a far stronger tool in mitigating the effects of
the plague than nearly all other geographical and political characteristics of cities at the time
considered. Being a capital city, hosting a parliament, or having a bishop or an archbishop at
the beginning of the 14th century did not reduce the incidence of the plague. In other words,
among various political factors at the time, only city autonomy and the powers it granted local
citizens have provided some protection against the deadliest of pandemics. In our analysis, we
also find that larger cities performed better when confronting the pandemics in the case of
Black Death. Finally, the elevation of the city was the only physical geographic factor linked
to a lower Black Death mortality rate.
While city autonomy influenced reported mortality rates, it did not affect the lengths of the
pandemic in different cities. None of the other controls were connected to a reduction in the
duration of the Black Death wave in a given city. Hence, it seems that the factors behind the
duration of the pandemic in different cities are relatively random in contrast to the mortality
rate results.
There are, of course, several limitations to the research presented here. Firstly, in this paper,
we refer to the autonomous city as if autonomy is a binary indicator. However, in practice, it
is important to realize that the situations were far more complex. As Stasavage (2014) argues,
autonomy was certainly a question of degree. Cities like Venice had complete autonomy over
almost all government affairs. In contrast, cities like Ghent enjoyed a substantial degree of
autonomy over certain types of affairs, but were still subject to princely intervention. However,
due to the limited number of historical records, the full extent of the influence of a city’s
autonomy on the pandemic cannot yet be analysed. The second problem is understanding the
30
mechanisms through which an autonomous institution helped limit the incidence rates of the
Black Death. Further research is needed in this respect. Thirdly, due to data limitations, we
only focus our research on the interaction between local institutions and the initial outbreak of
the plague. It should be noted that the plague did not end in 1352 and that numerous European
cities had recurrent outbreaks in the following decades and centuries. Studying the influence
of city autonomy across recurrent outbreaks and the overall impact of the Black Death over
time would be very interesting, but requires a substantial improvement in data availability.
This paper suggests, in line with Rodríguez-Pose and Burlina (2021), that good local
government institutions play an essential role in a pandemic, even in medieval times when the
objective conditions to fight disease were far weaker than today. When confronted with the
challenge of what is possibly the worst pandemic ever recorded, autonomous city governments
were more effective in adopting better prevention measures. Thus, improving the quality of
local institutions can be a good way of fighting pandemics. It helped self-governing cities in
medieval Europe and it could also deliver better results today.

31
References
Acemoglu, D., Johnson, S., & Robinson, J. (2005). The rise of Europe: Atlantic trade, institutional change, and economic growth. American economic review, 95(3), 546-579.
Acemoglu, D., Naidu, S., Restrepo, P., & Robinson, J. A. (2019). Democracy does cause growth. Journal of Political Economy, 127(1), 47-100.
Alfani, G., & Murphy, T. E. (2017). Plague and lethal epidemics in the pre-industrial world. the
Journal of Economic History, 77(1), 314-343.
Almond, D. (2006). Is the 1918 influenza pandemic over? Long-term effects of in utero influenza exposure in the post-1940 US population. Journal of political Economy, 114(4), 672-712.
Alsayyad, N., & Roy, A. (2006). Medieval modernity: On citizenship and urbanism in a global era. Space & Polity, 10(1), 1-20.
Atkeson, A. (2020). What will be the economic impact of covid-19 in the us? rough estimates
of disease scenarios (No. w26867). National Bureau of Economic Research.
Bairoch, P. (1988). Cities and economic development: from the dawn of history to the present. University of Chicago Press.
Benedictow, O. J. (2004). The Black Death, 1346-1353: the complete history. Boydell & Brewer.
Belloc, M., Drago, F., & Galbiati, R. (2016). Earthquakes, religion, and transition to self-government in Italian cities. The Quarterly Journal of Economics, 131(4), 1875-1926.
Bosker, M., Buringh, E., & Van Zanden, J. L. (2013). From Baghdad to London: Unraveling urban development in Europe, the Middle East, and north Africa, 800–1800. Review of
Economics and Statistics, 95(4), 1418-1437.
Bowles, J., Hjort, J., Melvin, T., & Werker, E. (2016). Ebola, jobs and economic activity in Liberia. Journal of Epidemiology & Community Health 70(3), 271-277.
Caferro, W. (2018). Petrarch's War: Florence and the Black Death in Context. Cambridge University Press.
Cantoni, D., & Yuchtman, N. (2014). Medieval universities, legal institutions, and the commercial revolution. The Quarterly Journal of Economics, 129(2), 823-887.
Carozzi, F., Provenzano, S., & Roth, S. (2020). Urban Density and COVID-19. IZA Discussion
Paper, 13440.
Christakos, G., Olea, R. A., Serre, M. L., Wang, L. L., & Yu, H. L. (2005). Interdisciplinary
public health reasoning and epidemic modelling: the case of black death (pp. 110-14). New York: Springer.

32
CitiesX. (2018, Jan 26). Venetian Responses to Plague. [Video]. YouTube. https://www.youtube.com/watch?v=TTM-WfSBNkQ&t=2s
Clark, G. (2008). A farewell to alms: a brief economic history of the world (Vol. 25). Princeton University Press.
Cohn, Jr, S. K., & Alfani, G. (2007). Households and plague in early modern Italy. Journal of
Interdisciplinary History, 38(2), 177-205.
Cox, G. W. (2017). Political institutions, economic liberty, and the great divergence. The
Journal of Economic History, 77(3), 724-755.
Curtis, D. R., & Roosen, J. (2017). The sex‐selective impact of the Black Death and recurring plagues in the Southern Netherlands, 1349–1450. American Journal of Physical Anthropology, 164(2), 246-259.
De Long, J. B., & Shleifer, A. (1993). Princes and merchants: European city growth before the industrial revolution. The Journal of Law and Economics, 36(2), 671-702.
Demeure, C. E., Dussurget, O., Fiol, G. M., Le Guern, A. S., Savin, C., & Pizarro-Cerdá, J. (2019). Yersinia pestis and plague: an updated view on evolution, virulence determinants, immune subversion, vaccination, and diagnostics. Genes & Immunity, 20(5), 357-370.
DeWitte, S. N., & Wood, J. W. (2008). Selectivity of Black Death mortality with respect to preexisting health. Proceedings of the National Academy of Sciences, 105(5), 1436-1441.
DeWitte, S. N., & Hughes-Morey, G. (2012). Stature and frailty during the Black Death: the effect of stature on risks of epidemic mortality in London, AD 1348–1350. Journal of
Archaeological Science, 39(5), 1412-1419.
DeWitte, S. N. (2015). Setting the stage for medieval plague: Pre‐black death trends in survival and mortality. American Journal of Physical Anthropology, 158(3), 441-451.
Desjardins, M. R., Hohl, A., & Delmelle, E. M. (2020). Rapid surveillance of COVID-19 in the United States using a prospective space-time scan statistic: Detecting and evaluating emerging clusters. Applied Geography, 102202.
Diamond, J. (2013). Guns, germs and steel: a short history of everybody for the last 13,000
years. Random House.
Dittmar, J. E., & Meisenzahl, R. R. (2020). Public goods institutions, human capital, and growth: Evidence from German history. The Review of Economic Studies, 87(2), 959-996.
Dols, M. W. (1979). The second plague pandemic and its recurrences in the Middle East: 1347-1894. Journal of the Economic and Social History of the Orient/Journal de l'Histoire
Économique et Sociale de l'Orient, 162-189.
Donaldson, D., & Keniston, D. (2016). Dynamics of a Malthusian Economy: India in the Aftermath of the 1918 Influenza. Unpublished Manuscript.

33
Earn, D. J., Ma, J., Poinar, H., Dushoff, J., & Bolker, B. M. (2020). Acceleration of plague outbreaks in the second pandemic. Proceedings of the National Academy of Sciences, 117(44), 27703-27711.
Epstein, S. R. (2000). Freedom and growth: the rise of states and markets in Europe, 1300-
1750 (Vol. 17). Routledge.
Frank, A. G. (1979). Dependent accumulation (Vol. 492). NYU Press.
Hajar, R. (2012). The air of history (part II) medicine in the Middle Ages. Heart views: the
official journal of the Gulf Heart Association, 13(4), 158.
Geltner, G. (2020). The Path to Pistoia: Urban Hygiene Before the Black Death. Past &
Present, 246(1), 3-33.
Glaeser, E. (2011). Triumph of the City. Pan.
Godde, K., Pasillas, V., & Sanchez, A. (2020). Survival analysis of the Black Death: Social inequality of women and the perils of life and death in Medieval London. American Journal of
Physical Anthropology, 173(1), 168-178.
Godde, K., & Hens, S. M. (2021). An epidemiological approach to the analysis of cribra orbitalia as an indicator of health status and mortality in medieval and post‐medieval London under a model of parasitic infection. American journal of physical anthropology, 174(4), 631-645.
Gottfried, R. S. (2010). Black death. Simon and Schuster.
Guiso, L., Sapienza, P., & Zingales, L. (2016). Long-term persistence. Journal of the European
Economic Association, 14(6), 1401-1436.
Heinonen-Tanski, H., & van Wijk-Sijbesma, C. (2005). Human excreta for plant production. Bioresource technology, 96(4), 403-411.
Herlihy, D. (1997). The Black Death and the transformation of the West. Harvard University Press.
Hohenberg, P. M., & Lees, L. H. (1995). The Making of Urban Europe, 1000–1994: With a
New Preface and a New Chapter. Harvard University Press.
Jackson, P. (2018). The Mongols and the Islamic World. Yale University Press.
Jacob, M. (2010). Long-term persistence: The free and imperial city experience in Germany. Available at SSRN 1616973.
Jarvis, A., Reuter, H. I., Nelson, A., & Guevara, E. (2008). Hole-filled SRTM for the globe Version 4. available from the CGIAR-CSI SRTM 90m Database (http://srtm. csi. cgiar.
org), 15, 25-54.
Jedwab, R., Johnson, N. D., & Koyama, M. (2019). Negative shocks and mass persecutions: evidence from the Black Death. Journal of Economic Growth, 24(4), 345-395.

34
Jedwab, R., Johnson, N. D., & Koyama, M. (2019). Pandemics, places, and populations: evidence from the Black Death.
Jones, E. (2003). The European miracle: environments, economies and geopolitics in the
history of Europe and Asia. Cambridge University Press.
McEvedy, C., & Jones, R. (1978). Atlas of world population history. Penguin Books Ltd, Harmondsworth, Middlesex, England.
Mitchell, P. D. (2015). Human parasites in medieval Europe: lifestyle, sanitation and medical treatment. Advances in parasitology, 90, 389-420.
Morris, L. R., Blackburn, J. K., Talibzade, A., Kracalik, I., Ismaylova, R., & Abdullahyev, R. (2013). Informing surveillance for the lowland plague focus in Azerbaijan using a historic dataset. Applied Geography, 45, 269-279.
Nishiura, H. (2006). Epidemiology of a primary pneumonic plague in Kantoshu, Manchuria, from 1910 to 1911: statistical analysis of individual records collected by the Japanese Empire. International journal of epidemiology, 35(4), 1059-1065.
North, D. C. (1981). Structure and change in economic history. Norton.
North, D. C., & Thomas, R. P. (1973). The rise of the western world: A new economic history. Cambridge University Press.
North, D. C., & Weingast, B. R. (1989). Constitutions and commitment: the evolution of institutions governing public choice in seventeenth-century England. The journal of economic
history, 49(4), 803-832.
Nussli, Christos, (2011). URL: http://www.euratlas.com/about.html.
North, D. C. (1978). Structure and performance: The task of economic history. Journal of
Economic literature, 16(3), 963-978.
Ormrod, M. (1996). The politics of pestilence. Government in England after the Black Death. PAUL WATKINS MEDIEVAL STUDIES, 147-181.
Palmer, R. C. (2000). English Law in the Age of the Black Death, 1348-1381: A Transformation
of Governance and Law. Univ of North Carolina Press.
Persson, T., & Tabellini, G. (2009). Democratic capital: The nexus of political and economic change. American Economic Journal: Macroeconomics, 1(2), 88-126.
Qiu, Wuqi, Cordia Chu, Ayan Mao, and Jing Wu. "The impacts on health, society, and economy of SARS and H7N9 outbreaks in China: a case comparison study." Journal of
environmental and public health 2018 (2018).
Ramankutty, N., Foley, J. A., Norman, J., & McSweeney, K. (2002). The global distribution of cultivable lands: current patterns and sensitivity to possible climate change. Global Ecology
and biogeography, 11(5), 377-392.

35
Randremanana, R., Andrianaivoarimanana, V., Nikolay, B., Ramasindrazana, B., Paireau, J., Ten Bosch, Q. A., ... & Rajerison, M. (2019). Epidemiological characteristics of an urban plague epidemic in Madagascar, August–November, 2017: an outbreak report. The Lancet
Infectious Diseases, 19(5), 537-545.
Rodríguez-Pose, A., & Burlina, C. (2021). Institutions and the uneven geography of the first wave of the Covid-19 pandemic. Journal of Regional Science, 61, 728-752.
Roosen, J. (2017). Severity and Selectivity of the Black Death and Recurring Plague in the Southern Netherlands (1349-1450). TSEG-The Low Countries Journal of Social and Economic
History, 14(4), 25-55.
Salzman, J. (2017). Drinking Water: A History (Revised Edition). Abrams.
Stasavage, D. (2014). Was Weber right? The role of urban autonomy in Europe's rise. American Political Science Review, 108(2), 337-354.
Theilmann, J., & Cate, F. (2007). A plague of plagues: The problem of plague diagnosis in medieval England. Journal of Interdisciplinary History, 37(3), 371-393.
Van Zanden, J. L., Buringh, E., & Bosker, M. (2012). The rise and decline of European parliaments, 1188–1789 1. The Economic History Review, 65(3), 835-861.
Weber, Max. (1958). The City, New York
Weil, D. N. (2010). Endemic diseases and African economic growth: Challenges and policy responses. Journal of African Economies, 19(suppl_3), iii81-iii109.
Young, A. (2005). The gift of the dying: The tragedy of AIDS and the welfare of future African generations. The Quarterly Journal of Economics, 120(2), 423-466.
Yue, R. P., Lee, H. F., & Wu, C. Y. (2017). Trade routes and plague transmission in pre-industrial Europe. Scientific reports, 7(1), 1-10.
Ziegler, P. (2013). The black death. Faber & Faber.

36
Appendix A
Figure A1: The urban population in 1300

37
Figure A2: Mortality rate and duration of the Black Death
38
Figure A3 Distribution of t-statistics by randomly assigned duration by certain months
in one third of cities
(a) (b)

39
Figure A4 Distribution of t-statistics by randomly assigned duration by certain months in one third of cities
(a) (b)
(c) (d)

40
Table A1: Robustness check by adding season of the initial outbreak
Black death mortality rate (percent, 1347-1352) (1) (2) (3) (4) (5) (6) VARIABLES OLS OLS OLS 2SLS 2SLS 2SLS Autonomous city -5.3303 -5.0968* -4.5161 -12.2863*** -13.5922* -16.7747**
(3.3068) (2.5335) (2.8691) (4.1114) (7.1185) (7.8730) Summer -7.5837** -6.1900** -6.2956** -8.0935*** -6.8651*** -7.1305***
(3.1355) (2.3664) (2.5870) (3.0189) (2.2549) (2.2924) Autumn -1.0766 -0.2566 -1.7139 -2.3161 -1.4018 -2.6956
(3.9265) (2.8164) (2.5837) (3.9219) (3.1447) (1.9727) Winter -3.3282 -4.1989 -4.6306 -3.7396 -4.7596 -5.7260
(4.5067) (4.6288) (5.2878) (3.9486) (3.9220) (4.2611) River -1.1406 -0.6715 1.1184 1.6921
(3.7896) (3.8836) (4.5414) (3.5225) Sea -1.9536 -1.5753 -1.4385 -2.9276
(4.3063) (4.6870) (4.2226) (3.5993) Hub roman road -2.3389 -1.8430 -1.5634 -1.7804
(2.8702) (3.3297) (2.7349) (3.4216) Roman road 0.4484 1.1231 2.7157 3.0008
(3.2099) (3.0513) (3.4343) (3.1639) Soil quality 7.6065 9.9916 10.8757 13.7428
(8.9627) (9.8860) (9.9293) (9.6359) Elevation -2.5756** -2.9488** -2.3935** -2.8457***
(0.9485) (1.1018) (0.9697) (1.0488) Population -1.9504 -0.6566
(1.3929) (1.4666) Capital 1.8877 5.3458
(6.6008) (3.9841) Parliament 1.2865 1.9927
(4.2621) (2.2631) Bishop 2.0795 3.1252
(1.6145) (2.3200) Archbishop 3.9595 3.8957
(4.8428) (3.7960) University -2.3045 -2.8454**
(3.7351) (1.2865) country FE Yes Yes Yes Yes Yes Yes Observations 122 122 122 122 122 122 R-squared 0.2743 0.3444 0.3684 0.2268 0.2820 0.2552 First stage F 24.5 38.8 14.7 Robust standard errors adjusted for clustering at the country level are given in parentheses *** p<0.01, ** p<0.05, * p<0.1

41
Table A2: Robustness check by adding season of the initial outbreak
Duration of Black Death (month, 1347-1352) (1) (2) (3) (4) (5) (6) VARIABLES OLS OLS OLS 2SLS 2SLS 2SLS Autonomous city -0.1688 -0.1567 -0.5133 -0.5855 -0.8549 -4.9226
(0.4140) (0.6582) (0.7395) (0.8614) (1.2105) (7.0475) Summer 0.1242 -0.0233 -0.2837 0.0991 -0.0759 -0.5450
(0.5776) (0.6414) (0.5842) (0.4428) (0.4951) (0.5671) Autumn -0.2144 -0.1140 0.0119 -0.2497 -0.1555 -0.0703
(0.2193) (0.1784) (0.3280) (0.2455) (0.1651) (0.7642) Winter 0.6553* 0.7356* 0.5649 0.6672** 0.7253** 0.4458
(0.3202) (0.3397) (0.7959) (0.3202) (0.3664) (0.9086) River 0.1598 0.1420 0.2112 0.2570
(0.8594) (0.8114) (0.7026) (0.5425) Sea 0.2301 -0.1022 0.1380 -1.5944
(0.7077) (0.7532) (0.5319) (1.4641) Hub roman road 0.9577 0.6561 0.9971 0.3855
(0.8854) (1.0943) (0.7269) (1.0730) Roman road 0.1851 0.2597 0.3867 0.9216
(0.3302) (0.2301) (0.5199) (0.9557) Soil quality 0.3021 0.3647 0.6848 2.2471
(1.1392) (0.9776) (1.3887) (3.0007) Elevation 0.1539 0.1583 0.1508* 0.0197
(0.0970) (0.1778) (0.0820) (0.3748) Population 0.2594 0.8014
(0.2584) (1.1283) Capital 0.4017 2.0896
(0.5926) (2.8899) Parliament 0.3806 0.2912
(0.2655) (0.5096) Bishop 0.0841 0.3866
(0.5320) (0.9626) Archbishop 1.1912 1.0163***
(0.8892) (0.3541) University -0.1716 -0.4659
(0.2567) (1.3095) Country FE Yes Yes Yes Yes Yes Yes Observations 76 76 76 76 76 76 R-squared 0.1262 0.1802 0.2592 0.1167 0.1566 -0.5150 First stage F 2.85 2.94 0.34 Robust standard errors adjusted for clustering at the country level are given in parentheses *** p<0.01, ** p<0.05, * p<0.1

42
Table 3A: The relationship between city size and duration
Duration of Black Death (month, 1347-1352) (1) (2) VARIABLES duration duration Population 0.340** 0.297
(0.170) (0.177) Autonomous city -0.392
(0.669) River -0.0307
(0.757) Sea -0.114
(0.690) Hub roman road 0.391
(0.925) Roman road 0.174
(0.147) Soil quality 0.559
(1.414) Elevation 0.0906
(0.0633) Capital 0.333
(0.399) Parliament 0.353
(0.301) Bishop 0.306
(0.606) Archbishop 1.443*
(0.764) University 0.168
(0.354) Country FE No Yes Observations 83 83 R-squared 0.047 0.250 Robust standard errors adjusted for clustering at the country level are given in parentheses *** p<0.01, ** p<0.05, * p<0.1

43
Appendix B
Variable descriptions and sources
Variable Description Source Outcome variables
Mortality rate mortality rate of the Black Death from 1347 to 1352
Christakos et al. (2005)
Duration duration of the Black Death from 1347 to 1352 Christakos et al.
(2005) Explanatory variables Autonomous city
whether city had institution for self-governance Bosker et al. (2013); Stasavage (2014)
River whether city is within 10km from a river Nussli (2011) Sea whether city is within 10km from a coast Nussli (2011) Hub roman road whether city locates on the hub of Roman road Bosker et al. (2013) Roman road whether city locates on a former Roman road Bosker et al. (2013)
Soil quality The probability that certain location could be cultivated
Ramankutty et al. (2002)
Elevation elevation Jarvis et al (2008)
Population (logged) urban population in 1300
Bairoch (1988); Christakos et al. (2005)
Capital whether city was a capital in 1300
McEvedy & Jones (1978).
Parliament whether city had representatives in an active parliament in 1300
(Van Zanden et al., 2012)
Bishop whether city had the presence of the bishop in 1300 Bosker et al. (2013)
Archbishop whether city had the presence of the archbishop in 1300 Bosker et al. (2013)
University whether city had the presence of the university in 1300 Bosker et al. (2013)