location factors for multinationals: which role for the skill distribution of employment? oecd –...
TRANSCRIPT

Location factors for multinationals:
Which role for the skill distribution of employment?
OECD – Directorate for Science, Technology and Industry
Elif KÖKSAL-OUDOT
Université Paris 1 Panthéon-Sorbonne CES-MATISSE

1. Introduction1.1. Topics and purposes
•Importance of human capital for innovation and economic growth since Becker (1964).
•Many endogenous growth contributions (Lucas 1988, Romer 1990, Aghion-Howitt (1992) => education as a key determinant
2

1.1. Topics and purposes
•However assessing skills goes beyond education => challenge
•Lack of internationally comparable data on labour quality
•=> 1st objective: Assessing the labour force composition by skills and by industry in OECD countries
3

1.1. Topics and purposes
•Globalisation : FDI flows into and from OECD countries
•Especially, FDI in the high technology sectors and internationalisation of R&D
•Determinants of location decisions of multinationals: what role for the skill composition of employment of the host country? => 2st objective
4

1.2. Implications
•Creating a new database: Skills by industry▫Adding a “skill” dimension to the currently
available data at industry level (extending the STructural ANalysis (STAN) Database)
•Comparing the two skill proxies▫ Occupation and education
•Analysing impact of skills on FDI location decisions
5

1.3. Outline
2. Data and descriptive results
3. Empirical estimations
4. Conclusion and further research agenda
6

2. Data & Descriptive Statistics
• OECD Skills by Industry (ANSKILL) database
• OECD Activities of Foreign Affiliates (AFA) Database
• OECD Foreign Affiliates’ Trade in Services (FATS) Database
• OECD STAN Database for Structural Analysis
7

2.1. ANSKILL
• Two proxies for skills:
8
Occupation (ISCO -88)
Skill levels Education (ISCED-97)
Legislators, senior officials, managers
HIGH SKILLED
Second stage of tertiary education
Professionals First stage of tertiary educationTechnicians, associate
professionals
Clerks
MEDIUM SKILLED
Upper secondary education
Service/sale workers
Skilled agricultural and fishery workers
Post-secondary non tertiary education
Craft and related trade workers
Plant and machine operators
LOW SKILLED
Primary education
Elementary occupations Lower secondary education

2.2. AFA and FATS
•AFA : Manufacturing sectors- Highly aggregated level of detail for industries- 16 variables (on production, employment,
employee compensation, investment, R&D…)
•FATS : Service sectors- More recent (since 1995), OECD – Eurostat
joint questionnaire- Very detailed breakdown- Less variables (mainly on turnover, value
added, employment, exports and imports)
9
2.3. STAN
•Main OECD database for industry-level time-series data
•Important country (32 member countries) and time coverage (since 1970’s).
•Many variables on production, value added employment, labour costs, exports, imports…)
10

2.2. Descriptive statistics
High skilled workers, occupation definition ,1998 and 2008
As a percentage of all employees
0
10
20
30
40
50
60
% 2008 1998
Source: OECD, ANSKILL Database, September 2011.

High skilled workers, education definition, 1998 and 2008
As a percentage of all employees
0
10
20
30
40
50
60
% 2008 1998
Source: OECD, ANSKILL Database, September 2011.

Comparative importance of occupation and educational attainment in skill assessment across countries
13
ቆNumber of the HS ሺoccupation definitionሻNumber of the HS ሺeducation definitionሻ x 100ቇ− 100

Employees in high-skill occupations as a percentage of those with at least a university degree, 2009
14
-40
-20
0
20
40
60
80
100
120
140
160
Index
Source: OECD (2010), Measuring Innovation: A New Perspective.
Growth of high skilled workers, EU, 1998-2008
-2
0
2
4
6
8
ISIC
24
ISIC
29
ISIC
33
ISIC
34
ISIC
35
To
tal m
an
ufa
ctu
rin
g
ISIC
64
ISIC
65
ISIC
67
ISIC
71
ISIC
72
ISIC
73
ISIC
74
To
tal s
erv
ice
s
To
tal e
con
om
y
%Average annual growth rate of the high skilled Average annual growth rate of employment
Source: OECD, ANSKILL Database, April 2010.

Growth of high skilled workers, United States, 1997-2007
-10
-5
0
5
10
15
ISIC
24
ISIC
29
To
tal m
an
ufa
ctu
rin
g
ISIC
33
ISIC
34
+3
5
ISIC
64
ISIC
65
+6
7
71
to 7
4
To
tal s
erv
ice
s
To
tal e
con
om
y
%Average annual growth rate of the high skilled Average annual growth rate of employment
Source: OECD, ANSKILL Database, April 2010.

Growth of high skilled workers, Canada, 1997-2007
Source: OECD, ANSKILL Database, April 2010.
0
2
4
6
8
ISIC
24
ISIC
29
to 3
3
ISIC
34
to 3
5
To
tal
ma
nu
fact
uin
g
ISIC
64
ISIC
65
to 7
1
ISIC
72
to 7
4
To
tal s
erv
ice
s
To
tal e
con
om
y
%Average annual growth rate of the high skilled Average annual growth rate of employment

Growth of high skilled workers, Japan, 2003-2008
Source: OECD, ANSKILL Database, April 2010.
-8
-6
-4
-2
0
2
4
6
8
ISIC
24
ISIC
29
ISIC
33
ISIC
34
to 3
5
To
tal m
an
ufa
ctu
rin
g
ISIC
64
ISIC
65
+6
7
ISIC
72
ISIC
73
ISIC
74
To
tal s
erv
ice
s
To
tal e
con
om
y
% Average annual growth rate of the high skilled Average annual growth rate of employment

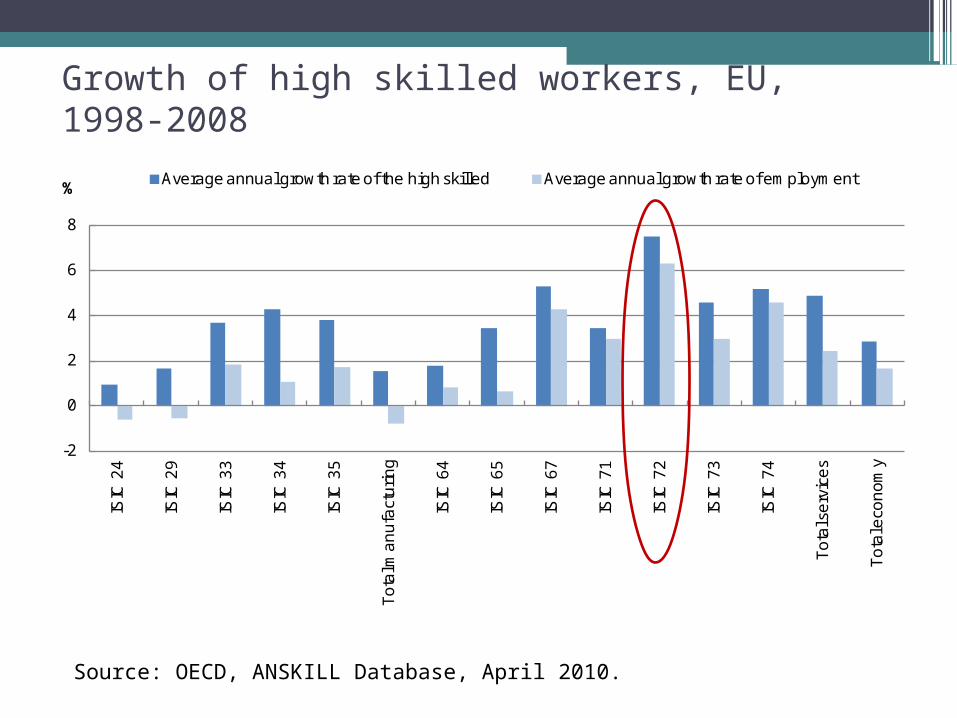
Growth of high skilled workers, EU, 1998-2008
-2
0
2
4
6
8
ISIC
24
ISIC
29
ISIC
33
ISIC
34
ISIC
35
To
tal m
an
ufa
ctu
rin
g
ISIC
64
ISIC
65
ISIC
67
ISIC
71
ISIC
72
ISIC
73
ISIC
74
To
tal s
erv
ice
s
To
tal e
con
om
y
%Average annual growth rate of the high skilled Average annual growth rate of employment
Source: OECD, ANSKILL Database, April 2010.

Growth of high skilled workers, United States, 1997-2007
-10
-5
0
5
10
15
ISIC
24
ISIC
29
To
tal m
an
ufa
ctu
rin
g
ISIC
33
ISIC
34
+3
5
ISIC
64
ISIC
65
+6
7
71
to 7
4
To
tal s
erv
ice
s
To
tal e
con
om
y
%Average annual growth rate of the high skilled Average annual growth rate of employment
Source: OECD, ANSKILL Database, April 2010.

Growth of high skilled workers, Canada, 1997-2007
Source: OECD, ANSKILL Database, April 2010.
0
2
4
6
8
ISIC
24
ISIC
29
to 3
3
ISIC
34
to 3
5
To
tal
ma
nu
fact
uin
g
ISIC
64
ISIC
65
to 7
1
ISIC
72
to 7
4
To
tal s
erv
ice
s
To
tal e
con
om
y
%Average annual growth rate of the high skilled Average annual growth rate of employment
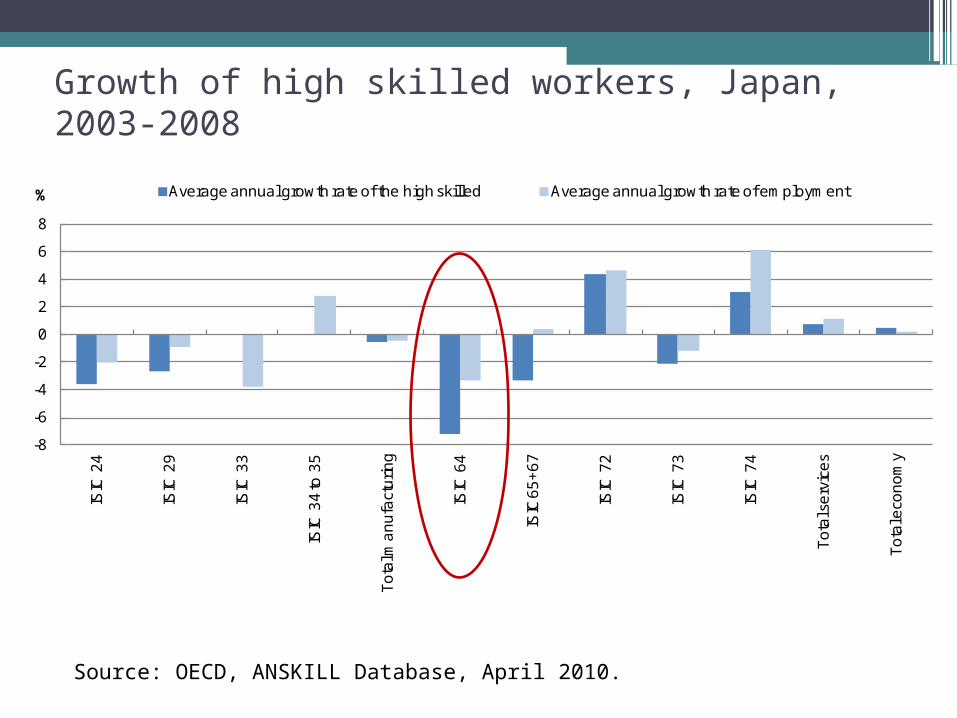
Growth of high skilled workers, Japan, 2003-2008
Source: OECD, ANSKILL Database, April 2010.
-8
-6
-4
-2
0
2
4
6
8
ISIC
24
ISIC
29
ISIC
33
ISIC
34
to 3
5
To
tal m
an
ufa
ctu
rin
g
ISIC
64
ISIC
65
+6
7
ISIC
72
ISIC
73
ISIC
74
To
tal s
erv
ice
s
To
tal e
con
om
y
% Average annual growth rate of the high skilled Average annual growth rate of employment

FDI inflows to OECD countries, as a % of GDP (2005-2008 average)
0
2
4
6
8
10
12
14
16
%
Source: OECD Economic Globalisation Indicators 2010 based on OECD, International Direct Investment and Annual National Accounts databases, June 2009.

Share of foreign-controlled affiliates in manuf. turnover and employment, 2007
Source: OECD Economic Globalisation Indicators 2010 based on OECD, International Direct Investment and Annual National Accounts databases, June 2009.
0
10
20
30
40
50
60
70
80
% Employment Turnover

Growth of foreign-controlled affiliates and national firms’ share of manufacturing VA (1999 and 2006)
Source: OECD, AFA database, December 2009.
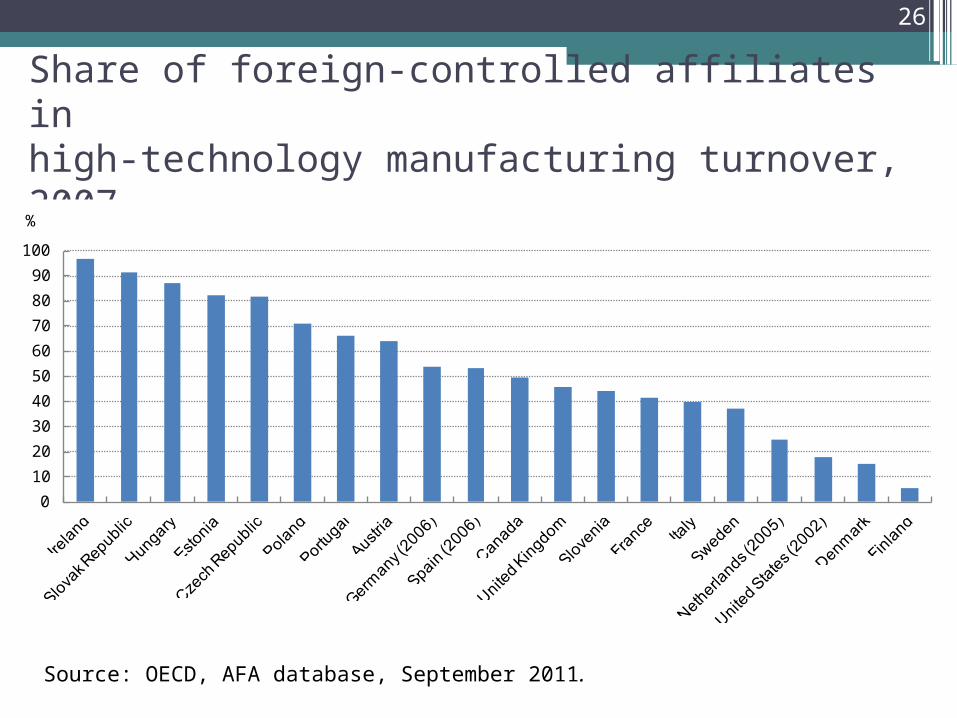
Share of foreign-controlled affiliates in high-technology manufacturing turnover, 2007
26
0
10
20
30
40
50
60
70
80
90
100
%
Source: OECD, AFA database, September 2011.

Share of foreign affiliates in the employment of the services and manufacturing sectors, 2006
27
Source: OECD, AFA and FATS databases, December 2009.
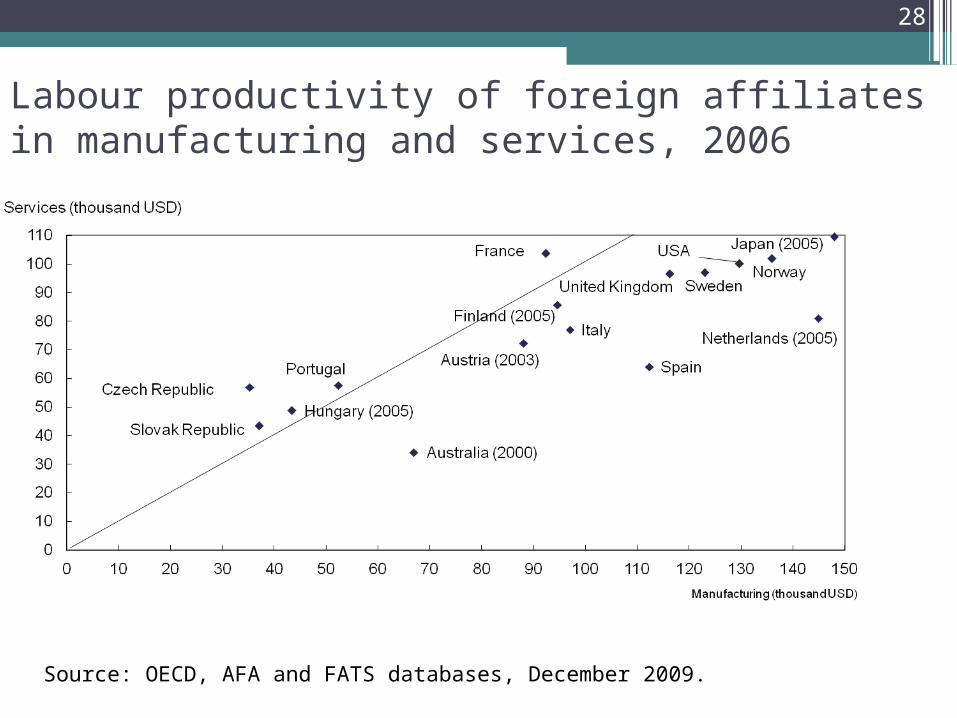
Labour productivity of foreign affiliates in manufacturing and services, 2006
28
Source: OECD, AFA and FATS databases, December 2009.
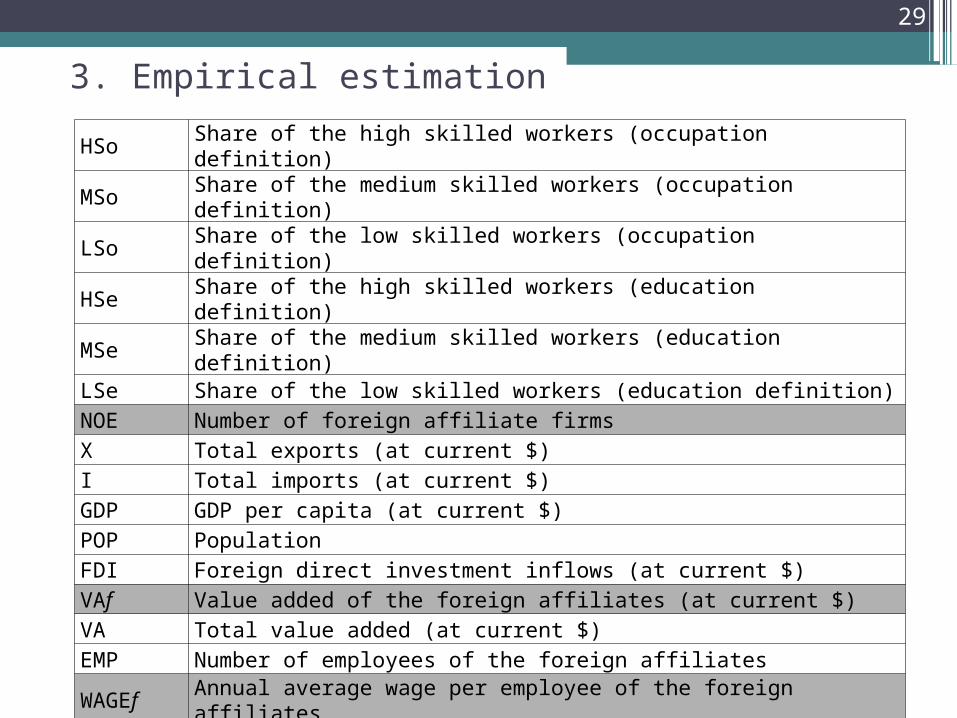
3. Empirical estimation
29
HSo Share of the high skilled workers (occupation definition)
MSo Share of the medium skilled workers (occupation definition)
LSo Share of the low skilled workers (occupation definition)
HSe Share of the high skilled workers (education definition)
MSe Share of the medium skilled workers (education definition)
LSe Share of the low skilled workers (education definition)
NOE Number of foreign affiliate firms
X Total exports (at current $)
I Total imports (at current $)
GDP GDP per capita (at current $)
POP Population
FDI Foreign direct investment inflows (at current $)
VAf Value added of the foreign affiliates (at current $)
VA Total value added (at current $)
EMP Number of employees of the foreign affiliates
WAGEf Annual average wage per employee of the foreign affiliates
WAGE Annual average wage per employee of all firms
Coop Foreign ownership of domestic inventions
RDf R&D expenditures of the foreign affiliates (at $ ppp)

3.1. Specification
30
(1)log NOEi,c,t = α0 + α1.logHSi,c,t + α2.logMSi,c,t +
α3log(X+I) / GDP)c,t + α4.log(FDI /GDP)c,t +
α5.log(VAf / VA)i,c,t + α6.log(WAGEf /
WAGE)i,c,t + α7.log(Coop / POP)c,t + i,c,t

3.1. Specification
31
(2) logVAf / EMPi,c,t = α0 + α1.logHSi,c,t +
α2.logMSi,c,t + α3log(NOE)i,c,t + α4.log(FDI /
GDP)c,t + α5.log(WAGEf / WAGE)i,c,t +
α6.log(RD)i,c,t + α7.log(Coop / POP)c,t + i,c,t

3.2. ResultsLog (NOE) estimation results with the occupation proxy
model1 model2 model3 model4 model5 model6 model7 model8
log(HSo) 0.306*** 0.317*** 0.255*** 0.241*** 0.071 0.074 0.085+ 0.040(4.054) (4.004) (3.411) (3.429) (1.310) (1.198) (1.874) (0.884)
log(LSo) 0.029(0.578)
log(MSo) -0.121* -0.037 0.066 0.033 -0.049 -0.039
(-1.999) (-0.646) (1.338) (0.608) (-0.937) (-0.740)
log((X+I)/GDP) 1.627*** 0.317* 0.179 0.488** 0.442*(14.084) (2.515) (1.278) (2.734) (2.541)
log (FDI/GDP) 0.609*** 0.422*** 0.207*** 0.033
(11.653) (10.454) (5.090) (0.715)
log (VAf / VA) 0.436*** 0.265*** 0.257***(9.144) (5.776) (5.647)
log (WAGEf/WAGE) 0.030 0.026
(0.236) (0.214)
log (Coop/POP) 0.407***(7.071)
Constant 5.022*** 5.082*** 4.833*** -2.222*** 1.300** 3.344*** 2.756 7.443***
(54.888) (35.571) (40.772) (-4.322) (2.721) (5.918) (1.476) (3.738)r2 0.016 0.016 0.018 0.116 0.250 0.448 0.253 0.304N 2874 2874 2874 2874 2873 2376 1532 1516

3.2. ResultsLog (NOE) estimation results with the education proxy
model9 model10 model11 model12 model13 model14 model15 model16
log(HSe) 0.260*** 0.192*** 0.298*** 0.268*** 0.148*** 0.148*** 0.149*** 0.071+
(4.815) (3.472) (5.889) (5.634) (3.637) (4.118) (3.548) (1.693)
log(LSe) -0.325***
(-4.494)
log(MSe) 0.259* 0.217* 0.074 -0.078 0.040 -0.056
(2.452) (2.135) (0.752) (-0.970) (0.495) (-0.758)
log((X+I)/GDP) 1.694*** 0.407*** 0.241+ 0.507** 0.490**
(14.276) (3.335) (1.809) (2.811) (2.823)
log (FDI/GDP) 0.581*** 0.404*** 0.213*** 0.015
(11.233) (10.811) (4.970) (0.271)
log (VAf / VA) 0.439*** 0.282*** 0.273***
(9.155) (5.820) (5.829)
log (WAGEf/WAGE) -0.058 -0.040
(-0.477) (-0.354)
log (Coop/POP) 0.464***
(5.804)
Constant 5.119*** 4.515*** 5.398*** -2.098*** 1.179* 3.230*** 1.717 7.025***
(52.888) (26.675) (43.990) (-3.874) (2.435) (5.662) (0.956) (3.753)
r2 0.025 0.052 0.034 0.136 0.258 0.467 0.277 0.335
N 2761 2761 2761 2761 2760 2288 1470 1453
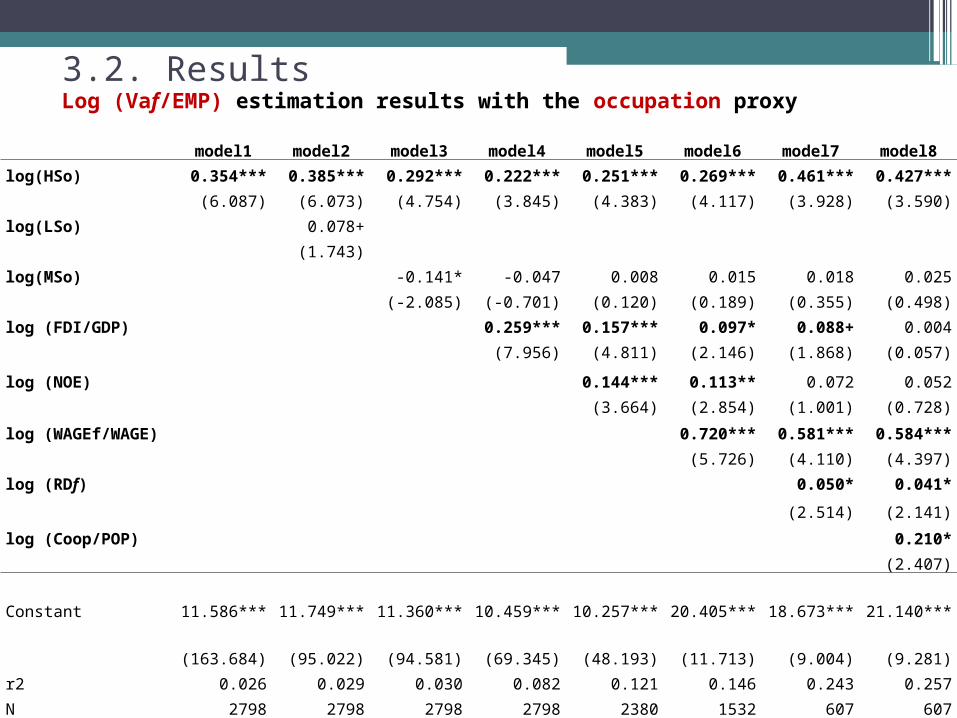
3.2. ResultsLog (Vaf/EMP) estimation results with the occupation proxy
model1 model2 model3 model4 model5 model6 model7 model8
log(HSo) 0.354*** 0.385*** 0.292*** 0.222*** 0.251*** 0.269*** 0.461*** 0.427***
(6.087) (6.073) (4.754) (3.845) (4.383) (4.117) (3.928) (3.590)
log(LSo) 0.078+
(1.743)
log(MSo) -0.141* -0.047 0.008 0.015 0.018 0.025
(-2.085) (-0.701) (0.120) (0.189) (0.355) (0.498)
log (FDI/GDP) 0.259*** 0.157*** 0.097* 0.088+ 0.004
(7.956) (4.811) (2.146) (1.868) (0.057)
log (NOE) 0.144*** 0.113** 0.072 0.052
(3.664) (2.854) (1.001) (0.728)
log (WAGEf/WAGE) 0.720*** 0.581*** 0.584***
(5.726) (4.110) (4.397)
log (RDf) 0.050* 0.041*
(2.514) (2.141)
log (Coop/POP) 0.210*
(2.407)
Constant 11.586*** 11.749*** 11.360*** 10.459*** 10.257*** 20.405*** 18.673*** 21.140***
(163.684) (95.022) (94.581) (69.345) (48.193) (11.713) (9.004) (9.281)
r2 0.026 0.029 0.030 0.082 0.121 0.146 0.243 0.257
N 2798 2798 2798 2798 2380 1532 607 607

3.2. ResultsLog (Vaf/EMP) estimation results with the education proxy
model9 model10 model11 model12 model13 model14 model15 model16
log(HSe) 0.285*** 0.230*** 0.332*** 0.275*** 0.243*** 0.283*** 0.275*** 0.254**
(6.274) (5.082) (6.635) (5.705) (5.892) (5.090) (3.391) (3.226)
log(LSe) -0.263***
(-5.605)
log(MSe) 0.388*** 0.288*** 0.419*** 0.491*** 0.293* 0.264*
(6.435) (4.645) (6.391) (4.182) (2.233) (2.352)
log (FDI/GDP) 0.230*** 0.137*** 0.081+ 0.104* 0.019
(7.137) (4.329) (1.747) (2.099) (0.282)
log (NOE) 0.127*** 0.095** 0.048 0.025
(3.409) (2.832) (0.669) (0.360)
log (WAGEf/WAGE) 0.640*** 0.497*** 0.512***
(4.302) (3.602) (3.873)
log (RDf) 0.059** 0.050*
(2.632) (2.328)
log (Coop/POP) 0.209*
(2.379)
Constant 11.688*** 11.216*** 12.112*** 11.111*** 10.908*** 20.030*** 17.724*** 20.315***
(141.112) (96.515) (104.291) (62.349) (45.149) (9.357) (8.279) (9.242)
r2 0.039 0.070 0.065 0.107 0.161 0.199 0.233 0.247
N 2722 2722 2722 2722 2292 1470 561 561

4. Conclusion and further research agenda4.1. Conclusion
• Strong relationship between the high skilled share of employment in the host country and the presence of multinational firms
• Both of the proxies => positive and significant while explaining labour productivity of foreign affiliates
• Occupations should be taken into account, together with the educational attainment for skill assessment
36

4.2. For further research agenda
• Completing data collection on industry x education matrices and extending the analysis to other OECD countries
• Robustness checks through logistic panel estimations
• Focus on the high technology industries and knowledge intensive business services in the econometrical analysis
37