long-term effects of organic and mineral fertilizer...
TRANSCRIPT

Master’s Thesis in Environmental Science Environmental Science in Europe – Master’s Programme
Examensarbeten, Institutionen för mark och miljö, SLU Uppsala 2013 2013:05
Long-term effects of organic and mineral fertilizer application on physical soil properties and maize yield in western Kenya Paulina Cebula


SLU, Swedish University of Agricultural Sciences Faculty of Natural Resources and Agricultural Sciences Department of Soil and Environment Paulina Cebula Long-term effects of organic and mineral fertilizer application on physical soil properties and maize yield in western Kenya Supervisor: Ingrid Wesström, Department of Soil and Environment, SLU Assistant supervisor: Bjarne W. Strobel, Department of Plant and Environmental Sciences, Copenhagen University & Bernard Vanlauwe, Tropical Soil Biology and Fertility Institute of the International Centre for Tropical Agriculture (TSBF-CIAT) Examiner: Abraham Joel, Department of Soil and Environment, SLU EX0431, Independent Project in Environmental Science – Master's thesis, 30 credits, Advanced level, A2E Environmental Science in Europe – Master’s Programme120 credits Series title: Examensarbeten, Institutionen för mark och miljö, SLU 2013:05 Uppsala 2013 Keywords: farm fertility gradients, aggregate stability, infiltration rate, bulk density, organic carbon Online publication: http://stud.epsilon.slu.se Cover: photo by author, 2012


Abstract
To evaluate the effects of long-term application of organic and mineral fertilizers on maize yield and soil properties and further to investigate differences in soil fertility gradients, the Tropical Soil Biology and Fertility Institute of the International Centre for Tropical Agriculture (TSBF-CIAT) conducted an 8-year experiment on 12 farms in the districts Nyalgunga, Nyabeda and Vihiga in the Western Province of Kenya. The study was designed as a split plot model where each farm was split into high and low fertility plots on which the following treatments were applied: T2 – no fertilizer application (control), T4 – application of farmyard manure (FYM) alone and T5 – combined application of FYM, Mavuno fertilizer and top dressing. In scope of this thesis the physical soil properties such as bulk density (BD), soil texture , infiltration rate (IF) and aggregate stability (AS) as well as the soil organic carbon content in the soil (OC) were determined. Further Crop Evapotranspiration (ETc) and Water use efficiency were analyzed.
The ETc, varied between 2.34 and 4.84 mm/day and was highest during the development and late stage of the growing season. The rainfall was able to cover the water crop requirements of maize in all locations. Maize yield was highest at T5, followed by T4 and T2. Further, yield was strongly affected by the clay content and soil type and resulted in significant differences between the locations (Nyalgunga > Nyabeda > Vihiga). Other physical soil parameters (IF, BD, AS) did not influenced the maize yield. IF varied between 1.3 and 9.1m/day. BD was generally low with an overall mean of 1.16 g/cm³. The Aggregate stability was widely ranged and significantly higher in Nyabeda and on T4. OC was significantly higher on T5. The results indicated that mineral fertilizers contribute more to the increase of OC than organic fertilizers and that OC might not be the main driver of aggregation in tropical soils. AS seemed to be positive affected by organic fertilizers but IF and BD were not influenced by, nether organic or inorganic fertilizers. The results did not indicate any differences between high and low fertility plots, nether in maize yield nor in any of the physical soil properties.


Table of contents
1. Introduction ...................................................................................................................................6 2. Objectives and Hypotheses ............................................................................................................8
2.1 Objective of the thesis...............................................................................................................8 2.2 Hypotheses ...............................................................................................................................8
3. Background information – Western Province of Kenya ..................................................................9
4. Materials and Methods ................................................................................................................12 4.1 Site description .......................................................................................................................12 4.2 Plot design and treatment structure........................................................................................14 4.3 Maize yield..............................................................................................................................15 4.4 Crop Evapotranspiration and Water use efficiency ..................................................................15 4.5 Infiltration rate measurement .................................................................................................17 4.6 Soil Sampling...........................................................................................................................17 4.7 Laboratory analysis .................................................................................................................18 4.8 Statistical analysis ...................................................................................................................19
5. Results..........................................................................................................................................20 5.1 Crop Evapotranspiration and Water use efficiency ..................................................................20 5.2 Maize yield..............................................................................................................................22 5.3 Soil texture..............................................................................................................................23 5.4 Infiltration rate........................................................................................................................24 5.5 Bulk density.............................................................................................................................24 5.6 Organic carbon content in soil .................................................................................................25 5.7 Aggregate stability ..................................................................................................................26
6. Discussion.....................................................................................................................................27 6.1 Crop Evapotranspiration and Water use efficiency ..................................................................27 6.2 Soil fertility gradients ..............................................................................................................27 6.3 Maize yield..............................................................................................................................28 6.4 Soil Texture and soil fertility ....................................................................................................29 6.5 Infiltration rate........................................................................................................................29 6.6 Bulk density.............................................................................................................................29 6.7 Organic carbon content in soil .................................................................................................30 6.8 Aggregate stability ..................................................................................................................30
7. Conclusion ....................................................................................................................................32 8. Acknowledgement .......................................................................................................................33 9. References....................................................................................................................................34 10. Appendices.................................................................................................................................38

List of Acronyms
AEZ Agro-ecological zone AS Aggregate stability in % by weight BD Bulk density in g/cm³ CIAT International Centre for Tropical Agriculture ETc Crop Evapotranspiration in mm/day ETo Reference Evapotranspiration in mm/day FAO Food and Agriculture Organization of the United Nations FYM Farmyard manure H Plots with high fertility level HAC High activity clay IF Infiltration rate in cm/min IR Imazapyr resistant maize ISFM Integrated soil fertility management K Potassium Kc Single crop coefficient L Plots with low fertility level LAC Low activity clay LM Local maize LR Long rainy seasons MAV Mavuno fertilizer N Nitrogen OC Organic Carbon content in soil in % by weight P Phosphorus RH Relative humidity in % SOM Soil organic matter SR Short rainy seasons SSA Sub-Saharan Africa T2 Control plot (no additional fertilizer application) T4 Plot fertilized by FYM only T5 Plot fertilized by FYM, MAV and TD TD Top dressing TSBF Tropical Soil Biology and Fertility Institute u Wind speed in m/s

6/48
1. Introduction
Soil fertility is noted as a crucial problem facing agricultural development and food security in Sub-Saharan Africa (SSA) (Sanchez 2002). The original fertile soils of the highlands of western Kenya enhanced settlement and lead to a rapid population growth in this region (Shepherd and Soule, 1998). The increase in rural population density and hence increase in land-use intensity are causing a negative nutrient balance among smallholder farms in SSA (Drechsel et al., 2001). Further, low organic matter, moisture stress and high erodibility are contributing to poor soil conditions (CIAT/TSBF/ICRAF, 2002 ).
Integrated soil fertility management (ISFM) is a holistic approach, including biological, physical, chemical, social, economical and political factors (CIAT/TSBF/ICRAF, 2002) to enhance agricultural productivity and hence to face problems related to poor soil fertility. This approach is generally accepted by development programs in SSA, and even more important, by the smallholder farmers themself (Place et al., 2003). The implementation of ISFM includes the utilization of available resources and the combination of organic and inorganic fertilizers (Vanlauwe, 2004)
Maize is an important crop in developing countries and it is expected that its demand will double by 2050 (Rosegrant et al., 2008). In Kenya, maize is accounting to approximately 35% of the consumed calories (FAOSTAT, 2010). Besides the decreasing soil fertility, the weed Striga spp and the stemborer are affecting maize production (Odendo et al., 2001). Tittonell et al. (2005) observed that the average grain production in western Kenya was as little as 1 tone per hectare and year. Further, farms with low resources endowment showed an average grain yield below annual family requirements.
A peculiarity of the soils in western Kenya is the heterogeneity in soil fertility at regional, farm and field scale. Regional differences are determined by climate and soil type while differences at farm scale have mainly socio-economic backgrounds (Tittonell et al., 2005). Zingore et al. (2007) recorded positive nutrient balances on wealthier farms due to high manure and mineral fertilizer input. Within a farm, the soil fertility is strongly affected by field utilization and distance of the field to the homestead, where closer plots are receiving more fertilizer (Vanlauwe et al., 2006 and Tittonell et al., 2005).
It is generally known that the incorporation of fertilizers is increasing yield and agricultural productivity. The combination of both, organic and mineral fertilizers is crucial as they influence different soil properties. Mineral fertilizers are characterized by a high concentration of plant available nutrients. Several studies showed a significant increase of grain yield after mineral fertilizer treatment (Pinitpaitoon et al., 2011). Drechsel et al. (2001) is claiming that fertilizer application is increasing with increasing population pressure at smallholder level. However the application rate is often insufficient due to the low availability and high cost of mineral fertilizers. Further, problems with acidification may occur after intensive addition of ammonium-based N fertilizers (Vanlauwe and Giller, 2006). On the other hand, organic amendments show a slower nutrient release pattern than mineral fertilizer but facilitate an increased soil organic matter (SOM) content (Pinitpaitoon et al., 2011). At smallholder level organic material is applied in form of farmyard manure (FYM) as it is often the only available source of organic matter (Dunjana et al., 2012). Although Vanlauwe and Giller (2006) claim that organic resources are not sufficient enough to supply crops with the required

7/48
nutrients, the increased SOM is enhancing productivity due to the improved biological activity and physical soil properties (Watson et al., 2002).
The importance of SOM to plant growth cannot be overemphasized and hence organic amendments play a significant role in agricultural production due to their positive effect on the physical soil properties, especially bulk density and aggregate stability.
Herencia et al. (2011) observed a high correlation between organic carbon (OC) content and some physical soil properties. Bulk density (BD) was decreasing with long-term application of organic fertilizers. The aggregate stability (AS) showed an increase with time on plots fertilized with organic matter. In general the increase in OC was significantly higher due to organic fertilizer than to mineral fertilizer application. Also Dunjana et al. (2012) recorded an increase of OC with increase of cattle manure application and further an increase of macro-AS. However, no significant effects on BD were recorded.
Improved AS facilitates water infiltration and hence increases the plant available water content and decreases runoff and erosion. Although there is little research on the interactions of SOM and infiltration, Franzluebbers (2002) recorded that greater SOM increased the infiltration rate by up to 27% on sandy loam soils in a humid subtropical climate.
It is widely researched that organic amendments contribute to higher OC values but the effects of mineral fertilizer on OC seem controversial. Hati et al (2007) realized a decline in OC due to 29 years of intensive cropping in all treatments, but the highest decline was at plots fertilized only by N-fertilizer. Soils fertilized by manure+NPK showed the highest OC value. Although mineral fertlilizers had no significant effect on OM, slightly increase of OM was recorded due to increased yield and biomass production (Celik et al., 2010). Rasool et al (2008) reported a higher increase of OC due to NPK application than to FYM application.
To study the divers soil fertility gradients in western Kenya, the Tropical Soil Biology and Fertility Institute of the International Centre for Tropical Agriculture (TSBF-CIAT) conducted an 8 year experiment on twelve Farms in the districts Vihiga and Siaya. Different treatment setups, including farmyard manure, Mavuno fertilizer and top dressing were applied to plots of high and low fertility. Two different maize varieties, the local variety and Imazapyr resistant maize, were planted twice a year during the short and long rainy season. The whole project had the aim to evaluate the effects of long-term fertilizer application on chemical, physical and biological soil properties, maize yield and further Striga spp. density in relation to the different soil fertility gradients in western Kenya.

8/48
2. Objectives and Hypotheses
2.1 Objective of the thesis
In the scope of this thesis physical soil properties of the topsoil such as bulk density, soil texture, infiltration rate and aggregate stability were determined. These parameters were analyzed on both, plots with high and plots with low fertility, which showed the following treatments: no fertilizer application (control), farmyard manure application alone and combined application of farmyard manure, Mavuno fertilizer and top dressing. The overall objective of this thesis was to assess how long-term organic and mineral fertilizer application was affecting the physical properties of the soil and to investigate the influence of the physical soil properties on the maize yield. Hence the maize yield harvested during the short rainy seasons (SR) was analyzed and related to the above mentioned parameters. Crop Evapotranspiration (ETc) and Water use efficiency were analyzed to exclude water deficiency as a crucial factor for the maize growth. Additional the organic carbon content was determined to investigate possible effects on the physical soil properties, especially on the AS.
2.2 Hypotheses
The hypotheses of this thesis are as followed:
Long-term mineral and organic fertilizer application has an effect on physical soil properties and organic carbon.
Physical soil properties and organic carbon do affect the maize growth and yield.
Water deficiency is not a determining factor for maize growth in the Western Province of Kenya.

9/48
Figure 2. Agro-Climatic zone Map of Kenya (Kenya Soil Survey, 1980)
Figure 1. Map of Kenya (Wikipedia, 2011), Western
Province marked in red
3. Background information – Western Province of Kenya
The experimental sites, Siaya and Vihiga are located in the Western Province of Kenya (Figure 1). Western Kenya is crossed by the equator and surrounded by Lake Victoria, Uganda and the Eastern Rift Valley. According to the agro-climatic zones (Figure 2) the Western province has a high to very high potential for plant growth with a very low risk of failure on adapted maize crops. The climate is semi-humid to humid with an average rainfall of 1000-2700 mm per year and average potential evaporation of 1200-2100 mm per year. Due to the two rainy and hence cropping seasons, the region has a high agricultural potential.

10/48
Even though the Western Province is characterized by a high agricultural potential, the increasing population density, the soil types, low soil fertility and high poverty lead to low agricultural productivity. Further, nitrogen and phosphorus are the main limiting nutrients.
The rapid population growth is a main issue in whole Kenya. The population increased by a factor of 2.5 over 30 years and amount to over 38 million people in 2009 (CountrySTAT – Kenya, 2013). The population densities in 2001 in Vihiga and Siaya were 886 and 325 persons per km2, respectively (GOK, 2005). The increase in rural population density and hence the increase in land-use intensity is causing low soil fertility. Further, due to the high population density the average farm size tends to be as small as 0.5 ha in Vihiga and 1.0 ha in Siaya (Jaetzold et al., 2005
The tropical soil can be divided into 3 groups based on their mineralogy. Almost 70% of the tropics are covert by unfertile low activity clay (LAC), soil as the red Ferralsols and Acrisols. The other two groups are the fertile, high activity clay (HAC) soils (Vertisols) and soils with amorphous or crypto-crystallized minerals as Andosols (Feller and Beare, 1997). The soil map (Figure 3) indicates a high diversity in soils in western Kenya. The diversity ranges from sandy and unfertile soils via sodic and strongly weather soils, through to deep red soils with high fertility.
Most of the farmers in western Kenya are aware of the low soil fertility and noticed an ongoing soil fertility depletion. Around 60% of surveyed farmers reported moderate to high soil fertility depletion rates. As cause of the depletion farmers stated soil erosion, inadequacy of manure supply, low technical know-how on soil fertility management practices and lack of cash for mineral fertilizers (Odendo et al., 2010).
Fertilizers are mainly applied in form of farmyard manure and crop residues. Nevertheless, a study on soil fertility management on smallholder farms in western Kenya (Tittonell et al., 2005) showed that many of the farmers are using fertilizers but the application rates are low and differ between farm types. Within that study, the farm types were classified by wealth; production orientation (self-consumption or market-oriented); constraints to land, labor and capital; family structure and main source of income. Mineral fertilizers are mainly applied as diammonium phosphate and calcium-ammonium nitrate and urea for top dressing. Small sized farms are less self-sufficient in food production and relay more on off-farm jobs, but dispose over a higher capital for mineral fertilizer purchase (Tittonell et al., 2005).
Besides decreasing soil fertility the parasitic weed Striga spp is a major problem for agricultural productivity in SSA (Sauerborn, 1991). Maize, which is the most important food crop in rural areas of Kenya (Shisanya et al., 2009) is greatly affected by this weed. Due to the land pressure and intensification of agricultural practices, the fallow periods tend to be shorter and the diversity of the crops lower. This and the decline in soil fertility create an ideal environment for Striga and other weeds. Further, farmers have little knowledge about Striga control (Oswald, 2005).

11/48
Figure 3. Soil Map of Kenya (Kenya Soil Survey, 1980), cut-out: Western Province

12/48
4. Materials and Methods
4.1 Site description
The study was conducted on three locations in the Western Province of Kenya: one location in the district of Vihiga and two locations, Nyalgunga and Nyabeda, in the district of Siaya (Figure 4). In each location four farms were selected. Table 1 is showing the precise location and elevation of the selected farms.
Figure 4. Location of the three study sites: Nyalgunga, Nyabeda, Vihiga (Google, 2012)
Table 1. Locations of the experimental Farms District Location Farm Code Northing Easting Elevation [m] Siaya Nyalgunga SI/Y1/B1 0 04 50.1 34 18 21.8 1300 SI/Y1/B2 0 04 42.6 34 18 19.1 1335 SI/Y1/C1 0 04 56.9 34 13 17 .5 1312 SI/Y1/C3 0 05 05.4 34 17 53 .3 1310 Nyabeda SI/Y2/A1 0 08 01.2 34 24 17.5 1347 SI/Y2/A2 0 08 02.8 34 24 29.5 1360 SI/Y2/B2 0 07 42.9 34 24 29.5 1323 SI/Y2/C2 0 07 50.5 34 24 10 .8 1333 Vihiga Emusutswi VI/Y2/0 0 07 39.1 34 40 17.2 1528 VI/Y2/A3 0 07 36.2 34 40 46.2 1510 VI/Y2/B1 0 07 23.2 34 40 26.0 1503 VI/Y2/C1 0 07 30.0 34 40 11.9 1470
Nyalgunga
Nyabeda
Vihiga

13/48
The climate in the Western Province is characterized by two rainy seasons: the long rainy season (LR) from March to July and the short rainy season (SR) from August to December. On each farm the rainfall was recorded on daily basis. Appendix 1 is showing the total annual rainfall amount between 1998 and 2011 for each farm. The average annual rainfall for this period in Nyalgunga, Nyabeda and Vihiga is 1848 mm, 1895 mm and 1911 mm, respectively.
Additional metrological data was taken from the FAO WATER (2012) database ClimWat. According to the Agro-ecological zoning (AEZ), data from the metrological station in Kakamega (Table 2) is representative for the Location Vihiga and data from the metrological station in Tororo/Uganda (Table 3) can be used within the district Siaya.
Table 2. Average (1971 - 2000 ) metrological data from Kakamega (FAO WATER, 2012)
Month Temperature max [°C]
Temperature min [°C]
Humidity [%]
Wind speed [m/s]
Sunshine [h]
Radiation [MJ/m2/d]
Eto [mm/d]
January 31.1 10.3 60.4 1.0 8.00 21.13 3.96 February 32.0 10.7 58.9 1.0 8.00 21.85 4.15 March 32.6 10.8 62.3 1.2 7.60 21.45 4.17 April 31.4 10.5 73.1 0.9 6.50 19.14 3.61 May 30.9 10.3 75.1 0.8 6.80 18.57 3.35 June 29.7 9.9 74.0 0.8 7.30 18.62 3.26 July 30.3 10.1 73.4 0.8 6.90 18.29 3.20 August 29.4 9.8 72.5 0.9 7.30 19.77 3.49 September 30.0 10.0 70.1 0.9 7.10 20.28 3.66 October 30.8 10.3 68.3 1.0 7.20 20.54 3.82 November 30.8 10.3 67.9 1.1 6.50 18.96 3.63 December 30.7 10.2 65.2 1.3 7.90 20.64 3.88
Table 3. Average (1971 - 2000 ) metrological data from Tororo, Uganda (FAO Water, 2012)
Month Temperature max [°C]
Temperature min [°C]
Humidity [%]
Wind speed [m/s]
Sunshine [h]
Radiation [MJ/m2/d]
Eto [mm/d]
January 30.6 15.8 58.1 2.2 6.69 19.08 4.50 February 30.7 16.5 58.5 2.2 7.46 20.96 4.83 March 30.1 17.0 63.2 2.2 6.55 19.79 4.57 April 28.5 17.0 73.0 1.8 7.67 20.96 4.21 May 27.5 16.8 76.2 1.6 6.77 18.58 3.66 June 27.2 16.2 74.2 1.8 7.25 18.62 3.64 July 26.8 16.0 73.2 1.8 6.53 17.82 3.55 August 27.1 15.7 72.7 1.8 5.49 17.11 3.52 September 28.1 15.7 71.0 1.8 6.19 18.87 3.88 October 29.0 16.0 69.3 1.8 7.00 20.21 4.16 November 29.0 16.1 67.6 2.0 7.91 21.05 4.33 December 29.2 16.0 64.2 2.0 7.46 19.92 4.25

14/48
The main soil types in Vihiga are Haplic Acrisols and in Siaya Rhodic Nitisols.
Nitisols are red soils with at least 30 % clay and fair water holding properties. These soils are among the most productive soils of the humid tropics due to the high cation exchange capacity and available soil water (Jaetzold et al., 2005). Due to high P sorption application of slow-release P fertilizers is required. The rhodic type has a subsurface layer within 150 cm of the soil surface with a Munsell hue redder than YR (FAO, 2006b).
Acrisols are characterised by acidic pH, a higher clay content in the subsoil than in the topsoil and by low-activity clays in certain depths. The application of fertilizers on these soils is necessary to achieve rewarding and productive farming. Further, FAO (2006b) recommends the growing of undemanding and acidity-tolerant crops on Acrisols.
4.2 Plot design and treatment structure
With the implementation of the Soil Fertility Gradients project by CIAT-TSBF in 2004, trails with high and low fertility were defined on each of the twelve farms. The criteria for selecting high and low fertility fields within one farm were based on:
farmers perception, considering local soil quality indicators such as soil colour and weed type,
the farmers crop yield history, proximity to the homestead, soil carbon levels, which were determined by spectral analysis and visual degradation features such as erosion, Striga spp weed and surface crusting.
Those trails were split in plots with different treatments (Table 4) which were arranged as a randomized complete block design. The size of one plot was 25,2 m² (6 x 4.2 m). Organic and mineral fertilizers were applied at the same time as the sowing of the maize took place. Farmyard manure was applied at the rate of 15 kg per plot and Mavuno fertilizer (N:P:K – 10:26:0) at the rate of 149 kg/ha. The Mavuno fertilizer contains 10% N, 26% P2O5, 14% CaO, 4% MgO, 4% S and trace elements such as Bo, Mn, Zn, Na and Cu. Mavuno top dressing was applied six weeks after planting to one half of the plots at the rate of 99kg/ha. Hence the representative plot size for TD plots was 12.6 m².
Table 4. Treatment structure of the Soil Fertility Gradients project by TSBF-CIAT No. Treatment description T1 LM (no fertilizer added) T2 IR (no fertilizer added) T3 IR + MAV T3 TD IR + MAV + TD T4 IR + MAN T4 TD IR + MAN + TD T5 IR + MAV + MAN T5 TD IR + MAV + MAN + TD T= Treatment, LM = local maize, IR = Imazapyr resistant maize, MAV = Mavuno Fertilizer, MAN = Farmyard manure, TD = Top dressing. The highlighted treatments were analyzed in scope of this thesis.

15/48
In scope of this thesis samples from treatment T2, T4 and T5 TD were analyzed. On the control plot (T2) no additional fertilizers were applied. Treatment T5 TD was representing the best case scenario with FYM, Mavuno fertilizer and top dressing. Treatment T4 was fertilized only by FYM. Within this thesis treatment T5 TD is called T5.
4.3 Maize yield
The maize was planted and harvested continuously twice a year, during the short and long rainy seasons. The maize was planted with a spacing of 30 cm by 75 cm in each plot. Ten days after sowing the germinated maize seeds were collected and non-germinated gaps were filled with new seeds. Local maize was sowed on plot T1 with no other addition of fertilizers. On all the other plots Imazapyr resistant maize was planted, that is coated with herbicide to make it resistant to Striga spp weed. The yield data analyzed within this thesis is the maize harvested after the short rain season in 2011. Table 5 is showing the planting and harvesting dates of the three locations. To avoid errors, maize growing at the boundaries of the plots was not taken into account. Therefore the effective harvest area was 16,8 m2 for treatment T2 and T4 and 7,08 m2 for treatment T5. The measured components of the maize plant were: stalk, ear, grain, shelled grain and stovers weight. The yield was calculated as followed:
maize yield = (ear whole fresh weight * grain sample dry weight) / grain sample fresh weight / harvested area [kg/plot]
4.4 Crop Evapotranspiration and Water use efficiency
The crop evapotranspiration (ETc) was determined by the crop coefficient curve approach according to the FAO (1998) guidelines for single crop coefficient (Kc). The FAO is assuming a growing period of 180 days for East Africa. As the climate in western Kenya is relatively humid the growing period in the three locations is between 121 and 125 days (Table 5). Therefore it seemed more suitable to calculate with the length of growth stages from humid Nigeria, which is showing the following lengths for initial, development, mid and late stage respectively: 20, 35, 40 and 30 days.
Table 5. Planting and harvesting dates of the tree locations
Location Date planted Date harvested Total days Total rainfall [mm]
Daily rainfall [mm]
Vihiga 14th September 2011 16th January 2012 125 732 5.9 Nyabeda 12th September 2011 10th January 2012 121 761 6.3 Nyalgunga 13th September 2011 13th January 2012 123 722 5.9

16/48
To construct the crop coefficient curve the Kc values for the initial stage (Kc ini), the mid-season stage (Kc mid) and for the late season stage (Kc end) are required. For maize grown in a subhumid climate with a relative humidity of 45% and wind speed of 2 m/s, those values are 0.3, 1.2 and 0.6-0.35, respectively. Kc end depends on the grain moisture at harvest. Where the second value (0.35) for harvest of dry grain of about 18% moisture at wet mass basis. The overall average grain moisture for this project is 33.7 %. Therefore the assumed Kc end is 0.6.
The Kc ini was adjusted according to figure 29 in Chapter 6 - ETc - Single crop coefficient (FAO, 1998). This figure is mainly used for light to medium wetting events and when wetting is only by precipitation. To use the figure the average rain interval was calculated from the rain data from the short rains 2011.
Kc mid and Kc end were adjusted to the climatic condition in western Kenya by the following equation:
Kc =Kc(table) +[0.04*(u-2) – 0.004 (RH -45) ] * (h/3) 0.3
where: Kc(table) = the value for Kc mid or Kc end according to the FAO u = the mean daily wind speed in m/s RH = the mean daily relative humidity in % h = the mean maximum plant height in m
The data used for the adjustment of the Kc mid and Kc end was averaged according to the growing period during the short rains 2011 in each location (Table 6).
Table 6. Average values for reference evapotranspiration (ETo), relative humidity (RH) and wind speed (u) according to crop stage and location Location
Crop stage Nyalgunga Nyabeda Vihiga
ETo [mm/d] ini 3.91 3.89 3.68 dev 4.19 4.18 3.78 mid 4.30 4.30 3.74 end 4.37 4.35 3.92 RH [%] ini 70.8 70.9 69.8 dev 69.0 69.1 68.2 mid 66.2 66.3 66.8 end 61.4 61.9 62.6 u [m/s] ini 1.80 1.80 0.92 dev 1.83 1.83 1.02 mid 2.00 2.00 1.19 end 2.09 2.08 1.14

17/48
The Kc during the crop development and late season stage varies linearly between the Kc values of the previous and next stage and was adjusted according to the following equation:
Kc i = Kc prev +[(i-∑ Lprev)/ Lstage] * (Kc next – Kc prev)
where: i = day number within the growing season Kc i = crop coefficient on day i Lstage = length of the stage under consideration [d] ∑ Lprev = sum of the lengths of all previous stages
To estimate irregularities in rainfall patterns over the study period of 8 years it was summed that the SR occurred always between the 12th of September and the 16th of January.
4.5 Infiltration rate measurement
The infiltration rate (IF) was measured on the control treatment (T2) and on treatment T5. As some of the farmers had already ploughed their fields and hence disturbed the top soil, the IF could only be measured on the following farms: VI/Y2/B1, SI/Y1/B2, SI/Y1/C3, SI/Y1/C1, SI/Y2/B2, SI/Y2/C2 and SI/Y2/A1. The measurement was conducted once per treatment, at the same time as the soil sampling was done before the planting in February 2012. At the time the measurements were taken, the soil was very dry and bare. The measurement set-up was as followed:
A steeled infiltration ring with 30 cm diameter was driven about 2 to 3 cm into the soil. The soil was pre-wetted with 5 l of water for 20 min. Then the ring was filled up with water till the level of 20 cm. For the first 20-30 min the data was recorded at 5 min intervals. Later the readings were taken every 15 min, till the infiltration rate has stabilized. After each reading the water level was usually toped up to 20 cm. It was assumed that the IF stabilized when the readings showed 3 times the same values.
The IF was then calculation according to the following formula:
IF = (Start level – End level) / Interval [cm/min]
4.6 Soil Sampling
For the laboratory analysis of soil texture, aggregate stability and organic carbon, soil samples were collected at the same time as the IF was measured in February 2012. Per each treatment 6 sub-samples were taken with an auger from the topsoil (0-15 cm) according to the W-method. Then the collected soil was gently mixed to obtain a representative sample. Approximately 1.5 kg of this sample was stored in a sampling bottle to protect the aggregates during transport.
Simultaneously, bulk density (BD) was determined on undisturbed soil using cores with 5 cm height and diameter. Due to ploughing, the BD could be only determined at the same farms as IF. Sampling was repeated randomly, 3 times in each treatment.

18/48
4.7 Laboratory analysis
4.6.1 Soil texture and texture classes
Soil texture was determined at the lab of CIAT-TSBF in Nairobi by the hydrometer method (Appendix 4). The texture classes were defined according to the textural triangle by FAO (2006a).
4.6.2 Bulk density
Core samples were dried over 24 hours at 105⁰C and calculated according to the following formula:
BD = Dry weight / Core Volume [g/cm3]
where the core diameter and height were 5 cm.
4.6.3 Aggregate stability
The Aggregate stability (AS) was analyzed at the University of Nairobi, Department for Land Resources Management and Agricultural Technology according to Yoder (1936). Approximately 100 g of air dried sample was sieved between 2 and 4 mm. The sample was pre wetted over 5 min and then wet sieved over 10 min due to a mechanical shaker. Six sieves were used with the sizes: 2.0, 1.0, 0.5, 0.25, 0.125 and 0.063 mm. The retained aggregates of each sieve were oven dried at 105⁰C and weighted. To correct the designation of sand particles as false aggregates, the material from each sieve was dispersed and stirred over 7 min. The dispersion solution was made out of 33 g Sodium hexametaphosphate and 7 g sodium carbonate in 1 litre distilled water. After dispersion the sample was sieved again and dried to determinate the new weight. The aggregate stability for each size was calculated as following:
AS = (weight retained – weight of sand) / (total sample weight – weight of sand) x100
The total aggregate stability was defined as the sum of the AS values for each size.
4.6.4 Organic carbon
The Organic carbon (OC) was determined at the University of Nairobi, Department for Land Resources Management and Agricultural Technology according to the Walkley-Black procedure (Walkley, 1946).

19/48
4.8 Statistical analysis
The statistical set-up of the study and the split plot design are shown in Figure 5. In each of the three locations the four farms acted as repetitions. Each farm was split into high and low fertility plots, which further were split into the treatments (T2, T4, T5).
The comparison between the physical soil properties at different locations, fertilities and treatments was done by applying single factor analyses of variance (ANOVA). First the parameters were analyzed within one location and fertility, later the differences between the locations were determined. Simple correlations between the soil properties were carried out to explain their relation to each other. All data analyses were conducted with MiniTab and MS Excel.
Figure 5. Split plot design of the study. T: Treatment, FYM: Farmyard manure 15 kg per plot, MAV: Mavuno fertilizer (N:P:K – 10:26:0) 149kg/ha, TD: Mavuno top dressing 99kg/ha (applied 6 weeks after planting)
20/48
5. Results
5.1 Crop Evapotranspiration and Water use efficiency
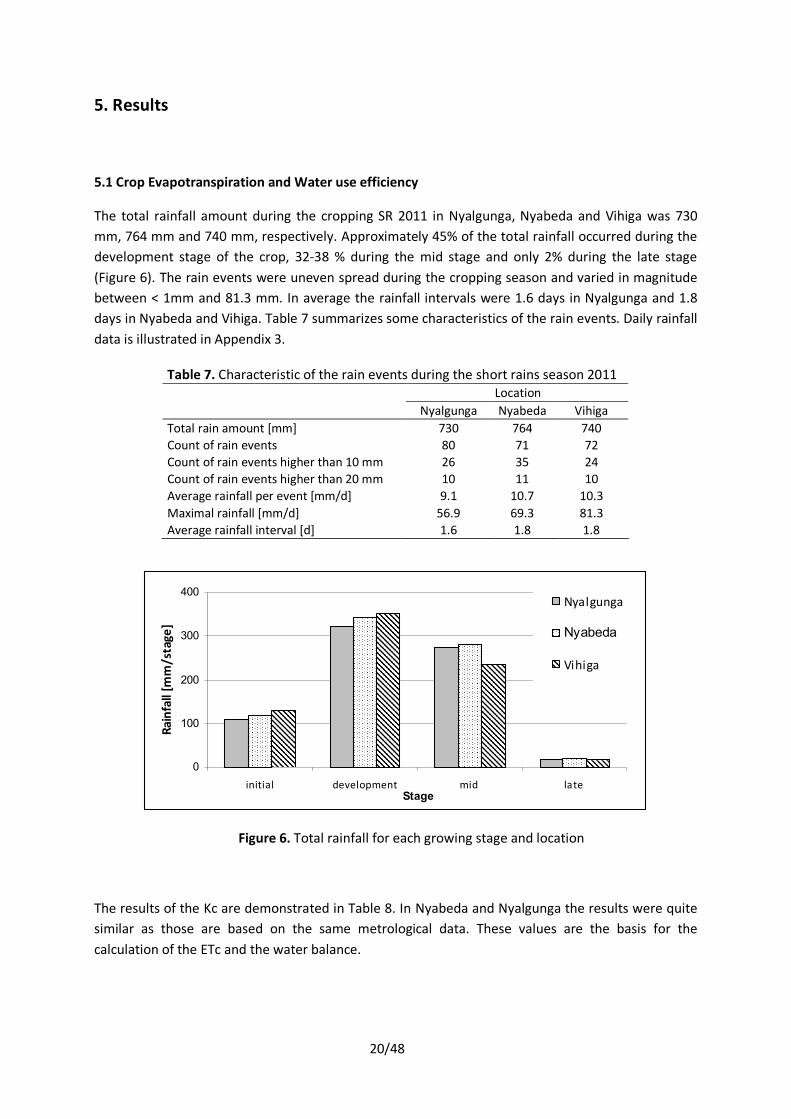
The total rainfall amount during the cropping SR 2011 in Nyalgunga, Nyabeda and Vihiga was 730 mm, 764 mm and 740 mm, respectively. Approximately 45% of the total rainfall occurred during the development stage of the crop, 32-38 % during the mid stage and only 2% during the late stage (Figure 6). The rain events were uneven spread during the cropping season and varied in magnitude between < 1mm and 81.3 mm. In average the rainfall intervals were 1.6 days in Nyalgunga and 1.8 days in Nyabeda and Vihiga. Table 7 summarizes some characteristics of the rain events. Daily rainfall data is illustrated in Appendix 3.
0
100
200
300
400
initial development mid late Stage
Rain
fall
[mm
/sta
ge]
Nyalgunga
Nyabeda
Vihiga
The results of the Kc are demonstrated in Table 8. In Nyabeda and Nyalgunga the results were quite similar as those are based on the same metrological data. These values are the basis for the calculation of the ETc and the water balance.
Table 7. Characteristic of the rain events during the short rains season 2011 Location
Nyalgunga Nyabeda Vihiga Total rain amount [mm] 730 764 740 Count of rain events 80 71 72 Count of rain events higher than 10 mm 26 35 24 Count of rain events higher than 20 mm 10 11 10 Average rainfall per event [mm/d] 9.1 10.7 10.3 Maximal rainfall [mm/d] 56.9 69.3 81.3 Average rainfall interval [d] 1.6 1.8 1.8
Figure 6. Total rainfall for each growing stage and location

21/48
Table 8. Kc values according to crop stage and location Location Crop stage
Nyalgunga Nyabeda Vihiga initial 0.63 0.60 1.08 mid 1.12 1.12 1.09 end 0.55 0.54 0.51
In Nyalgunga and Nyabeda the daily average ETc ranged from 2.34 to 4.84 mm/day and decreased in the following order: mid stage> development > late stage > initial. In Vihiga the range of ETc was narrower: from 3.01 to 4.11 mm/day. Main difference between Siaya and Vihiga was the higher ETc during initial crop stage in Vihiga. The water balance was in all stages positive, except the late stage where the water deficit was between 2.42 and 2.77 mm/d. Highest water surpluses were recorded in the development stage of the crop (Table 9). Appendix 3 contains the results of ETc and the water balance on daily basis.
Table 9. Average Rainfall, Etc and Water balance per crop stage during SR 2011
Location Crop Stage Rainfall
[mm/stage] ETc
[mm/stage]
Water Balance
[mm/stage] Rainfall [mm/d]
ETc [mm/d]
Water Balance [mm/d]
Nyalgunga initial 108.67 49.24 59.43 5.43 2.46 2.97 development 320.96 129.89 191.07 9.17 3.71 5.46 mid stage 274.61 193.37 81.24 6.87 4.83 2.03 late stage 17.34 100.31 -82.97 0.58 3.34 -2.77 Nyabeda initial 118.04 46.73 71.31 5.90 2.34 3.57 development 343.96 127.56 216.40 9.83 3.64 6.18 mid stage 280.88 193.41 87.47 7.02 4.84 2.19 late stage 18.18 92.51 -74.33 0.61 3.08 -2.48 Vihiga initial 129.16 79.57 49.59 6.46 3.98 2.48 development 351.99 143.92 208.07 10.06 4.11 5.94 mid stage 233.58 163.54 70.04 5.84 4.09 1.75 late stage 17.68 90.33 -72.65 0.59 3.01 -2.42
Within two preceding months before the SR 2011 total rainfall amounts Nyalgunga, Nyabeda and Vihiga were 428 mm, 455 mm and 462 mm, respectively. Table 10 compares rainfall data from previous years during the SR.

22/48
Table 10. Total rainfall during SR (12. September - 16. January) Year Nyalgunga Nyabeda Vihiga 1998 506 519 484 1999 659 661 625 2000 720 740 721 2001 664 677 723 2002 747 759 715 2003 481 483 492 2004 620 618 616 2005 391 398 398 2006 1128 1160 1088 2007 475 488 490 2008 653 674 655 2009 729 737 818 2010 500 519 579 2011 731 764 740 Mean 643 657 653
5.2 Maize yield
The overall maize yield, including all the three treatments as well as the high and low fertility plots, showed significant differences (p<0.005) between the three locations. Figure 7 is showing a boxplot with the minimum and maximum yield values for each farm. The individual data is illustrated in Appendix 2. The yield is decreasing from Nyalgunga, over Nyabeda till Vihiga with yield means of 2721, 1802 and 970 kg/ha, respectively. The farm SI/Y1/C3 within location Nyalgunga is an outlier. The harvest was destroyed by animals and therefore these data is not representative for this location. In general, there are no significant differences between the farms within one location.
VI/Y2/C1
VI/Y2/B1
VI/Y2/A3
VI/Y2/0
SI/Y2
/C2
SI/Y2/B2
SI/Y2
/A2
SI/Y2
/A1
SI/Y1
/C3
SI/Y1
/C1
SI/Y1
/B2
SI/Y1/B1
7000
6000
5000
4000
3000
2000
1000
0
Farm
Mai
ze y
ield
[kg/
ha]
Figure 7. Boxplot of maize yield in kg/ha for each farm

23/48
The maize yield increased with the treatment, where T5 shows the highest yield and T2 the lowest. This trend is statistically significant and evident in all locations (Table 11). None of the locations show significant differences between high and low fertility. Nevertheless, the average maize yield for each treatment is slightly higher at the low fertility plots than at the high fertility plots.
Table 11. Mean maize yield in kg/ha and p-value Location T2 T4 T5 p Vihiga 349 973 1586 0.000 Nyabeda 1043 1697 2665 0.002 Nyalgunga 1562 2882 3719 0.052 Mean 960 1806 2611 0.000
5.3 Soil texture
Table 12 shows the particle size distribution in the topsoil for each farm and fertility level. The data indicates significantly lower clay (p=0.000) content in Vihiga than in Siaya. In Siaya the mean clay contend was 40% and the texture class is dominated by a sandy clay. Where in Vihiga the clay content had a mean value of 31% and the texture class was sandy clay loam.
Table 12. Soil texture analysis for each farm and fertility level and definition of texture classes according to FAO (2006)
Soil texture [%] Location Farm Fertility Clay Sand Silt
Texture classes
Nyalagunga SI/Y1/B1 H 40.9 47.1 12.0 sandy clay SI/Y1/B1 L 51.2 37.0 11.8 clay SI/Y1/B2 H 29.6 60.4 10.0 sandy clay loam SI/Y1/B2 L 38.3 49.7 12.0 sandy clay SI/Y1/C1 H 47.2 39.6 13.2 clay SI/Y1/C1 L 41.6 48.4 10.0 sandy clay SI/Y1/C3 H 32.9 53.7 13.3 sandy clay loam SI/Y1/C3 L 38.9 50.4 10.7 sandy clay Nyabeda SI/Y2/A1 H 41.6 46.4 12.0 sandy clay SI/Y2/A1 L 42.2 46.4 11.3 sandy clay SI/Y2/A2 H 40.3 47.1 12.7 sandy clay SI/Y2/A2 L 40.3 46.4 13.3 sandy clay SI/Y2/B2 H 31.6 56.4 12.0 sandy clay loam SI/Y2/B2 L 45.2 39.6 15.2 clay SI/Y2/C2 H 40.2 47.1 12.7 sandy clay SI/Y2/C2 L 40.2 47.8 12.0 sandy clay Vihiga VI/Y2/0 H 29.3 62.2 8.5 sandy clay loam VI/Y2/0 L 30.3 58.4 11.3 sandy clay loam VI/Y2/A3 H 31.6 56.4 12.0 sandy clay loam VI/Y2/A3 L 32.9 56.4 10.7 sandy clay loam VI/Y2/B1 H 30.3 60.4 9.3 sandy clay loam VI/Y2/B1 L 27.6 62.4 10.0 sandy clay loam VI/Y2/C1 H 32.9 55.1 12.0 sandy clay loam VI/Y2/C1 L 32.3 57.8 10.0 sandy clay loam

24/48
5.4 Infiltration rate
The infiltration rate varies between 0.09 and 0.63 cm/min with an overall average of 0.39 cm/min. The average values for Nyabeda, Nyalgunga and Vihiga are 0.41, 0.37 and 0.31 cm/min, respectively. Table 13 shows the IF for each plot. Differences in IF between the farms are significant (p=0.000). There are no significant differences, neither in treatment nor in fertility levels. The regression with BD and OC does not show any clear patterns.
Table 13. Infiltration rate in cm/min for each farm, fertility and treatment Location Farm Fertility Treatment Infiltration rate Nyalgunga SI/Y1/B2 H T2 0.27 SI/Y1/B2 H T5 0.47 SI/Y1/B2 L T2 0.47 SI/Y1/B2 L T5 0.40 SI/Y1/C1 H T2 0.57 SI/Y1/C1 H T5 0.55 SI/Y1/C1 L T2 0.61 SI/Y1/C1 L T5 0.48 SI/Y1/C3 H T2 0.09 SI/Y1/C3 H T5 0.27 SI/Y1/C3 L T2 0.23 SI/Y1/C3 L T5 0.23 Nyabeda SI/Y2/A1 H T2 0.63 SI/Y2/A1 H T5 0.60 SI/Y2/A1 L T2 0.57 SI/Y2/A1 L T5 0.34 SI/Y2/B2 H T2 0.42 SI/Y2/B2 H T5 0.53 SI/Y2/B2 L T2 0.50 SI/Y2/B2 L T5 0.33 SI/Y2/C2 H T2 0.27 SI/Y2/C2 H T5 0.28 SI/Y2/C2 L T2 0.21 SI/Y2/C2 L T5 0.23 Vihiga VI/Y2/B1 H T2 0.30 VI/Y2/B1 H T5 0.43 VI/Y2/B1 L T2 0.33 VI/Y2/B1 L T5 0.29
5.5 Bulk density
Table 14 shows the mean values for BD for each farm with an overall mean value of 1.16 g/cm³. The average BD on sandy clay loam soils is 1.20 g/cm³, and on sandy clay soils 1.14 g/cm³. In Nyabeda the differences in BD between farms are statistically significant (p=0.022). There are no significant differences, neither between treatments, nor between high and low fertility.

25/48
Table 14. Bulk density in g/cm³ for each farm and fertility Location Farm Fertility Bulk density Nyalgunga SI/Y1/B2 H 1.20 SI/Y1/B2 L 1.10 SI/Y1/C1 H 1.15 SI/Y1/C1 L 1.17 SI/Y1/C3 H 1.20 SI/Y1/C3 L 1.19 Nyabeda SI/Y2/A1 H 1.13 SI/Y2/A1 L 1.10 SI/Y2/B2 H 1.17 SI/Y2/B2 L 1.19 SI/Y2/C2 H 1.08 SI/Y2/C2 L 1.09 Vihiga VI/Y2/B1 H 1.19 VI/Y2/B1 L 1.22
5.6 Organic carbon content in soil
The mean OC level by weight in Nyabeda, Nyalgunga and Vihiga is 1.85, 1.35 and 1.52%, respectively. The differences between the locations are statistically significant (p=0.001). There are no significant differences between the high and low fertility. The overall means for treatment T2, T4 and T5 are 1.32, 1.32 and 2.07%, respectively. The OC content among treatment T5 is significantly higher (p<0.005) than treatment T2 and T4 (Figure 8). The results do not show differences between treatment T2 and T4. The individual data is illustrated in Appendix 2.
T5 LT5 HT4 LT4 HT2 LT2 H
2,5
2,0
1,5
1,0
0,5
Treatment and Fertility
Org
anic
Carb
on [%
]
Figure 8. Boxplot of the OC content in the soil at each treatment and fertility level in % by weight

26/48
5.7 Aggregate stability
The individual results of the AS in relation to location, farm, fertility level and treatment are illustrated in Appendix 2. Figure 9 shows the individual value plot of the results according to treatment and fertility level. The values vary between 79.2 and 15.5 % and indicate a high variability of the results.
T5 LT5 HT4 LT4 HT2 LT2 H
80
70
60
50
40
30
20
10
Treatment+Fertility
Aggr
egat
e st
abili
ty [%
]
Figure 9. Individual value plot of the AS in % by weight
The AS in Nyabeda, with a mean value of 48%, is significantly higher (p=0.011) than in Nyalgunga and Vihiga, where the AS is 37% and 38%, respectively. In Nyabeda and Vihiga the mean AS seems to be higher on treatment T4 (Table 15), but this tendency is statistically not significant. The data does not indicate differences in AS between plots with high and low fertility at any of the locations.
Table 15. Mean Aggregate stability and Standard Deviation in % by weight T2 T4 T5 Location
Mean StDev Mean StDev Mean StDev p-value
Vihiga 32.5 8.8 43.8 5.6 37.4 13.6 0.082 Nyabeda 45.9 9.6 52.6 9.1 44.7 10.1 0.325 Nyalgunga 39.0 11.9 35.5 14.4 35.5 21.9 0.894

27/48
6. Discussion
6.1 Crop Evapotranspiration and Water use efficiency
The rainfall events in western Kenya were not equally spread, neither during the cropping season nor during the particular crop stage. Additionally, the rainfall events occurred in various high intensities and the exact duration of an event is unknown. Extreme rain events that often occur in the tropics can damage the crop and further result in high runoff when the infiltration capacity of the soil is exceeded. The highest rain amount precipitated at all sites during the development and mid stage, where the ETc was also highest. The lowest precipitation amounts were found during the late stage, where only during 6% of the stage length in Nyabeda and 3% in Vihiga and Nyalgunga, rain events occur.
The ETc, varied between 2.34 and 4.84 mm/day and was highest during the development and late stage of the growing season. The results of the ETc are comparable with other studies about water requirements of maize. Kang et al. (2003) investigated ETc within the range of 1.56 – 5.33 mm/day. That study was conducted between June and October on a loess loam soil in the semi-humid climate of Province Shaanxi in China. A study by Gao et al. (2009) in Henan Province of China showed that ETc does vary between the crop stages. The ETc rose from approximately 1.5 mm/day in the initial stage up to almost 6 mm/day during mid stage and declined in the end below 1 mm/day.
Taking into account the whole cropping period, the rainfall amount is able to cover the water requirements of maize at all sites, during all crop stages except the late stage. The negative water balance during late stage might even have a positive effect on the maize storage due to lower grain moisture at harvest.
Nevertheless, a major flaw of this study is the missing information about the water holding capacity of the soil. The texture results did show significant differences in clay content between Siaya and Vihiga. Hence it is unclear in what proportion the infiltrated rainwater is available for the plants.
Further, daily rainfall data was collected at the sites, the calculation of the Crop Evapotranspiration (ETc) for the growing season short rains 2011 was based on monthly average data from metrological stations in the same Agro-economic zones at the sites. Hence the final results of the ETc can only be seen as a rough estimation to predict water requirements for the maize grown in Siaya and Vihiga.
6.2 Soil fertility gradients
A main objective of the conducted study was to investigate differences between soil fertility gradients that are claimed to occur within farms. Neither the maize yield, nor any of the physical soil parameters indicate significant differences between the high and low fertility plots. The maize yield shows slightly higher values in the low fertility plots, although it was expected to be higher in the high fertility plots. The data indicates that there are no differences in soil fertility gradients within farms for all three locations.

28/48
However, several studies (Vanlauwe et al., 2006 and Tittonell et al., 2005) proved that soil fertility in western Kenya is affected by the field utilization and proximity to the homestead. Two possible hypotheses are coming up to explain that lack of clarity. Fist, the criteria for selecting high and low fertility plots, might have been too subjective and not based enough on scientific data to emphasize the differences. Furthermore, the differences between high and low fertility are more descriptive and do not indicate the level of fertility. Second, as mentioned in the introduction, the high fertility plots are resulting from more intensive fertilizer input close to the homestead. In scope of this study, the trials were fertilized every cropping season in the same way and that over eight years. It might well be that the fertility gradients within one farm were balanced out since the implementation of the trials.
6.3 Maize yield
It seems that the differences in maize yield between the treatments are due to the different nutrient levels. As hypothesized the maize yield is lowest at the control plot (T2) with no additional fertilizer input. The maize yield on treatment T4, which was fertilizer with FYM, is higher than treatment T2. Finally, treatment T5, which is assumed to be the best case scenario with FYM, Mavuno fertilizer and top dressing, shows the highest yield. These patterns are clearly evident in all three locations. Several studies (Gentile et al., 2008; Donovan and Casey, 1998 and Shisanya et al. 2009) proved that the integration of organic and inorganic fertilizers is leading to the higher yield due to a more balanced nutrient supply and enhanced potential N availability.
Nonetheless, the highest yield in Vihiga is comparable to the lowest yield at treatment T2 in Nyalgunga. The differences between the maize yields at the three locations are most likely explained by the different soil texture and soil types. In Vihiga, where the maize yield shows the lowest average values, the clay content is the lowest and the texture class is defined as sandy clay loam. In the two locations in Siaya the dominant texture class is sandy clay with an average clay content of approximately 40%, that is around 10% higher than in Vihiga. Besides the texture, different soil classes in Siaya and Vihiga could cause uneven yield distribution between the locations. Sileshi et al. (2010) compared studies and results of maize grown on different soil types among SSA and reported that the soil types do have an influence on the yield. The maize yield was significantly higher on Nitosols and Ferralsols compared to Acrisols. The differences were especially significant on control plots but also occurred on plots treated with inorganic fertilizers. The main soil type in Vihiga is Acrisol and in Siaha Nitisol. Another explanation for the site variation could be an uneven infestation with the parasitic weed Striga spp. Kanampiu et al. (2002) estimated that 76% of the area in western Kenya planted to maize and sorghum, is affected by Striga spp. However, Vihiga tends to be less infested by Striga spp. due to the lower temperature (Odendo et al., 2010).

29/48
6.4 Soil Texture and soil fertility
Its is widely accepted that the soil clay content is improving soil fertility due to higher cation exchange capacity and plant available water due to superior water holding capacity. Reuter (1994) and Ismail and Ozawa (2007) even suggested clay application to improve some physical soil properties and hence to increase yield.
The results of the topsoil are showing significant differences (p=0,001) between maize yield in connection to the texture class. The mean maize yield on sandy clay loam is 1108 kg/ha where on sandy clay 2273 kg/ha. Although the clay content in Vihiga is lower than in Siaya, 30% clay still seems to be relatively high and raises the question if the clay content alone is responsible for that low yield in Vihiga. It is well know that tropical soils do often contain low activity clay (LAC) and are less fertile. The distribution between high and low activity clays and oxides in case of this study is uncertain. Further investigations on soil mineralogy and oxides are needed to explain the influence of the soil texture on the yield.
6.5 Infiltration rate
The variation between the results seems to be common for tropical soils. Other research (Wilkinson and Aina, 1976 and Moroke et al., 2009) shows IF in the range between 0.05 and 0.4 cm/min, what is comparable to the results in this study (0.09 to 0.63 cm/min). The differences in IF between the farms are very likely to be explained by the different soil texture. Although statistically not significant, the mean IF on sandy clay loam, as in Vihiga, is approximately 0.1 cm/min lower than on sandy clay. Further the data indicates slightly higher IF values in Siaya than in Vihiga. As well as for the maize yield, the farm SI/Y1/C3 is showing a lower IF value than other farms in Siaya. A possible explanation might be that due to the destroyed crop, the root system was less developed and hence the soil was less porous. Furthermore, the BD at this farm shows slightly higher values. It is well known that an increase in BD is reducing IF.
6.6 Bulk density
The data shows a slightly higher BD on sandy clay loam soils, than on sandy clay soils. It is generally accepted that the BD tends to be higher in sandy soils than in the fine-textured soil, due to the lower organic matter content and less aggregation. Further, all BD values are within the, by Pierce et al. (1983) recommended, limit for root growth (1.49 g/cm³ for soils containing 35 to 45% clay).
In general, the rather low BD in the topsoil can be explained by the ploughing that occurred twice a year during the duration of the study. Nevertheless, Etana et al., (1999) and Alakukku, (1998) reported an increase in BD on fine-textured soils below the tillage depth. Further investigations on the BD in deeper layers are necessary to estimate the compaction of the soil as a restricting factor to root growth and further maize yield.

30/48
The results do not show any differences between the treatments, what is contrary to the findings of other studies. Celik et al. (2010) and Zebarth et al. (1999) reported a decline in BD after long-term application of organic fertilizers. An explanation for that might be the poor quality of FYM (see 6.7).
6.7 Organic carbon content in soil
As hypothesized, the treatment does have an influence on the OC. The OC in treatment T5 is significantly higher than in the control treatment T2. Surprisingly, the treatment T4 which was fertilized with FYM does not show any differences to T2. This may indicate that mineral fertilizers have a higher effect on OC than organic fertilizers. However other studies (Celik et al., 2010; Enghball, 2002 and Shisanya et al., 2009) reported opposite findings. Where only organic fertilizers contributed to increased OC and mineral fertilizers had none or and indirect effect on OC due to improved yield. Therefore it is more likely that the higher OC in treatment T5 is attributable to the higher yield and higher biomass production in the root zone. Another reason for the lacking improvement of OC after application of organic amendments, might be the poor quality of FYM among the farms. Vanlauwe and Giller (2006) recognized that FYM had a medium to low quality material and Odendo et al. (2010) recognized out that farmers do complain about low technical know-how on suitable soil fertility practices. Treatment T4 and T5 were fertilized with local FYM, that differed between farms and cropping season from each other in their composition and quality.
The differences in OC between the locations are most likely explained by the different clay content. It is generally accepted that the soil C is increasing with the clay content. This trend was also realized for tropical LAC soils (Feller and Beare, 1997).
6.8 Aggregate stability
It was expected that the AS will increase with a higher OC content. The data in Nyabeda and Vihiga indicates a higher AS in treatment T4, which is fertilized with FYM, than in the control treatment T2. However these results are statistically not significant. Further, it seems interesting to mention that the OC content does not show higher values among T4 in comparison to treatment T2. The OC is higher among the best fertilized treatment T5, but here the AS shows lower values than in T4. This may indicate that mineral fertilizers have a negative or neutral impact on the AS. Other studies (Yu et al, 2012 and Huang et al, 2010) showed that mineral fertilizers did not affect AS despite the increased OC, but organic amendments did.
The results in Nyalgunga are against all expectations. The AS, with a highest mean value on treatment T2, followed by T4 and T5, could lead to the assumption that OC, regardless if from mineral or organic source, has nor or little influence on AS. Barthés et al. (2007) reported that the aggregation in tropical soils, which are dominated by low-activity clays (LAC), is rather affected by Al-containing sesquioxides than by OC. Hence, the positive correlation between AS and OC, showed by other studies (Herencia et al., 2011 and Dunjana et al., 2012), might not be that relevant for tropical soils.

31/48
The variability of the results within one treatment may be explained by the different soil texture among the locations. The AS is significantly higher (p=0.048) on sandy clay than on sandy clay loam, with mean values of 43.5% and 35.6%, respectively. This finding is consensual with the general knowledge that the clay content has a positive effect on AS (Amézketa, 1999).
Nevertheless, some facts as for example (1) the high variability of the results (15.3 to 79.2 %), (2) the unexpected trends between the treatments and (3) especially the confusing results from Nyalgunga, lead to the concern that the laboratory analysis might be incorrect. Another possible explanation might be an inadequate management of the trails during the study period. A repetition of the analyses in another laboratory would be necessary to exclude the above mentioned possibilities and verify the data of this study.

32/48
7. Conclusion
This study showed only partly that long term fertilizer application has an effect on physical properties. IF and BD were not influenced by, nether organic or inorganic fertilizers. Effects were found on AS, that seem to be positive affected by organic fertilizers. Further, this study indicates that mineral fertilizers contribute more to the increase of OC than organic fertilizers.
The results indicated that OC might not be that important for AS as other studies reported. An increase in OC due to mineral fertilizer did not resulting in higher AS. Further, literature suggests Al-containing sesquioxides as a main driver of aggregation in tropical soils. IF and BD were not influenced by OC.
The best treatment for optimal maize growth is a combination of farmyard manure, Mavuno fertilizer and top dressing. FYM alone is improving the yield in comparison to no treatment at all. Nevertheless, organic and mineral fertilizers can increase maize yield just to a certain extent. The texture classes and hence the clay content, play an important role for agricultural productivity. The highest yields were found on sandy clay soils with combined organic and mineral fertilizer treatment. Further, the soil types affected maize yield. Highest yields occurred on Nitisols and lowest yields occured on Acrisols. The dependency on the soil texture and soil type indicates that the choice of a suitable cropping site can be more important and sustainable than the treatment with fertilizers itself. Other physical soil parameters (IF, BD, AS) did not influence maize yield.
The results did not indicate any differences between high and low fertility plots, nether in maize yield nor in any of the physical soil properties. It is very likely that the differences between the plots were settled during the long-term treatment during the eight years of the study. Hence, long-term fertilizer application is not suitable to study differences in soil fertility gradients.
The rainfall amount is able to cover the water crop requirements of maize in all locations. The negative water balance during late stage might even be beneficial for maize storage due to the lower grain moisture at the harvest. Nevertheless, these results should be seen as a rough estimation. Further research on the water holding capacity of soils is recommended.

33/48
8. Acknowledgement
I would like to express my gratitude to my supervisors Ingrid Wesström and Bjarne W. Strobel for guidance, constructive input and help, and Bernard Vanlauwe for giving me this great opportunity to be a part of this project and to explore research in a developing country and for answering thousands of emails. I would like to thank the CIAT-TSBF crew and every single farmer for their help and endurance during the field work despite heat, long working days and exhaustion. My special thanks go to Sibusisiwe Caroline Kamanga for sharing with me her home, friends and shinny spirit and for her irreplaceable skills, power and teamwork during field work and my entire stay in Kenya. I would like to thank Kristine Bogomazova for her magnificent knowledge in English grammar and motivation during grey days in front of the computer. Finally I would like to thank CIAT-TSBF for funding the project and my parents Dorota and Marek for their financial support during my Master´s.

34/48
9. References
Alakukku, L. (1998). Properties of compacted fine-textured soils as affected by crop rotation and reduced tillage. Soil and Tillage Research 47(1–2), 83–89.
Amézketa E. (1999). Soil aggregate stability: A review. Journal of Sustainable Agriculture 14, 83–151.
Barthès, B. G., Kouakoua, E., Larré-Larrouy, M.-C., Razafimbelo, T. M., De Luca, E. F., Azontonde, A., Neves, C. S. V. J., De Freitas, P. L. & Feller, C. L. (2008). Texture and sesquioxide effects on water-stable aggregates and organic matter in some tropical soils. Geoderma 143(1–2), 14–25.
Celik, I., Gunal, H., Budak, M. & Akpinar, C. (2010). Effects of long-term organic and mineral fertilizers on bulk density and penetration resistance in semi-arid Mediterranean soil conditions. Geoderma 160(2), 236–243.
CountrySTAT - Kenya. Population in Census Years. [online] (2013). Available from: http://www.countrystat.org/home.aspx?c=KEN&ta=114CPO010&tr=12. [Accessed 2013-01-07].
Donovan, W. G. & Casey, F. (1998). Soil fertility management in sub-Saharan Africa. World Bank Publications. ISBN 9780821342367.
Drechsel, P., Gyiele, L., Kunze, D. & Cofie, O. (2001). Population density, soil nutrient depletion, and economic growth in sub-Saharan Africa. Ecological Economics 38(2), 251–258.
Dunjana, N., Nyamugafata, P., Shumba, A., Nyamangara, J. & Zingore, S. (2012). Effects of cattle manure on selected soil physical properties of smallholder farms on two soils of Murewa, Zimbabwe. Soil Use and Management no–no.
Eghball, B. (2002). Soil properties as influenced by phosphorus- and nitrogen-based manure and compost applications. Agronomy Journal 94(1), 128–135.
Etana, A., Håkansson, I., Zagal, E. & Bucas, S. (1999). Effects of tillage depth on organic carbon content and physical properties in five Swedish soils. Soil and Tillage Research 52(3–4), 129–139.
FAO. Crop evapotranspiration, Chapter 6 - ETc - Single crop coefficient (Kc). [online] (1998). Available from: http://www.fao.org/docrep/X0490E/x0490e0b.htm#length%20of%20growth%20stages. [Accessed 2012-09-27].
FAO (2006a). Guidelines for Soil Description. [online],. Available from: ftp://ftp.fao.org/agl/agll/docs/guidel_soil_descr.pdf. [Accessed 2012-09-27].
FAO (2006b). World reference base for soil resources 2006 [online]. Available from: ftp://ftp.fao.org/agl/agll/docs/wsrr103e.pdf. [Accessed 2012-12-10].
FAO. FAOSTAT. [online] (2010). Available from: http://faostat.fao.org/. [Accessed 2012-06-19].
FAO WATER. ClimWat - Water Development and Management Unit - Information Resources - Databases. [online] (2012). Available from: http://www.fao.org/nr/water/infores_databases_climwat.html. [Accessed 2012-09-27].

35/48
Feller, C. & Beare, M. H. (1997). Physical control of soil organic matter dynamics in the tropics. Geoderma 79(1–4), 69–116.
Franzluebbers, A. . (2002). Water infiltration and soil structure related to organic matter and its stratification with depth. Soil and Tillage Research 66(2), 197–205.
Gao, Y., Duan, A., Sun, J., Li, F., Liu, Z., Liu, H. & Liu, Z. (2009). Crop coefficient and water-use efficiency of winter wheat/spring maize strip intercropping. Field Crops Research 111(1–2), 65–73.
Gentile, R., Vanlauwe, B., Chivenge, P. & Six, J. (2008). Interactive effects from combining fertilizer and organic residue inputs on nitrogen transformations. Soil Biology and Biochemistry 40(9), 2375–2384.
Google. Google Maps. [online] (2012). Available from: https://maps.google.se/. [Accessed 2012-07-11].
Hati, K. M., Swarup, A., Mishra, B., Manna, M. C., Wanjari, R. H., Mandal, K. G. & Misra, A. K. (2008). Impact of long-term application of fertilizer, manure and lime under intensive cropping on physical properties and organic carbon content of an Alfisol. Geoderma 148(2), 173–179.
Herencia, J. F., García-Galavís, P. A. & Maqueda, C. (2011). Long-Term Effect of Organic and Mineral Fertilization on Soil Physical Properties Under Greenhouse and Outdoor Management Practices. Pedosphere 21(4), 443–453.
Huang, S., Peng, X., Huang, Q. & Zhang, W. (2010). Soil aggregation and organic carbon fractions affected by long-term fertilization in a red soil of subtropical China. Geoderma 154(3-4), 364–369.
Ismail, S. M. & Ozawa, K. (2007). Improvement of crop yield, soil moisture distribution and water use efficiency in sandy soils by clay application. Applied Clay Science 37(1–2), 81–89.
Jaetzold R., Schmidt H., Hornet B. & Shisanya C. (2005). Farm Management Handbook: Natural Conditions and Farm Management Information. [online],. Available from: http://www2.gtz.de/dokumente/bib/07-1282.pdf. [Accessed 2012-06-06].
Kanampiu F., Friesen D. & Gressel J. (2002). CIMMYT unveils herbicide-coated maize seed technology for Strica control. Haustorium 42, 1-3.
Kang, S., Gu, B., Du, T. & Zhang, J. (2003). Crop coefficient and ratio of transpiration to evapotranspiration of winter wheat and maize in a semi-humid region. Agricultural Water Management 59(3), 239–254.
Kenya Soil Survey. Agro-Climatic Zone Map of Kenya. [online] (1980a). Available from: http://eusoils.jrc.ec.europa.eu/esdb_archive/eudasm/africa/images/maps/download/afr_keacz2.jpg. [Accessed 2012-11-21].
Kenya Soil Survey. Explatory Soil Map of Kenya. [online] (1980b). Available from: http://eusoils.jrc.ec.europa.eu/esdb_archive/eudasm/africa/images/maps/download/afr_keesm.jpg. [Accessed 2012-11-21].
Khan, Z. R., Midega, C. A. O., Amudavi, D. M., Hassanali, A. & Pickett, J. A. (2008). On-farm evaluation of the ‘push–pull’ technology for the control of stemborers and striga weed on maize in western Kenya. Field Crops Research 106(3), 224–233.

36/48
Moroke, T. S., Dikinya, O. & Patrick, C. (2009). Comparative assessment of water infiltration of soils under different tillage systems in eastern Botswana. Physics and Chemistry of the Earth, Parts A/B/C 34(4–5), 316–323.
Odendo, Groote, H. & Odongo, O.M. (2001). Assessment of farmers’ preferences and constraints to maize production in the moist Mid-altitude zone of western Kenya. African Crop Science Assiociation ACSA (Eds.), African Crop Science Conference Proceedings, 769–775.
Odendo, M., Obare, G. & Salasya, B. (2010). Farmers’ perceptions and knowledge of soil fertility degradation in two contrasting sites in western Kenya. Land Degradation & Development 21(6), 557–564.
Oswald, A. (2005). Striga control—technologies and their dissemination. Crop Protection 24(4), 333–342.
Pierce, F. J., Larson, W. E., Dowdy, R. H. & Graham, W. A. P. (1983). Productivity of soils: assessing long-term changes due to erosion. Journal of Soil & Water Conservation 38(1), 39–44.
Pinitpaitoon, S., Suwanarit, A. & Bell, R. W. (2011). A framework for determining the efficient combination of organic materials and mineral fertilizer applied in maize cropping. Field Crops Research 124(3), 302–315.
Place, F., Barrett, C. B., Freeman, H. A., Ramisch, J. J. & Vanlauwe, B. (2003). Prospects for integrated soil fertility management using organic and inorganic inputs: evidence from smallholder African agricultural systems. Food Policy 28(4), 365–378.
Rasool, R., Kukal, S. S. & Hira, G. S. (2008). Soil organic carbon and physical properties as affected by long-term application of FYM and inorganic fertilizers in maize–wheat system. Soil and Tillage Research 101(1–2), 31–36.
Reuter, G. (1994). Improvement of sandy soils by clay-substrate application. Applied Clay Science 9(2), 107–120.
Rosegrant M.W., Msangi S., Ringler C., Sulser T.B., Zhu T. & Cline S.A. (2008). International Model for Policy Analysis of Agricultural Commodities and Trade (IMPACT): Model Description. International Food Policy Research Institute, Washington D.C. [online],. Available from: http://www.ifpri.org/themes/impact/impactwater.pdf. [Accessed 2012-05-01].
Sanchez, P. A. (2002). Soil fertility and hunger in Africa. Science 295(5562), 2019–2020.
Sauerborn, J. (1991). Parasitic flowering plants: ecology and management. [online],. Available from: http://www.cabdirect.org/abstracts/19922325777.html;jsessionid=1FE9E40BCB37BAA8599F302A61A2B3E0?freeview=true. [Accessed 2012-11-28].
Shepherd, K. D. & Soule, M. J. (1998). Soil fertility management in west Kenya: dynamic simulation of productivity, profitability and sustainability at different resource endowment levels. Agriculture Ecosystems & Environment 71(1-3), 131–145.
Shisanya, C. A., Mucheru, M. W., Mugendi, D. N. & Kung’u, J. B. (2009). Effect of organic and inorganic nutrient sources on soil mineral nitrogen and maize yields in central highlands of Kenya. Soil and Tillage Research 103(2), 239–246.
Sileshi, G., Akinnifesi, F. K., Debusho, L. K., Beedy, T., Ajayi, O. C. & Mong’omba, S. (2010). Variation in maize yield gaps with plant nutrient inputs, soil type and climate across sub-Saharan Africa. Field Crops Research 116(1–2), 1–13.

37/48
Tittonell, P., Vanlauwe, B., Leffelaar, P. A., Rowe, E. C. & Giller, K. E. (2005). Exploring diversity in soil fertility management of smallholder farms in western Kenya: I. Heterogeneity at region and farm scale. Agriculture, Ecosystems & Environment 110(3–4), 149–165.
Vanlauwe, B. & Giller, K. (2006). Popular myths around soil fertility management in sub-Saharan Africa. Agriculture, Ecosystems & Environment 116(1-2), 34–46.
Vanlauwe, B., Kanampiu, F., Odhiambo, G. D., De Groote, H., Wadhams, L. J. & Khan, Z. R. (2008). Integrated management of Striga hermonthica, stemborers, and declining soil fertility in western Kenya. Field Crops Research 107(2), 102–115.
Vanlauwe, B., Tittonell, P. & Mukalama, J. (2006). Within-farm soil fertility gradients affect response of maize to fertiliser application in western Kenya. Nutrient Cycling in Agroecosystems 76(2), 171–182.
Vanlauwe, B. (2004). Integrated soil fertility management research at TSBF: the framework, the principles and their application. Academy Science Publishers A. Bationo (Ed.), Managing Nutrient Cycles to Sustain Soil Fertility in sub-Saharan Africa, 25–42.
Walkley, A. (1946). A critical examination of a rapid method for determination, organic carbon in soils: effects of variations in digestion conditious and organic soils constituints. Soil Science (63), 251–263.
Watson, C. a., Atkinson, D., Gosling, P., Jackson, L. r. & Rayns, F. w. (2002). Managing soil fertility in organic farming systems. Soil Use and Management 18, 239–247.
Wikipedia. Map of Kenya. [online] (2011). Available from: http://en.wikipedia.org/wiki/File:Western_in_Kenya.svg. [Accessed 2013-01-07].
Wilkinson, G. E. & Aina, P. O. (1976). Infiltration of water into two nigerian soils under secondary forest and subsequent arable cropping. Geoderma 15(1), 51–59.
Yoder, R.E. (1936). A direct method of aggregate analysis of soils and a study of the physical nature of erosion losses. J. Am. Soc. Agron. 28, 337–351.
Yu, H., Ding, W., Luo, J., Geng, R. & Cai, Z. (2012). Long-term application of organic manure and mineral fertilizers on aggregation and aggregate-associated carbon in a sandy loam soil. Soil and Tillage Research 124(0), 170–177.
Zebarth, B. J., Neilsen, G. H., Hogue, E. & Neilsen, D. (1999). Influence of organic waste amendments on selected soil physical and chemical properties. Canadian Journal of Soil Science 79(3), 501–504.
Zingore, S., Murwira, H. K., Delve, R. J. & Giller, K. E. (2007). Influence of nutrient management strategies on variability of soil fertility, crop yields and nutrient balances on smallholder farms in Zimbabwe. Agriculture, Ecosystems & Environment 119(1–2), 112–126.

38/48
10. Appendices
Appendix 1. Total annual rainfall in mm during the duration of the project from 1998 to 2011
Nyalgunga Nyabeda Vihiga year SI/Y1/B1 SI/Y1/B2 SI/Y1/C1 SI/Y1/C3 SI/Y2/A1 SI/Y2/A2 SI/Y2/B2 SI/Y2/C2 VI/Y2/0 VI/Y2/A3 VI/Y2/B1 VI/Y2/C1
1998 1908 1908 1709 1908 1908 1908 1908 1908 1969 1969 1969 1969 1999 2104 2104 1893 2104 2104 2104 2104 2104 2043 2043 2043 2043 2000 1723 1723 1538 1723 1723 1723 1723 1723 1699 1699 1699 1699 2001 1873 1873 1713 1873 1873 1873 1873 1873 1874 1874 1874 1874 2002 2000 2000 1802 2000 2000 2000 2000 2000 1983 1983 1983 1983 2003 1811 1811 1687 1811 1811 1811 1811 1811 1727 1727 1727 1727 2004 1595 1595 1479 1595 1595 1595 1595 1595 1612 1612 1612 1612 2005 1485 1485 1408 1485 1485 1485 1485 1485 1437 1437 1437 1437 2006 2668 2668 2358 2668 2668 2668 2668 2668 2573 2573 2573 2573 2007 1782 1782 1659 1782 1782 1782 1782 1782 1874 1874 1874 1874 2008 1982 1982 1800 1982 1982 1982 1982 1982 1978 1978 1978 1978 2009 1712 1712 1542 1712 1712 1712 1712 1712 1797 1797 1797 1797 2010 1868 1868 1598 1868 1868 1868 1868 1868 2097 2097 2097 2097 2011 2024 2024 1691 2024 2024 2024 2024 2024 2087 2087 2087 2087 Mean 1895 1895 1705 1895 1895 1895 1895 1895 1911 1911 1911 1911

39/48
Appendix 2. Total Results of the maize yield, soil physical soil properties and organic carbon content in the soil
Location Farm Fertility Level
Treat- ment
Maize yield
Aggregate stability
Soil Organic Carbon Clay Sand Silt Texture class Infiltration
rate Bulk
density [kg/ha] [%] [%] [%] [%] [%] [cm/min] [g/cm³] Nyalgunga SI/Y1/B1 H T2 2533.0 55.09 1.10 39.6 48.4 12.0 sandy clay Nyalgunga SI/Y1/B1 H T4 2863.2 1.24 41.6 46.4 12.0 sandy clay Nyalgunga SI/Y1/B1 H T5 4426.9 15.64 1.83 41.6 46.4 12.0 sandy clay Nyalgunga SI/Y1/B1 L T2 820.7 55.09 1.10 41.6 48.4 10.0 sandy clay Nyalgunga SI/Y1/B1 L T4 2537.8 57.31 1.17 45.6 46.5 8.0 sandy clay Nyalgunga SI/Y1/B1 L T5 5119.1 39.00 2.17 66.4 16.1 17.5 clay Nyalgunga SI/Y1/B2 H T2 972.7 17.91 1.66 31.6 58.4 10.0 sandy clay loam 0.27 1.21 Nyalgunga SI/Y1/B2 H T4 2700.9 17.27 1.37 27.6 62.4 10.0 sandy clay loam 1.13 Nyalgunga SI/Y1/B2 H T5 2730.9 79.22 2.47 29.6 60.5 10.0 sandy clay loam 0.47 1.27 Nyalgunga SI/Y1/B2 L T2 2508.5 34.11 1.29 37.6 50.4 12.0 sandy clay 0.47 1.09 Nyalgunga SI/Y1/B2 L T4 4479.0 28.10 1.13 39.6 48.4 12.0 sandy clay 1.10 Nyalgunga SI/Y1/B2 L T5 6536.2 22.21 2.13 37.6 50.4 12.0 sandy clay 0.40 1.12 Nyalgunga SI/Y1/C1 H T2 1475.1 42.96 0.83 43.6 44.5 12.0 clay 0.57 1.20 Nyalgunga SI/Y1/C1 H T4 2219.4 39.79 1.03 37.6 50.4 12.0 sandy clay 1.11 Nyalgunga SI/Y1/C1 H T5 2805.7 35.52 1.65 60.4 24.0 15.6 clay 0.55 1.14 Nyalgunga SI/Y1/C1 L T2 2574.3 31.11 1.01 39.6 48.4 12.0 sandy clay 0.61 1.23 Nyalgunga SI/Y1/C1 L T4 4729.1 0.77 43.6 48.4 8.0 sandy clay 1.07 Nyalgunga SI/Y1/C1 L T5 4252.8 1.61 41.6 48.4 10.0 sandy clay 0.48 1.20 Nyalgunga SI/Y1/C3 H T2 51.8 34.97 0.92 33.6 54.4 12.0 sandy clay loam 0.09 1.06 Nyalgunga SI/Y1/C3 H T4 643.8 26.45 0.90 29.6 54.4 16.0 sandy clay loam 1.32 Nyalgunga SI/Y1/C3 H T5 164.9 40.16 1.50 35.6 52.4 12.0 sandy clay 0.27 1.21 Nyalgunga SI/Y1/C3 L T2 45.94 0.83 41.6 48.4 10.0 sandy clay 0.23 1.23 Nyalgunga SI/Y1/C3 L T4 44.30 0.83 39.6 50.4 10.0 sandy clay 1.19 Nyalgunga SI/Y1/C3 L T5 16.38 1.91 35.6 52.5 12.0 sandy clay 0.23 1.16 Nyabeda SI/Y2/A1 H T2 743.6 47.01 1.61 41.6 46.4 12.0 sandy clay 0.63 1.14 Nyabeda SI/Y2/A1 H T4 3579.5 1.71 41.6 46.4 12.0 sandy clay 1.14 Nyabeda SI/Y2/A1 H T5 2487.0 2.28 41.6 46.4 12.0 sandy clay 0.60 1.11 Nyabeda SI/Y2/A1 L T2 1450.8 59.60 2.03 41.5 46.5 12.0 sandy clay 0.57 1.03 Nyabeda SI/Y2/A1 L T4 1225.0 43.07 1.39 43.6 46.4 10.0 sandy clay 1.03 Nyabeda SI/Y2/A1 L T5 3399.7 36.11 2.25 41.6 46.4 12.0 sandy clay 0.34 1.24

40/48
Location Farm Fertility Level
Treat- ment
Maize yield
Aggregate stability
Soil Organic Carbon Clay Sand Silt Texture class Infiltration
rate Bulk
density [kg/ha] [%] [%] [%] [%] [%] [cm/min] [g/cm³] Nyabeda SI/Y2/A2 H T2 1333.3 34.67 1.89 39.6 46.4 14.0 sandy clay Nyabeda SI/Y2/A2 H T4 1982.6 60.58 2.12 41.6 46.4 12.0 sandy clay Nyabeda SI/Y2/A2 H T5 3159.6 62.87 2.66 39.6 48.4 12.0 sandy clay Nyabeda SI/Y2/A2 L T2 1660.8 49.95 1.80 39.6 46.4 14.0 sandy clay Nyabeda SI/Y2/A2 L T4 1143.4 56.92 1.75 41.6 46.4 12.0 sandy clay Nyabeda SI/Y2/A2 L T5 3259.1 39.30 2.58 39.6 46.4 14.0 sandy clay Nyabeda SI/Y2/B2 H T2 1273.7 1.34 37.6 48.4 14.0 sandy clay 0.42 1.14 Nyabeda SI/Y2/B2 H T4 2922.0 51.26 1.41 21.6 70.4 8.0 sandy clay loam 1.20 Nyabeda SI/Y2/B2 H T5 2629.1 50.00 2.02 35.6 50.5 14.0 sandy clay 0.53 1.18 Nyabeda SI/Y2/B2 L T2 1326.2 34.99 1.29 39.6 48.4 12.0 sandy clay 0.50 1.22 Nyabeda SI/Y2/B2 L T4 1879.3 61.70 1.52 37.5 48.5 14.0 sandy clay 1.16 Nyabeda SI/Y2/B2 L T5 2096.9 2.13 58.4 22.0 19.5 clay 0.33 1.19 Nyabeda SI/Y2/C2 H T2 479.0 49.02 1.61 43.6 44.4 12.0 clay 0.27 1.06 Nyabeda SI/Y2/C2 H T4 335.3 37.61 1.54 39.5 46.5 14.0 sandy clay 1.16 Nyabeda SI/Y2/C2 H T5 2080.7 37.84 2.13 37.6 50.4 12.0 sandy clay 0.28 1.02 Nyabeda SI/Y2/C2 L T2 80.2 1.80 39.6 46.4 14.0 sandy clay 0.21 1.09 Nyabeda SI/Y2/C2 L T4 512.8 56.74 1.43 41.5 48.5 10.0 sandy clay 1.15 Nyabeda SI/Y2/C2 L T5 2205.3 42.14 2.10 39.6 48.4 12.0 sandy clay 0.23 1.03 Vihiga VI/Y2/0 H T2 158.8 23.25 0.64 25.6 68.4 6.0 sandy clay loam Vihiga VI/Y2/0 H T4 892.7 39.98 1.13 27.6 64.4 8.0 sandy clay loam Vihiga VI/Y2/0 H T5 1508.7 34.48 1.53 34.7 53.7 11.6 sandy clay loam Vihiga VI/Y2/0 L T2 481.1 51.51 1.24 29.6 56.4 14.0 sandy clay loam Vihiga VI/Y2/0 L T4 1333.0 42.39 1.35 29.6 60.4 10.0 sandy clay loam Vihiga VI/Y2/0 L T5 2177.1 15.26 2.02 31.6 58.4 10.0 sandy clay loam Vihiga VI/Y2/A3 H T2 3.8 24.01 1.15 31.6 56.4 12.0 sandy clay loam Vihiga VI/Y2/A3 H T4 584.4 41.06 1.32 29.6 56.4 14.0 sandy clay loam Vihiga VI/Y2/A3 H T5 1063.7 2.10 33.6 56.4 10.0 sandy clay loam Vihiga VI/Y2/A3 L T2 164.3 32.42 1.34 33.6 56.4 10.0 sandy clay loam Vihiga VI/Y2/A3 L T4 76.2 48.52 1.58 33.5 56.5 10.0 sandy clay loam Vihiga VI/Y2/A3 L T5 1945.7 35.40 2.36 31.6 56.4 12.0 sandy clay loam Vihiga VI/Y2/B1 H T2 163.3 30.75 1.29 29.6 60.4 10.0 sandy clay loam 0.30 1.19 Vihiga VI/Y2/B1 H T4 685.3 33.79 1.13 31.6 60.4 8.0 sandy clay loam 1.22

41/48
Location Farm Fertility Level
Treat- ment
Maize yield
Aggregate stability
Soil Organic Carbon Clay Sand Silt Texture class Infiltration
rate Bulk
density [kg/ha] [%] [%] [%] [%] [%] [cm/min] [g/cm³] Vihiga VI/Y2/B1 H T5 1451.2 37.40 1.98 29.6 60.4 10.0 sandy clay loam 0.43 1.17 Vihiga VI/Y2/B1 L T2 483.9 31.38 1.43 29.6 60.4 10.0 sandy clay loam 0.33 1.19 Vihiga VI/Y2/B1 L T4 2332.8 50.43 1.69 31.6 60.4 8.0 sandy clay loam 1.25 Vihiga VI/Y2/B1 L T5 1234.1 45.66 1.98 21.6 66.4 12.0 sandy clay loam 0.29 1.22 Vihiga VI/Y2/C1 H T2 728.0 35.91 1.38 31.6 54.4 14.0 sandy clay loam Vihiga VI/Y2/C1 H T4 957.3 45.13 1.30 31.6 56.4 12.0 sandy clay loam Vihiga VI/Y2/C1 H T5 1170.1 56.29 2.17 35.6 54.5 10.0 sandy clay Vihiga VI/Y2/C1 L T2 610.0 31.09 1.10 29.6 58.4 12.0 sandy clay loam Vihiga VI/Y2/C1 L T4 928.7 48.96 1.07 33.6 58.4 8.0 sandy clay loam Vihiga VI/Y2/C1 L T5 2137.6 2.21 33.6 56.4 10.0 sandy clay loam

42/48
Appendix 3. Total results of the Crop Evapotranspiration and Water Balance
Nyalgunga Nyabeda Vihiga
Crop stage Day Rainfall [mm/d]
ETc [mm/d]
Water Balance [mm/d]
Rainfall [mm/d]
ETc [mm/d]
Water Balance [mm/d]
Rainfall [mm/d]
ETc [mm/d]
Water Balance [mm/d]
initial 1 0.00 2.44 -2.44 10.25 2.33 7.92 2.56 3.95 -1.39 2 0.00 2.44 -2.44 0.00 2.33 -2.33 1.60 3.95 -2.35 3 0.00 2.44 -2.44 0.00 2.33 -2.33 0.00 3.95 -3.95 4 0.00 2.44 -2.44 0.00 2.33 -2.33 7.61 3.95 3.66 5 11.90 2.44 9.45 0.00 2.33 -2.33 20.69 3.95 16.74 6 13.93 2.44 11.49 11.76 2.33 9.43 0.49 3.95 -3.46 7 0.00 2.44 -2.44 18.58 2.33 16.25 0.00 3.95 -3.95 8 0.00 2.44 -2.44 0.00 2.33 -2.33 0.00 3.95 -3.95 9 0.29 2.44 -2.16 0.00 2.33 -2.33 0.00 3.95 -3.95 10 0.00 2.44 -2.44 0.00 2.33 -2.33 7.07 3.95 3.12 11 12.50 2.44 10.06 0.00 2.33 -2.33 5.03 3.95 1.08 12 2.89 2.44 0.45 15.19 2.33 12.86 0.00 3.95 -3.95 13 0.00 2.44 -2.44 3.86 2.33 1.53 21.07 3.95 17.12 14 7.13 2.44 4.69 0.00 2.33 -2.33 2.66 3.95 -1.29 15 1.45 2.44 -0.99 9.51 2.33 7.18 9.68 3.95 5.73 16 11.31 2.44 8.87 0.68 2.33 -1.65 17.40 3.95 13.45 17 27.08 2.44 24.64 11.21 2.33 8.88 4.38 3.95 0.43 18 11.25 2.44 8.80 26.73 2.33 24.40 2.60 4.13 -1.53 19 0.37 2.62 -2.25 10.27 2.33 7.94 12.85 4.13 8.72 20 8.56 2.62 5.94 0.00 2.50 -2.50 13.47 4.13 9.34 development 21 10.08 2.68 7.40 6.51 2.56 3.95 0.00 4.13 -4.13 22 3.25 2.74 0.51 12.13 2.62 9.51 13.47 4.13 9.34 23 17.08 2.80 14.28 4.33 2.68 1.65 26.91 4.13 22.78 24 10.88 2.86 8.03 21.35 2.75 18.60 0.00 4.13 -4.13 25 0.00 2.91 -2.91 12.06 2.81 9.25 0.00 4.13 -4.13 26 0.00 2.97 -2.97 0.00 2.87 -2.87 0.00 4.13 -4.13 27 0.00 3.03 -3.03 0.00 2.93 -2.93 5.86 4.14 1.72 28 0.00 3.09 -3.09 0.00 2.99 -2.99 0.00 4.14 -4.14 29 1.36 3.15 -1.79 0.00 3.06 -3.06 0.00 4.14 -4.14

43/48
Nyalgunga Nyabeda Vihiga
Crop stage Day Rainfall [mm/d]
ETc [mm/d]
Water Balance [mm/d]
Rainfall [mm/d]
ETc [mm/d]
Water Balance [mm/d]
Rainfall [mm/d]
ETc [mm/d]
Water Balance [mm/d]
development 30 0.00 3.21 -3.21 1.65 3.12 -1.47 9.24 4.14 5.10 31 23.34 3.27 20.07 0.00 3.18 -3.18 9.32 4.14 5.18 32 20.51 3.33 17.19 22.77 3.24 19.53 11.34 4.14 7.20 33 6.98 3.39 3.60 18.77 3.31 15.46 0.00 4.15 -4.15 34 0.20 3.44 -3.24 8.99 3.37 5.62 0.00 4.15 -4.15 35 5.51 3.50 2.01 0.00 3.43 -3.43 0.98 4.15 -3.17 36 20.43 3.56 16.87 2.58 3.49 -0.91 51.95 4.15 47.80 37 16.74 3.62 13.12 7.77 3.56 4.21 0.77 4.15 -3.38 38 0.00 3.68 -3.68 20.39 3.62 16.77 0.68 4.15 -3.47 39 0.00 3.74 -3.74 0.00 3.68 -3.68 0.00 4.16 -4.16 40 1.81 3.80 -1.99 0.00 3.74 -3.74 0.00 4.16 -4.16 41 0.00 3.86 -3.86 2.41 3.81 -1.40 8.29 4.16 4.13 42 9.20 3.91 5.29 0.00 3.87 -3.87 3.79 4.16 -0.37 43 1.71 3.97 -2.26 7.80 3.93 3.87 8.32 4.16 4.16 44 2.08 4.03 -1.95 2.28 3.99 -1.71 13.47 4.16 9.31 45 7.78 4.09 3.68 2.08 4.05 -1.97 2.16 4.16 -2.00 46 3.90 4.15 -0.25 8.56 4.12 4.44 7.96 4.17 3.79 47 11.40 4.21 7.19 4.99 4.18 0.81 2.66 4.17 -1.51 48 7.11 4.27 2.85 12.79 4.24 8.55 0.00 4.17 -4.17 49 2.94 4.33 -1.38 8.06 4.30 3.76 29.90 3.96 25.94 50 38.05 4.56 33.48 3.01 4.37 -1.36 36.44 3.96 32.48 51 4.99 4.63 0.36 42.95 4.61 38.34 81.35 3.97 77.38 52 56.93 4.69 52.24 6.31 4.67 1.64 4.50 3.97 0.53 53 2.09 4.75 -2.65 69.30 4.74 64.56 12.12 3.97 8.15 54 33.01 4.81 28.20 2.35 4.80 -2.45 10.51 3.97 6.54 55 1.61 4.87 -3.26 31.77 4.87 26.90 0.00 3.97 -3.97 mid 56 11.84 4.87 6.97 2.13 4.87 -2.74 17.55 3.97 13.58 57 5.76 4.87 0.89 13.08 4.87 8.21 11.93 3.97 7.96 58 15.46 4.87 10.59 4.25 4.87 -0.62 21.82 3.97 17.85 59 30.96 4.87 26.09 15.46 4.87 10.59 0.00 3.97 -3.97 60 2.40 4.87 -2.47 29.96 4.87 25.09 7.43 3.97 3.46

44/48
Nyalgunga Nyabeda Vihiga
Crop stage Day Rainfall [mm/d]
ETc [mm/d]
Water Balance [mm/d]
Rainfall [mm/d]
ETc [mm/d]
Water Balance [mm/d]
Rainfall [mm/d]
ETc [mm/d]
Water Balance [mm/d]
mid 61 1.88 4.87 -2.99 0.00 4.87 -4.87 0.00 3.97 -3.97 62 4.12 4.87 -0.75 2.51 4.87 -2.36 2.08 3.97 -1.89 63 6.33 4.87 1.46 3.74 4.87 -1.13 0.00 3.97 -3.97 64 0.00 4.87 -4.87 7.86 4.87 2.99 0.00 3.97 -3.97 65 0.00 4.87 -4.87 0.00 4.87 -4.87 0.00 3.97 -3.97 66 30.72 4.87 25.85 0.00 4.87 -4.87 3.73 3.97 -0.24 67 4.27 4.87 -0.60 31.22 4.87 26.35 0.00 3.97 -3.97 68 0.00 4.87 -4.87 0.00 4.87 -4.87 33.90 3.97 29.93 69 17.28 4.87 12.41 0.00 4.87 -4.87 16.51 3.97 12.54 70 6.77 4.87 1.90 20.33 4.87 15.46 5.19 3.97 1.22 71 7.56 4.87 2.69 8.28 4.87 3.41 16.78 3.97 12.81 72 12.44 4.87 7.56 5.96 4.87 1.09 13.12 3.97 9.15 73 52.36 4.87 47.49 14.76 4.87 9.89 5.27 3.97 1.30 74 4.47 4.87 -0.40 59.86 4.87 54.99 0.00 3.97 -3.97 75 0.00 4.87 -4.87 4.25 4.87 -0.62 0.54 3.97 -3.43 76 0.00 4.87 -4.87 0.00 4.87 -4.87 4.12 3.97 0.15 77 0.00 4.87 -4.87 0.00 4.87 -4.87 23.40 3.97 19.43 78 12.08 4.87 7.21 0.00 4.87 -4.87 1.54 3.97 -2.43 79 6.39 4.87 1.52 11.66 4.87 6.79 1.82 4.25 -2.43 80 0.24 4.78 -4.54 5.54 4.87 0.67 4.15 4.25 -0.10 81 0.00 4.78 -4.78 0.32 4.78 -4.46 1.35 4.25 -2.90 82 2.47 4.78 -2.31 0.00 4.78 -4.78 4.91 4.25 0.66 83 4.02 4.78 -0.76 1.90 4.78 -2.88 3.18 4.25 -1.07 84 3.38 4.78 -1.41 4.88 4.78 0.10 0.00 4.25 -4.25 85 12.85 4.78 8.07 4.30 4.78 -0.48 2.45 4.25 -1.80 86 4.57 4.78 -0.21 9.75 4.78 4.97 0.00 4.25 -4.25 87 0.00 4.78 -4.78 6.09 4.78 1.31 0.00 4.25 -4.25 88 0.00 4.78 -4.78 0.00 4.78 -4.78 5.27 4.25 1.02 89 0.53 4.78 -4.25 0.00 4.78 -4.78 5.07 4.25 0.82 90 2.22 4.78 -2.56 0.00 4.78 -4.78 5.84 4.25 1.59 91 3.22 4.78 -1.56 2.96 4.78 -1.82 7.16 4.25 2.91

45/48
Nyalgunga Nyabeda Vihiga
Crop stage Day Rainfall [mm/d]
ETc [mm/d]
Water Balance [mm/d]
Rainfall [mm/d]
ETc [mm/d]
Water Balance [mm/d]
Rainfall [mm/d]
ETc [mm/d]
Water Balance [mm/d]
mid 92 0.28 4.78 -4.51 3.38 4.78 -1.40 1.87 4.25 -2.38 93 2.08 4.78 -2.70 0.00 4.78 -4.78 4.15 4.25 -0.10 94 4.34 4.78 -0.44 0.66 4.78 -4.12 0.00 4.25 -4.25 95 1.33 4.78 -3.45 5.79 4.78 1.01 1.45 4.25 -2.80 late 96 0.03 4.69 -4.66 0.56 4.68 -4.12 0.00 4.16 -4.16 97 7.30 4.60 2.69 0.00 4.59 -4.59 0.00 4.08 -4.08 98 2.22 4.52 -2.30 8.05 4.49 3.56 0.00 4.00 -4.00 99 0.00 4.43 -4.43 2.96 4.40 -1.44 1.40 3.92 -2.52 100 0.00 4.34 -4.34 0.00 4.30 -4.30 0.00 3.84 -3.84 101 0.00 4.25 -4.25 0.00 4.21 -4.21 0.00 3.76 -3.76 102 0.00 4.16 -4.16 0.00 4.11 -4.11 0.00 3.68 -3.68 103 0.00 4.08 -4.08 0.00 4.02 -4.02 0.00 3.59 -3.59 104 1.42 3.99 -2.56 0.00 3.92 -3.92 13.19 3.51 9.68 105 3.39 3.90 -0.51 1.90 3.83 -1.93 1.57 3.43 -1.86 106 0.36 3.81 -3.45 4.52 3.73 0.79 1.52 3.35 -1.83 107 0.08 3.72 -3.65 0.00 3.64 -3.64 0.00 3.27 -3.27 108 0.00 3.64 -3.64 0.10 3.54 -3.44 0.00 3.19 -3.19 109 0.00 3.55 -3.55 0.00 3.45 -3.45 0.00 3.11 -3.11 110 0.00 3.46 -3.46 0.00 3.35 -3.35 0.00 3.09 -3.09 111 0.07 3.57 -3.50 0.00 3.26 -3.26 0.00 3.00 -3.00 112 0.00 3.48 -3.48 0.09 3.35 -3.26 0.00 2.92 -2.92 113 0.00 3.38 -3.38 0.00 3.25 -3.25 0.00 2.84 -2.84 114 0.00 3.29 -3.29 0.00 3.15 -3.15 0.00 2.76 -2.76 115 0.00 3.20 -3.20 0.00 3.05 -3.05 0.00 2.67 -2.67 116 0.00 3.11 -3.11 0.00 2.95 -2.95 0.00 2.59 -2.59 117 0.00 3.01 -3.01 0.00 2.85 -2.85 0.00 2.51 -2.51 118 0.00 2.92 -2.92 0.00 2.75 -2.75 0.00 2.42 -2.42 119 0.00 2.83 -2.83 0.00 2.65 -2.65 0.00 2.34 -2.34 120 0.00 2.73 -2.73 0.00 2.54 -2.54 0.00 2.26 -2.26 121 2.47 2.64 -0.16 0.00 2.44 -2.44 0.00 2.17 -2.17 122 0.00 2.55 -2.55 0.00 0.00 0.00 0.00 2.09 -2.09

46/48
Nyalgunga Nyabeda Vihiga
Crop stage Day Rainfall [mm/d]
ETc [mm/d]
Water Balance [mm/d]
Rainfall [mm/d]
ETc [mm/d]
Water Balance [mm/d]
Rainfall [mm/d]
ETc [mm/d]
Water Balance [mm/d]
late 123 0.00 2.45 -2.45 - - - 0.00 2.01 -2.01 124 - - - - - - 0.00 1.92 -1.92 125 - - - - - - 0.00 1.84 -1.84

47/48
Appendix 4. Manual for the Soil texture determination by the hydrometer method at the lab of CIAT-TSBF in Nairobi
Equipment Balance, 0.01 g readability Reciprocal mechanical shaker Hot water bath
Supplies
Bouyoucos soil hydrometer ASTM 15H, graduated in g/L Measuring cylinders, 1000 mL, one per soil sample Plastic beakers, 400 mL, one per soil sample Wash bottle Thermometer, 0 to 110C Watch glasses to fit 400 mL beakers Stop watch Glass or plastic stirring rods fitted with rubber tips, one per soil sample
Rubber stoppers to fit measuring cylinders, or plunger and rod to fit cylinders, for mixing soil suspensions.
Volumetric flasks, 1000 mL Stopwatch, or clock with sweep second hand
Chemicals
Hydrogen peroxide, 30% solution, GPR grade Amyl alcohol Sodium hexametaphosphate, technical grade
Reagents
Sodium hexametaphosphate, 10% solution: Dissolve 100 g of sodium hexametaphosphate in 1 litre of distilled water. This solution should not be stored over one month.
Procedure
Weigh 50 ± 0.5 g of air-dry soil, sieved to pass a 2 mm sieve, into a 400 mL beaker. If soil is very sandy, use 100 g of soil. In each batch of 35 samples, include 2 standard soil samples and one blank.
Add 125 mL of distilled water and stir the mixture to wet the soil thoroughly. Then place beakers with soil into a hot water bath at 85 to 90C.
Add 5 mL 30% hydrogen peroxide and stir gently with a stirring rod. If necessary, add 1 or more drops of amyl alcohol to minimize foaming. Cover with a watch glass. Add further 5-mL portions of hydrogen peroxide until reaction (frothing) ceases, indicating complete destruction of organic matter. Unless soil is high in organic matter, about 20 mL total of hydrogen peroxide is usually sufficient. Heat the beakers for a short while longer, until no more bubbles appear. Ensure that the hydrogen peroxide is fully destroyed, as bubbles from residual hydrogen peroxide will cause erroneous hydrometer readings.
Remove the beakers from the water bath and allow to cool to room temperature.
Add 10 mL of 10% sodium hexametaphosphate solution to each sample. Allow to stand for 10 minutes.
Transfer the samples to leak-proof bottles and shake overnight on a flat-bed or end-over-end shaker.
Quantitatively transfer the suspension into a 1000 mL measuring cylinder, using distilled water to wash all soil particles into the cylinder. Fill to the 1000 mL mark with distilled water.
Prepare a blank cylinder containing 10 mL of 10% sodium hexametaphosphate solution, and fill to 1000 mL with distilled water.
Thoroughly mix the cylinders by fitting with a rubber bung and inverting
the cylinder 10 times. Alternatively, the cylinders may be mixed with a circular plunger attached to a metal or wooden rod. Start the stopwatch immediately when mixing is complete.
After mixing, quickly add 2 to 3 drops of amyl alcohol to the cylinder, and after 20 seconds place the hydrometer gently into the suspension.
At 40 seconds, take a hydrometer reading and measure the temperature of the suspension. Also take a hydrometer reading in the blank cylinder.

48/48
Allow the cylinders to stand undisturbed for two hours. Avoid locations which are windy or in direct sun. After two hours, take hydrometer and temperature readings in both sample and blank cylinders.
Calculations
Corrected hydrometer readings
Corrected hydrometer reading at 40 seconds (PSH40COR):
(PSH40SAM - PSH40BLK) + [(PST40 - 20) 0.36]
Corrected hydrometer reading at 2 hours (PSH2HCOR):
(PSH2HSAM - PSH2HBLK) + [(PST2H - 20) 0.36]
where PSH40SAM = Hydrometer reading at 40 seconds for sample PSH40BLK = Hydrometer reading at 40 seconds for blank PST40 = Temperature at 40 seconds PSH2HSAM = Hydrometer reading at 2 hours for sample PSH2HBLK = Hydrometer reading at 2 hours for blank PST2H = Temperature at 2 hours
Percent clay (CLAY)
(PSH2HCOR) 100 PSSLWT
where PSSLWT = Weight of air dry soil (g)
Percent sand (SAND)
100 - [(PSH40COR) 100]
PSSLWT
Percent silt (SILT)
100 - SAND – CLAY
Quality Control Two standard samples- Katumani soil and Chuka soil are used to verify
the repeatability of analysis. The results should be entered into the standards sheet and should be within 10% of the median value.
Sample repeats are carried out within each batch of 33 samples. The variation within the repeats should be less than 5%. If greater, the analysis must be repeated as it indicates that the results are not repeatable. The variation is calculated as
Variation %= Stdev *100 Average
Disposal practices
The soil samples should be disposed in the soil bucket for eventual disposal into the soil pit. The plastics and glassware should be allowed to stand in tap water before being washed using the lab procedure for cleaning of glassware document reference SPLAB/QP/5.1/01