organo-mineral interactions are more important for organic
TRANSCRIPT
Article
Organo-Mineral Interactions Are More Important forOrganic Matter Retention in Subsoil Than Topsoil
Vincent Poirier 1,*, Isabelle Basile-Doelsch 2 , Jérôme Balesdent 2, Daniel Borschneck 2 ,Joann K. Whalen 3 and Denis A. Angers 4
1 Unité de Recherche et Développement en Agriculture et Agroalimentaire de l’Abitibi-Témiscamingue,Université du Québec en Abitibi-Témiscamingue, 79 rue Côté, Notre-Dame-du-Nord, QC J0Z 3B0, Canada
2 Aix-Marseille Université, CNRS, IRD, INRA, Collège de France, CEREGE, Europôle Méditerranéen del’Arbois, BP 80, 13545 Aix-en-Provence, France; [email protected] (I.B.-D.); [email protected] (J.B.);[email protected] (D.B.)
3 Department of Natural Resource Sciences, Macdonald Campus of McGill University, 21111 Lakeshore Road,Ste-Anne-de-Bellevue, QC H9X 3V9, Canada; [email protected]
4 Quebec Research and Development Centre, Agriculture and Agri-Food Canada, 2560 Hochelaga Blvd.,Québec, QC G1V 2J3C, Canada; [email protected]
* Correspondence: [email protected]; Tel.: +1-819-762-0971 (ext. 5912)
Received: 30 September 2019; Accepted: 20 December 2019; Published: 7 January 2020�����������������
Abstract: Decomposing crop residues contribute to soil organic matter (SOM) accrual; however, thefactors driving the fate of carbon (C) and nitrogen (N) in soil fractions are still largely unknown,especially the influence of soil mineralogy and autochthonous organic matter concentration.The objectives of this work were (1) to evaluate the retention of C and N from crop residue inthe form of occluded and mineral-associated SOM in topsoil (0–20 cm) and subsoil (30–70 cm)previously incubated for 51 days with 13C-15N-labelled corn residues, and (2) to explore if specificminerals preferentially control the retention of residue-derived C and N in topsoil and subsoil. Weused topsoil and subsoil having similar texture and mineralogy as proxies for soils being rich (i.e.,topsoil) and poor (i.e., subsoil) in autochthonous organic matter. We performed a sequential densityfractionation procedure and measured residue-derived C and N in occluded and mineral-associatedSOM fractions, and used X-ray diffraction analysis of soil density fractions to investigate theirmineralogy. In accordance with our hypothesis, the retention of C and N from crop residue throughorgano-mineral interactions was greater in subsoil than topsoil. The same minerals were involved inthe retention of residue-derived organic matter in topsoil and subsoil, but the residue-derived organicmatter was associated with a denser fraction in the subsoil (i.e., 2.5–2.6 g cm−3) than in the topsoil (i.e.,2.3–2.5 g cm−3). In soils and soil horizons with high clay content and reactive minerals, we find that alow SOM concentration leads to the rapid stabilization of C and N from newly added crop residues.
Keywords: soil organic matter; crop residue; topsoil; subsoil; soil mineralogy; mineral-associated soilorganic matter
1. Introduction
Soil organic matter (SOM), the largest terrestrial carbon (C) pool and the main nitrogen (N) sourcefor plant growth, accumulates during plant residue decomposition and has the potential to improvesoil fertility and mitigate climate change [1–3]. SOM accumulates through two mechanisms—occlusionwithin soil aggregates and association with mineral surfaces [4–6]. Occluded SOM is enriched withC-rich, plant-like compounds and persists for decades, whereas mineral-associated SOM is enrichedwith N-rich, microbially processed compounds with a residence time of centuries [7–9]. Two key soil
Soil Syst. 2020, 4, 4; doi:10.3390/soilsystems4010004 www.mdpi.com/journal/soilsystems

Soil Syst. 2020, 4, 4 2 of 17
parameters determine whether plant residue will be occluded or transformed into mineral-associatedSOM, namely soil mineralogy and the amount of organic matter initially in the soil (i.e., autochthonousorganic matter).
Organic compounds adsorb to the reactive surfaces of soil minerals and are protected againstbiodegradation through organo-mineral interactions [5,6]. Soils with higher clay content and reactiveminerals (i.e., illite + chlorite, montmorillonite, vermiculite, and amorphous minerals [10,11]) areexpected to have a high specific surface area for adsorption of organic matter. Such soils have a highcapacity to retain C and N from crop residue as mineral-associated SOM [12,13]. The mineral-associatedSOM fraction in these soils is often quantified using the density-based separation method, sincemineral-associated SOM occurs in denser fractions of the soil (i.e., ρ > 1.9 g cm−3) [4,9,14,15]. However,quantifying the SOM associated with each type of reactive mineral present in soil is more complex.Sequential separation of the soil using predefined density thresholds is a way to partition themineral-associated fraction into subfractions with specific mineralogy [14,16,17]. This approach candistinguish SOM bound to different soil minerals within the mineral-associated fraction.
The concentration of autochthonous organic matter also affects the amount of residue-derived Cand N retained in mineral-associated SOM. For a given mineralogy, soils with a low SOM concentrationcontain more reactive mineral surfaces that are not occupied by autochthonous organic matter,and could retain more C and N from crop residue on mineral surfaces than soil with a high SOMconcentration [18,19]. The effect of autochthonous organic matter on residue-derived C and N retentioncan be tested using topsoil (i.e., 0–20 cm depth) and subsoil (i.e., >20 cm depth) from the same profile,which should have similar texture and mineralogy and the same historical agricultural practices [19–21].We expect the SOM-poor subsoil to retain more C and N from crop residue on mineral surfaces thanthe SOM-rich topsoil [22,23]. In the fine-textured soils of Eastern Canada, the subsoil contains aboutfive times less autochthonous organic C and total N than the topsoil, suggesting a greater capacity forresidue-derived C and N retention through organo-mineral interactions in the subsoil [13,18,21].
The objective of this work was to evaluate the retention of C and N from crop residue in theoccluded and mineral-associated SOM pools of topsoil and subsoil after 51 d of incubation with13C-15N-labelled corn residues [21]. We hypothesized that more residue-derived C and N would beretained in the mineral-associated SOM fraction of subsoil than topsoil. A secondary objective of thiswork was to determine if specific soil minerals bind preferentially to C and N from crop residue intopsoil and subsoil.
2. Materials and Methods
2.1. Soils and Incubation
Topsoil (0–20 cm depth) and subsoil (30–70 cm depth) were collected in fall 2007 from a heavy claysoil from the Kamouraska series under a barley crop (Hordeum vulgare L.) in Lévis, Québec, Canada(46◦48′ N, 71◦23′ W). The soil is considered a Haplic Gleysol according to the World Reference Base forSoil Resources system [24] and an Orthic Humic Gleysol according to the Canadian System of SoilClassification [25]. The topsoil and subsoil had similar texture and mineralogy, that is, they contained276 g kg−1 of silt (2–50 µm) and 665 g kg−1 of clay (<2 µm) with quartz, albite, microcline, amphibole,chlorite, vermiculite, and illite/muscovite as major minerals. Soil pH (1:2 soil-to-CaCl2 0.01 M ratio)was 5.2 in topsoil and 6.3 in subsoil. There was no inorganic C in topsoil and subsoil; soil organic Cconcentration was therefore equivalent to the total C concentration.
Samples for this study were topsoil and subsoil incubated for 51 d under aerobic conditionswith (10 g C kg−1 soil) or without (0 g C kg−1 soil) labelled corn residues. Briefly, 150 g of 6 mmsieved, air-dried topsoil and subsoil were placed in separate 1 L glass jars with 0 (control) and 3.45 g(equivalent to 10 g residue C kg−1 soil) of 13C-15N-labelled residues. The residue, from young cornshoots (Zea mays L. cv. Cargill 2610-L), contained 434 g C kg−1 and 16 g N kg−1, had a 13C isotopicsignature (δ13C) of 69.7%� and an atom% 15N (At%15N) of 7.4%, and a particle size of 0.1 mm to 1 mm.

Soil Syst. 2020, 4, 4 3 of 17
Soil-residue mixtures were moistened to −38 kPa and incubated at 25 ◦C for 51 d. For residue-amendedsoils, the soil-residue mixture was adjusted to a C/N ratio of 10 with KNO3. See Poirier et al. [21] forfurther details on incubation conditions.
2.2. Sequential Density Separation
Density thresholds were based on theoretical densities of organo-mineral complexes for majorsoil minerals, considering the mineral density and an arbitrary SOC concentration determined fromthe mineral’s capacity to adsorb SOM (using mineral specific surface area as a proxy). The detailedcalculation procedure is presented in Appendix A. According to the density thresholds of ρ = 1.9,2.1, 2.3, 2.5, and 2.6 g cm−3 (hereafter, density thresholds are reported without stating g cm−3) weprepared density separation solutions using LST Fastfloat (80% sodium heteropolytungstate) [26].Since undiluted LST is acidic (pH < 4.0), we added 0.14 ± 0.01 g NaOH g−1 undiluted LST to increasethe pH of density solutions to 6.6 ± 0.3.
Whole soil was separated into seven fractions. The first step separated the non-occluded lightfraction (NOLF) (ρ < 1.9). Air-dried soil (7.5 g) was weighed in a 30 mL polycarbonate Nalgene® OakRidge centrifuge tube (Thermo Fischer Scientific Inc., Waltham, MA, USA). After adding 20 mL ofρ = 1.9 LST, the contents were manually shaken end-to-end 20 times, allowed to settle overnight, thencentrifuged at 12,500× g for 10 to 26 min. Centrifugation time was determined according to Stokes’slaw based on (1) the particle size threshold of 0.2 µm, (2) the difference between the density of thesolution and the mineral particles, and (3) the viscosity of LST solutions [26]. Soil particles < 0.2 µm anddissolved organic matter were not recovered. The supernatant containing NOLF (ρ < 1.9) was siphonedfrom the tube, rinsed three times with 25 mL deionized water, and recovered by centrifugation, thenfreeze-dried prior to subsequent analysis.
The second step retrieved the occluded light fraction (OLF) (ρ < 1.9) by re-suspending the soilpellet with 18 mL of ρ = 1.9 LST solution and dispersing it by sonication in an ice bath. The soilsolution was first pulse sonicated (5.5 s on, 9.9 s off) for 30 s at 70% energy input (i.e., short duration,high energy) and then pulse sonicated (9.9 s on, 2.5 s off) for 4 min at 35% energy input (i.e., longduration, low energy). Next, the soil solution was centrifuged (128 min) at 12,500× g, the supernatantwas siphoned, a second 18 mL aliquot of ρ = 1.9 LST solution was added, and the long duration,low energy sonication was repeated before centrifuging and siphoning the supernatant. Total energyinput to the soil solution during OLF separation was 520 J ml−1. The combined OLF was dilutedwith 980 mL deionized water and concentrated by multiple centrifugations (26 min each). The OLFwas rinsed in 25 mL deionized water, pulse sonicated (short duration, high energy), and centrifuged(10 min). The rinsing step was repeated three times, resulting in a total energy input of 125 J ml−1, thenfreeze-dried before analysis.
The five subsequent steps isolated five density fractions (ρ = 1.9–2.1, 2.1–2.3, 2.3–2.5, 2.5–2.6, and>2.6) from the soil pellet. Each time, the remaining soil was re-suspended with 15 to 25 mL of therequired LST solution. The soil–LST mixture was pulse sonicated (short duration, high energy) andcentrifuged and the supernatant siphoned. Centrifugation times were 134, 150, 210, and 270 min for1.9–2.1, 2.1–2.3, 2.3–2.5, and 2.5–2.6 fractions, respectively. However, prolonged centrifugation for510 min occurred during the second separation of the 2.3–2.5 fraction since no distinct phases wereobserved after 210 min. Total energy input to the soil solution during density fraction separation was230 J ml−1. For each fraction, the density separation occurred twice and all supernatant was combined,diluted with 100 to 300 mL deionized water, and re-concentrated by multiple centrifugations (10 mineach). Density fractions were rinsed three times, recovered by centrifugation and freeze-dried prior toanalysis. Figure 1 illustrates how methodological fractions relate to functional fractions of SOM.

Soil Syst. 2020, 4, 4 4 of 17
Soil Syst. 2020, 4, x FOR PEER REVIEW 6 of 19
density fractions and about 46% of the residue-derived N in the density fractions, in both soils (Table 1). Most of residue-derived C and N was in the NOLF (43% and 18%, respectively) and OLF (23% and 15%, respectively; Table 1). Mineral-associated residue C and N accumulated preferentially in the 2.5–2.6 fraction of the subsoil and in the 2.3–2.5 fraction of topsoil (Table 1).
Figure 1. Fractionation scheme illustrating the methodological procedure and presumed functionalityof soil organic matter.
2.3. Mineralogical Analysis
Soil mineralogy was determined on randomly oriented powders with an X-ray diffractometer(X’Pert Pro MPD, PANalytical, Limeil-Brévannes, France) running at 40 kV and 40 mA using Co-Kα
radiation (λ = 1.79 Å) with a linear detector X’Celerator and a secondary flat monochromator. Samplesof whole soil and soil density fractions were crushed in an agate mortar, put in cylindrical aluminum

Soil Syst. 2020, 4, 4 5 of 17
holders, and spun at 15 rpm. A counting time of 3 s per 0.033◦ step was used for 2θ in the 3.5◦ to 80.0◦
range. The X’Pert High Score 3.0 software (Almelo, The Netherlands) [27] was used to identify minerals.
2.4. Carbon and Nitrogen Analyses
Soil organic C (SOC) and total soil N concentrations, δ13C and At%15N in density fractions, weremeasured using an elemental analyzer (Carlo Erba NA 1500, CE Instruments, Rodano, Italy) coupledwith an isotopic ratio mass spectrometer (Thermo-Finnigan, Delta S, Bremen, Germany). The δ13C(in %�) was calculated as follows:
δ13C = [(13Rsample −13Rstandard)/13Rstandard] × 1000, (1)
where 13R = 13C/12C and the standard is the international Vienna Pee Dee Belemnite. The At%15N(in %) was calculated according to the following:
At%15N = [no. of 15N atoms/(no. of (15N + 14N) atoms)] × 100. (2)
The fraction of total SOC coming from residue C (fC, in g residue C g−1 total SOC) and total soil Ncoming from residue N (fN, in g residue N g−1 total soil N) was calculated as follows:
fC or fN = [(δTR or AtTR) − (δC or AtC)]/[(δR or AtR) − (δC or AtC)], (3)
where δTR and AtTR represent δ13C and At%15N of the soil receiving residue, δC and AtC representδ13C and At%15N of the control soil (no residue), and δR and AtR represent δ13C and At%15N of thecorn residue, respectively. Residue C and N concentrations in soil (in g residue C or N kg−1 soil) wereas follows:
residue C or N = fC or fN × SOC or SN, (4)
where SOC and SN are the concentrations of total soil organic C (g SOC kg−1 soil) and total soil N (gtotal soil N kg−1 soil), respectively.
2.5. Relationships between Methodological and Functional Fractions of SOM
We assumed that SOM retained in the soil matrix was present in OLF and ρ > 1.9 fractions. Soilorganic C retained by the soil matrix (SOCR, in g SOC kg−1 soil) was as follows:
SOCR = SOCOLF + SOC1.9-2.1 + SOC2.1-2.3 + SOC2.3-2.5 + SOC2.5-2.6 + SOC>2.6, (5)
where SOCOLF to >2.6 is the SOC concentration in each density fraction (in g SOC kg−1 soil). Total soilNR, residue CR, and residue NR were calculated similarly. Mineral-associated SOM was the sum ofSOM in density fractions >1.9, expressed as the SOCMAOM, in g SOC kg−1 soil as follows:
SOCMAOM = SOC1.9-2.1 + SOC2.1-2.3 + SOC2.3-2.5 + SOC2.5-2.6 + SOC>2.6. (6)
Total soil NMAOM, residue CMAOM, and residue NMAOM were calculated similarly. The mass ofSOC occluded in the soil matrix (SOCR-OLF, in g SOCOLF 100 g−1 SOCR) or in mineral-associated forms(SOCR-MAOM, in g SOCMAOM 100 g−1 SOCR) was determined as follows:
SOCR-OLF or R-MAOM = (SOCOLF or MAOM/SOCR) × 100. (7)
Total soil NR-OLF and R-MAOM, residue CR-OLF and R-MAOM, and residue NR-OLF and R-MAOM werecalculated similarly.

Soil Syst. 2020, 4, 4 6 of 17
2.6. Statistical Analysis
The soil incubation experiment was a completely randomized factorial design with two soilhorizons (topsoil and subsoil), two levels of residue (0 and 10 g C kg−1), and three replicates of eachtreatment, for 12 experimental units incubated. Each of the 12 experimental soils was separated intoseven density fractions (n = 84 fractions). The effect of soil horizons and residue inputs on occludedSOM and mineral-associated SOM fractions was evaluated by analysis of variance (ANOVA) with alinear mixed model using the MIXED procedure of SAS v. 9.3 (SAS Institute Inc., Cary, NC, USA) [28].When residuals showed heterogeneity or non-normal distribution, data were log, square root, or rankedtransformed. When differences were significant (p < 0.05), we used Fisher’s least significant difference(LSD) test to separate treatment means. Graphical representations were done with SigmaPlot v. 13(Systat Software Inc., San Jose, CA, USA) [29].
3. Results
3.1. Mass Distribution and Recovery
We recovered 881 ± 13 g kg−1 of soil particles after density separation, on average, across all soilhorizons and residue treatments (n = 12), so only about 12% of the initial soil mass was lost during theprocedure. In soil incubated without residue, most of the soil mass (~60%) was in the 2.3–2.5 fractionin topsoil and in the 2.5–2.6 fraction in subsoil (data not shown). Soil incubated with residue hadsignificantly (p < 0.002) more OLF mass, resulting in as much as 39.5 g OLF kg−1 in topsoil with residue(1.2 times greater than in topsoil without residue) and 5.0 g OLF kg−1 in subsoil with residue (3.7-foldmore than in subsoil without residue). Soil incubated with residue had less soil mass in the 2.3–2.5fraction (p < 0.03) and a numerically greater soil mass of the 2.5–2.6 fraction of topsoil and subsoil(data not shown). Residue addition did not affect the mass of other fractions of the topsoil and subsoil.
3.2. Mineralogical Analysis of Soil Density Fractions
Residue addition did not influence the diffractograms of soil density fractions, so those ofunamended soils are presented as an example (Figure 2). The soil matrix was dominated by primaryminerals (quartz, albite, microcline, and muscovite), but secondary minerals (montmorillonite, chlorite,vermiculite, and illite) were observed in most density fractions. In topsoil (Figure 2a), the diffractogramsof the fractions 1.9–2.1, 2.1–2.3, and 2.3–2.5 were similar; they showed broad peaks and diffusionbands at low angle, and small peaks of chlorite/vermiculite (at 7.3◦), montmorillonite (at 8.4◦) andillite/muscovite (at 10.3◦). The intensity of chlorite (at 14.5◦) and illite/muscovite (at 10.3◦) peaksincreased in the denser soil fractions, whereas the opposite was observed for montmorillonite (at 8.4◦).The subsoil (Figure 2b) had a montmorillonite (at 8.4◦) peak in the 2.3–2.5 fraction. Montmorillonitewas also observed in lighter (<2.3) and heavier (>2.5) fractions. Larger peaks of montmorillonite (at8.4◦) and illite/muscovite (at 10.3◦) were seen in the 2.1–2.3 and 2.3–2.5 fractions of subsoil than topsoil.In the 2.5–2.6 fraction, the diffusion band at low angle was clearly visible in subsoil and the intensity ofthe peaks of chlorite/vermiculite (at 7.3◦), montmorillonite (at 8.4◦) and illite/muscovite (at 10.3◦) weregreater in subsoil than in topsoil.
3.3. Residue C and N in Soil Density Fractions
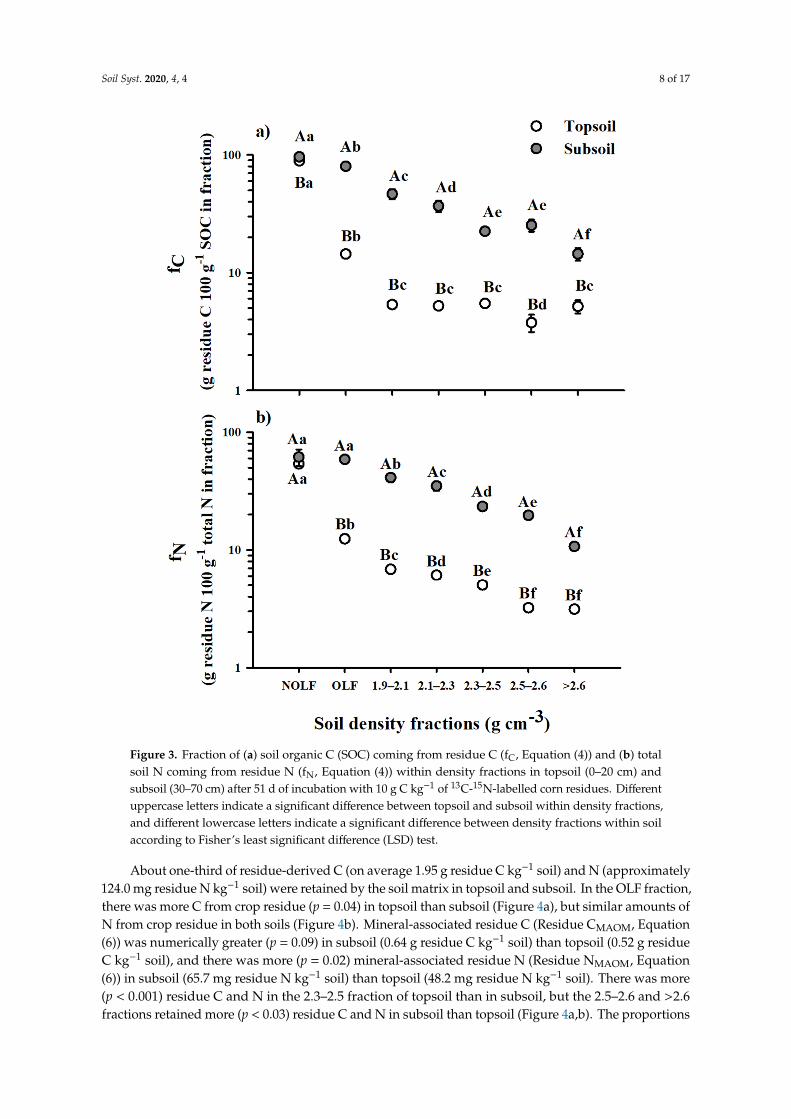
Density fractions from subsoil had greater (p < 0.004) enrichment in residue C (fC, Equation (3))and residue N (fN, Equation (3)) than density fractions from topsoil, except that the NOLF was lessenriched in residue-N in subsoil than topsoil (Figure 3). Topsoil fC values were similar among fractionswith ρ >1.9 (Figure 3a). However, subsoil fC values decreased with increasing density (Figure 3a),which was also the case for fN values in both soils (Figure 3b). We recovered an average 76% of theresidue-derived C in the density fractions and about 46% of the residue-derived N in the densityfractions, in both soils (Table 1). Most of residue-derived C and N was in the NOLF (43% and 18%,respectively) and OLF (23% and 15%, respectively; Table 1). Mineral-associated residue C and N

Soil Syst. 2020, 4, 4 7 of 17
accumulated preferentially in the 2.5–2.6 fraction of the subsoil and in the 2.3–2.5 fraction of topsoil(Table 1).
Soil Syst. 2020, 4, x FOR PEER REVIEW 7 of 19
Figure 1. Fractionation scheme illustrating the methodological procedure and presumed functionality of soil organic matter.
Figure 2. X-ray diffractograms (Co-Kα radiation) of soil density fractions in (a) topsoil and (b) subsoil that were incubated without residue. Mineralogical analysis of the subsoil 1.9–2.1 fraction is missing due to insufficient mass to analyze this fraction. All diffractograms are presented on the same vertical scale
Figure 2. X-ray diffractograms (Co-Kα radiation) of soil density fractions in (a) topsoil and (b) subsoilthat were incubated without residue. Mineralogical analysis of the subsoil 1.9–2.1 fraction is missing dueto insufficient mass to analyze this fraction. All diffractograms are presented on the same vertical scale(intensity) and were truncated for legibility when the reading exceeded 4000 counts. The maximumnumber of counts is written next to the peak (Al, albite; Am, amphibole; Cl, chlorite; I, illite; Mi,microcline; Mu, muscovite; Mt, montmorillonite; Q, quartz; V, vermiculite; W, sodium polytungstate).
Soil Syst. 2020, 4, 4 8 of 17Soil Syst. 2020, 4, x FOR PEER REVIEW 9 of 19
Figure 3. Fraction of (a) soil organic C (SOC) coming from residue C (fC, Equation (4)) and (b) total soil N coming from residue N (fN, Equation (4)) within density fractions in topsoil (0–20 cm) and subsoil (30–70 cm) after 51 d of incubation with 10 g C kg−1 of 13C-15N-labelled corn residues. Different uppercase letters indicate a significant difference between topsoil and subsoil within density fractions, and different lowercase letters indicate a significant difference between density fractions within soil according to Fisher’s least significant difference (LSD) test.
Figure 3. Fraction of (a) soil organic C (SOC) coming from residue C (fC, Equation (4)) and (b) totalsoil N coming from residue N (fN, Equation (4)) within density fractions in topsoil (0–20 cm) andsubsoil (30–70 cm) after 51 d of incubation with 10 g C kg−1 of 13C-15N-labelled corn residues. Differentuppercase letters indicate a significant difference between topsoil and subsoil within density fractions,and different lowercase letters indicate a significant difference between density fractions within soilaccording to Fisher’s least significant difference (LSD) test.
About one-third of residue-derived C (on average 1.95 g residue C kg−1 soil) and N (approximately124.0 mg residue N kg−1 soil) were retained by the soil matrix in topsoil and subsoil. In the OLF fraction,there was more C from crop residue (p = 0.04) in topsoil than subsoil (Figure 4a), but similar amounts ofN from crop residue in both soils (Figure 4b). Mineral-associated residue C (Residue CMAOM, Equation(6)) was numerically greater (p = 0.09) in subsoil (0.64 g residue C kg−1 soil) than topsoil (0.52 g residueC kg−1 soil), and there was more (p = 0.02) mineral-associated residue N (Residue NMAOM, Equation(6)) in subsoil (65.7 mg residue N kg−1 soil) than topsoil (48.2 mg residue N kg−1 soil). There was more(p < 0.001) residue C and N in the 2.3–2.5 fraction of topsoil than in subsoil, but the 2.5–2.6 and >2.6fractions retained more (p < 0.03) residue C and N in subsoil than topsoil (Figure 4a,b). The proportions

Soil Syst. 2020, 4, 4 9 of 17
of residue-derived C and N retained by the soil matrix through organo-mineral interactions (ResidueCR-MAOM and NR-MAOM, Equation (7)) were greater (p < 0.02) in subsoil than topsoil (Figure 5). ResidueC-to-residue N ratios were similar in all soil density fractions of these soils, except in the >2.6 fraction,which had a lower (p = 0.007) C/N ratio in the residues associated with subsoil than topsoil (Table 1).
Soil Syst. 2020, 4, x FOR PEER REVIEW 10 of 19
Figure 4. Concentrations of (a) residue C and (b) residue N in density fractions in topsoil (0–20 cm) and subsoil (30–70 cm) (Equation (5)) after 51 d of incubation with 10 g C kg−1 of 13C-15N-labelled corn residues. Error bars are standard deviation of the mean. NOFL, non-occluded light fraction (ρ < 1.9); OFL, occluded light fraction (ρ < 1.9). Within soil density fractions, NS indicates no significant difference and *, **, and *** indicate significant difference between topsoil and subsoil at p < 0.05, 0.01, and 0.001, respectively (LSD test). The y-axis is on a logarithmic scale.
Figure 4. Concentrations of (a) residue C and (b) residue N in density fractions in topsoil (0–20 cm)and subsoil (30–70 cm) (Equation (5)) after 51 d of incubation with 10 g C kg−1 of 13C-15N-labelledcorn residues. Error bars are standard deviation of the mean. NOFL, non-occluded light fraction(ρ < 1.9); OFL, occluded light fraction (ρ < 1.9). Within soil density fractions, NS indicates no significantdifference and *, **, and *** indicate significant difference between topsoil and subsoil at p < 0.05, 0.01,and 0.001, respectively (LSD test). The y-axis is on a logarithmic scale.

Soil Syst. 2020, 4, 4 10 of 17Soil Syst. 2020, 4, x FOR PEER REVIEW 11 of 19
Figure 5. Proportions of (a) residue C and (b) residue N retained by the soil matrix in the form of mineral-associated organic matter (Residue CR-MAOM and Residue NR-MAOM, Equation (7)) in topsoil (0–20 cm) and subsoil (30–70 cm) from a heavy clay incubated for 51 d with 10 g C kg−1 of 13C-15N-labelled corn residues. * indicates significant difference at p < 0.05 between topsoil and subsoil.
4. Discussion
4.1. Methodological Considerations
We chose a density solution of 1.9 to separate uncomplexed NOLF and OLF from mineral-associated SOM in organo-mineral complexes. This threshold is consistent with other reports of SOM density fractionation [30,31]. However, we detected trace amounts of minerals in the XRD scans of NOLF and OLF (data not shown), possibly because minerals are also adsorbed on SOM in NOLF and OLF [32]. Therefore, the NOLF and OLF in this study were not composed exclusively of physically uncomplexed organic matter in the sense used by Gregorich et al. [30]. The recovery of ~88% of total soil mass in density fractions is similar to Basile-Doelsch et al. [16] and Bonnard et al. [33], but lower than Swanston et al. [34] and Plante et al. [35], who recovered ~100% soil mass.
The missing soil mass could be in particles <0.2 μm, which can represent up to 30% of the clays in the heavy clay soils of Eastern Canada [10,36]. Suspended clays remaining in the density solution that were not recovered by our centrifugation procedure could contain an appreciable amount of C and N, since we recovered about 76% and 46% of residue-derived C and N, respectively. It is not unusual to achieve less than 100% SOM recovery during density separation [17,33,35]. In this study, the losses of residue C and N may be due to (1) SOM solubilization by water and polytungstate solutions (despite their close-to-neutral pH), (2) SOM association with clay particles <0.2 μm, which were not recovered, and (3) SOM dispersion by sonication during rinsing steps (as seen by the dark color of rinsing water, particularly in the OLF, 2.3–2.5, and 2.5–2.6 fractions). Despite these methodological constraints, the quantities of soil and residue-derived C and N recovered during sequential density separation were sufficient to evaluate the quantity of occluded and mineral-associated SOM derived from the corn residue.
Figure 5. Proportions of (a) residue C and (b) residue N retained by the soil matrix in the formof mineral-associated organic matter (Residue CR-MAOM and Residue NR-MAOM, Equation (7)) intopsoil (0–20 cm) and subsoil (30–70 cm) from a heavy clay incubated for 51 d with 10 g C kg−1 of13C-15N-labelled corn residues. * indicates significant difference at p < 0.05 between topsoil and subsoil.
Table 1. Recovery of residue C and residue N, and C/N and residue C-to-residue N ratios in densityfractions in topsoil (0–20 cm) and subsoil (30–70 cm) incubated with 10 g C kg−1 soil of 13C-15N-labeledcorn residues for 51 d.
DensityFractions(g cm−3)
Distribution ofResidue C (%)
Distribution ofResidue N (%) C/N Residue C-to-
Residue N RatioTopsoil Subsoil Topsoil Subsoil Topsoil Subsoil Topsoil Subsoil
NOLF 1 45.7 Aa3 40.5 Aa 16.7 Aa 18.8 Aa 21.6 Aa 19.2 Ba 35.7 Aa 30.5 Aa
OLF 2 24.9 Ab 20.8 Bb 15.1 Aa 15.1 Aa 18.7 Ab 14.2 Bb 21.6 Ab 19.4 Ab
1.9–2.1 1.0 Ad 1.4 Ad 1.1 Ac 1.7 Ab 15.4 Ac 9.8 Bc 12.1 Ad 11.1 Ac
2.1–2.3 0.8 Ae 0.8 Ae 0.9 Ac 1.1 Ad 12.7 Ad 9.7 Bc 10.9 Ae 10.2 Ac
2.3–2.5 6.4 Ac 0.7 Be 8.1 Ab 1.0 Bd 9.5 Af 10.1 Ac 10.4 Ae 9.8 Ac
2.5–2.6 0.2 Bf 7.4 Ac 0.2 Bd 11.0 Aa 10.8 Ae 7.4 Bd 12.7 Acde 9.4 Ac
>2.6 0.2 Bf 0.4 Af 0.2 Bd 0.5 Ae 9.4 Af 7.9 Ad 15.4 Ac 10.7 Bc
All fractions 79.2 A 72.0 A 42.1 A 49.2 A - - - -1 NOLF = non-occluded light fraction (ρ < 1.9). 2 OLF = occluded light fraction (ρ < 1.9). 3 Means followed bydifferent uppercase letters indicate a significant (p < 0.05) difference between topsoil and subsoil within densityfractions, and means followed by different lowercase letters indicate a significant (p < 0.05) difference betweendensity fractions within soil according to LSD test at α = 0.05. C, carbon; N, nitrogen.
4. Discussion
4.1. Methodological Considerations
We chose a density solution of 1.9 to separate uncomplexed NOLF and OLF from mineral-associatedSOM in organo-mineral complexes. This threshold is consistent with other reports of SOM densityfractionation [30,31]. However, we detected trace amounts of minerals in the XRD scans of NOLF andOLF (data not shown), possibly because minerals are also adsorbed on SOM in NOLF and OLF [32].Therefore, the NOLF and OLF in this study were not composed exclusively of physically uncomplexedorganic matter in the sense used by Gregorich et al. [30]. The recovery of ~88% of total soil massin density fractions is similar to Basile-Doelsch et al. [16] and Bonnard et al. [33], but lower thanSwanston et al. [34] and Plante et al. [35], who recovered ~100% soil mass.

Soil Syst. 2020, 4, 4 11 of 17
The missing soil mass could be in particles <0.2 µm, which can represent up to 30% of the claysin the heavy clay soils of Eastern Canada [10,36]. Suspended clays remaining in the density solutionthat were not recovered by our centrifugation procedure could contain an appreciable amount of Cand N, since we recovered about 76% and 46% of residue-derived C and N, respectively. It is notunusual to achieve less than 100% SOM recovery during density separation [17,33,35]. In this study, thelosses of residue C and N may be due to (1) SOM solubilization by water and polytungstate solutions(despite their close-to-neutral pH), (2) SOM association with clay particles <0.2 µm, which were notrecovered, and (3) SOM dispersion by sonication during rinsing steps (as seen by the dark color ofrinsing water, particularly in the OLF, 2.3–2.5, and 2.5–2.6 fractions). Despite these methodologicalconstraints, the quantities of soil and residue-derived C and N recovered during sequential densityseparation were sufficient to evaluate the quantity of occluded and mineral-associated SOM derivedfrom the corn residue.
4.2. Residue-Derived C and N Retention in Occluded SOM
The OLF was much richer in residue-derived C and N in the subsoil than in the topsoil (Figure 3).However, its mass in proportion of the whole soil (i.e., g OLF kg−1 soil, data not shown) was eighttimes lower in subsoil than in topsoil. Consequently, the concentration of OLF-associated residue C ona whole soil basis (i.e., g residue C in OLF kg−1 soil, Figure 4a) was slightly greater in topsoil thansubsoil, but both soils had similar amounts of residue N in this fraction (Figure 4b). The differencebetween the two elements could be because N is recycled in the soil during microbial processes,leading to N occlusion in soil aggregates, whereas C is partly lost as CO2. The subsoil was thushighly responsive to residue addition, achieving greater occlusion of C and N from crop residue thantopsoil in the 51 d incubation. This is consistent with our previous observation of greater retention ofresidue-derived C and N in particulate organic matter within macroaggregates >1000 µm, as well asgreater macroaggregation per unit C added, in subsoil than topsoil [19].
4.3. Residue-Derived C and N Retention in Mineral-Associated SOM
As hypothesized, the retention of residue-derived C and N in mineral-associated SOM was greaterin subsoil than topsoil. The hypothesis was confirmed when we evaluated the absolute amount ofresidue (Residue CMAOM and NMAOM, Equation (6), Section 3.3) or the proportion of residue retainedby the soil matrix (Residue CR-MAOM and NR-MAOM, Equation (7), Figure 5a,b). This indicates thatmineral surfaces in subsoil can retain more C and N than minerals in topsoil [20,22,37,38]. In thetopsoil, most of the mineral-associated residue C and N was found in the 2.3–2.5 fraction, whereas inthe subsoil, residue C and N were mostly retained in the 2.5–2.6 fraction. However, the topsoil 2.3–2.5fraction and the subsoil 2.5–2.6 fraction showed similar diffractograms. Diffusion bands at low anglecould be caused by poorly crystalline amorphous material, interstratification, or overlapping of peaksof minerals that are increasingly more expansive [16,32,35,39]. The greater diffusion bands at lowangle in topsoil fractions <2.5 suggest that this soil could contain more amorphous, interstratified, orexpansible minerals than the subsoil. Perhaps the more intense rhizospheric activity increased mineralweathering in the topsoil and caused the enrichment compared to the subsoil [40]. Minerals stabilizingSOM in the topsoil 2.3–2.5 and the subsoil 2.5–2.6 fractions are most likely illite, chlorite, vermiculite,montmorillonite, interstratified minerals, and amorphous material (see Figure 2). The potential ofthese minerals to stabilize residue-derived C and N is influenced by external and internal (for swellingminerals like vermiculite and montmorillonite) specific surface area (SSA, in m2 g−1) and cationexchange capacity (CEC, in cmol+ kg−1) [41,42]. The SSA and CEC are, respectively, 70 to 175 m2 g−1
and 10 to 40 cmol+ kg−1 for illite + chlorite, 200 m2 g−1 and 150 to 200 cmol+ kg−1 for amorphousmaterial, 70 to 120 m2 g−1 (external) + 600 to 700 m2 g−1 (internal) and 100 to 200 cmol+ kg−1 forvermiculite, and 80 to 150 m2 g−1 (external) + 550 to 650 m2 g−1 (internal) and 80 to 150 cmol+ kg−1
for montmorillonite [10,42]. Interstratified minerals represent intermediate transformation products,most likely in the form of illite–montmorillonnite and/or chlorite–vermiculite [43,44], and likely

Soil Syst. 2020, 4, 4 12 of 17
have intermediate capacity to stabilize residue-derived C and N. De Kimpe et al. [10] found thatthe Kamouraska soil contains ~44% illite + chlorite, ~15% montmorillonnite, ~7% vermiculite, and~5% amorphous material, and Kodama et al. [40] found that interstratified minerals represented ~4%of the Dalhousie soil, a similiar gleysol formed on marine clay in Eastern Canada. We thereforepostulate that mineral-associated residue C and N in topsoil 2.3–2.5 and subsoil 2.5–2.6 fractions wereretained by forming organo-mineral complexes with illite + chlorite > montmorillonite > vermiculite >
interstatified minerals = amorphous material. In the SOM-poor subsoil, mineral surfaces were lessassociated with organic compounds and organo-mineral complexes remained in a heavier densityfraction (i.e., 2.5–2.6). In the SOM-rich topsoil, higher coverage of mineral surfaces decreased thedensity of organo-mineral complexes, which were found in a lower density fraction (2.3–2.5). Thisis consistent with the postulate that mineral surfaces are less associated with organic compounds insubsoil than topsoil.
Residue-derived C and N were retained by the same minerals in topsoil and subsoil, particularly inassociation with illite + chlorite and montmorillonite. However, residue N was retained preferentiallythrough organo-mineral interactions, particularly in the subsoil. The evidence for this is (1) the greaterproportion of whole-soil residue N than whole-soil residue C in organo-mineral complexes (Table 1) and(2) the higher values for Residue NR-MAOM than Residue CR-MAOM (Figure 5a,b, Equation (7)). This maysuggest preferential adsorption of N-containing biomolecules [8,14,45] on illite and montmorillonite.Montmorillonitic soils retain peptides and become enriched with amine-N [46,47]. Microbial residuessuch as secretions and necromass are a component of mineral-associated SOM [31,48] althoughVogel et al. [49] reported that illite retained more microbial-derived C and N than montmorillonite.Finally, residue N could be mineralized to 15N-NH4
+, which is then adsorbed onto mineral surfaces orretained into siloxane cavities from montmorillonite surfaces [19,32,50].
The subsoil >2.6 fraction preferentially retained the residue N, based on its lower residueC-to-residue N ratio than other fractions. Hatton et al. [51] found more microbial residues in themineral grain fraction correponding to a 2.4–2.65 density fraction, and postulated that the mineralgrains were a preferential habitat for soil microorganisms. The >2.6 fraction in the subsoil containedillite, chlorite, and traces of vermiculite, which could support soil microbial biomass or bind microbialbyproducts. This fraction also contained amphibole, a Fe-bearing mineral. Since Fe coating on primaryminerals is expected to increase their sorption potential [32], perhaps amphibole also contributed, atleast partly, to retain residue-derived C and N in the subsoil >2.6 fraction.
5. Conclusions
Organo-mineral interactions were more important for the retention of residue-derived C and N inthe subsoil than the topsoil, but an appreciable amount of residue-derived C and N was also retainedthrough occlusion in the subsoil. Minerals such as illite + chlorite, montmorillonite, vermiculite, andamorphous material are important for the retention of residue C and N in topsoil and subsoil, but theyare found in different density fractions, mainly in the 2.3–2.5 fraction of topsoil and the 2.5–2.6 fractionin subsoil. Finally, mineral-associated SOM was enriched in residue N in subsoil, likely because ofgreater reactive mineral surface area than in the topsoil. This confirms that low SOM concentrationpromotes the short-term stabilization of newly added material. Further research should investigatethe microbial processing and the molecular nature of mineral-associated residue C and N in topsoiland subsoil. Since this work evaluated the short-term stabilization of residue-derived C and N, anext step could be to evaluate the long-term persistance of recently added C and N retained throughorgano-mineral intertactions in topsoil and subsoil. In conclusion, our results suggest that in soils withhigh clay content and reactive minerals, and low autochthonous SOM concentration, residue-derivedC and N are rapidly stabilized into mineral-associated organic matter.

Soil Syst. 2020, 4, 4 13 of 17
Author Contributions: Conceptualization, V.P. and D.A.A.; Formal analysis, V.P.; Funding acquisition, V.P., J.K.W.,and D.A.A.; Investigation, V.P. and I.B.-D.; Methodology, V.P., I.B.-D., D.B., and D.A.A.; Project administration,I.B.-D., J.B., J.K.W., and D.A.A.; Resources, I.B.-D., J.B., J.K.W. and D.A.A.; Supervision, I.B.-D., J.B., J.K.W., andD.A.A.; Visualization, V.P.; Writing—original draft, V.P.; Writing—review and editing, V.P., I.B.-D., J.B., D.B., J.K.W.,and D.A.A. All authors have read and agreed to the published version of the manuscript.
Funding: This research was funded by the Fonds de recherche du Québec—Nature et technologie (FRQNT), theMax Bell Foundation at McGill University, and the National Science and Engineering Research Council (NSERC)of Canada through postgraduate scholarships awarded to V.P., The Green Crop Network, funded by NSERC(grant number NETGP298866-03), and the Centre SEVE, funded by the FRQNT Strategic Networks program.
Acknowledgments: The authors would like to thank Agriculture and Agri-Food Canada staff for the technicalassistance provided, in particular Normand Bertrand, Gabriel Lévesque, Johanne Tremblay, and Nicole Bissonnette.The authors are also thankful to two anonymous reviewers for their helpful comments and the time they allottedto revising a previous version of this manuscript.
Conflicts of Interest: The authors declare no conflict of interest.
Appendix A
The density of organo-mineral complexes (ρcpx in g cm−3) was calculated as follows:
ρcpx = Mcpx ÷ [Vmx + Vom], (A1)
where Mcpx is the mass of the organo-mineral complex (set at 1 g for calculation purposes), and Vmx
and Vom are the volumes (in cm3) of the mineral and organic matter in 1 g of organo-mineral complex,respectively. Density (ρ) values are reported without stating g cm−3. The volume of mineral (Vmx, incm3) in 1 g of organo-mineral complex was as follows:
Vmx = [1 − (1.7*SOCcpx)] ÷ ρmx, (A2)
where 1.7 is a factor proposed by Baldock and Nelson [52] to convert SOC concentration into SOMcontent (g SOM g−1 SOC), SOCcpx is organo-mineral complex theoretical SOC concentration (mgSOC g−1 organo-mineral complex), and ρmx is mineral density. Minerals were separated in twogroups: the first included quartz, microcline, albite, and amphibole (Table A1), which have lowspecific surface area (SSA), and the second comprised chlorite, vermiculite, and illite/muscovite, whichhave moderate to high SSA (Table A2) [10]. We used theoretical SOCcpx values of 0, 25, and 50 mgSOC g−1 organo-mineral complex for minerals of the first group and 50, 100, and 200 mg SOC g−1
organo-mineral complex for minerals of the second group, to calculate Vmx. We also used minimum,average, and maximum values for ρmx taken from the literature (see Tables A1 and A2). The volume oforganic matter (Vom, in cm3) in 1 g of organo-mineral complex was calculated as follows:
Vom = [1.7*(SOCcpx/1000)] ÷ ρom, (A3)
where ρom is the density of soil organic matter (i.e., 1.6 according to Chenu and Plante [53]). Ourprocedure yielded nine estimated values of ρcpx for each mineral, resulting in a mean ρ value (andstandard deviation) for each mineral (Tables A1 and A2). We chose 1.9 as the initial density thresholdafter Gregorich et al. [30] and Basile-Doelsch et al. [16]. From the ρcpx estimates, we set five densitythresholds for the sequential fractionation, that is, ρ = 1.9, 2.1, 2.3, 2.5, and 2.6 (Figure A1).

Soil Syst. 2020, 4, 4 14 of 17
Table A1. Estimation of organo-mineral complex density for minerals having a low specific surface area.
Quartz
ρmx (g cm−3) † 2.62 2.65 2.66Mean (SD)
SOCcpx (mg SOC g−1 cpx) 0 25 50 0 25 50 0 25 50
Vom (cm3) ‡ 0.000 0.027 0.053 0.000 0.027 0.053 0.000 0.027 0.053 -
Vmx (cm3)∫
0.382 0.365 0.349 0.378 0.362 0.346 0.376 0.360 0.344 -ρcpx (g cm−3) § 2.620 2.551 2.485 2.647 2.576 2.508 2.660 2.584 2.518 2.572 (0.062)
Microclineρmx (g cm−3) 2.44 2.55 2.60
Mean (SD)SOCcpx (mg SOC g−1 cpx) 0 25 50 0 25 50 0 25 50
Vom (cm3) 0.000 0.027 0.053 0.000 0.027 0.053 0.000 0.027 0.053 -Vmx (cm3) 0.410 0.392 0.375 0.393 0.376 0.359 0.385 0.368 0.352 -ρcpx (g cm−3) 2.440 2.387 2.336 2.547 2.484 2.425 2.600 2.533 2.469 2.469 (0.083)
Albiteρmx (g cm−3) 2.59 2.62 2.64
Mean (SD)SOCcpx (mg SOC g−1 cpx) 0 25 50 0 25 50 0 25 50
Vom (cm3) 0.000 0.027 0.053 0.000 0.027 0.053 0.000 0.027 0.053 -Vmx (cm3) 0.386 0.370 0.353 0.382 0.366 0.350 0.379 0.363 0.347 -ρcpx (g cm−3) 2.590 2.524 2.461 2.618 2.549 2.483 2.640 2.569 2.502 2.548 (0.061)
Amphiboleρmx (g cm−3) 2.59 2.62 2.64
Mean (SD)SOCcpx (mg SOC g−1 cpx) 0 25 50 0 25 50 0 25 50
Vom (cm3) 0.000 0.027 0.053 0.000 0.027 0.053 0.000 0.027 0.053 -Vmx (cm3) 0.334 0.320 0.306 0.313 0.300 0.286 0.303 0.290 0.277 -ρcpx (g cm−3) 2.990 2.884 2.784 3.195 3.065 2.945 3.300 3.157 3.027 3.039 (0.161)
† Minimum, average, and maximum values for mineral density (ρmx) taken from Battey [54], Barthelmy [55],Deer et al. [56], Fischenner [57], Jouenne [58], Mincryst [59], Mindat [60], and [27]. ¶ Theoretical soil organic carbonconcentration of organo-mineral complex (SOCcpx). ‡ Volume of organic matter (Vom) in 1 g organo-mineral complex
calculated after Equation (A3).∫
Volume of mineral (Vmx) in 1 g organo-mineral complex calculated after Equation(A2). § Organo-mineral complex density (ρcpx) calculated after Equation (A1). The mean values (and standarddeviation) presented in the last column were used to determine density thresholds for the separation protocol.
Table A2. Estimation of organo-mineral complex density for minerals having a high specific surface area.
Chlorite
ρmx (g cm−3) † 2.65 2.83 2.95Mean (SD)
SOCcpx (mg SOC g−1 cpx) ¶ 50 100 200 50 100 200 50 100 200
Vom (cm3) ‡ 0.053 0.106 0.213 0.053 0.106 0.213 0.053 0.106 0.213 -
Vmx (cm3)∫
0.345 0.313 0.249 0.323 0.293 0.233 0.310 0.281 0.224 -ρcpx (g cm−3) § 2.510 2.384 2.167 2.659 2.505 2.245 2.753 2.580 2.292 2.455 (0.197)
Vermiculiteρmx (g cm−3) 2.30 2.37 2.50
Mean (SD)SOCcpx (mg SOC g−1 cpx) 50 100 200 50 100 200 50 100 200
Vom (cm3) 0.053 0.106 0.213 0.053 0.106 0.213 0.053 0.106 0.213 -Vmx (cm3) 0.398 0.361 0.287 0.386 0.350 0.278 0.366 0.332 0.264 -ρcpx (g cm−3) 2.218 2.141 2.002 2.277 2.191 2.037 2.386 2.282 2.099 2.181 (0.184)
Illite/Muscoviteρmx (g cm−3) 2.70 2.83 2.90
Mean (SD)SOCcpx (mg SOC g−1 cpx) 50 100 200 50 100 200 50 100 200
Vom (cm3) 0.053 0.106 0.213 0.053 0.106 0.213 0.053 0.106 0.213 -Vmx (cm3) 0.339 0.307 0.244 0.323 0.293 0.233 0.316 0.286 0.228 -ρcpx (g cm−3) 2.551 2.417 2.188 2.713 2.548 2.272 2.656 2.503 2.244 2.455 (0.186)
† Minimum, average, and maximum values for mineral density (ρmx) taken from Battey [54], Barthelmy [55],Deer et al. [56], Fischenner [57], Jouenne [58], Mincryst [59], Mindat [60], and [27]. ¶ Theoretical soil organic carbonconcentration of organo-mineral complex (SOCcpx). ‡ Volume of organic matter (Vom) in 1 g organo-mineral complex
calculated after Equation (A3).∫
Volume of mineral (Vmx) in 1 g organo-mineral complex calculated after Equation(A2). § Organo-mineral complex density (ρcpx) calculated after Equation (A1). The mean values (and standarddeviation) presented in the last column were used to determine density thresholds for the separation protocol.

Soil Syst. 2020, 4, 4 15 of 17Soil Syst. 2020, 4, x FOR PEER REVIEW 16 of 19
Figure A1. Theoretical densities of organo-mineral complexes associated with soil minerals. Horizontal bars are standard deviations from the means calculated in Tables A1 and A2 (see above). Dotted lines are thresholds for the sequential density separation.
References
1. Derrien, D.; Dignac, M.-F.; Basile-Doelsch, I.; Barot, S.; Cécillon, L.; Chenu, C.; Chevallier, T.; Freschet, G.T.; Garnier, P.; Guenet, B.; et al. Stocker du C dans les sols : Quels mécanismes, quelles pratiques agricoles, quels indicateurs ? Étude Gest. des sols 2016, 23, 193–224.
2. Paustian, K.; Lehmann, J.; Ogle, S.; Reay, D.; Robertson, G.P.; Smith, P. Climate-smart soils. Nature 2016, 532, 49–57.
3. Chen, S.; Martin, M.P.; Saby, N.P.A.; Walter, C.; Angers, D.A.; Arrouays, D. Fine resolution map of top- and subsoil carbon sequestration potential in France. Sci. Total Environ. 2018, 630, 389–400.
4. Golchin, A.; Oades, J.M.; Skjemstad, J.O.; Clarke, P. Soil structure and carbon cycling. Aust. J. Soil Res. 1994, 32, 1043–1068.
5. Baldock, J.; Skjemstad, J. Role of the soil matrix and minerals in protecting natural organic materials against biological attack. Org. Geochem. 2000, 31, 697–710.
6. von Lützow, M.; Kögel-Knabner, I.; Ekschmitt, K.; Matzner, E.; Guggenberger, G.; Marschner, B.; Flessa, H. Stabilization of organic matter in temperate soils: Mechanisms and their relevance under different soil conditions—A review. Eur. J. Soil Sci. 2006, 57, 426–445.
7. von Lützow, M.; Kögel-Knabner, I.; Ekschmitt, K.; Flessa, H.; Guggenberger, G.; Matzner, E.; Marschner, B. SOM fractionation methods: Relevance to functional pools and to stabilization mechanisms. Soil Biol. Biochem. 2007, 39, 2183–2207.
8. Kleber, M.; Sollins, P.; Sutton, R. A conceptual model of organo-mineral interactions in soils: Self-assembly of organic molecular fragments into zonal structures on mineral surfaces. Biogeochemistry 2007, 85, 9–24.
9. Moni, C.; Derrien, D.; Hatton, P.-J.; Zeller, B.; Kleber, M. Density fractions versus size separates: Does physical fractionation isolate functional soil compartments? Biogeosciences 2012, 9, 5181–5197.
10. De Kimpe, C.; Laverdière, M.; Martel, Y. Surface area and exchange capacity of clay in relation to the mineralogical composition of gleysolic soils. Can. J. Soil Sci. 1979, 59, 341–347.
11. Monreal, C.M.; Schulten, H.-R.; Kodama, H. Age, turnover and molecular diversity of soil organic matter in aggregates of a Gleysol. Can. J. Soil Sci. 1997, 77, 379–388.
Figure A1. Theoretical densities of organo-mineral complexes associated with soil minerals. Horizontalbars are standard deviations from the means calculated in Tables A1 and A2 (see above). Dotted linesare thresholds for the sequential density separation.
References
1. Derrien, D.; Dignac, M.-F.; Basile-Doelsch, I.; Barot, S.; Cécillon, L.; Chenu, C.; Chevallier, T.; Freschet, G.T.;Garnier, P.; Guenet, B.; et al. Stocker du C dans les sols: Quels mécanismes, quelles pratiques agricoles, quelsindicateurs? Étude Gest. des sols 2016, 23, 193–224.
2. Paustian, K.; Lehmann, J.; Ogle, S.; Reay, D.; Robertson, G.P.; Smith, P. Climate-smart soils. Nature 2016, 532,49–57. [CrossRef]
3. Chen, S.; Martin, M.P.; Saby, N.P.A.; Walter, C.; Angers, D.A.; Arrouays, D. Fine resolution map of top- andsubsoil carbon sequestration potential in France. Sci. Total Environ. 2018, 630, 389–400. [CrossRef] [PubMed]
4. Golchin, A.; Oades, J.M.; Skjemstad, J.O.; Clarke, P. Soil structure and carbon cycling. Aust. J. Soil Res. 1994,32, 1043–1068. [CrossRef]
5. Baldock, J.; Skjemstad, J. Role of the soil matrix and minerals in protecting natural organic materials againstbiological attack. Org. Geochem. 2000, 31, 697–710. [CrossRef]
6. Von Lützow, M.; Kögel-Knabner, I.; Ekschmitt, K.; Matzner, E.; Guggenberger, G.; Marschner, B.; Flessa, H.Stabilization of organic matter in temperate soils: Mechanisms and their relevance under different soilconditions—A review. Eur. J. Soil Sci. 2006, 57, 426–445. [CrossRef]
7. Von Lützow, M.; Kögel-Knabner, I.; Ekschmitt, K.; Flessa, H.; Guggenberger, G.; Matzner, E.; Marschner, B.SOM fractionation methods: Relevance to functional pools and to stabilization mechanisms. Soil Biol.Biochem. 2007, 39, 2183–2207. [CrossRef]
8. Kleber, M.; Sollins, P.; Sutton, R. A conceptual model of organo-mineral interactions in soils: Self-assemblyof organic molecular fragments into zonal structures on mineral surfaces. Biogeochemistry 2007, 85, 9–24.[CrossRef]
9. Moni, C.; Derrien, D.; Hatton, P.-J.; Zeller, B.; Kleber, M. Density fractions versus size separates: Does physicalfractionation isolate functional soil compartments? Biogeosciences 2012, 9, 5181–5197. [CrossRef]
10. De Kimpe, C.; Laverdière, M.; Martel, Y. Surface area and exchange capacity of clay in relation to themineralogical composition of gleysolic soils. Can. J. Soil Sci. 1979, 59, 341–347. [CrossRef]
11. Monreal, C.M.; Schulten, H.-R.; Kodama, H. Age, turnover and molecular diversity of soil organic matter inaggregates of a Gleysol. Can. J. Soil Sci. 1997, 77, 379–388. [CrossRef]
12. Hassink, J. The capacity of soils to preserve organic C and N by their association with clay and silt particles.Plant Soil 1997, 191, 77–87. [CrossRef]

Soil Syst. 2020, 4, 4 16 of 17
13. Carter, M.R.; Angers, D.A.; Gregorich, E.G.; Bolinder, M.A. Characterizing organic matter retention forsurface soils in eastern Canada using density and particle size fractions. Can. J. Soil Sci. 2003, 83, 11–23.[CrossRef]
14. Sollins, P.; Swanston, C.; Kleber, M.; Filley, T.; Kramer, M.; Crow, S.; Caldwell, B.A.; Lajtha, K.; Bowden, R.Organic C and N stabilization in a forest soil: Evidence from sequential density fractionation. Soil Biol.Biochem. 2006, 38, 3313–3324. [CrossRef]
15. Gunina, A.; Kuzyakov, Y. Pathways of litter C by formation of aggregates and SOM density fractions:Implications from 13C natural abundance. Soil Biol. Biochem. 2014, 71, 95–104. [CrossRef]
16. Basile-Doelsch, I.; Amundson, R.; Stone, W.E.E.; Borschneck, D. Mineral control of carbon pools in a volcanicsoil horizon. Geoderma 2007, 137, 477–489. [CrossRef]
17. Basile-Doelsch, I.; Brun, T.; Borschneck, D.; Masion, A.; Marol, C.; Balesdent, J. Effect of landuse on organicmatter stabilized in organomineral complexes: A study combining density fractionation, mineralogy and δ
13 C. Geoderma 2009, 151, 77–86. [CrossRef]18. Gregorich, E.G.; Carter, M.R.; Angers, D.A.; Drury, C.F. Using a sequential density and particle-size
fractionation to evaluate carbon and nitrogen storage in the profile of tilled and no-till soils in eastern Canada.Can. J. Soil Sci. 2009, 89, 255–267. [CrossRef]
19. Poirier, V.; Angers, D.A.; Whalen, J.K. Formation of millimetric-scale aggregates and associated retention of13C-15N-labelled residues are greater in subsoil than topsoil. Soil Biol. Biochem. 2014, 75, 45–53. [CrossRef]
20. Stewart, C.; Paustian, K.; Conant, R.; Plante, A.; Six, J. Soil carbon saturation: Evaluation and corroborationby long-term incubations. Soil Biol. Biochem. 2008, 40, 1741–1750. [CrossRef]
21. Poirier, V.; Angers, D.A.; Rochette, P.; Whalen, J.K. Initial soil organic carbon concentration influences theshort-term retention of crop-residue carbon in the fine fraction of a heavy clay soil. Biol. Fertil. Soils 2013, 49,527–535. [CrossRef]
22. Kaiser, K.; Guggenberger, G. Mineral surfaces and soil organic matter. Eur. J. Soil Sci. 2003, 54, 219–236.[CrossRef]
23. Lorenz, K.; Lal, R. The depth distribution of soil organic carbon in relation to land use and management andthe potential of carbon sequestration in subsoil horizons. Adv. Agron. 2005, 88, 35–66.
24. IUSSS Working Group WRB. World Reference Base for Soil Resources, 2nd ed.; World Soil Resources Report No.103; FAO: Rome, Italy, 2006; ISBN 9251055114.
25. Soil Classification Working Group. The Canadian System of Soil Classification, 3rd ed.; Agriculture andAgri-Food Canada Publication No. 1646; National Research Council of Canada: Ottawa, ON, USA, 1998.
26. Pangea, U.K. LST Fastfloat—Technical Brochure; Chippenham: Wilts, UK, 2006.27. X’Pert High Score Software, version 3.0; PANalytical B.V.: Alamo, The Netherlands, 2009.28. SAS/STAT for Windos, version 9.2; SAS Institute Inc.: Cary, NC, USA, 2002.29. SigmaPlot for Windows, version 13.0; Systat Software Inc.: San Jose, CA, USA, 2014.30. Gregorich, E.G.; Beare, M.H.; Mckim, U.F.; Skjemstad, J.O. Chemical and biological characteristics of
physically uncomplexed organic matter. Soil Sci. Soc. Am. J. 2006, 70, 975–985. [CrossRef]31. Ludwig, M.; Achtenhagen, J.; Miltner, A.; Eckhardt, K.; Leinweber, P.; Emmerling, C.; Thiele-Bruhn, S.
Microbial contribution to SOM quantity and quality in density fractions of temperate arable soils. Soil Biol.Biochem. 2015, 81, 311–322. [CrossRef]
32. Sollins, P.; Kramer, M.G.; Swanston, C.; Lajtha, K.; Filley, T.; Aufdenkampe, A.K.; Wagai, R.; Bowden, R.D.Sequential density fractionation across soils of contrasting mineralogy: Evidence for both microbial- andmineral-controlled soil organic matter stabilization. Biogeochemistry 2009, 96, 209–231. [CrossRef]
33. Bonnard, P.; Basile-Doelsch, I.; Balesdent, J.; Masion, A.; Borschneck, D.; Arrouays, D. Organic matter contentand features related to associated mineral fractions in an acid, loamy soil. Eur. J. Soil Sci. 2012, 63, 625–636.[CrossRef]
34. Swanston, C.; Torn, M.; Hanson, P.; Southon, J.; Garten, C.; Hanlon, E.; Ganio, L. Initial characterization ofprocesses of soil carbon stabilization using forest stand-level radiocarbon enrichment. Geoderma 2005, 128,52–62. [CrossRef]
35. Plante, A.; Virto, I.; Malhi, S. Pedogenic, mineralogical and land-use controls on organic carbon stabilizationin two contrasting soils. Can. J. Soil Sci. 2010, 90, 15–26. [CrossRef]
36. Martel, Y.; De Kimpe, C.; Laverdière, M. Cation-exchange capacity of clay-rich soils in relation to organicmatter, mineral composition and surface area. Soil Sci. Soc. Am. J. 1978, 42, 764–767. [CrossRef]

Soil Syst. 2020, 4, 4 17 of 17
37. Rasse, D.; Rumpel, C.; Dignac, M.-F. Is soil carbon mostly root carbon? Mechanisms for a specific stabilisation.Plant Soil 2005, 269, 341–356. [CrossRef]
38. Castellano, M.J.; Kaye, J.P.; Lin, H.; Schmidt, J.P. Linking carbon saturation concepts to nitrogen saturationand retention. Ecosystems 2012, 15, 175–187. [CrossRef]
39. Kodama, H. Clay minerals in Canadian soils: Their origin, distribution and alteration. Can. J. Soil Sci. 1979,59, 37–58. [CrossRef]
40. Kodama, H.; Nelson, S.; Yang, A.; Kohyama, N. Mineralogy of rhizospheric and non-rhizospheric soils incorn fields. Clays Clay Miner. 1994, 42, 755–763. [CrossRef]
41. Sarkar, B.; Singh, M.; Mandal, S.; Churchman, G.J.; Bolan, N.S. Clay minerals-organic matter interactions inrelation to carbon stabilization in soils. In The Future of Soil Carbon: Its Conservation and Formation; Garcia, C.,Nannipieri, P., Hernandez, T., Eds.; Elsevier Inc.: Amsterdam, The Netherlands, 2018; pp. 71–86. ISBN9780128116876.
42. Brady, N.; Weil, R. Elements of the Nature and Properties of Soils, 2nd ed.; Pearson Education: Upper SaddleRiver, NJ, USA, 2004.
43. Wilson, M.J. The origin and formation of clay minerals in soils: Past, present and future perspectives. ClayMiner. 1999, 34, 7–25. [CrossRef]
44. Churchman, G.J. Is the geological concept of clay minerals appropriate for soil science? A literature-basedand philosophical analysis. Phys. Chem. Earth 2010, 35, 927–940. [CrossRef]
45. Feng, X.; Simpson, A.; Simpson, M. Chemical and mineralogical controls on humic acid sorption to claymineral surfaces. Org. Geochem. 2005, 36, 1553–1566. [CrossRef]
46. Block, K.A.; Trusiak, A.; Katz, A.; Alimova, A.; Wei, H.; Gottlieb, P.; Steiner, J.C. Applied Clay Science Exfoliationand intercalation of montmorillonite by small peptides. Appl. Clay Sci. 2015, 107, 173–181. [CrossRef]
47. Jindaluang, W.; Kheoruenromne, I.; Suddhiprakarn, A.; Pal Singh, B.; Singh, B. Influence of soil texture andmineralogy on organic matter content and composition in physically separated fractions soils of Thailand.Geoderma 2013, 195–196, 207–219. [CrossRef]
48. Singh, B.P.; Hatton, B.J.; Singh, B.; Cowie, A.L.; Kathuria, A. Influence of Biochars on Nitrous Oxide Emissionand Nitrogen Leaching from Two Contrasting Soils. J. Environ. Qual. 2010, 39, 1224. [CrossRef]
49. Vogel, C.; Heister, K.; Buegger, F.; Tanuwidjaja, I.; Haug, S.; Schloter, M.; Kögel-knabner, I. Clay mineralcomposition modifies decomposition and sequestration of organic carbon and nitrogen in fine soil fractions.Biol. Fertil. Soils 2015, 51, 427–442. [CrossRef]
50. Hatton, P.-J.; Remusat, L.; Zeller, B.; Brewer, E.A.; Derrien, D. NanoSIMS investigation of glycine-derived Cand N retention with soil organo-mineral associations. Biogeochemistry 2015, 125, 303–313. [CrossRef]
51. Hatton, P.-J.; Bodé, S.; Angeli, N.; Boeckx, P.; Zeller, B.; Boiry, S.; Gelhaye, L.; Derrien, D. Assimilation andaccumulation of C by fungi and bacteria attached to soil density fractions. Soil Biol. Biochem. 2014, 79,132–139. [CrossRef]
52. Baldock, J.; Nelson, P. Soil organic matter. In Handbook of Soil Science; Summer, M., Ed.; CRC Press: New York,NY, USA, 1999; pp. B25–B84.
53. Chenu, C.; Plante, A. Clay-sized organo-mineral complexes in a cultivation chronosequence: Revisiting theconcept of the “primary organo-mineral complex”. Eur. J. Soil Sci. 2006, 57, 596–607. [CrossRef]
54. Battey, M. Mineralogy for Students; Hafner Press: New York, NY, USA, 1972.55. Barthelmy, D. Webmineral—Mineralogy Database. Available online: http://www.webmineral.com (accessed
on 10 July 2018).56. Deer, W.; Howie, R.; Zussman, J. An Introduction to the Rock-Forming Minerals; Longman: London, UK, 1966.57. Fischenner, R. Données Des Principales Espèces Minérales; Société de l’industrie minérale: St-Étienne (Loire),
France, 1977.58. Jouenne, C. Céramique Générale—Notions de physico-chimie. Tome 1; Gauthier-Villars: Paris, France, 1960. (In French)59. Mincryst Crystallographic and Crystallochemical Database for Minerals and Their Structural Analogues.
Available online: http://database.iem.ac.ru/mincryst (accessed on 10 July 2018).60. Mindat Mineral and Locality Database. Available online: http://www.mindat.org (accessed on 10 July 2018).
© 2020 by the authors. Licensee MDPI, Basel, Switzerland. This article is an open accessarticle distributed under the terms and conditions of the Creative Commons Attribution(CC BY) license (http://creativecommons.org/licenses/by/4.0/).