long-term potential for increased shipping efficiency through adoption of industry-leading practices
TRANSCRIPT
www.theicct.org
JULY 2013white paper
Beijing | Berlin | Brussels | san Francisco | Washington
Long-term potentiaL for increased
shipping efficiency through the
adoption of industry-Leading practices
authors: haifeng Wang and nic Lutsey
Acknowledgementsthis work, funded by the climateWorks Foundation, is part of the icct’s World shipping efficiency indices project. the authors thank irene Kwan, sarah chambliss Dan rutherford, tristan smith, eoin o’Keefe, and lucy aldous for their technical contributions and Fanta Kamakaté, alyson azzara, Drew Kodjak, antoine Kedzierski, and aoife o’leary for their critical reviews.
© 2013 international council on clean transportation
1225 i street nW, suite 900, Washington Dc 20005
www.theicct.org | [email protected]
i
tAble of contents
executive summary ....................................................................................................................1
Section 1: introduction ............................................................................................................ 3
shipping in context .................................................................................................................................4
overview ..................................................................................................................................................... 5
Section 2: analysis and Data Sources ....................................................................................6
ship efficiency technologies and practices ................................................................................... 6
global satellite data on ship movement.......................................................................................... 9
ship efficiency and co2 emissions ....................................................................................................11
global shipping fleet turnover model .............................................................................................12
Section 3: Findings ...................................................................................................................15
contributing factors to ship co2 emissions ..................................................................................15
Variation by ship type ...........................................................................................................................17
scenario findings.....................................................................................................................................19
Section 4: Conclusions ...........................................................................................................23
references ................................................................................................................................26
ii
ICCT white paper
list of figuresFigure eS-1. shipping fleet co2 emissions with efficiency standards, additional technologies, and full deployment of best available technology and best practices for in-use ship efficiency. ........................................................................................................................... 2
Figure 1. Marine shipping’s contribution to global transportation climate emissions and petroleum consumption, 2010 ................................................................................... 4
Figure 2. Potential fuel use and co2 reductions from various efficiency approaches for shipping vessels ............................................................................................................. 6
Figure 3. Marginal co2 abatement costs of selected ship efficiency options in 2020 ...... 7
Figure 4. illustration of global activities and efficiency using two weeks of containership data ............................................................................................................................... 10
Figure 5. in-use ship efficiency, technical efficiency, and industry-leading efficiency within each ship type ............................................................................................................ 11
Figure 6. technical and in-use co2 emissions from 2011 containerships ..............................15
Figure 7. co2 emission intensity from 2011 containerships, showing reduced carbon emissions for newer ships .......................................................................................................16
Figure 8. in-use co2 emission rate and speed for 2011 containerships by ship size ......... 17
Figure 9. comparison of this analysis’ 2011 ship design, in-use, top 5% leading co2 emissions, and operating speed compared to iMo 2007 data .........................................18
Figure 10. co2 intensity of international shipping under different pathways ......................21
Figure 11. global shipping fleet co2 emissions with new ship efficiency standards, additional technologies and operational measures, and deployment of industry-leading in-use efficiency measures .....................................................................................21
Figure 12. global shipping fleet petroleum use with new ship efficiency standards, additional technologies and operational measures, and deployment of industry-leading in-use efficiency measures...............................................................................22
Figure 13. carbon intensity and global transport activity of different freight modes .....24
list of tAblestable 1. examples of ship efficiency measures that can be used to meet the eeDi and could be promoted by in-use efficiency policy .................................................... 9
table 2. Data sources utilized in this analysis ................................................................................... 12
table 3. summary illustration of fleet model calibration for key variables ...........................14
table 4. Description of scenarios considered in this assessment .............................................19
1
Long-term potentiaL for increased shipping efficiency
executive summAryMaritime shipping is highly fuel-efficient, but its sheer volume and rapid growth make it a major consumer of energy and source of carbon emissions. as the shipping industry and governments seek ways to reduce shipping’s overall energy and carbon footprint, the answers to many questions remain elusive. among these questions are how much variation in shipping efficiency is seen in the real-world fleet, and how quickly shipping can move to embrace best technical and operational practices to increase shipping efficiency.
this research offers a novel analysis that connects the 2011 in-use fleet characteristics, first-ever global satellite data on ship movement, and technical literature on ship efficiency technology to assess the long-term prospects for increasing shipping efficiency. the underlying satellite-based data allows for more in-depth knowledge of real-world operational ship speed and its relation to ship efficiency than previous analyses. this analysis also investigates how efficiency characteristics (age, size, technology, operational practices) are each influencing the efficiency of the shipping fleet, and develops a ship stock turnover model to independently track technical and operational efficiency practices in ships.
the findings indicate that industry-leading ships are about twice as efficient as industry laggards across major ship types, due to new ships’ technical efficiency improvements, operational speed practices, and ship size differences. to put this in perspective, for example, the top 5% of containerships have a carbon dioxide (co2) emission intensity (i.e., emission rate per unit of cargo carried) that is 38% lower than industry-average containerships, whereas the bottom 5% have 48% higher co2 emissions. even broader efficiency variation is seen between shipping industry leaders and laggards across the other major ship types (e.g., tankers, general cargo, bulk carriers). such a broad diversity in in-use ship efficiency is the result of a variety of underlying factors. Part of this variation is a matter of how quickly new ship technology is entering the fleet, and how new, generally larger ships are increasingly and substantially more efficient. in addition, newer ships tend to have more sophisticated engine controls that allow them to more fully and more frequently benefit from speed reduction, so that their operational in-use efficiency more closely matches the technical efficiency as designed. these findings indicate that the sector has a long way to go before best operational practices and best available efficiency technologies fully enter the shipping fleet.
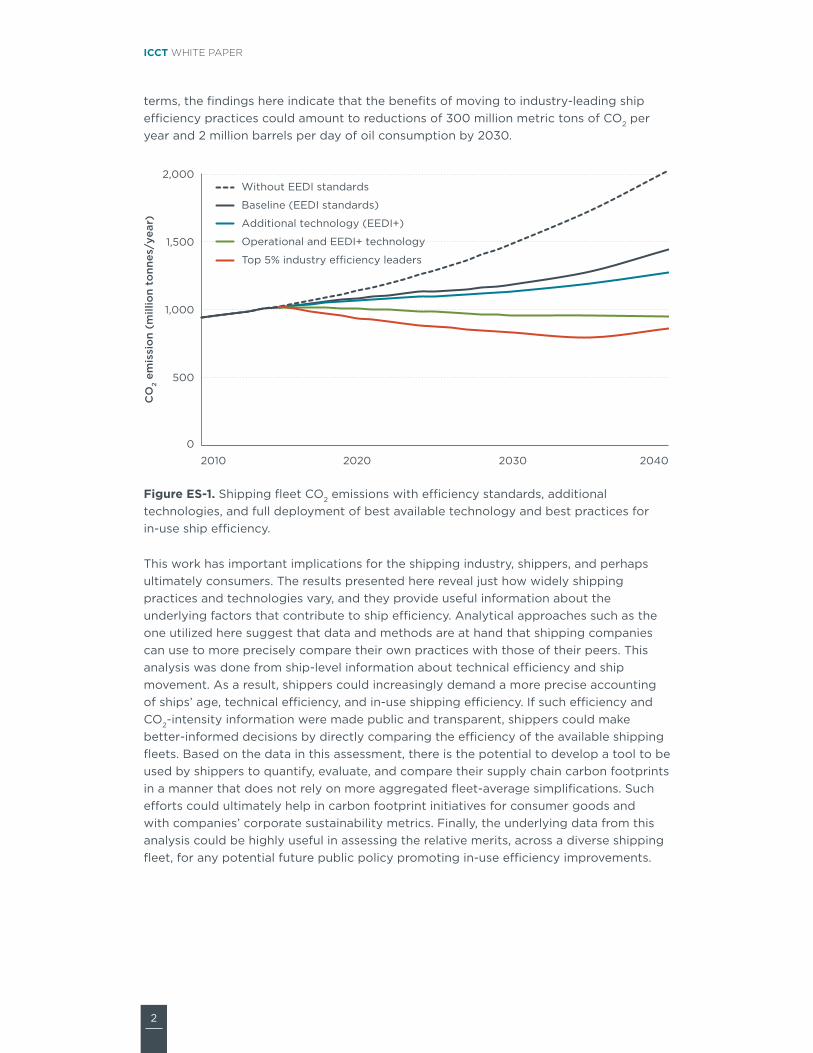
this report analyzes several low-carbon pathways that investigate the expansion of best in-use ship efficiency practices across the shipping fleet over the long term. Figure es-1 illustrates the high-level fleet findings from the analysis. the figure illustrates scenarios for the existing energy efficiency Design index (eeDi) standards, technical efficiency that goes beyond eeDi compliance, additional operational strategies for efficiency, and a final scenario in which the whole fleet embraces today’s leading efficiency practices.
this analysis indicates that, by fully embracing the available technical and in-use practices of the low-carbon industry leaders of today, there is the potential to approximately cut international shipping’s co2 emissions in half by 2040. that is, with the use of class-leading co2-intensity technology (e.g., state-of-the-art diesel engines with electronic controls) and in-use operational measures (e.g., speed reduction) that industry leaders are already putting in practice, the shipping fleet can reduce co2 in absolute terms even while business-as-usual freight movement doubles. in quantitative
2
ICCT white paper
terms, the findings here indicate that the benefits of moving to industry-leading ship efficiency practices could amount to reductions of 300 million metric tons of co2 per year and 2 million barrels per day of oil consumption by 2030.
0
500
1,000
1,500
2,000
2010 2020 2030 2040
CO
2 em
issi
on
(mill
ion
tonn
es/y
ear)
Without EEDI standards
Baseline (EEDI standards)
Additional technology (EEDI+)
Operational and EEDI+ technology
Top 5% industry efficiency leaders
Figure eS-1. shipping fleet co2 emissions with efficiency standards, additional technologies, and full deployment of best available technology and best practices for in-use ship efficiency.
this work has important implications for the shipping industry, shippers, and perhaps ultimately consumers. the results presented here reveal just how widely shipping practices and technologies vary, and they provide useful information about the underlying factors that contribute to ship efficiency. analytical approaches such as the one utilized here suggest that data and methods are at hand that shipping companies can use to more precisely compare their own practices with those of their peers. this analysis was done from ship-level information about technical efficiency and ship movement. as a result, shippers could increasingly demand a more precise accounting of ships’ age, technical efficiency, and in-use shipping efficiency. if such efficiency and co2-intensity information were made public and transparent, shippers could make better-informed decisions by directly comparing the efficiency of the available shipping fleets. Based on the data in this assessment, there is the potential to develop a tool to be used by shippers to quantify, evaluate, and compare their supply chain carbon footprints in a manner that does not rely on more aggregated fleet-average simplifications. such efforts could ultimately help in carbon footprint initiatives for consumer goods and with companies’ corporate sustainability metrics. Finally, the underlying data from this analysis could be highly useful in assessing the relative merits, across a diverse shipping fleet, for any potential future public policy promoting in-use efficiency improvements.
3
Long-term potentiaL for increased shipping efficiency
section 1: introduction government agencies, environmental stakeholders, industry representatives, and consumers each struggle to find accurate, detailed information about the carbon footprint of goods that have been shipped thousands of miles around the world via various modes of transportation. international shipping, in particular, presents a major uncertainty in assessing the energy and climate impact of the global movement of goods. a detailed, up-to-date, and useful understanding of the international shipping fleet’s efficiency characteristics has proved elusive. this data uncertainty becomes even greater when trying to quantitatively understand the carbon emissions associated with a given shipping company, route, or ship type.
Many efforts have helped quantify and set benchmarks for ship efficiency, to assist in understanding and decision-making regarding the carbon footprint of the goods throughout their supply chain. two such examples are mentioned here. one is the clean cargo Working group, which collects data from major shippers and shipping lines, and benchmarks co2 emissions of each shipping company and co2 per unit of cargo transported on specific trade lanes (Bsr, 2011, 2012). in this initiative, each participant receives an annual scorecard that compares its carbon performance to the industry average. the pioneering initiative has propelled shippers and shipping companies to measure their co2 emissions in the supply chain, and invest in meaningful ways to lower their carbon footprints. another initiative, led by rightship, seeks to link ship efficiency with charter rates based on a retrospective estimation of ships’ energy efficiency Design index (eeDi) within each of seven ship categories (rightship, 2011). Because information about ships’ efficiency has otherwise been scarce, the rating program has become an effective tool for charterers to evaluate potential fuel cost savings and contract with more efficient ships.
Parallel to these efforts in the private sector, policymakers around the world have sought to examine policies to curtail the growth of shipping carbon emissions. two ghg reports commissioned by the international Maritime organization (iMo) brought forth valuable information on ship speed, ship utilization, fuel consumption, and associated emission trends (Buhaug et al, 2009; skjølsvik et al, 2000). the second iMo ghg study demonstrated that the co2 emissions growth from shipping, if unchecked, will double in the next few decades (Buhaug et al, 2009). such trends are incompatible with long-term global climate stabilization goals that will require dramatic carbon reductions from every industrial sector. the second iMo ghg study paved the way for an era of active policy dialogue that included the creation of the mandatory eeDi standards for new ship efficiency and the complementary ship energy efficiency Management Plan (seeMP) for in-use efficiency improvement, as well as a discussion of market-based measures.
Despite progress in understanding the state of ship efficiency, the available data remains relatively sparse compared with that of other industrial sectors and modes that have been more actively analyzed and regulated. the heterogeneity of the global shipping industry has made it difficult to characterize its general efficiency. the lack of ship-specific operational data has precluded more rigorous and detailed analysis relating the fundamental efficiency of a given ship to its in-use efficiency. shifts in ship operation, following the drop in international trade during the global 2008–2010 economic downturn, further complicate analysis. the use of slow steaming—to address the over-capacity of ships, reduce fuel expenses, and improve the corporate bottom line—may significantly change the industry landscape and alter ship operation going forward.
4
ICCT white paper
speed reduction also results in substantial co2 savings proportional to the lower fuel use (see, e.g., cariou, 2012; Faber et al, 2012). these industry shifts suggest that more refined and up-to-date data are needed to characterize the carbon emissions and efficiency characteristics of the current and future shipping fleet.
Shipping in Contextthe shipping industry is both a major contributor to climate change and a relatively low-carbon mode of transporting freight. shipping tends to have the lowest carbon footprint per unit of cargo transported (Buhaug et al, 2009), but ships carry more than half of international goods by tonne-mile (based on Façanha et al, 2012; unctaD 2012; Boeing, 2012; aci, 2013), driving up the shipping industry’s petroleum use and co2 emissions.
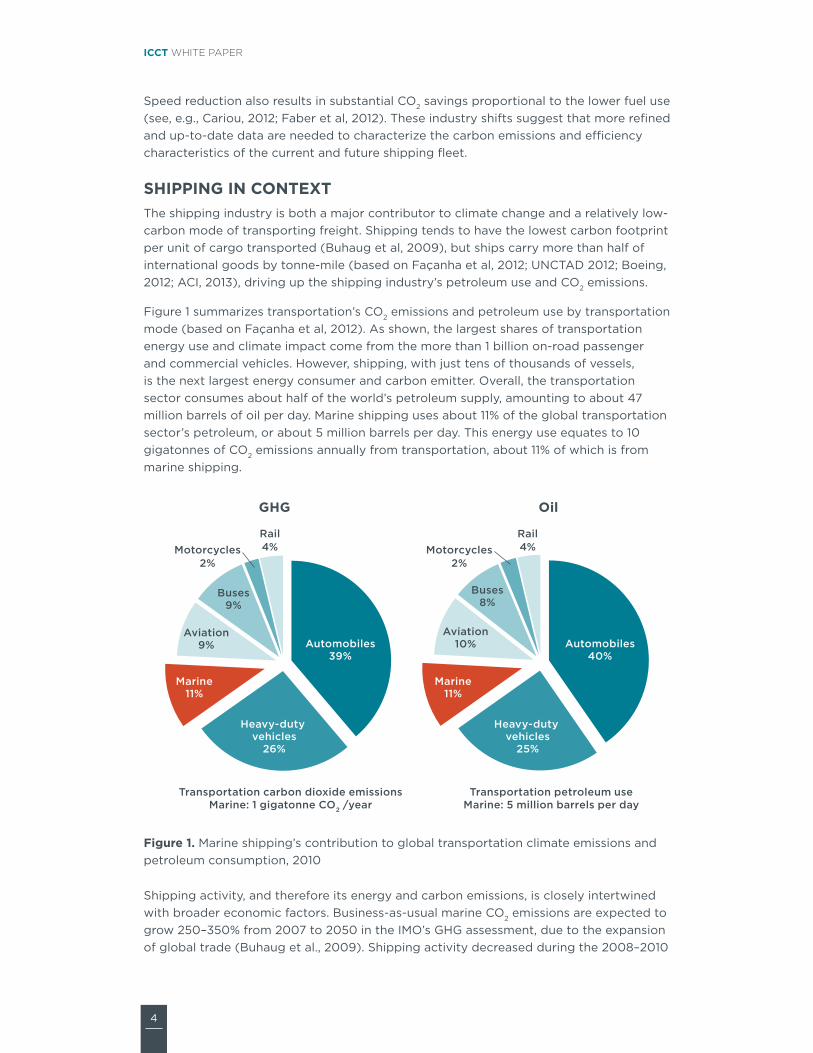
Figure 1 summarizes transportation’s co2 emissions and petroleum use by transportation mode (based on Façanha et al, 2012). as shown, the largest shares of transportation energy use and climate impact come from the more than 1 billion on-road passenger and commercial vehicles. however, shipping, with just tens of thousands of vessels, is the next largest energy consumer and carbon emitter. overall, the transportation sector consumes about half of the world’s petroleum supply, amounting to about 47 million barrels of oil per day. Marine shipping uses about 11% of the global transportation sector’s petroleum, or about 5 million barrels per day. this energy use equates to 10 gigatonnes of co2 emissions annually from transportation, about 11% of which is from marine shipping.
GHG Oil
From "Freight compare CO2 shipping v1.xlsx" (May 20, 2013)
Automobiles39%
Heavy-duty vehicles
26%
Marine11%
Aviation9%
Buses9%
Motorcycles2%
Rail4%
Automobiles40%
Heavy-duty vehicles
25%
Marine11%
Aviation10%
Buses8%
Motorcycles2%
Rail4%
Transportation carbon dioxide emissionsMarine: 1 gigatonne CO2 /year
Transportation petroleum useMarine: 5 million barrels per day
Figure 1. Marine shipping’s contribution to global transportation climate emissions and petroleum consumption, 2010
shipping activity, and therefore its energy and carbon emissions, is closely intertwined with broader economic factors. Business-as-usual marine co2 emissions are expected to grow 250–350% from 2007 to 2050 in the iMo’s ghg assessment, due to the expansion of global trade (Buhaug et al., 2009). shipping activity decreased during the 2008–2010
5
Long-term potentiaL for increased shipping efficiency
downturn but has now recovered to approximately pre-recession levels (unctaD, 2012) and is widely expected to resume its previous long-term growth trend.
the implementation of the eeDi, although a significant first step for ship efficiency, will slow, but not bring an absolute reduction in, shipping co2 emissions. it will also do so only gradually over several decades as the entire fleet turns over and becomes eeDi-compliant (icct, 2011a; iMo, 2012). older, less efficient ships that were built through the early 2000s, at times of lower fuel prices, higher profitability, and limited attention to efficiency and carbon emissions, will be in service well into the next decade and beyond.
the large remaining—and more near-term—opportunity for reducing co2 emissions in the industry therefore lies in the improvement of energy efficiency for in-use ships. recent years have seen the emergence of highly cost-effective energy-saving technologies and maintenance routines, making such co2 savings a real possibility. to better reduce the risks inherent in the price of oil and its volatility, further energy-saving innovations continue to be developed in diesel engines, computerization, and operational practices among the most progressive ships and shipping lines (see, e.g., Kat et al, 2009; Maersk line, 2012; eide et al, 2013).
overviewthis research provides a novel analysis that connects 2011 in-use shipping fleet characteristics, first-ever satellite data on ship movement, and technical literature on ship efficiency technology to analyze the long-term prospects for increasing shipping efficiency. the analysis provides a synthesis of several new data sources to assess how, why, and how widely ship efficiency and co2 emissions vary across the current fleet. a primary objective of this report is to explore the long-term implications of a recent 2013 analysis that provides a snapshot of global ship movement and ship efficiency in 2011. the recent study by university college london (smith et al, 2013) sheds light on the variation of real-world co2 emissions and energy efficiency from international shipping. that study was the first to analyze detailed, satellite-based ship-level operation; technical efficiency attributes; and operational in-use efficiency characteristics for the global shipping fleet.
this assessment links the smith et al (2013) analysis to other work on technical potential, operational efficiency practices, and fleet turnover characteristics to examine avenues for longer-term implementation of best fleet practices for the reduction of co2 emissions and fuel consumption. to assess these results, as well as their implications over the longer term, this analysis also develops a ship stock turnover model to independently track how age, size, technology, and operational practices influence the efficiency of the shipping fleet and may increasingly reduce shipping’s carbon intensity.
this report is laid out as follows. after this introductory section, section 2 of this report describes the analytical approach and data sources used in this assessment. section 3 reports on the findings from the analysis on best current practices for reducing the shipping fleet’s co2 emissions. section 4 makes note of several high-level conclusions and implications from the work.
6
ICCT white paper
section 2: AnAlysis And dAtA sourcesthis section examines ship efficiency technologies and practices, discusses global ship activity data, and introduces ship turnover characteristics in order to examine potential long-term shifts in the international shipping fleet. it summarizes the major data sources and assumptions used in the overall analysis, which synthesizes data from a number of sources to illustrate how the uptake of new technologies and operational practices affect the energy efficiency of the shipping fleet.
Ship eFFiCienCY teChnoLogieS anD praCtiCeSthere are a number of energy loads and losses on ships, points at which energy is lost, consumed, or dissipated (aea, 2007). near the point of combustion, these occur through thermodynamics, engine friction, thermal exhaust energy, and auxiliary loads within the engine compartment. Mechanical and friction losses in converting the engine torque and speed from the engine to the propeller are also important. the propeller thrust energy must overcome the prevailing hydrodynamic and aerodynamic loads to move the ship through the water and air. in addition to the main engines, boilers and auxiliary engines have similar thermodynamic and friction losses. Many smaller energy demands—lighting, pumps, and fans—are also found on board ships. these each presents an opportunity for vessels to increase efficiency (Buhaug et al, 2009).
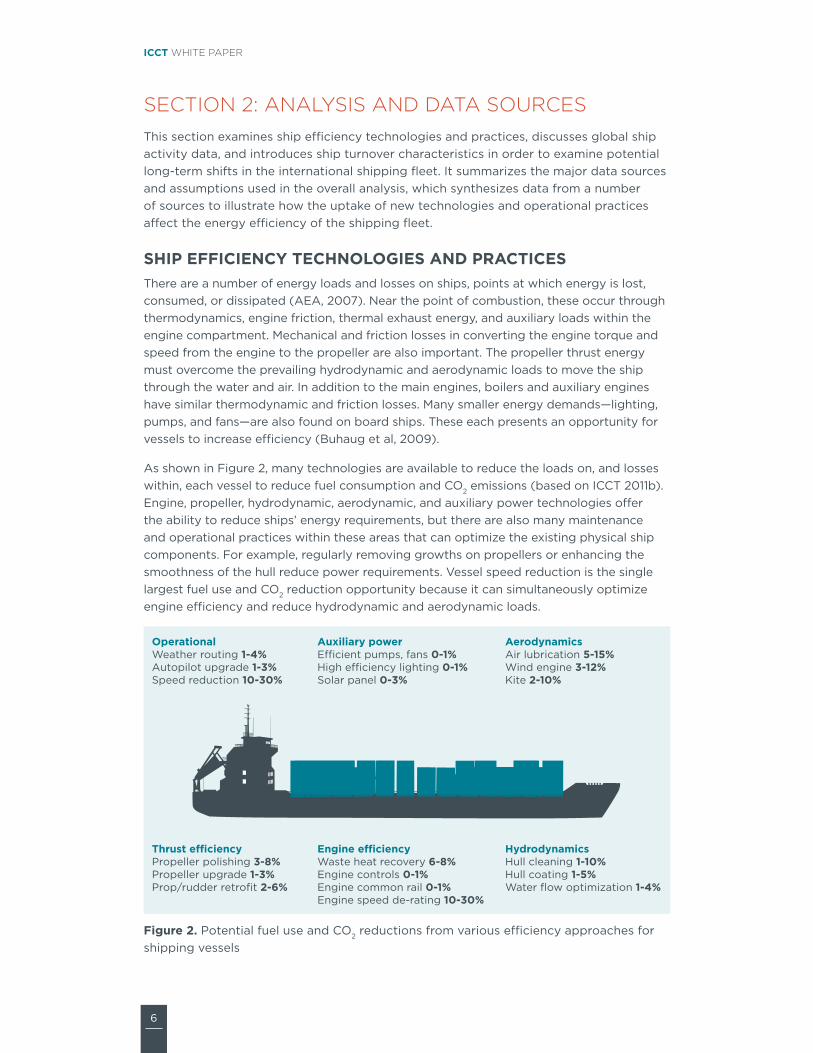
as shown in Figure 2, many technologies are available to reduce the loads on, and losses within, each vessel to reduce fuel consumption and co2 emissions (based on icct 2011b). engine, propeller, hydrodynamic, aerodynamic, and auxiliary power technologies offer the ability to reduce ships’ energy requirements, but there are also many maintenance and operational practices within these areas that can optimize the existing physical ship components. For example, regularly removing growths on propellers or enhancing the smoothness of the hull reduce power requirements. Vessel speed reduction is the single largest fuel use and co2 reduction opportunity because it can simultaneously optimize engine efficiency and reduce hydrodynamic and aerodynamic loads.
OperationalWeather routing 1-4%Autopilot upgrade 1-3% Speed reduction 10-30%
Auxiliary powerE�cient pumps, fans 0-1%High e�ciency lighting 0-1%Solar panel 0-3%
AerodynamicsAir lubrication 5-15%Wind engine 3-12%Kite 2-10%
Thrust e�ciencyPropeller polishing 3-8%Propeller upgrade 1-3%Prop/rudder retrofit 2-6%
Engine e�ciencyWaste heat recovery 6-8% Engine controls 0-1%Engine common rail 0-1%Engine speed de-rating 10-30%
HydrodynamicsHull cleaning 1-10%Hull coating 1-5%Water flow optimization 1-4%
Figure 2. Potential fuel use and co2 reductions from various efficiency approaches for shipping vessels
7
Long-term potentiaL for increased shipping efficiency
as seen from a number of analyses by various research groups, available technologies and known operational approaches can significantly increase ship efficiency, often with low or negative overall cost—that is, the amortized investment has fuel-saving benefits that more than offset upfront costs. research by the aea, icct, ce Delft, and DnV has demonstrated that available efficiency approaches have the ability to reduce fuel use and co2 from vessels by 20–40% by 2020 and 30-55% by 2030 (aea, 2008; Buhaug et al, 2009; ce Delft, 2009; DnV, 2010; eide et al, 2013; icct, 2011b; iMo, 2012). these studies are based upon bottom-up analyses of baseline ship technology and technologies that are available and emerging in the marketplace.
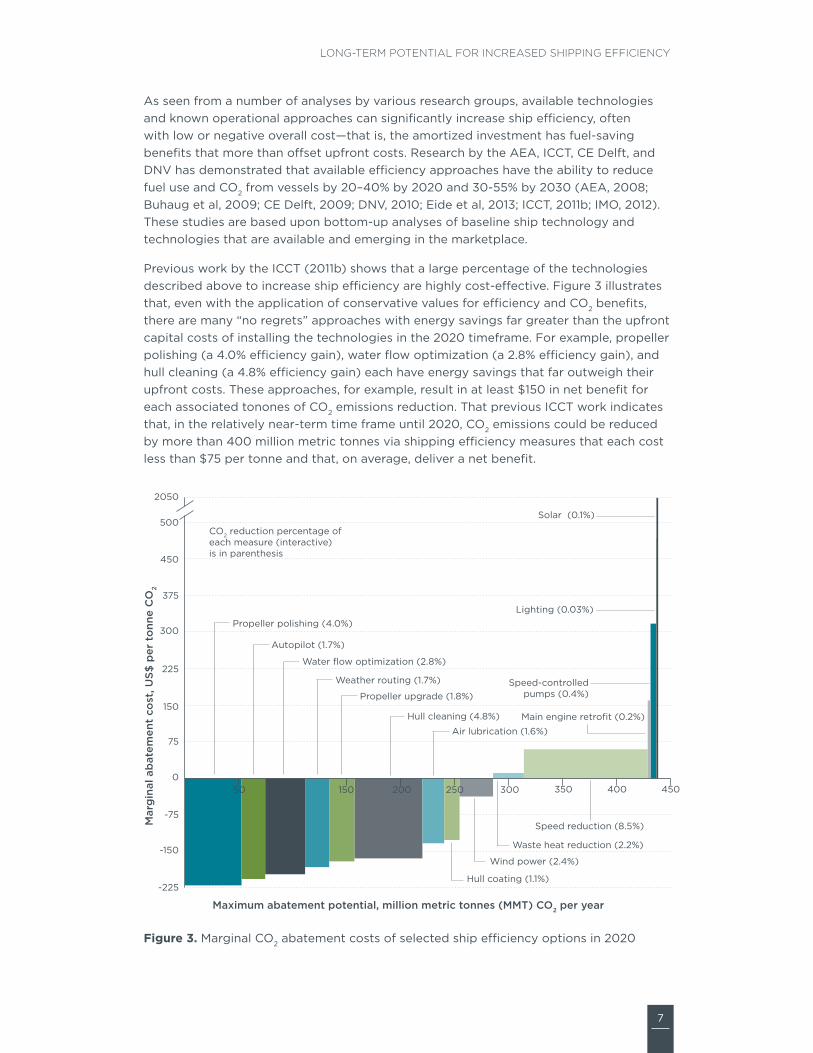
Previous work by the icct (2011b) shows that a large percentage of the technologies described above to increase ship efficiency are highly cost-effective. Figure 3 illustrates that, even with the application of conservative values for efficiency and co2 benefits, there are many “no regrets” approaches with energy savings far greater than the upfront capital costs of installing the technologies in the 2020 timeframe. For example, propeller polishing (a 4.0% efficiency gain), water flow optimization (a 2.8% efficiency gain), and hull cleaning (a 4.8% efficiency gain) each have energy savings that far outweigh their upfront costs. these approaches, for example, result in at least $150 in net benefit for each associated tonones of co2 emissions reduction. that previous icct work indicates that, in the relatively near-term time frame until 2020, co2 emissions could be reduced by more than 400 million metric tonnes via shipping efficiency measures that each cost less than $75 per tonne and that, on average, deliver a net benefit.
-225
375
75
0
-75
-150
225
300
150
450
500
2050
50 200 250 300 350 400 450100 150
Autopilot (1.7%)
Propeller upgrade (1.8%)
Water flow optimization (2.8%)
Weather routing (1.7%)
Hull cleaning (4.8%)
Propeller polishing (4.0%)
Hull coating (1.1%)
Wind power (2.4%)
Waste heat reduction (2.2%)
Air lubrication (1.6%)
Speed reduction (8.5%)
Lighting (0.03%)
Speed-controlled pumps (0.4%)
Main engine retrofit (0.2%)
Solar (0.1%)
Maximum abatement potential, million metric tonnes (MMT) CO2 per year
Mar
gin
al a
bat
emen
t co
st, U
S$ p
er t
onn
e C
O2
CO2 reduction percentage of each measure (interactive) is in parenthesis
Figure 3. Marginal co2 abatement costs of selected ship efficiency options in 2020
8
ICCT white paper
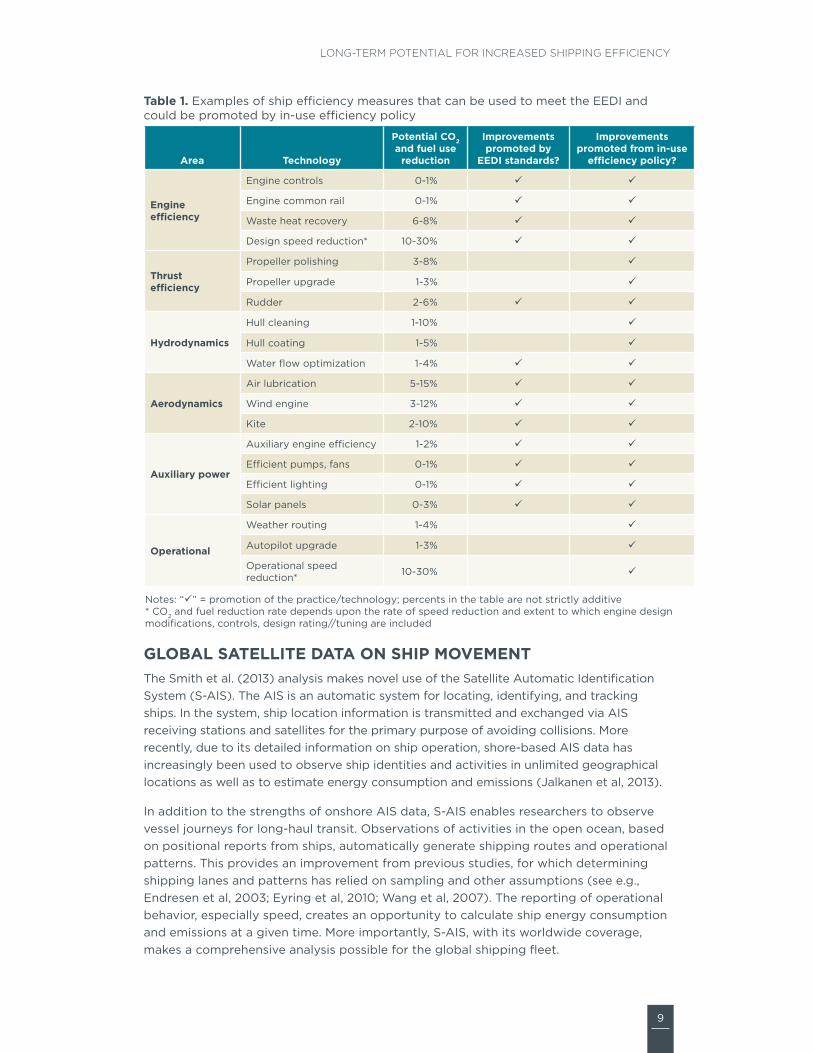
table 1 summarizes the available technology and operational options for improving ship efficiency (icct, 2011b) with an indication of whether eeDi and in-use efficiency policies promote their increased uptake. the options include engine efficiency approaches such as common rail and waste heat recovery to optimize engine efficiency under different operating conditions; propeller-related technologies such as propeller upgrade and propeller-rudder retrofit to reduce drag on the rudder and propeller and increase the efficiency of the transfer of the engine work to ship thrust; and hydrodynamic and aerodynamic approaches that reduce the load on the ship that must be overcome by the propulsion system. in addition, there are auxiliary power efficiency options and a number of practices that can substantially reduce fuel use.
table 1 also itemizes the extent to which the efficiency practices might be promoted by the existing eeDi standards for new-build vessels and whether they could be promoted by an in-use ship efficiency policy. as suggested by the table, a number of options not fully promoted by the iMo’s eeDi standards, such as operational speed reduction, hull cleaning, or propeller polishing, would be under a company policy or iMo regulation that targeted in-use efficiency. in addition, many of the efficiency approaches could be pushed more toward the upper bound of the co2 and fuel use reduction ranges shown if robust in-use ship efficiency policy complemented the eeDi standards for new ship designs.
9
Long-term potentiaL for increased shipping efficiency
table 1. examples of ship efficiency measures that can be used to meet the eeDi and could be promoted by in-use efficiency policy
area technology
potential Co2 and fuel use
reduction
improvements promoted by
eeDi standards?
improvements promoted from in-use
efficiency policy?
engine efficiency
engine controls 0-1%
engine common rail 0-1%
Waste heat recovery 6-8%
Design speed reduction* 10-30%
thrust efficiency
Propeller polishing 3-8%
Propeller upgrade 1-3%
rudder 2-6%
hydrodynamics
hull cleaning 1-10%
hull coating 1-5%
Water flow optimization 1-4%
aerodynamics
air lubrication 5-15%
Wind engine 3-12%
Kite 2-10%
auxiliary power
auxiliary engine efficiency 1-2%
efficient pumps, fans 0-1%
efficient lighting 0-1%
solar panels 0-3%
operational
Weather routing 1-4%
autopilot upgrade 1-3%
operational speed reduction* 10-30%
notes: “” = promotion of the practice/technology; percents in the table are not strictly additive* co2 and fuel reduction rate depends upon the rate of speed reduction and extent to which engine design modifications, controls, design rating//tuning are included
gLobaL SateLLite Data on Ship movementthe smith et al. (2013) analysis makes novel use of the satellite automatic identification system (s-ais). the ais is an automatic system for locating, identifying, and tracking ships. in the system, ship location information is transmitted and exchanged via ais receiving stations and satellites for the primary purpose of avoiding collisions. More recently, due to its detailed information on ship operation, shore-based ais data has increasingly been used to observe ship identities and activities in unlimited geographical locations as well as to estimate energy consumption and emissions (jalkanen et al, 2013).
in addition to the strengths of onshore ais data, s-ais enables researchers to observe vessel journeys for long-haul transit. observations of activities in the open ocean, based on positional reports from ships, automatically generate shipping routes and operational patterns. this provides an improvement from previous studies, for which determining shipping lanes and patterns has relied on sampling and other assumptions (see e.g., endresen et al, 2003; eyring et al, 2010; Wang et al, 2007). the reporting of operational behavior, especially speed, creates an opportunity to calculate ship energy consumption and emissions at a given time. More importantly, s-ais, with its worldwide coverage, makes a comprehensive analysis possible for the global shipping fleet.
10
ICCT white paper
the s-ais transceiver sends different messages, each with varying information at varying time intervals. For example, “Message 1” is transmitted every 2 to 10 seconds and includes positional data such as longitude and latitude, as well as the vessel’s unique Maritime Mobile service identity (MMsi) number. this message also reports the speed over ground. the iMo ship identification number is reported in “Message 5” transmitted every 6 minutes. this allows researchers to link MMsi with the iMo number used by some major ship data providers. in this analysis, the ais data has been matched with ship information in clarkson intelligence.
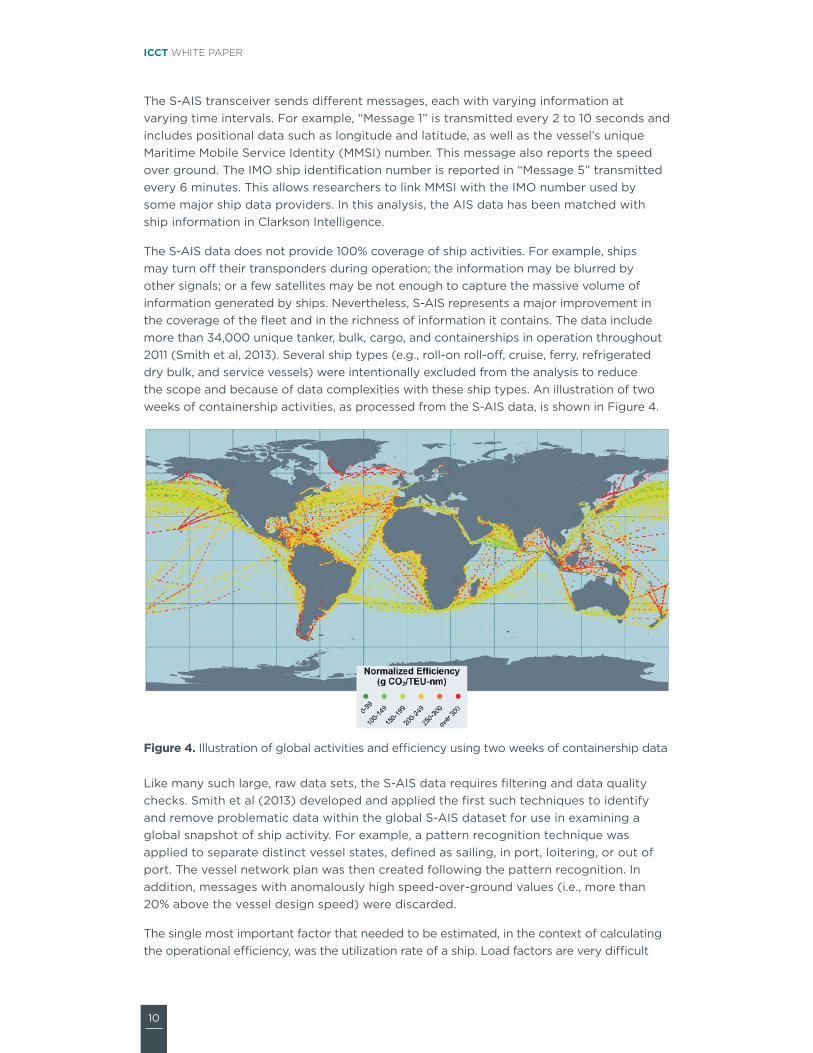
the s-ais data does not provide 100% coverage of ship activities. For example, ships may turn off their transponders during operation; the information may be blurred by other signals; or a few satellites may be not enough to capture the massive volume of information generated by ships. nevertheless, s-ais represents a major improvement in the coverage of the fleet and in the richness of information it contains. the data include more than 34,000 unique tanker, bulk, cargo, and containerships in operation throughout 2011 (smith et al, 2013). several ship types (e.g., roll-on roll-off, cruise, ferry, refrigerated dry bulk, and service vessels) were intentionally excluded from the analysis to reduce the scope and because of data complexities with these ship types. an illustration of two weeks of containership activities, as processed from the s-ais data, is shown in Figure 4.
Figure 4. illustration of global activities and efficiency using two weeks of containership data
like many such large, raw data sets, the s-ais data requires filtering and data quality checks. smith et al (2013) developed and applied the first such techniques to identify and remove problematic data within the global s-ais dataset for use in examining a global snapshot of ship activity. For example, a pattern recognition technique was applied to separate distinct vessel states, defined as sailing, in port, loitering, or out of port. the vessel network plan was then created following the pattern recognition. in addition, messages with anomalously high speed-over-ground values (i.e., more than 20% above the vessel design speed) were discarded.
the single most important factor that needed to be estimated, in the context of calculating the operational efficiency, was the utilization rate of a ship. load factors are very difficult

11
Long-term potentiaL for increased shipping efficiency
to accurately estimate. the s-ais provides the information on draught, from which the utilization rate can be derived. But the information is inputted manually, and a comparison with the iMo data showed abnormally low utilization rates for some major ship types. smith et al (2013) used the iMo utilization rate to calculate ship operational efficiency and denoted it as normalized operational efficiency. in this report, the term in-use operational efficiency is based directly upon this normalized operational efficiency data and therefore incorporates the same average utilization rates by ship type as the iMo. additionally, to ensure the reliability of the s-ais data, some indicators were developed to cross-check the coverage. these included the percentage of total days at sea on which the loaded ballast assessment is based and the total number of voyages detected on ais, among others.
Ship eFFiCienCY anD Co2 emiSSionSthe stock turnover model connects ship activity with the efficiency characteristics to determine the fuel consumption and co2 emissions of the international shipping fleet. several factors about ship efficiency are explicitly modeled, including an efficiency degradation rate and the penetration of new energy efficiency technologies and practices. the efficiency degradation rates reflect the incremental wear of various parts of a ship and the potential for reduced efficiency of fuel-saving strategies as ships age.
the primary data to incorporate the efficiency and in-use efficiency capabilities of the shipping fleet at large for this analysis are based on smith et al (2013). Figure 5 illustrates, for nine ship types, how the as-designed technical efficiency differs from average in-use ship efficiency. technical design efficiency is synonymous with eeDi efficiency, but here the measure is being applied to the in-use 2011 fleet based on ship characteristics used in clarksons (2012). By comparing the design and operational efficiency, the figure illustrates how operational in-use co2 emissions far exceed the design co2 emission rates in each case.
0
5
10
15
20
25
Ship
em
issi
ons
(g
ram
CO
2 /
tonn
e-nm
)
Operational in-use ship efficiency
Technical design efficiency
Top 10% in-use efficiency leaders
Top 5% in-use efficiency leaders
Crude
tank
er
Produc
t tan
ker
Chem
ical t
anke
r
Dry b
ulke
r
Gener
al Car
go
LNG ta
nker
LPG ta
nker
Contain
ersh
ip
Pure
car c
arrie
r
Avera
ge
Figure 5. in-use ship efficiency, technical efficiency, and industry-leading efficiency within each ship type
12
ICCT white paper
also shown in Figure 5: if each ship type, on average, operated at its design efficiency, the fleet would have about 38% lower co2 emissions in operation, although some types, such as containerships, already operate much closer to their design efficiency. one ship type stands out: the product tanker data are much higher than the average design efficiency due to the inclusion of boiler fuel use in the operational in-use data but not in their design efficiency data. the figure also illustrates the much greater in-use efficiency, and much lower co2 emissions, of the “top 10%” and “top 5%” leading ships compared to the industry average. the data within the figure for the “top 5%” efficiency leaders illustrate the efficiency-leading subsets of ships that haul 5% of the cargo within each type, and have 38–65% lower co2 than the ship type average. the contributing factors (e.g., speed, size, age, technology) that differentiate the ships’ in-use efficiency are investigated further in section 3 below. these leading efficiency practices, in turn, underlie the analysis below about the potential impact of leading industry practices within each ship type being adopted over the next several decades.
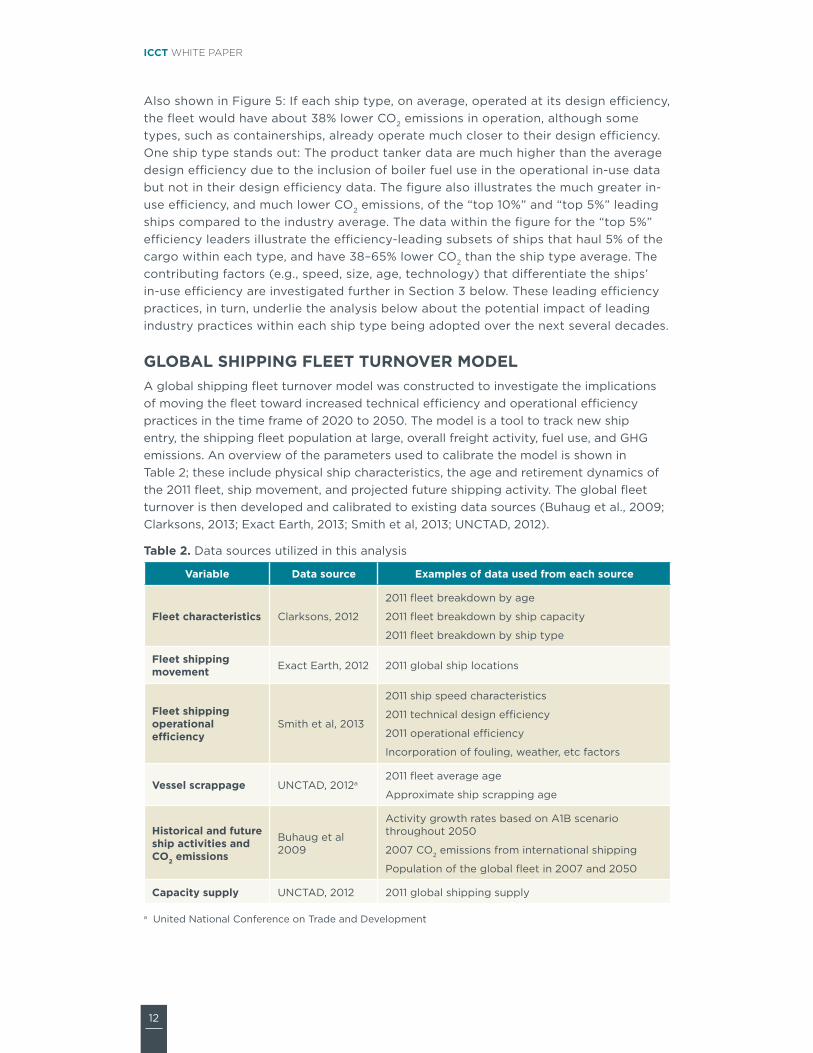
gLobaL Shipping FLeet tUrnover moDeLa global shipping fleet turnover model was constructed to investigate the implications of moving the fleet toward increased technical efficiency and operational efficiency practices in the time frame of 2020 to 2050. the model is a tool to track new ship entry, the shipping fleet population at large, overall freight activity, fuel use, and ghg emissions. an overview of the parameters used to calibrate the model is shown in table 2; these include physical ship characteristics, the age and retirement dynamics of the 2011 fleet, ship movement, and projected future shipping activity. the global fleet turnover is then developed and calibrated to existing data sources (Buhaug et al., 2009; clarksons, 2013; exact earth, 2013; smith et al, 2013; unctaD, 2012).
table 2. Data sources utilized in this analysis
variable Data source examples of data used from each source
Fleet characteristics clarksons, 2012
2011 fleet breakdown by age
2011 fleet breakdown by ship capacity
2011 fleet breakdown by ship type
Fleet shipping movement exact earth, 2012 2011 global ship locations
Fleet shipping operational efficiency
smith et al, 2013
2011 ship speed characteristics
2011 technical design efficiency
2011 operational efficiency
incorporation of fouling, weather, etc factors
vessel scrappage unctaD, 2012a2011 fleet average age
approximate ship scrapping age
historical and future ship activities and Co2 emissions
Buhaug et al 2009
activity growth rates based on a1B scenario throughout 2050
2007 co2 emissions from international shipping
Population of the global fleet in 2007 and 2050
Capacity supply unctaD, 2012 2011 global shipping supply
a united national conference on trade and Development
13
Long-term potentiaL for increased shipping efficiency
the fleet turnover model is used to track new ships entering the fleet, ship scrappage, reduced annual ship activity with age, increased overall shipping activity, in-use ship efficiency degradation over time, increased new ship efficiency by model year, and any potential introduction of in-use efficiency practices. as a result, the model incorporates the deployment of new ships, the proportion of ships removed from the fleet over time, and the resulting ship efficiency of the overall fleet. it also characterizes the technical and operational efficiency of the fleet in each year (i.e., by ship delivery year and calendar year) and examines the changes of annual fuel consumption and co2 emissions.
the model first develops a fleet population model that projects the global shipping fleet population between 2007 and 2050 by incorporating estimated new ship deliveries in each year with given scrappage, or retirement, rates. the ship retirement rates are based upon the average scrappage age of ships and the average age of the fleet obtained from the united nations conference on trade and Development (unctaD, 2012), as well as from data used by clarksons (2012). the calculated ship population in the stock turnover model, after factoring in new ship sales and retirement, is calibrated specifically to match the iMo projections for 2007, 2020, and 2050 to within 4% (from Buhaug et al, 2009).
the ship population and annual ship activity (i.e., unit of cargo supply capacity transported times distance) of the fleet, together, define the total transport activity of the shipping fleet. the underlying data from the model reflects the 2011 data on ship activity and its decrease by ship age, as derived from observed ship characteristics and operations in the s-ais data. after factoring in new ship builds, ship retirement, and decreasing ship activity with age, the stock turnover model’s overall ship activity matches the total shipping transport activity from unctaD (2012).
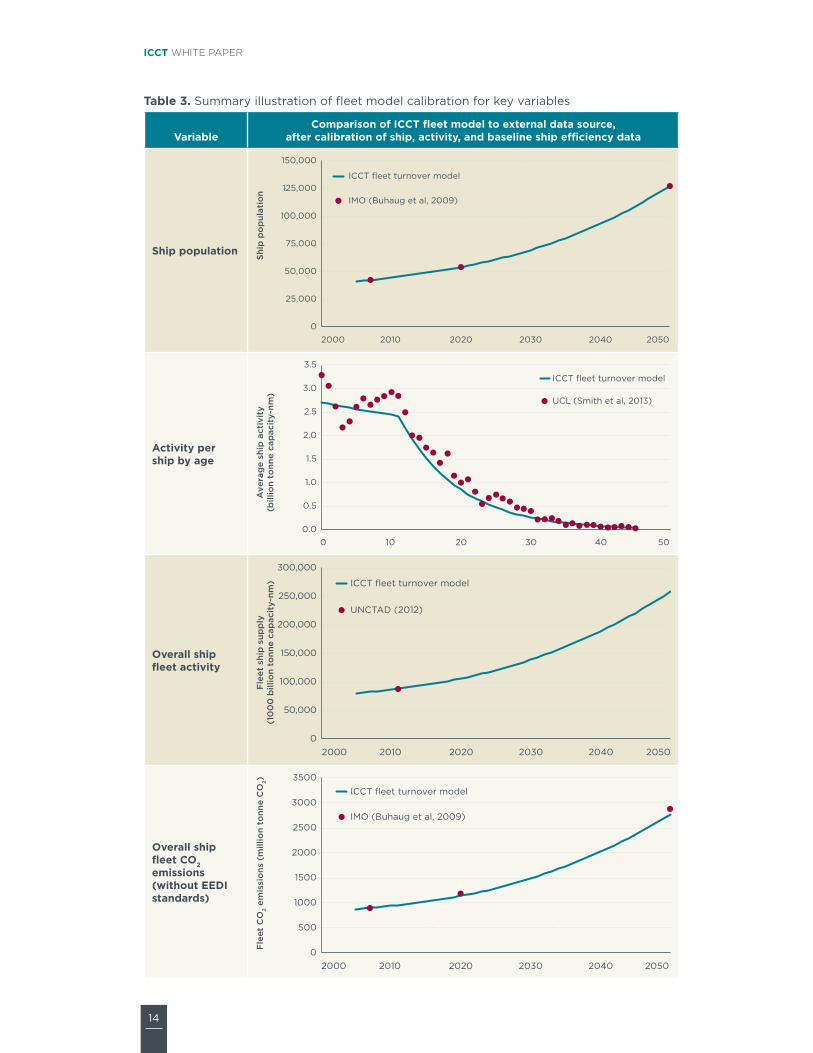
table 3 illustrates a high-level summary of the key variables of the fleet turnover model and the external data sources to which the model was calibrated for ship population, per-ship activity, and fleet activity. the fleet turnover model developed and utilized here is within 3% of each of these basic ship fleet variables. in addition, after calibration for the fleet population, ship scrappage, ship activity by age, and overall ship fleet activity increases, the total fuel consumption and co2 emissions are also within 4% agreement with those for the 2007 data and long-term 2020 and 2050 projections by the iMo 2nd ghg study (Buhaug et al, 2009).
14
ICCT white paper
table 3. summary illustration of fleet model calibration for key variables
variableComparison of iCCt fleet model to external data source,
after calibration of ship, activity, and baseline ship efficiency data
Ship population
0
25,000
50,000
75,000
100,000
125,000
150,000
2000 2010 2020 2030 2040 2050
Ship
po
pul
atio
n
ICCT fleet turnover model
IMO (Buhaug et al, 2009)
activity per ship by age
0.0
0.5
1.0
1.5
2.0
2.5
3.0
3.5
0 10 20 30 40 50
Ave
rag
e sh
ip a
ctiv
ity
(bill
ion
tonn
e ca
pac
ity-
nm)
ICCT fleet turnover model
UCL (Smith et al, 2013)
overall ship fleet activity
0
50,000
100,000
150,000
200,000
250,000
300,000
2000 2010 2020 2030 2040 2050
Fle
et s
hip
sup
ply
(1
00
0 b
illio
n to
nne
cap
acit
y-nm
) ICCT fleet turnover model
UNCTAD (2012)
overall ship fleet Co2 emissions (without eeDi standards)
0
500
1000
1500
2000
2500
3000
3500
2000 2010 2020 2030 2040 2050
Fle
et C
O2
emis
sio
ns (
mill
ion
tonn
e C
O2)
ICCT fleet turnover model
IMO (Buhaug et al, 2009)
15
Long-term potentiaL for increased shipping efficiency
section 3: findingsthis section summarizes a number of findings from the analysis, including the variation between design and operational in-use efficiency across different ship sizes, ages, and types in the fleet. this section also investigates several of contributing factors to in-use efficiency. in a number of cases, containerships are used as an example to demonstrate the diversity within a ship type, because it is the type that is undergoing the most growth in activity and perhaps the most improvements in in-use efficiency. For each case, the results are shown in terms of gram co2 per capacity unit (e.g., 20-foot-equivalent unit [teu-nm] or tonne-nm). Finally, these present-day fleet-wide ship efficiency practices are extrapolated to fleet-level projections over the next several decades, using the shipping fleet turnover model introduced above.
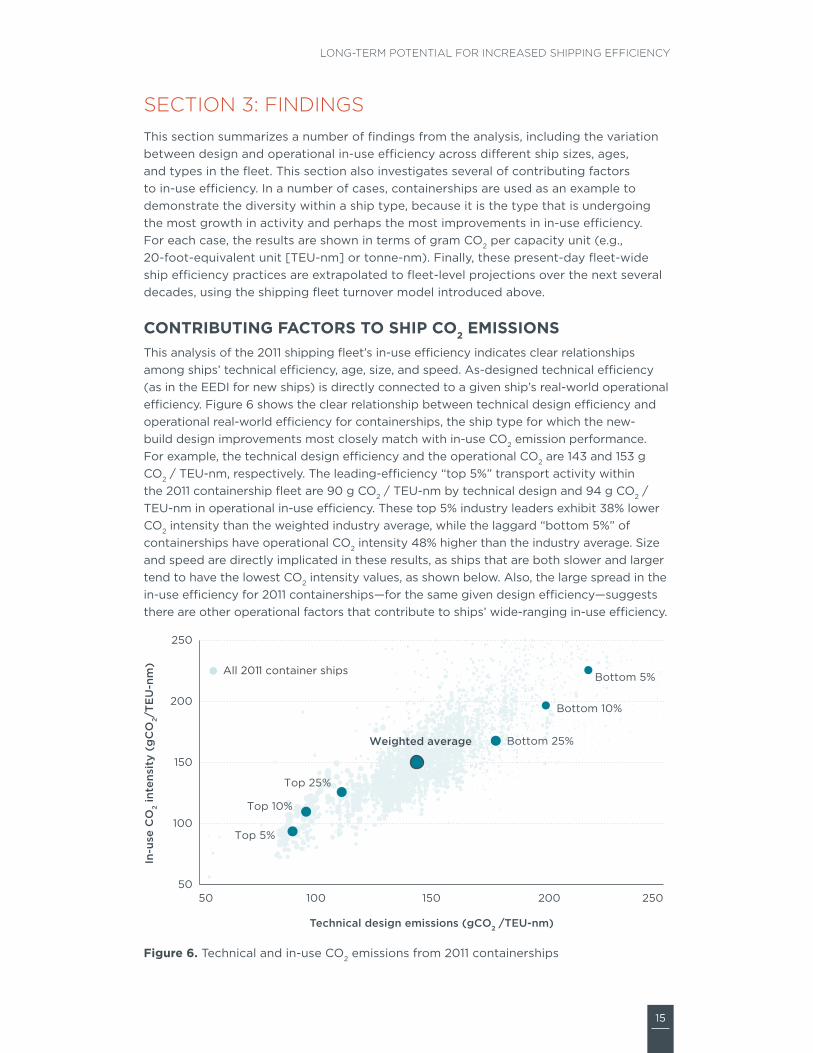
ContribUting FaCtorS to Ship Co2 emiSSionSthis analysis of the 2011 shipping fleet’s in-use efficiency indicates clear relationships among ships’ technical efficiency, age, size, and speed. as-designed technical efficiency (as in the eeDi for new ships) is directly connected to a given ship’s real-world operational efficiency. Figure 6 shows the clear relationship between technical design efficiency and operational real-world efficiency for containerships, the ship type for which the new-build design improvements most closely match with in-use co2 emission performance. For example, the technical design efficiency and the operational co2 are 143 and 153 g co2 / teu-nm, respectively. the leading-efficiency “top 5%” transport activity within the 2011 containership fleet are 90 g co2 / teu-nm by technical design and 94 g co2 / teu-nm in operational in-use efficiency. these top 5% industry leaders exhibit 38% lower co2 intensity than the weighted industry average, while the laggard “bottom 5%” of containerships have operational co2 intensity 48% higher than the industry average. size and speed are directly implicated in these results, as ships that are both slower and larger tend to have the lowest co2 intensity values, as shown below. also, the large spread in the in-use efficiency for 2011 containerships—for the same given design efficiency—suggests there are other operational factors that contribute to ships’ wide-ranging in-use efficiency.
50
100
150
200
250
50 100 150 200 250
In-u
se C
O2
inte
nsit
y (g
CO
2/T
EU
-nm
)
Technical design emissions (gCO2 /TEU-nm)
All 2011 container ships
Weighted average
Top 5%
Top 10%
Top 25%
Bottom 25%
Bottom 5%
Bottom 10%
Figure 6. technical and in-use co2 emissions from 2011 containerships
16
ICCT white paper
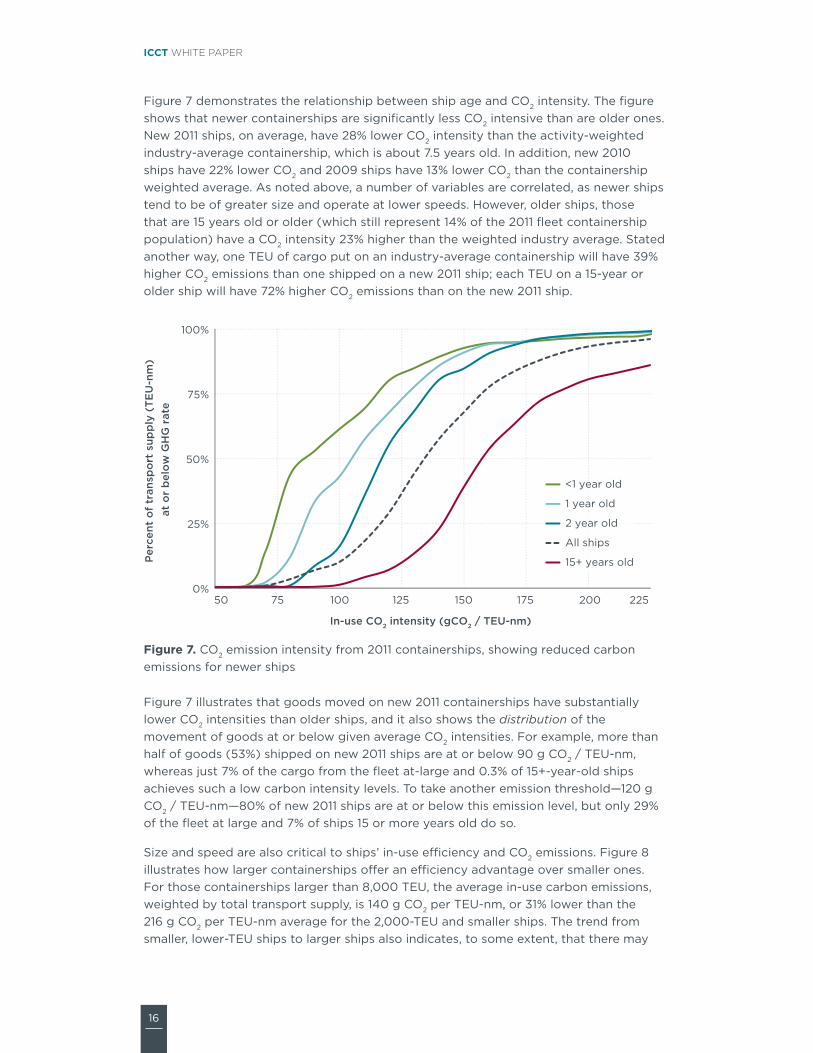
Figure 7 demonstrates the relationship between ship age and co2 intensity. the figure shows that newer containerships are significantly less co2 intensive than are older ones. new 2011 ships, on average, have 28% lower co2 intensity than the activity-weighted industry-average containership, which is about 7.5 years old. in addition, new 2010 ships have 22% lower co2 and 2009 ships have 13% lower co2 than the containership weighted average. as noted above, a number of variables are correlated, as newer ships tend to be of greater size and operate at lower speeds. however, older ships, those that are 15 years old or older (which still represent 14% of the 2011 fleet containership population) have a co2 intensity 23% higher than the weighted industry average. stated another way, one teu of cargo put on an industry-average containership will have 39% higher co2 emissions than one shipped on a new 2011 ship; each teu on a 15-year or older ship will have 72% higher co2 emissions than on the new 2011 ship.
0%
25%
50%
75%
100%
50 75 100 125 150 175 200 225
Per
cent
of
tran
spo
rt s
upp
ly (
TE
U-n
m)
at o
r b
elo
w G
HG
rat
e
In-use CO2 intensity (gCO2 / TEU-nm)
<1 year old
1 year old
2 year old
All ships
15+ years old
Figure 7. co2 emission intensity from 2011 containerships, showing reduced carbon emissions for newer ships
Figure 7 illustrates that goods moved on new 2011 containerships have substantially lower co2 intensities than older ships, and it also shows the distribution of the movement of goods at or below given average co2 intensities. For example, more than half of goods (53%) shipped on new 2011 ships are at or below 90 g co2 / teu-nm, whereas just 7% of the cargo from the fleet at-large and 0.3% of 15+-year-old ships achieves such a low carbon intensity levels. to take another emission threshold—120 g co2 / teu-nm—80% of new 2011 ships are at or below this emission level, but only 29% of the fleet at large and 7% of ships 15 or more years old do so.
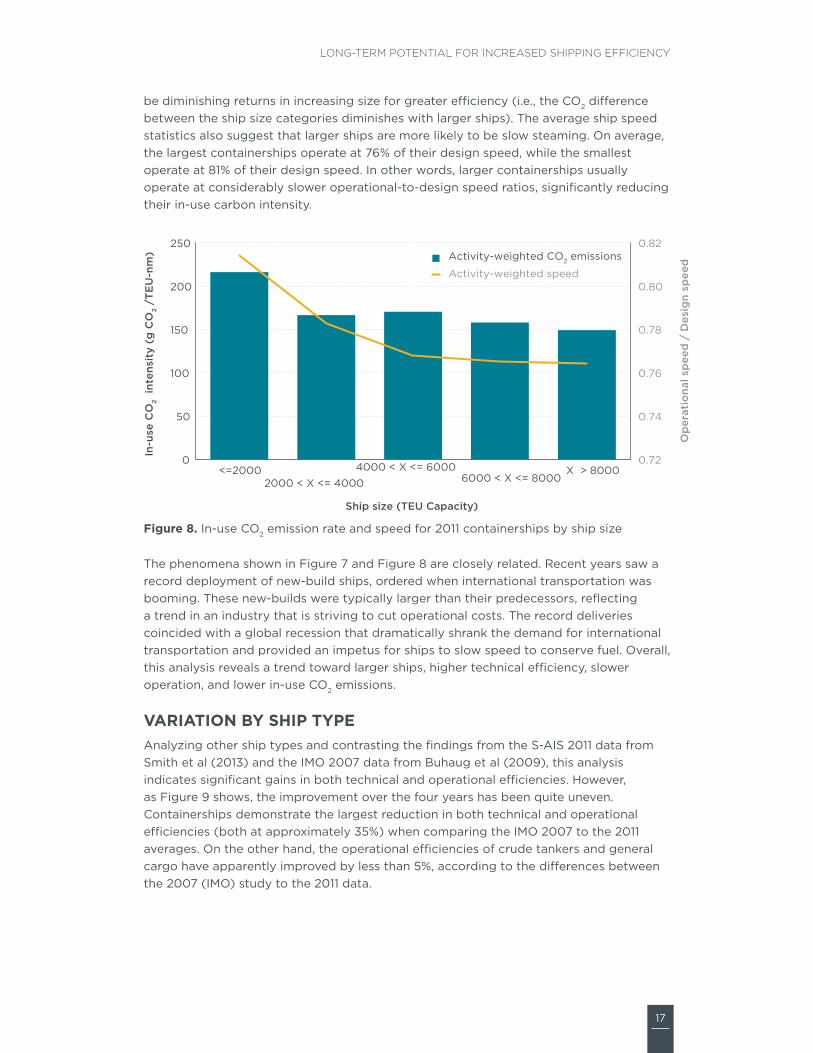
size and speed are also critical to ships’ in-use efficiency and co2 emissions. Figure 8 illustrates how larger containerships offer an efficiency advantage over smaller ones. For those containerships larger than 8,000 teu, the average in-use carbon emissions, weighted by total transport supply, is 140 g co2 per teu-nm, or 31% lower than the 216 g co2 per teu-nm average for the 2,000-teu and smaller ships. the trend from smaller, lower-teu ships to larger ships also indicates, to some extent, that there may
17
Long-term potentiaL for increased shipping efficiency
be diminishing returns in increasing size for greater efficiency (i.e., the co2 difference between the ship size categories diminishes with larger ships). the average ship speed statistics also suggest that larger ships are more likely to be slow steaming. on average, the largest containerships operate at 76% of their design speed, while the smallest operate at 81% of their design speed. in other words, larger containerships usually operate at considerably slower operational-to-design speed ratios, significantly reducing their in-use carbon intensity.
0.72
0.74
0.76
0.78
0.80
0.82
0
50
100
150
200
250
<=20002000 < X <= 4000
4000 < X <= 60006000 < X <= 8000
X > 8000
Op
erat
iona
l sp
eed
/ D
esig
n sp
eed
In-u
se C
O2
inte
nsit
y (g
CO
2 /T
EU
-nm
)
Ship size (TEU Capacity)
Activity-weighted CO2 emissions
Activity-weighted speed
Figure 8. in-use co2 emission rate and speed for 2011 containerships by ship size
the phenomena shown in Figure 7 and Figure 8 are closely related. recent years saw a record deployment of new-build ships, ordered when international transportation was booming. these new-builds were typically larger than their predecessors, reflecting a trend in an industry that is striving to cut operational costs. the record deliveries coincided with a global recession that dramatically shrank the demand for international transportation and provided an impetus for ships to slow speed to conserve fuel. overall, this analysis reveals a trend toward larger ships, higher technical efficiency, slower operation, and lower in-use co2 emissions.
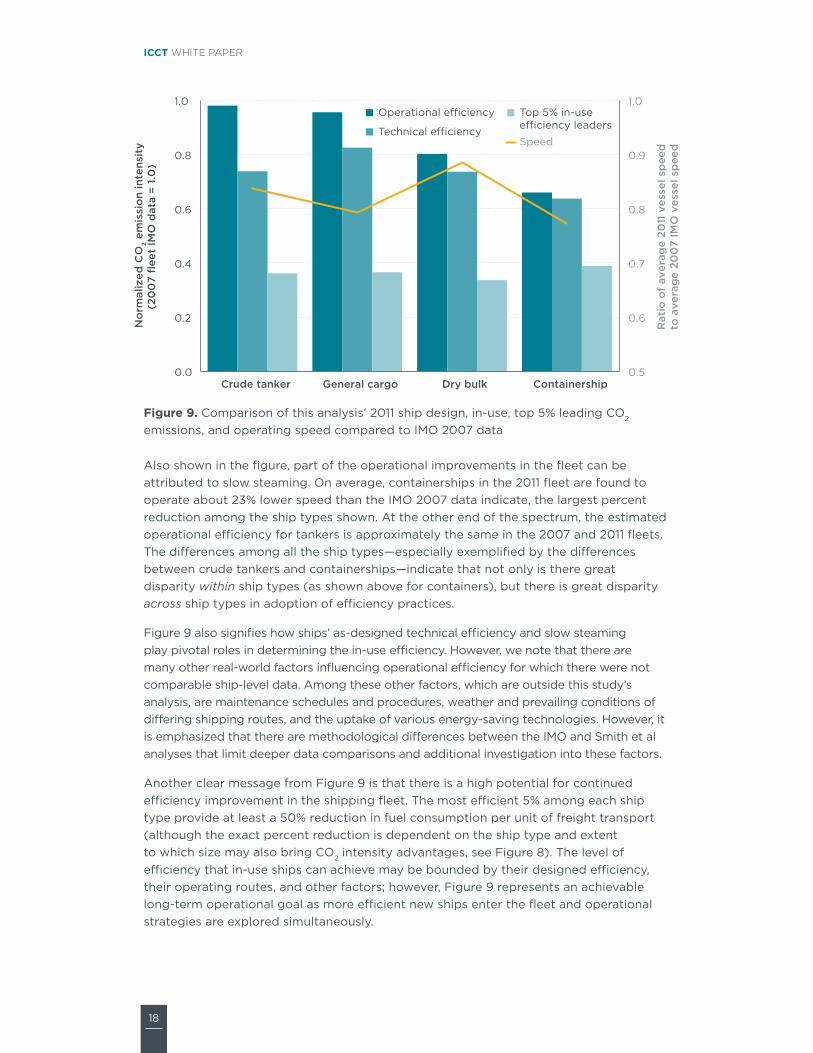
variation bY Ship tYpeanalyzing other ship types and contrasting the findings from the s-ais 2011 data from smith et al (2013) and the iMo 2007 data from Buhaug et al (2009), this analysis indicates significant gains in both technical and operational efficiencies. however, as Figure 9 shows, the improvement over the four years has been quite uneven. containerships demonstrate the largest reduction in both technical and operational efficiencies (both at approximately 35%) when comparing the iMo 2007 to the 2011 averages. on the other hand, the operational efficiencies of crude tankers and general cargo have apparently improved by less than 5%, according to the differences between the 2007 (iMo) study to the 2011 data.
18
ICCT white paper
0.5
0.6
0.7
0.8
0.9
1.0
0.0
0.2
0.4
0.6
0.8
1.0
Crude tanker General cargo Dry bulk Containership
Rat
io o
f av
erag
e 20
11 v
esse
l sp
eed
to
ave
rag
e 20
07
IMO
ves
sel s
pee
d
No
rmal
ized
CO
2 em
issi
on
inte
nsit
y(2
00
7 fl
eet
IMO
dat
a =
1.0
)
Operational efficiency
Technical efficiency
Top 5% in-use efficiency leaders
Speed
Figure 9. comparison of this analysis’ 2011 ship design, in-use, top 5% leading co2 emissions, and operating speed compared to iMo 2007 data
also shown in the figure, part of the operational improvements in the fleet can be attributed to slow steaming. on average, containerships in the 2011 fleet are found to operate about 23% lower speed than the iMo 2007 data indicate, the largest percent reduction among the ship types shown. at the other end of the spectrum, the estimated operational efficiency for tankers is approximately the same in the 2007 and 2011 fleets. the differences among all the ship types—especially exemplified by the differences between crude tankers and containerships—indicate that not only is there great disparity within ship types (as shown above for containers), but there is great disparity across ship types in adoption of efficiency practices.
Figure 9 also signifies how ships’ as-designed technical efficiency and slow steaming play pivotal roles in determining the in-use efficiency. however, we note that there are many other real-world factors influencing operational efficiency for which there were not comparable ship-level data. among these other factors, which are outside this study’s analysis, are maintenance schedules and procedures, weather and prevailing conditions of differing shipping routes, and the uptake of various energy-saving technologies. however, it is emphasized that there are methodological differences between the iMo and smith et al analyses that limit deeper data comparisons and additional investigation into these factors.
another clear message from Figure 9 is that there is a high potential for continued efficiency improvement in the shipping fleet. the most efficient 5% among each ship type provide at least a 50% reduction in fuel consumption per unit of freight transport (although the exact percent reduction is dependent on the ship type and extent to which size may also bring co2 intensity advantages, see Figure 8). the level of efficiency that in-use ships can achieve may be bounded by their designed efficiency, their operating routes, and other factors; however, Figure 9 represents an achievable long-term operational goal as more efficient new ships enter the fleet and operational strategies are explored simultaneously.
19
Long-term potentiaL for increased shipping efficiency
SCenario FinDingSthe emission reduction potential discussed above has important implications for long-term fleet-wide carbon intensity and the total co2 emissions from international shipping. in this section, best available technologies and operational efficiency practices are considered within the ship fleet turnover model to project the intensity and total emissions under varying scenarios. the analysis considers several discrete scenarios to represent possible projections of the diffusion of greater ship efficiency into the fleet.
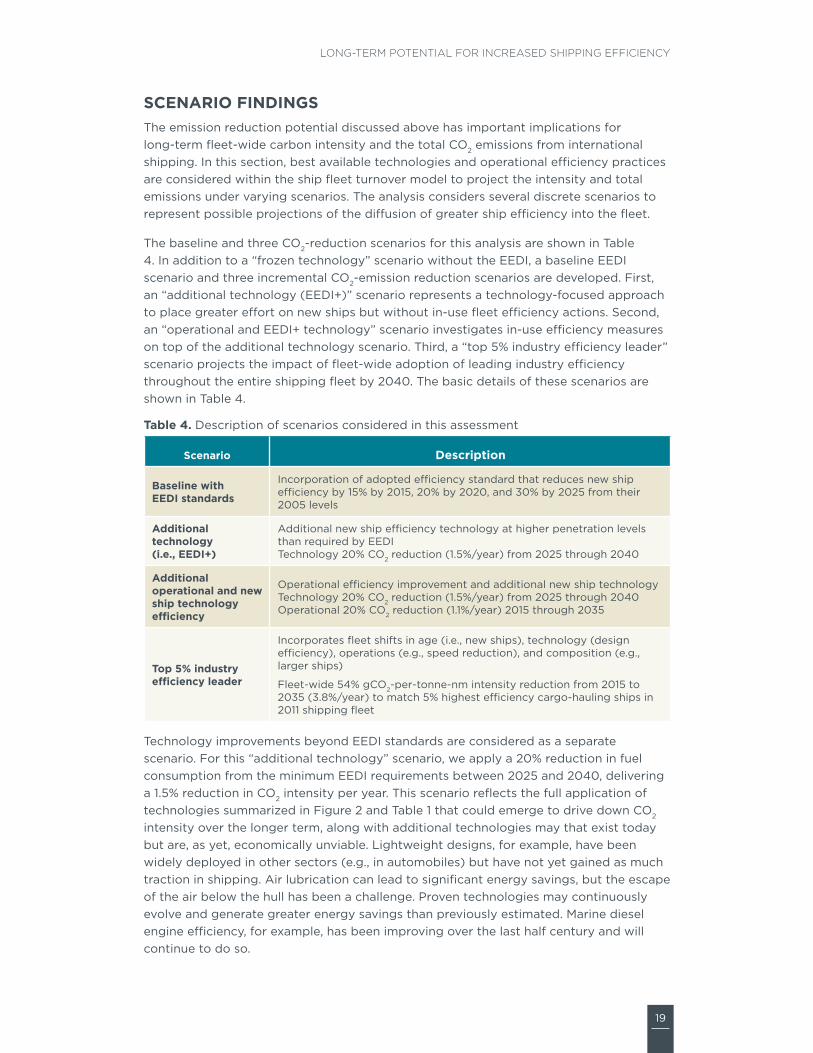
the baseline and three co2-reduction scenarios for this analysis are shown in table 4. in addition to a “frozen technology” scenario without the eeDi, a baseline eeDi scenario and three incremental co2-emission reduction scenarios are developed. First, an “additional technology (eeDi+)” scenario represents a technology-focused approach to place greater effort on new ships but without in-use fleet efficiency actions. second, an “operational and eeDi+ technology” scenario investigates in-use efficiency measures on top of the additional technology scenario. third, a “top 5% industry efficiency leader” scenario projects the impact of fleet-wide adoption of leading industry efficiency throughout the entire shipping fleet by 2040. the basic details of these scenarios are shown in table 4.
table 4. Description of scenarios considered in this assessment
Scenario Description
baseline with eeDi standards
incorporation of adopted efficiency standard that reduces new ship efficiency by 15% by 2015, 20% by 2020, and 30% by 2025 from their 2005 levels
additional technology (i.e., eeDi+)
additional new ship efficiency technology at higher penetration levels than required by eeDitechnology 20% co2 reduction (1.5%/year) from 2025 through 2040
additional operational and new ship technology efficiency
operational efficiency improvement and additional new ship technologytechnology 20% co2 reduction (1.5%/year) from 2025 through 2040operational 20% co2 reduction (1.1%/year) 2015 through 2035
top 5% industry efficiency leader
incorporates fleet shifts in age (i.e., new ships), technology (design efficiency), operations (e.g., speed reduction), and composition (e.g., larger ships)
Fleet-wide 54% gco2-per-tonne-nm intensity reduction from 2015 to 2035 (3.8%/year) to match 5% highest efficiency cargo-hauling ships in 2011 shipping fleet
technology improvements beyond eeDi standards are considered as a separate scenario. For this “additional technology” scenario, we apply a 20% reduction in fuel consumption from the minimum eeDi requirements between 2025 and 2040, delivering a 1.5% reduction in co2 intensity per year. this scenario reflects the full application of technologies summarized in Figure 2 and table 1 that could emerge to drive down co2 intensity over the longer term, along with additional technologies may that exist today but are, as yet, economically unviable. lightweight designs, for example, have been widely deployed in other sectors (e.g., in automobiles) but have not yet gained as much traction in shipping. air lubrication can lead to significant energy savings, but the escape of the air below the hull has been a challenge. Proven technologies may continuously evolve and generate greater energy savings than previously estimated. Marine diesel engine efficiency, for example, has been improving over the last half century and will continue to do so.
20
ICCT white paper
the “operational and eeDi+ technology” scenario considers in-use measures that go beyond the new build-design measures and do so in the near term, beginning in 2016. in addition to new design technologies, operational strategies such as speed reduction play a large role in reducing co2 intensity. icct evaluated these energy-saving strategies across 318 ship type, size, and age combinations and found that ships are capable of reducing co2 intensity by more than 20% at a negative cost (see icct, 2011b). Based on this previous work, the scenario for operational ship improvement considered here conservatively incorporates the phasing in of this 20% operational co2 reduction over 20 years, representing a 1.1% co2 reduction year-on-year from 2015 through 2035.
the final scenario, “top 5% industry efficiency leader,” is introduced earlier in this report, in Figure 5, as including the best technology and operational practices in evidence in the 2011 fleet. the smith et al (2013) work utilizes satellite ais data to connect design characteristics and ship speeds to identify in-use efficiency leaders within each ship type. that work identifies that the 5% most efficient ships within the nine types studied have 38–65% lower co2 intensity than their average peers. Fleet-wide, this amounts to a 54% reduction, based on the relative fleet activity among the nine major ship types. this scenario extrapolates the effect of those leading carbon intensities being adopted by the entire shipping fleet by 2035. as noted, a number of contributing factors (e.g., speed, size, age, technology) differentiate ships’ in-use efficiency. some combination of these factors would deliver a 54% fleet-wide co2 intensity reduction from 2015 to 2035 for this scenario, resulting in a 3.8% annual decrease through 2035.
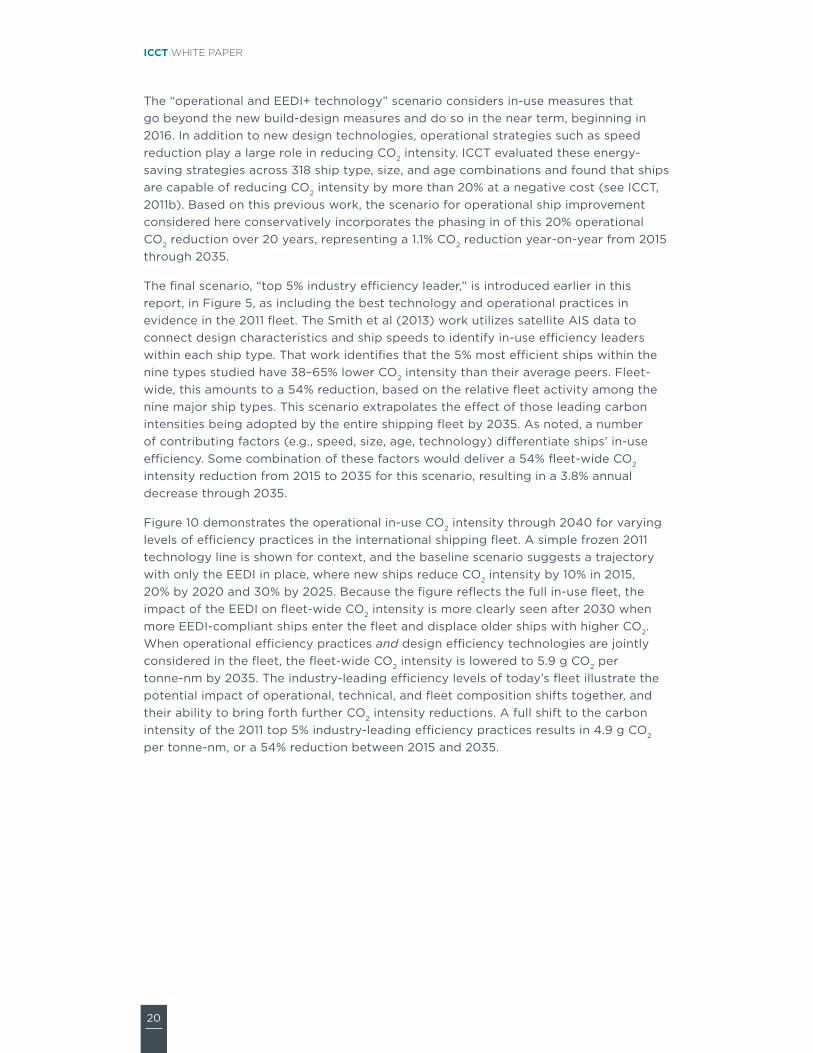
Figure 10 demonstrates the operational in-use co2 intensity through 2040 for varying levels of efficiency practices in the international shipping fleet. a simple frozen 2011 technology line is shown for context, and the baseline scenario suggests a trajectory with only the eeDi in place, where new ships reduce co2 intensity by 10% in 2015, 20% by 2020 and 30% by 2025. Because the figure reflects the full in-use fleet, the impact of the eeDi on fleet-wide co2 intensity is more clearly seen after 2030 when more eeDi-compliant ships enter the fleet and displace older ships with higher co2. When operational efficiency practices and design efficiency technologies are jointly considered in the fleet, the fleet-wide co2 intensity is lowered to 5.9 g co2 per tonne-nm by 2035. the industry-leading efficiency levels of today’s fleet illustrate the potential impact of operational, technical, and fleet composition shifts together, and their ability to bring forth further co2 intensity reductions. a full shift to the carbon intensity of the 2011 top 5% industry-leading efficiency practices results in 4.9 g co2 per tonne-nm, or a 54% reduction between 2015 and 2035.
21
Long-term potentiaL for increased shipping efficiency
0
2
4
6
8
10
12
2010 2020 2030 2040
In-u
se C
O2
inte
nsit
y (g
/to
nne-
nm)
Without EEDI standards (frozen 2011 technology)
Baseline (EEDI standards)
Additional technology (EEDI+)
Operational and EEDI+ technology
Top 5% industry efficiency leaders
Figure 10. co2 intensity of international shipping under different pathways
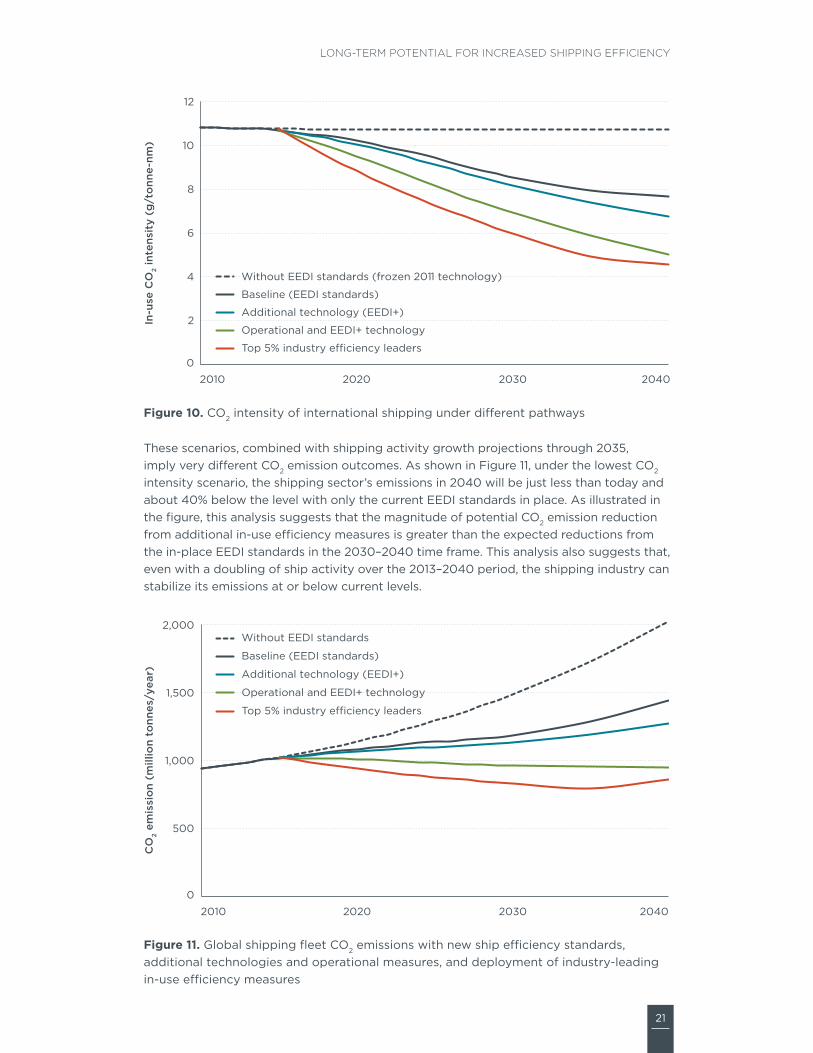
these scenarios, combined with shipping activity growth projections through 2035, imply very different co2 emission outcomes. as shown in Figure 11, under the lowest co2 intensity scenario, the shipping sector’s emissions in 2040 will be just less than today and about 40% below the level with only the current eeDi standards in place. as illustrated in the figure, this analysis suggests that the magnitude of potential co2 emission reduction from additional in-use efficiency measures is greater than the expected reductions from the in-place eeDi standards in the 2030–2040 time frame. this analysis also suggests that, even with a doubling of ship activity over the 2013–2040 period, the shipping industry can stabilize its emissions at or below current levels.
0
500
1,000
1,500
2,000
2010 2020 2030 2040
CO
2 em
issi
on
(mill
ion
tonn
es/y
ear)
Without EEDI standards
Baseline (EEDI standards)
Additional technology (EEDI+)
Operational and EEDI+ technology
Top 5% industry efficiency leaders
Figure 11. global shipping fleet co2 emissions with new ship efficiency standards, additional technologies and operational measures, and deployment of industry-leading in-use efficiency measures
22
ICCT white paper
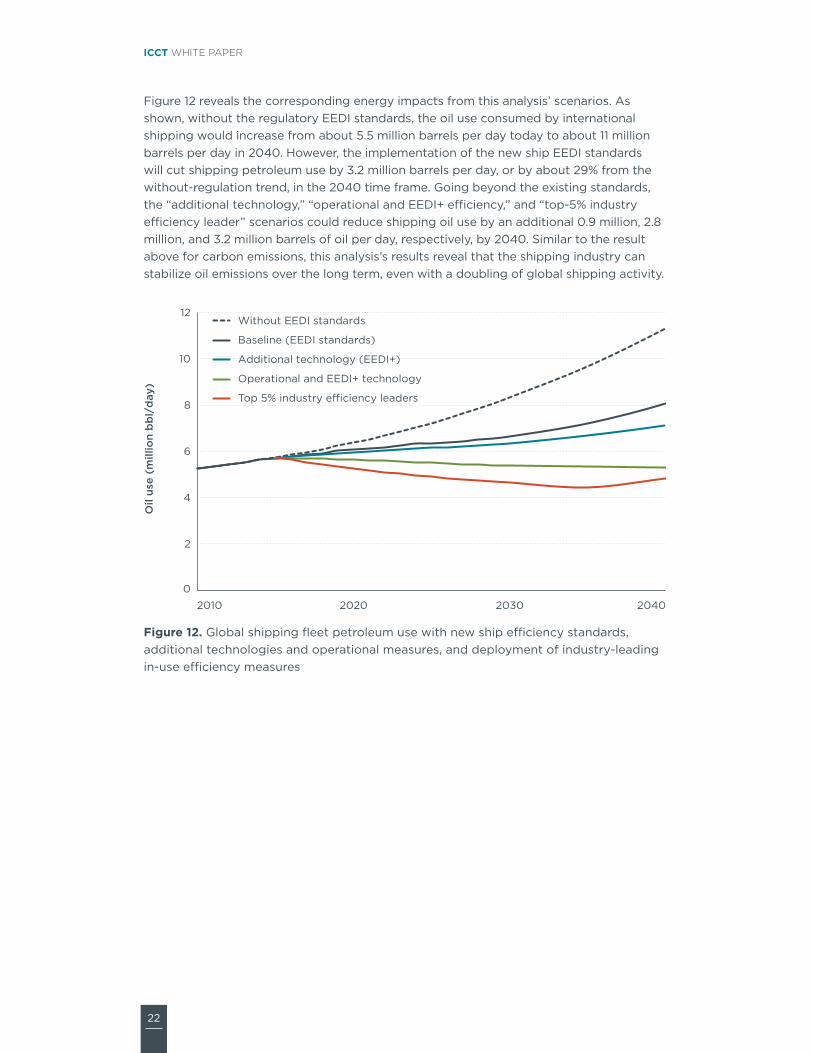
Figure 12 reveals the corresponding energy impacts from this analysis’ scenarios. as shown, without the regulatory eeDi standards, the oil use consumed by international shipping would increase from about 5.5 million barrels per day today to about 11 million barrels per day in 2040. however, the implementation of the new ship eeDi standards will cut shipping petroleum use by 3.2 million barrels per day, or by about 29% from the without-regulation trend, in the 2040 time frame. going beyond the existing standards, the “additional technology,” “operational and eeDi+ efficiency,” and “top-5% industry efficiency leader” scenarios could reduce shipping oil use by an additional 0.9 million, 2.8 million, and 3.2 million barrels of oil per day, respectively, by 2040. similar to the result above for carbon emissions, this analysis’s results reveal that the shipping industry can stabilize oil emissions over the long term, even with a doubling of global shipping activity.
0
2
4
6
8
10
12
2010 2020 2030 2040
Oil
use
(mill
ion
bb
l/d
ay)
Without EEDI standards
Baseline (EEDI standards)
Additional technology (EEDI+)
Operational and EEDI+ technology
Top 5% industry efficiency leaders
Figure 12. global shipping fleet petroleum use with new ship efficiency standards, additional technologies and operational measures, and deployment of industry-leading in-use efficiency measures
23
Long-term potentiaL for increased shipping efficiency
section 4: conclusionsthis research offers a novel analysis that connects the 2011 in-use fleet characteristics, first-ever satellite data on ship movement, and technical literature on ship efficiency technology to analyze the long-term prospects for increasing shipping efficiency. this analysis also develops a ship stock turnover model to track how efficiency characteristics (age, size, technology, operational practices) influence the efficiency of the shipping fleet, thereby reducing its carbon intensity.
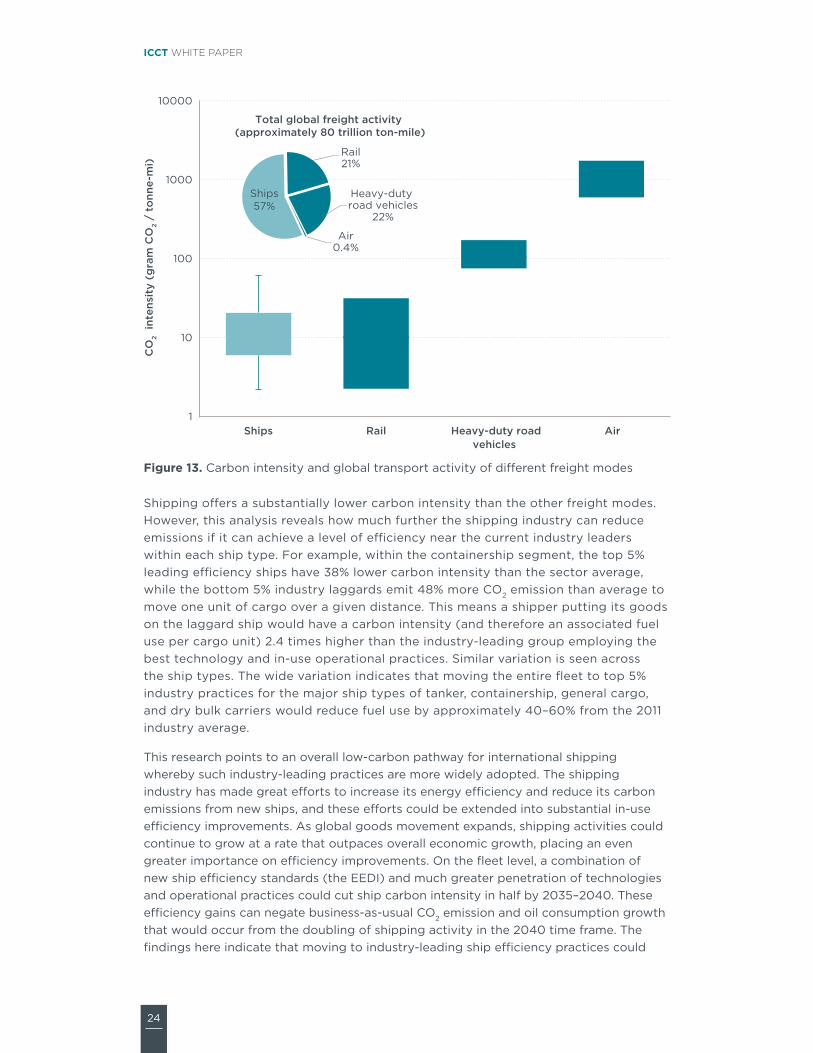
the analysis shows the two faces of international shipping. shipping, on a globally averaged basis, is a highly efficient, low-carbon-intensity freight transport mode. at the same time, the sector’s contribution to climate change is large due to the sheer volume of international ship-based commerce. Figure 13 summarizes the overall carbon intensity and goods movement volume of different freight modes in 2011. the shipping data shown in the figure are from this study, with the range defined by the averages of the nine different ship types, and with the error bars representing the full range from the bottom 5% and top 5% efficiency practices in each ship type. the data from the other modes are from a number of different sources. For rail freight and heavy-duty vehicles, the carbon emissions are based on the range of national average co2 emission rates from the icct’s roadmap model (Façanha et al, 2012). the range for air freight carbon intensity is derived from the fuel consumption of representative dedicated air freighter and belly freight, based on icct modeling with Piano-X. the freight activity data (i.e., cargo carried times distance traveled) for the various modes are also from the icct roadmap model, as well as from Boeing (2012) for air freight activity.
Figure 13 shows how international shipping can have substantially lower carbon intensity than other freight modes. shipping, in the aggregate, can offer similarly low-carbon freight transport as seen in the rail sector. shipping’s carbon intensity is, on average, about one-tenth that of heavy-duty vehicles and about one-hundredth the average carbon intensity of air freight (note that the left y-axis for carbon intensity is in log scale). however, overall goods movement activity, measured in cargo carried times distance traveled, from ships is greater than that of freight activity by rail, heavy-duty vehicles, and air combined.
24
ICCT white paper
1
10
100
1000
10000
Ships Rail Heavy-duty road vehicles
Air
CO
2 in
tens
ity
(gra
m C
O2
/ to
nne-
mi)
Total global freight activity (approximately 80 trillion ton-mile)
Ships57%
Rail21%
Heavy-duty road vehicles
22%
Air0.4%
Figure 13. carbon intensity and global transport activity of different freight modes
shipping offers a substantially lower carbon intensity than the other freight modes. however, this analysis reveals how much further the shipping industry can reduce emissions if it can achieve a level of efficiency near the current industry leaders within each ship type. For example, within the containership segment, the top 5% leading efficiency ships have 38% lower carbon intensity than the sector average, while the bottom 5% industry laggards emit 48% more co2 emission than average to move one unit of cargo over a given distance. this means a shipper putting its goods on the laggard ship would have a carbon intensity (and therefore an associated fuel use per cargo unit) 2.4 times higher than the industry-leading group employing the best technology and in-use operational practices. similar variation is seen across the ship types. the wide variation indicates that moving the entire fleet to top 5% industry practices for the major ship types of tanker, containership, general cargo, and dry bulk carriers would reduce fuel use by approximately 40 –60% from the 2011 industry average.
this research points to an overall low-carbon pathway for international shipping whereby such industry-leading practices are more widely adopted. the shipping industry has made great efforts to increase its energy efficiency and reduce its carbon emissions from new ships, and these efforts could be extended into substantial in-use efficiency improvements. as global goods movement expands, shipping activities could continue to grow at a rate that outpaces overall economic growth, placing an even greater importance on efficiency improvements. on the fleet level, a combination of new ship efficiency standards (the eeDi) and much greater penetration of technologies and operational practices could cut ship carbon intensity in half by 2035–2040. these efficiency gains can negate business-as-usual co2 emission and oil consumption growth that would occur from the doubling of shipping activity in the 2040 time frame. the findings here indicate that moving to industry-leading ship efficiency practices could
25
Long-term potentiaL for increased shipping efficiency
reduce emissions of co2 by 300 million metric tonnes per year, and oil consumption by 2 million barrels per day, by 2030.
Mitigating the industry’s climate impact can be fully compatible with the business bottom line if done with appropriate lead time. as fuel costs increasingly erode the shipping industry’s profitability, raising efficiency will become an important way to preserve profits. the technologies and practices underpinning the low-carbon pathways explored here lead to net savings and are proven by 2011 industry leaders that make up 5% of international maritime commerce across ship types. achieving such efficiency requires a high level of sophistication in logistically managing a more highly efficient fleet, including incorporation of slow steaming, greater integration of various energy-saving practices and implementation of more rigorous maintenance and repair practices. as fuel savings by more efficient fleets begin to drive down freight rates, and as market barriers to efficiency begin to be addressed, the industry will have more direct incentive to follow such low-carbon pathways.
this analysis lays forth a fresh approach that could enable shipping companies to examine their efficiency against industry peers. the underlying technical method and data offer a novel opportunity for shippers to more precisely and more proactively seek more efficient ships. although this analysis has focused on high-level aggregate findings, its ship-by-ship analytical basis tells a clear story about just how wide the variation in ship efficiency, and therefore fuel consumption, is—and this variation has not been conventionally acknowledged or made publicly available in any usable form.
this analysis is only a first step to help shed light on efficiency differences in the fleet. greater acknowledgement of, and transparency about, ships’ in-use efficiency could help inspire a “race to the top” to reduce goods’ carbon footprint through the supply chain. shippers are critical players in the race, and the tools are at hand for them to demand greater information about how their goods are being transported. Policymakers with an interest in moving the entire shipping fleet toward industry-leading practices to drive carbon reductions may have a role as well.
26
ICCT white paper
referencesaea energy & environment (aea) (2007). low carbon commercial shipping. london.
aea energy & environment (aea) (2008). greenhouse gas emissions from shipping: trends, projections and abatement potential. london.
airports council international (2013). ACI Media Release (cited april 3, 2013). retrieved from http://www.aci.aero/news/releases/Most-recent/2012/08/27/aci-releases-its-2011-World-airport-traffic-report-airport-Passenger-traffic-remains-strong-as-cargo-traffic-Weakens.
Boeing, 2012. World air cargo Freight Forecast: 2012-2013.
Buhaug, Ø., corbett, j.j., endresen, Ø, eyring, V., Faber, j., hanayama, s., lee, D.s., lind-stad, h., Markowska, h., Mjelde, a., nelissen, a., j Pålsson, Winebrake, j.j., Wanquing, W., Yoshida, K.(2009). second iMo ghg study 2009 update of the 2000 ghg study: Final report covering phase 1 and pase 2. london: international Maritime oragnization.
Business social responsibility (Bsr) (2011). Beyond the factory gates: how brands improve supply chain sustainability through shipping and logistics.
Business social responsibility (Bsr) (2012). clean cargo working group global trade lane emissions factors.
cariou, P. (2012). is slow steaming a sustainable means of reducing co2 emissions from container shipping? Transportation Research Part D: Transport and Environment. 16(3): 260–264. doi: 10.1016/j.trd.2010.12.005,
ce Delft.(2009). technical support for european action to reducing greenhouse gas emissions from international maritime transport (annex). Delft, netherlands.
ce Delft (2010). going slow to reduce emissions: can the current surplus of maritime transport capacity be turned into an opportunity to reduce ghg emissions? seas at risk.
clarksons (2012). World fleet register. retrieved from http://www.clarksons.net/wfr/Login.aspx?ReturnUrl=%2fwfr%2fDefault.aspx
DnV (2010). Pathways to low carbon shipping. retrieved from http://www.dnv.com/bi-naries/position%20paper%20from%20dnv%20pathways%20to%20low%20carbon%20shipping_tcm4-535306.pdf
eide, Magnus, s. B. Dalsoeren, Ø endresen, B samset, gunnar Myhre, js Fuglestvedt, and t Bernstein. 2013. reducing co2 from shipping – do non-co2 effects matter? atmospheric chemistry and Physics 13:4183-4201
endresen, Ø., sørga°rd, e., sundet, j. K., Dalsøren, s. B., isaksen, i. s. a., Berglen, t. F., gravir, g. (2003). emission from international sea transportation and environmental impact. Journal of Geophysical Research, 108 (D17), 4560.
exact earth (2013). satellite ais Data © exactearth ltd.
eyring, V., isaksen, i.s.a, Berntsen, t., collins, W.j., corbett, j.j., endresen, Ø, grainger, r., Moldanova, j., schlager, h., stevenson, D. (2010). transport impacts on atomosphere and climate: shipping. Atmospheric Environment, 44(37), 4735-4771.
eyring, V., Kohler, h., van aardenne, j., lauer, a. (2005). emissions from international shipping: 1. the last 50 years, 110. doi: 10.1029/2004jD005619
Faber, j., nelissen, D., hon, g., Wang, h., tsimplis, M. (2012). regulated slow steaming in maritime transport. Washington: international council on clean transportation. retrieved from http://www.theicct.org/regulated-slow-steaming-maritime-transport.
27
Long-term potentiaL for increased shipping efficiency
Façanha, c., Blumberg, K., Miller, j. (2012) global transportation energy and climate roadmap. international council on clean transportation. retrieved from http://www.theicct.org/global-transportation-energy-and-climate-roadmap.
international council on clean transportation (icct) (2011a). the energy efficiency design index for new ships. Washington: icct. retrieved from http://www.theicct.org/eedi-new-ships.
international council on clean transportation (icct) (2011b). reducing greenhouse gas emissions from ships: cost effectiveness of available options. Washington: icct. retrieved from http://www.theicct.org/reducing-ghg-emissions-ships.
international energy agency (2012). World co2 emissions from fuel combustion.
international Maritime organization (2009). updated 2000 study on greenhouse gas emissions from ships phase 1 report.
international Maritime organization (2012). estimated co2 emissions reduction from introduction of mandatory technical and operational energy efficiency measures for ships. london: Marine environmental Protection committee.
jalkanen, j., johansson, l., Kukkonen, j. (2013). a comprehensive inventory of the ship traffic exhaust emissions in the Baltic sea from 2006 to 2009. aMBio. doi: 10.1007/s13280-013-0389-3
Kat, j. o., cerup-simonsen, B., jakobsen, o. g., Pedersen, l. r., Petersen, j. B., Posborg, t. (2009). an integrated approach towards cost-effective operation of ships with reduced ghg emissions. snaMe annual Meeting, Providence, r.i.
Maersk line, limited (2012). Maersk line, limited 2011 sustainability report. retrieved from http://www.namepa.net/2012/Maersk2011sustainabilityreport.pdf
rightship (2011). calculating and comparing co2 emissions from ships - existing & new. london: rightship.
skjølsvik, K., andersen, a., corbett, j. j., skjelvik, j. (2000). study of greenhouse gas emissions from ships. international Maritime organization.
smith, t., o’Keeffe, e., aldous, l., agnolucci, P. (2013). assessment of shipping’s ef-ficiency using satellite ais data. Washington: icct. retrieved from http://www.theicct.org/assessment-shipping-efficiency-using-ais-data.
united nations conference on trade and Development (2012). review of maritime transport. new York: unctaD.
Wang, c., corbett, j. j., Firestone, j. (2007). improving spatial representation of global ship emissions inventories. Environment Science & Technology, 42(1), 193-199. doi: 10.1021/es0700799

Beijing Berlin Brussels san Francisco Washington
www.theicct.org