long-term water breakthrough measurement in a … water... · long-term water breakthrough...
TRANSCRIPT
Long-term Water Breakthrough Measurement in a Bilateral Wellbore Using Tracer Technology
RESERVOIR CHARACTERISATION
The Project
An offshore oilfield was developed using long multilateral
horizontal wells completed with swell packers and
stand-alone sand screens. To assist with recovery of
hydrocarbons, seawater injection was used in four
horizontal injection wells throughout the development area.
As part of the overall reservoir management strategy the
operator wanted a method to determine the source of
seawater breakthrough and the positional in-flow of water
into production wells.
Project Design
The project was designed to deliver:
• Unique interwell tracers to measure communication
pathways and sweep efficiencies between wells
• Long term dormant water tracers integrated into
sand screens to measure positional water in-flow
• Significant cost savings over other wellbore
surveillance technologies
• Zero additional rig time
Reservoir & Well Specification
• Sandstone reservoir
• 21 API Oil
• 1,200 metre bilateral horizontal production length
• 5 1/2" premium sand screens c/w swell packers
• Reservoir Temperature and Pressure; 174°F / 2830psi
Application of the Technology
Four unique long term water tracers were manufactured
in solid polymer form and integrated into the drainage
layer of wire wrap sand screens during their manufacture.
There was no requirement to change sand screen size
or design. The tracer – polymer mix was designed to
remain dormant during oil contact and start to slowly
release upon contact with water. Each of the sand
screens was labelled with the specific tracer material
to be referenced when running in hole. In addition to
sand screen tracers, four unique waterflood tracers
were manufactured and made ready for injection.
2
1
P15890 Water Breakthrough.indd 1 21/02/2013 10:08
RESERVOIR CHARACTERISATION
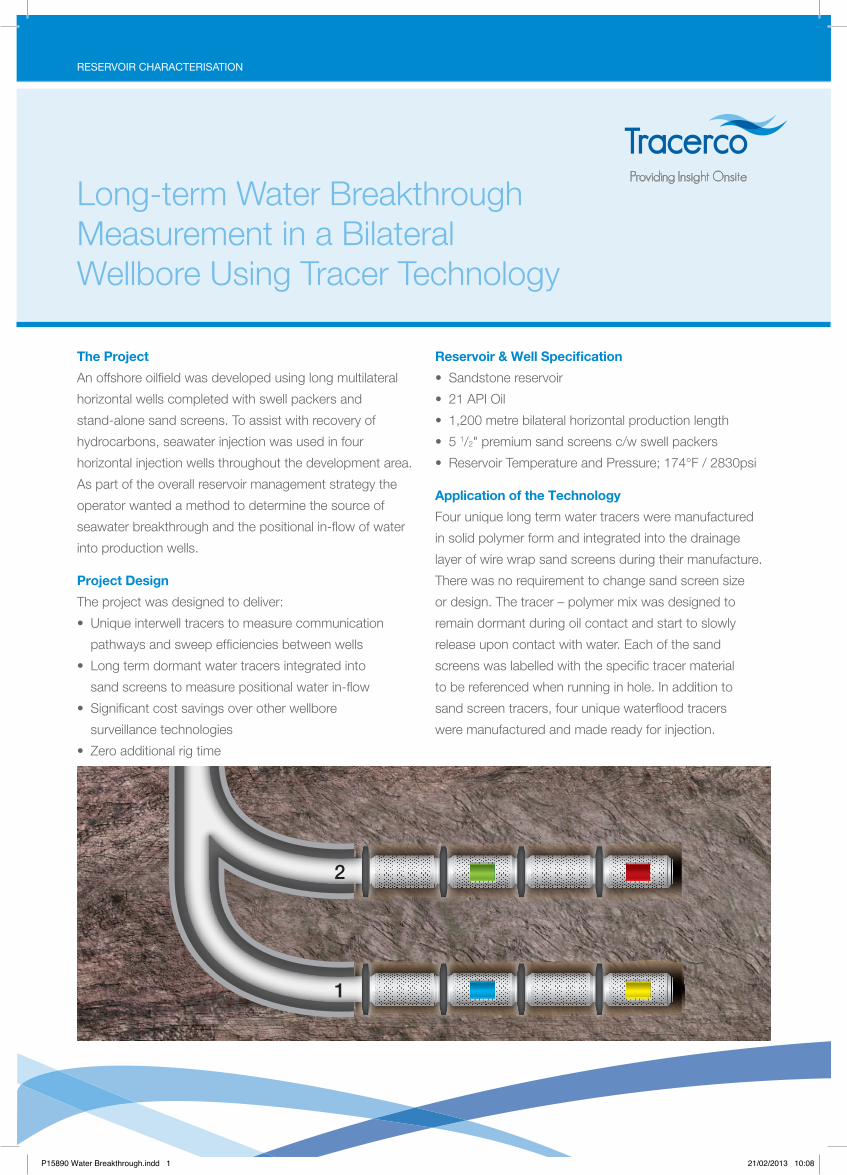
Sand screens containing tracer materials were transported
along with all other standard screens offshore. Each one
was unwrapped from its protective seal and placed within
the lower completion run sequence to locate it at specific
points along the two laterals. Two of the tracers were
located approximately two-thirds of the distance along
each lateral with the other two positioned around one-third
from the heel of each.
After each water injection well was brought on-stream and
stabilised over a few weeks, waterflood tracer was added
directly into the flow line using high pressure hydraulic
pumps over several hours with no disruption to normal
waterflood operations.
Sampling and Analysis
Production wells were tested once every two weeks to
determine water cut. Upon detection of water breakthrough
from each well a very small volume of water was taken and
sent to the nearest Tracerco laboratory for tracer analysis
using ultra-sensitive Gas Chromatography instrumentation
and optimised tracer detection methodology.
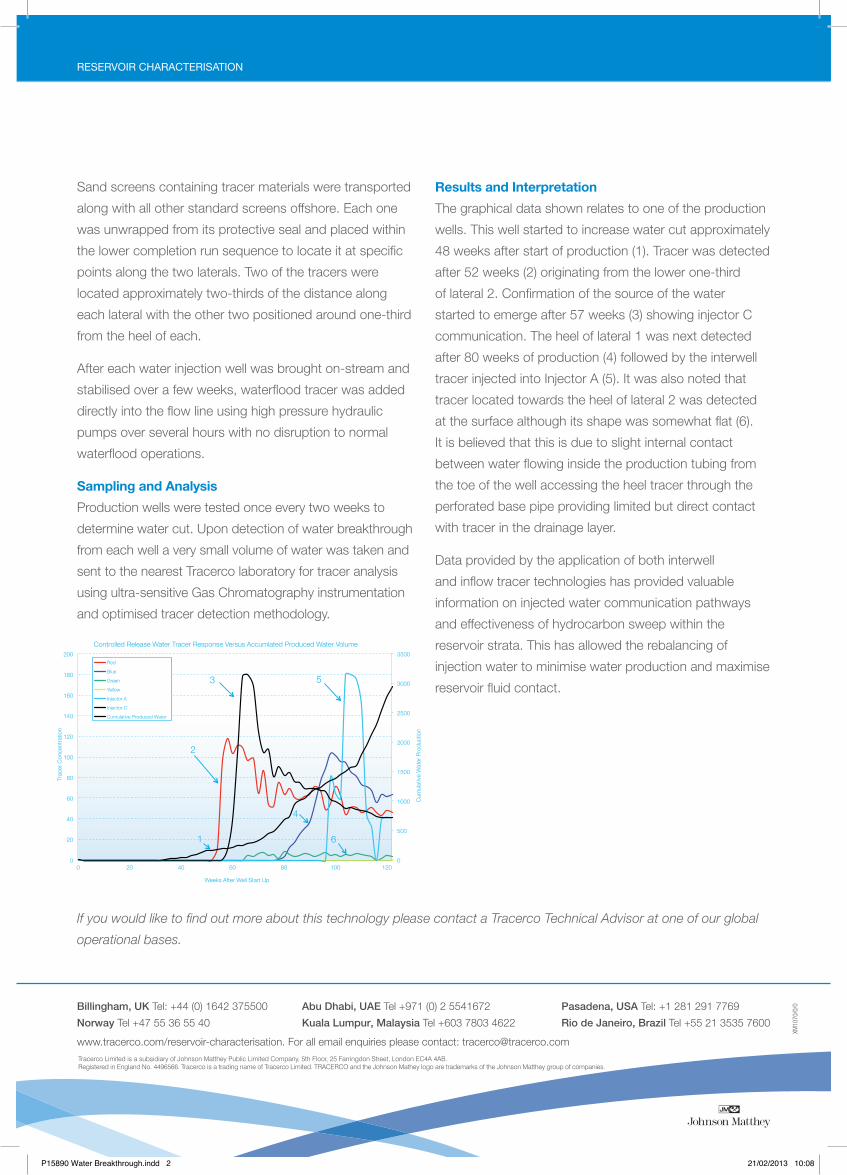
Results and Interpretation
The graphical data shown relates to one of the production
wells. This well started to increase water cut approximately
48 weeks after start of production (1). Tracer was detected
after 52 weeks (2) originating from the lower one-third
of lateral 2. Confirmation of the source of the water
started to emerge after 57 weeks (3) showing injector C
communication. The heel of lateral 1 was next detected
after 80 weeks of production (4) followed by the interwell
tracer injected into Injector A (5). It was also noted that
tracer located towards the heel of lateral 2 was detected
at the surface although its shape was somewhat flat (6).
It is believed that this is due to slight internal contact
between water flowing inside the production tubing from
the toe of the well accessing the heel tracer through the
perforated base pipe providing limited but direct contact
with tracer in the drainage layer.
Data provided by the application of both interwell
and inflow tracer technologies has provided valuable
information on injected water communication pathways
and effectiveness of hydrocarbon sweep within the
reservoir strata. This has allowed the rebalancing of
injection water to minimise water production and maximise
reservoir fluid contact.
Billingham, UK Tel: +44 (0) 1642 375500
Norway Tel +47 55 36 55 40
Abu Dhabi, UAE Tel +971 (0) 2 5541672
Kuala Lumpur, Malaysia Tel +603 7803 4622
Pasadena, USA Tel: +1 281 291 7769
Rio de Janeiro, Brazil Tel +55 21 3535 7600
www.tracerco.com/reservoir-characterisation. For all email enquiries please contact: [email protected] Limited is a subsidiary of Johnson Matthey Public Limited Company, 5th Floor, 25 Farringdon Street, London EC4A 4AB. Registered in England No. 4496566. Tracerco is a trading name of Tracerco Limited. TRACERCO and the Johnson Mathey logo are trademarks of the Johnson Matthey group of companies.
If you would like to find out more about this technology please contact a Tracerco Technical Advisor at one of our global
operational bases.
XM10
70/0
/0
0
500
1000
1500
2000
2500
3000
3500
0
20
40
60
80
100
120
140
160
180
200
0 20 40 60 80 100 120
Cum
ulat
ive
Wat
er P
rodu
ctio
n
Trac
er C
once
ntra
tion
Weeks After Well Start Up
Controlled Release Water Tracer Response Versus Accumlated Produced Water Volume
Red
Blue
Green
Yellow
Injector A
Injector C
Cumulative Produced Water
3
2
1
4
6
5
P15890 Water Breakthrough.indd 2 21/02/2013 10:08