lookout report - s&p global
TRANSCRIPT

Investors Are Becoming Less Comfortable Looking Past SoftEconomic Data And Declining Earnings Expectations
The combination of recent weaker-than-expected U.S. economic data and declining first-quarter
S&P 500 earnings expectations, in practical theory, should worry stock market bulls. Until this
past week, investors appeared to have been ignoring these facts, but that has now changed.
Although 80% of the dramatic decline in crude oil prices since mid-year 2014 occurred before
the start of 2015, the consequences of depressed energy prices continue to reverberate through
the entire stock market in terms of expected first-quarter 2015 corporate profitability. The 60%
decline in the price of spot crude oil since mid-year 2014 is weighing enormously on the energy
sector in which first-quarter earnings are expected to decline by 63%, but energy is clearly not
an isolated case. In fact, five S&P 500 sectors are now expected to report negative first-quarter
earnings growth as opposed to just two (energy and utilities) at the end of 2014 (see table 1).
Excluding the energy sector, calendar-year S&P 500 earnings are currently expected to grow by
7.6%, down from 11.1% at the end of 2014.
Separate but still energy-related factors are driving downward pressure on expected first-quarter
earnings for multiple sectors. The sharp reduction in energy-centric corporate earnings--and by
extension prospective exploration and production (i.e., heavy equipment and automation
infrastructure) spending and capital expenditure (CAPEX) budgets--is weighing heavily on
analysts' estimates of industrial sector earnings. Materials has also been hit hard as demand for
chemicals related to hydraulic fracturing diminishes, in addition to pricing pressure on certain
petrochemicals in which pricing is closely linked to underlying core commodity prices.
Furthermore, global demand for commodities and materials is under pressure from both
developed and emerging economies that depend heavily on crude oil exports and revenue to
fund domestic economic activity.
Lookout Reportfrom Global Markets Intelligence
April 2, 2015
Michael G Thompson
Managing Director
Global Markets Intelligence
(1) 212-438-3480
Robert A Keiser
Vice President
Global Markets Intelligence
(1) 212-438-3540
The Lookout Report is a compendium
of current data and perspectives from
across S&P Capital IQ and S&P Dow
Jones Indices covering corporate
earnings, market and credit risks,
capital markets activity, index
investing, and proprietary data and
analytics. Published biweekly by the
Global Markets Intelligence research
group, the Lookout Report offers a
detailed cross-market and cross-asset
view of investment conditions, risks,
and opportunities.
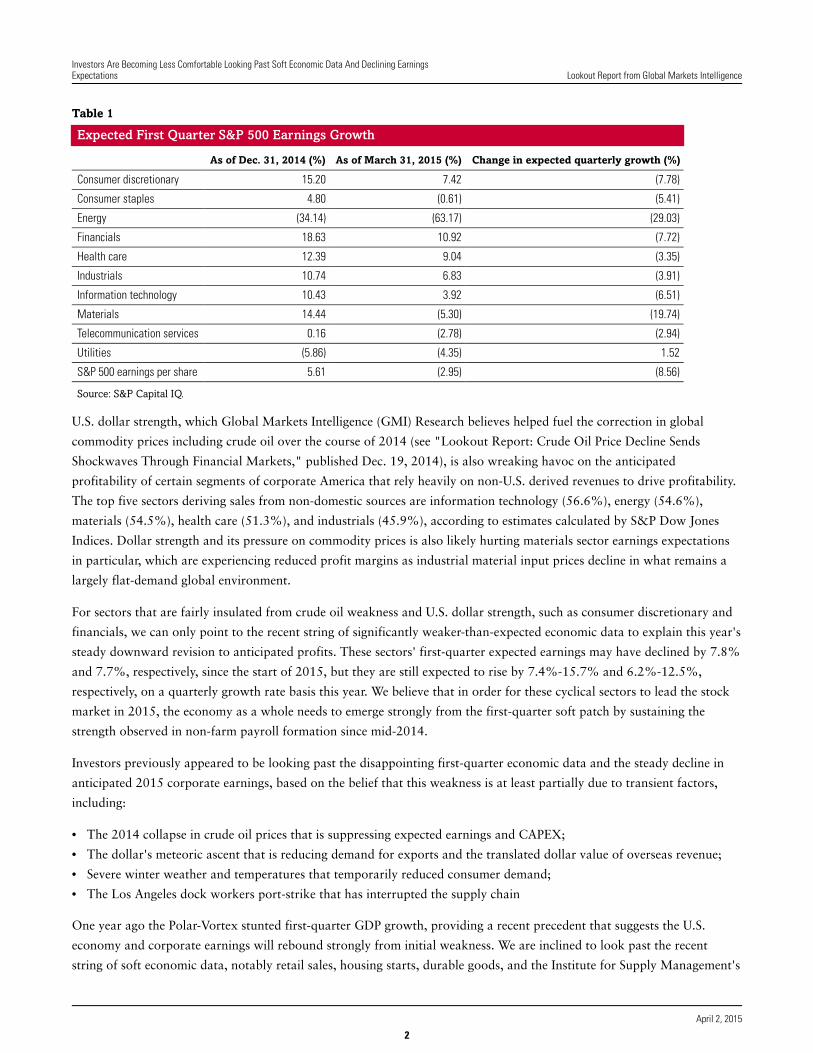
Table 1
Expected First Quarter S&P 500 Earnings Growth
As of Dec. 31, 2014 (%) As of March 31, 2015 (%) Change in expected quarterly growth (%)
Consumer discretionary 15.20 7.42 (7.78)
Consumer staples 4.80 (0.61) (5.41)
Energy (34.14) (63.17) (29.03)
Financials 18.63 10.92 (7.72)
Health care 12.39 9.04 (3.35)
Industrials 10.74 6.83 (3.91)
Information technology 10.43 3.92 (6.51)
Materials 14.44 (5.30) (19.74)
Telecommunication services 0.16 (2.78) (2.94)
Utilities (5.86) (4.35) 1.52
S&P 500 earnings per share 5.61 (2.95) (8.56)
Source: S&P Capital IQ.
U.S. dollar strength, which Global Markets Intelligence (GMI) Research believes helped fuel the correction in global
commodity prices including crude oil over the course of 2014 (see "Lookout Report: Crude Oil Price Decline Sends
Shockwaves Through Financial Markets," published Dec. 19, 2014), is also wreaking havoc on the anticipated
profitability of certain segments of corporate America that rely heavily on non-U.S. derived revenues to drive profitability.
The top five sectors deriving sales from non-domestic sources are information technology (56.6%), energy (54.6%),
materials (54.5%), health care (51.3%), and industrials (45.9%), according to estimates calculated by S&P Dow Jones
Indices. Dollar strength and its pressure on commodity prices is also likely hurting materials sector earnings expectations
in particular, which are experiencing reduced profit margins as industrial material input prices decline in what remains a
largely flat-demand global environment.
For sectors that are fairly insulated from crude oil weakness and U.S. dollar strength, such as consumer discretionary and
financials, we can only point to the recent string of significantly weaker-than-expected economic data to explain this year's
steady downward revision to anticipated profits. These sectors' first-quarter expected earnings may have declined by 7.8%
and 7.7%, respectively, since the start of 2015, but they are still expected to rise by 7.4%-15.7% and 6.2%-12.5%,
respectively, on a quarterly growth rate basis this year. We believe that in order for these cyclical sectors to lead the stock
market in 2015, the economy as a whole needs to emerge strongly from the first-quarter soft patch by sustaining the
strength observed in non-farm payroll formation since mid-2014.
Investors previously appeared to be looking past the disappointing first-quarter economic data and the steady decline in
anticipated 2015 corporate earnings, based on the belief that this weakness is at least partially due to transient factors,
including:
• The 2014 collapse in crude oil prices that is suppressing expected earnings and CAPEX;
• The dollar's meteoric ascent that is reducing demand for exports and the translated dollar value of overseas revenue;
• Severe winter weather and temperatures that temporarily reduced consumer demand;
• The Los Angeles dock workers port-strike that has interrupted the supply chain
One year ago the Polar-Vortex stunted first-quarter GDP growth, providing a recent precedent that suggests the U.S.
economy and corporate earnings will rebound strongly from initial weakness. We are inclined to look past the recent
string of soft economic data, notably retail sales, housing starts, durable goods, and the Institute for Supply Management's
Investors Are Becoming Less Comfortable Looking Past Soft Economic Data And Declining EarningsExpectations Lookout Report from Global Markets Intelligence
2
April 2, 2015
manufacturing PMI. We prefer to emphasize the consistent string of strong U.S. employment reports since mid-year 2014.
As long as this trend continues, which will further boost consumer confidence and incentivize households to spend rather
than save their energy tax cut, the outlook for the goods and services consumption-based U.S. economy and stock market
should continue to brighten in the foreseeable future. Should the U.S. job creation engine unexpectedly begin to misfire on
a sustained basis, then there would be additional significant reasons for skepticism regarding a stock market that currently
anticipates half of its sectors to report negative earnings growth in the first quarter of 2015.
Inside This Issue:
Macroeconomic Overview: Investors Are Becoming Less Comfortable Looking Past Soft Economic Data And Declining
Earnings Expectations
The combination of recent weaker-than-expected U.S. economic data and declining first-quarter S&P 500 earnings
expectations, in practical theory, should worry stock market bulls. Until this past week, investors appeared to have been
ignoring these facts, but that has now changed. Although 80% of the dramatic decline in crude oil prices since mid-year
2014 occurred before the start of 2015, the consequences of depressed energy prices continue to reverberate through the
entire stock market in terms of expected first-quarter 2015 corporate profitability. We are inclined to look past the recent
string of soft economic data, notably retail sales, housing starts, durable goods, and the ISM PMI, and we prefer to
emphasize the consistent string of strong U.S. employment reports since mid-year 2014.
Economic And Market Outlook: First Quarter's Low Bar Contends With Headwinds
Although the first quarter has a relatively easy growth comparison by recent standards, corporations had a number of
obstacles to overcome during the quarter, which are making the probability for a home run more difficult. Similar to last
year, abnormally cool weather across much of the country dampened economic data and likely corporate profitability.
Additionally, continued oil price declines, the West Coast port closure, and the rising U.S. dollar have all left their own
marks on the index. In the first-quarter, the S&P Euro 350 advanced an impressive 15.9% largely thanks to the launch of
Europe's €60 billion a month quantitative-easing program, which incentivized investors to put money to work in equities.
The first day of the second quarter continued the positive trajectory as the PMI reached a 10-month high at 52.2, adding
to the economic recovery idea and thus boosting the index.
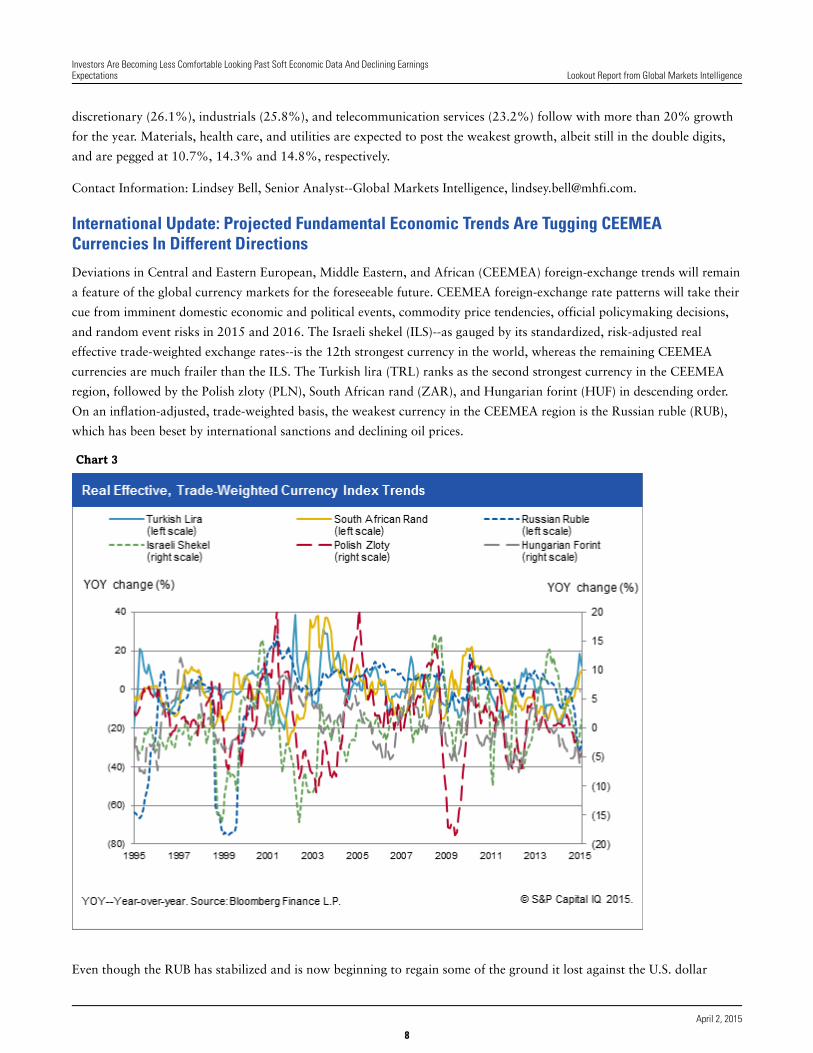
International Update: Projected Fundamental Economic Trends Are Tugging CEEMEA Currencies In Different Directions
Deviations in CEEMEA foreign-exchange trends will remain a feature of the global currency markets for the foreseeable
future. CEEMEA foreign-exchange rate patterns will take their cue from imminent domestic economic and political events,
commodity price tendencies, official policymaking decisions, and random event risks in 2015 and 2016. The Israeli shekel
(ILS)--as gauged by its standardized, risk-adjusted real effective trade-weighted exchange rates--is the 12th strongest
currency in the world, whereas the remaining CEEMEA currencies are much frailer than the ILS. The Turkish lira (TRL)
ranks as the second strongest currency in the CEEMEA region, followed by the Polish zloty (PLN), South African rand
(ZAR), and Hungarian forint (HUF) in descending order. On an inflation-adjusted, trade-weighted basis, the weakest
currency in the CEEMEA region is the Russian ruble (RUB), which has been beset by international sanctions and declining
oil prices.
S&P Dow Jones Index Commentary: S&P 500 2014 Buybacks Post 16.3% Increase
S&P Dow Jones Indices announced that preliminary fourth-quarter 2014 stock buybacks, or share repurchases, decreased
8.7% to $132.6 billion from the third quarter. However, for the full year, S&P 500 issues increased their buyback
Investors Are Becoming Less Comfortable Looking Past Soft Economic Data And Declining EarningsExpectations Lookout Report from Global Markets Intelligence
3
April 2, 2015

expenditures by 16.3% to $553.3 billion. The battle cry from the boardroom is "shareholder return" as companies
continue spending more on buybacks and dividends, partially because companies currently have record cash levels. Indeed,
cash recently ticked up to a new record: It is now the equivalent of 95 weeks of the current 12-month net (generally
accepted accounting principal) income, 8.6% of current market value, and 49% of long-term debt. In addition, share
count reduction continues to be the market takeaway because it has significantly increased EPS for 20% of index issues in
each of the past four quarters.
Leveraged Commentary And Data: Primary Loan Market Sputters To Lowest First-Quarter Volume Since 2010
Bolstered by a troika of large, well-rated, corporate merger M&A loans--Dollar Tree Inc. ($6.2 billion), Valeant
Pharmaceuticals International Inc., ($5.15 billion), and Ball Corp. ($3 billion revolver)--new-issue volume rose in the first
quarter to $86.1 billion, including $56.4 billion of institutional tranches, from a three-year low of $66.6 billion/$43.4
billion during the past three months. Still, participants are not exactly breaking out the cigars and champagne. Primary
market volume has paled in comparison to the liquidity-heavy/regulation-light first quarter of 2014 when arrangers placed
$168 billion of new issues, including $129 billion of institutional facilities. Indeed, the last year that total first-quarter
volume was lower was in 2010. What's going on is no mystery.
R2P Corporate Bond Monitor
In North America, recent data remains mixed, but signs point to a likely upturn in consumer activity and spending.
Consumer confidence rose to 101.3 in March from 98.8 in February, close to a high of 103.8 that was set in mid-2008,
according to The Conference Board. The rise represented higher expectations stemming from the labor market's continued
strength. Initial claims for U.S. unemployment benefits fell by 9,000 to 282,000 for the week ended March 21, 2015, after
rising by 1,000 in the week ended March 14. The four-week moving average for claims now stands at 297,000 after
decreasing a sizable 7,750 from the previous week. Eurozone sentiment is increasing, following the past month's strong
data. Business and consumer confidence has continued its rise for a fourth consecutive month, according to the European
Commission. The economic sentiment indicator rose to 103.9 in March from 102.3 in February, its highest level in nearly
four years, driven by low oil prices, the weaker euro, and the impact of the ECB's quantitative easing program.
Capital Market Commentary: IPOs, M&A, And Debt
Following the final quarter of 2014, which had 71 U.S. IPOs that raised $14 billion, first-quarter 2015 had a lackluster
performance. Only 30 IPOs were finalized with proceeds of only $4.6 billion. The recent quarter's results also performed
poorly compared with the first quarter of 2014, which had 71 IPOs that raised $11.6 billion. U.S. M&A activity during
the first quarter was dominated by health care deals as more than $92 billion of $411 billion in announced deals came
from that sector. That's up from $58 billion in announced U.S. health care deals in the initial quarter of 2014. The likely
outlook for forthcoming fixed-income security offerings appears to be on a two-way track if indications hold true based
on recent Committee on Uniform Security Identification Procedures requests. For example, based on a more than 50%
jump in the number of security identifiers for upcoming municipal bond offerings in the first quarter compared with the
year earlier, the number of underwritings has markedly increased.
Economic And Market Outlook: First Quarter's Low Bar Contends With Headwinds
North America
Although the first quarter has a relatively easy growth comparison by recent standards, corporations had a number of
obstacles to overcome during the quarter, which are making the probability for a home run more difficult. Similar to last
Investors Are Becoming Less Comfortable Looking Past Soft Economic Data And Declining EarningsExpectations Lookout Report from Global Markets Intelligence
4
April 2, 2015

year, abnormally cool weather across much of the country dampened economic data and likely corporate profitability.
Additionally, continued oil price declines, the West Coast port closure, and the rising U.S. dollar have all left their own
marks on the index (see "Lookout Report: Financial Market Implications of The March Federal Open Market Committee
Statement: Perception is Reality," published March 20, 2015). Ultimately, analysts shaved about $2.40 off the initial
$29.15 first-quarter earnings expectations and almost 900 basis points (bps) off growth from the start of the year. Thus,
earnings growth will now decline as opposed to initial expectations for a mid-single-digit increase.
Chart 1
Currently, first-quarter earnings per share stand at $26.78, representing a 3.0% decline from the previous year. If the
quarter plays out as currently expected, the S&P 500 Index would have the first year-over-year quarterly decline since the
third quarter of 2009, which recorded a 1.7% contraction. The first quarter's decline comes on top of a 3.3% growth rate
in the first quarter of 2014, which was characterized by weak economic growth given severely cold weather that hurt
corporate earnings. Going into the first-quarter 2014 reporting period, analysts were similarly pessimistic and only
modeled a 0.2% earnings increase. However, corporations beat that estimate by more than 300 bps with 3.3% growth.
(Beat rates typically range from 300 bps-350 bps.) That type of beat would result in a flat or slight improvement in
earnings for the first quarter of this year.
We also view the 3.3% growth in first-quarter 2014 as a relatively low bar because it's the Index's smallest growth in the
past nine quarters. More difficult was the 7.7% growth rate that the fourth quarter of 2014 had to lap. Despite that tough
comparison, earnings grew 7.8% even with an 8.6% decline in energy earnings as oil prices declined 38.8% during the
Investors Are Becoming Less Comfortable Looking Past Soft Economic Data And Declining EarningsExpectations Lookout Report from Global Markets Intelligence
5
April 2, 2015

period.
When analyzing growth in the first quarter, the energy sector's drag is accounting for nearly 900 bps of earnings
degradation. Growth excluding this sector would be 5.9%, which is more typical in a recovering economic environment.
In the first quarter, oil declined 12.5% further, and as such, analysts are predicting earnings for the energy sector to
decline by 63.2%. Materials, utilities, telecommunication services, and consumer staples are also expected to report
declines. This would be the first time since 2009 (and also the last time the Index posted negative growth) that five sectors
have posted earnings contractions in the same quarter.
As mentioned above, the more cyclical sectors, including financials, consumer discretionary, and industrials, should join
the health care sector in leading quarterly growth. Information technology, which led the fourth quarter, is expected to see
growth moderate in the first quarter, likely because of the group's foreign currency exposure.
Chart 2
The S&P 500 ended the first quarter with a small gain of 0.4%, primarily driven by soft economic data and a surging
dollar. Compared with this time last year, when the index gained 1.3%, investors seem more market-neutral. Four of the
10 sectors have not moved meaningfully in either direction. Health care once again leads (up 6.2%), which is reasonable
given the sector's growth prospects, and consumer discretionary (up 4.4%) joins health care as investors bet on consumer
resurgence in 2015. Utilities, which had earnings expectations reduced based on weather trends, and energy have been the
key underperformers.
Investors Are Becoming Less Comfortable Looking Past Soft Economic Data And Declining EarningsExpectations Lookout Report from Global Markets Intelligence
6
April 2, 2015

Table 2
S&P 500 First-Quarter Sector Price Performance: 2015 Versus 2014
First-quarter 2015 price
change (%)
First-quarter 2014 price
change (%)
Fiscal year 2014 price
change (%)
Forward year
price-to-earnings (x)
Consumer discretionary 4.38 (3.16) 8.05 19.70
Consumer staples 0.35 (0.16) 12.87 20.05
Energy (3.55) 0.19 (9.99) 29.67
Financials (2.51) 2.15 13.10 14.37
Health care 6.16 5.40 23.30 18.29
Industrials (1.40) (0.39) 7.52 15.78
Information technology 0.17 1.86 18.18 16.28
Materials 0.40 2.30 4.68 17.79
Telecommunicationservices
0.25 (0.73) (1.91) 13.73
Utilities (6.02) 9.02 24.29 16.56
S&P 500 0.44 1.30 11.39 17.45
Source: S&P Capital IQ.
Europe
In the first-quarter, the S&P Euro 350 advanced an impressive 15.9% largely thanks to the launch of Europe's €60 billion
a month quantitative-easing program, which incentivized investors to put money to work in equities. The first day of the
second quarter continued the positive trajectory as the Purchasing Managers' Index (PMI) reached a 10-month high at
52.2, adding to the economic recovery idea and thus boosting the index.
Earnings growth for the Euro 350 in 2015 is expected to be 14.8% (versus 15.8% two weeks ago), and 2016 growth is
projected to be 12.7% (the same as two weeks ago).
Table 3
CY 2015 And 2016 Euro 350 EPS And Growth Rate
--CY 2015-- --CY 2016--
EPS (€) Growth (%) EPS (€) Growth (%)
Consumer discretionary 126.03 26.10 142.24 12.90
Consumer staples 160.45 15.70 173.86 8.40
Energy 77.67 (35.70) 106.21 36.70
Financials 74.53 27.90 82.20 10.30
Health care 128.69 14.30 140.63 9.30
Industrials 110.42 25.80 123.15 11.50
Information technology 64.96 39.90 75.31 15.90
Materials 153.97 10.70 183.22 19.00
Telecommunication services 77.30 23.20 84.79 9.70
Utilities 94.55 14.80 96.41 2.00
S&P 350 99.15 14.80 111.73 12.70
CY--Calendary-year. EPS--Earnings per share. Source: S&P Capital IQ.
Of the 10 sectors, analysts expect double-digit growth from all sectors besides energy, which is expected to decline.
Technology will once again lead (for the third year in a row) with 39.9% growth. Financials (27.9%), consumer
Investors Are Becoming Less Comfortable Looking Past Soft Economic Data And Declining EarningsExpectations Lookout Report from Global Markets Intelligence
7
April 2, 2015
discretionary (26.1%), industrials (25.8%), and telecommunication services (23.2%) follow with more than 20% growth
for the year. Materials, health care, and utilities are expected to post the weakest growth, albeit still in the double digits,
and are pegged at 10.7%, 14.3% and 14.8%, respectively.
Contact Information: Lindsey Bell, Senior Analyst--Global Markets Intelligence, [email protected].
International Update: Projected Fundamental Economic Trends Are Tugging CEEMEACurrencies In Different Directions
Deviations in Central and Eastern European, Middle Eastern, and African (CEEMEA) foreign-exchange trends will remain
a feature of the global currency markets for the foreseeable future. CEEMEA foreign-exchange rate patterns will take their
cue from imminent domestic economic and political events, commodity price tendencies, official policymaking decisions,
and random event risks in 2015 and 2016. The Israeli shekel (ILS)--as gauged by its standardized, risk-adjusted real
effective trade-weighted exchange rates--is the 12th strongest currency in the world, whereas the remaining CEEMEA
currencies are much frailer than the ILS. The Turkish lira (TRL) ranks as the second strongest currency in the CEEMEA
region, followed by the Polish zloty (PLN), South African rand (ZAR), and Hungarian forint (HUF) in descending order.
On an inflation-adjusted, trade-weighted basis, the weakest currency in the CEEMEA region is the Russian ruble (RUB),
which has been beset by international sanctions and declining oil prices.
Chart 3
Even though the RUB has stabilized and is now beginning to regain some of the ground it lost against the U.S. dollar
Investors Are Becoming Less Comfortable Looking Past Soft Economic Data And Declining EarningsExpectations Lookout Report from Global Markets Intelligence
8
April 2, 2015

(USD) following its steep 51% depreciation during the seven months from the end of June 2014 to the end of January
2015, the Russian currency is still highly vulnerable to downside volatility. The Russian central bank's remarkably
versatile, yet unorthodox, monetary policy--reducing the official lending rate by 250 bps since the end of January to 14%
currently--has counterintuitively arrested the precipitous slide in the RUB and tentatively restored a little of investor
confidence in the currency. Mirroring the improved mood in the financial markets, the Moscow stock exchange has
returned the fifth strongest year-to-date performance among stock markets globally, and Russia's sovereign debt is
rewarding investors with a 10% return (the returns of both shares and bonds are measured in USD).
Nevertheless, the renewed stability in the RUB--the policy regime of which is both a de facto- and de jure-managed
floating exchange rate to smooth the currency's day-to-day fluctuations--has been a reflection of the hesitant stabilization
of petroleum prices during the past two months. A worldwide glut in oil supply, relative to demand, is depressing energy
costs and, consequently, dampening growth in foreign-exchange reserves--from which no immediate relief for crude
producers (like Russia) is anticipated until market forces establish a solid floor underneath petroleum prices.
In spite of the success of the Bank of Russia's credit policy in checking the RUB's value decline, the state's subversive
foreign policy and deteriorating economic climate will eventually undermine the RUB on both its euro (EUR) and USD
crosses. Moscow may be breathing a sigh of relief for now, but--as long as President Putin and his administration aim to
destabilize neighboring countries through either the outright instigation of insurrection (as in Ukraine) or deliberate
violations of sovereign air space (as in the Baltics)--the imposition of additional international financial sanctions could
worsen Russia's internal economic crisis on top of the nation's deteriorating revenue streams from oil and other
commodities.
Although Russia should get a modest reprieve this year on the international trade front thanks to the plunge in the RUB's
value, GMI does not expect the present calm in Russia's financial markets to endure much longer, especially with forecasts
for a 4% decline in the country's real GDP and hyperinflation of 15% induced by the seven-month collapse of the RUB.
In the absence of any unforeseen outbreak of hostilities along the Israeli border, the ILS should continue to benefit from
comparatively firm, noninflationary economic growth in excess of 3% because of the impressive financial policymaking
achievements initiated by the outgoing ruling alliance. During the March 17 general elections, the Israeli electorate
awarded the incumbent Likud party, under the leadership of Prime Minister Benjamin Netanyahu, with an additional 12
seats in the Knesset (Israel's parliament). This increased the number of seats held by the center-right party to 30, which is
equivalent to a quarter of the legislature, and ensured that Likud will remain the major partner in the governing coalition
that is expected to take shape in the weeks ahead.
Undoubtedly, Netanyahu will need to accommodate the interests of the smaller right-wing parties that will probably ally
with Likud to fashion a majority. However, we do not anticipate any changes in the trajectory of Israel's fiscal and
monetary policies for the first two to three years of the new regime's term in office. A likely stable polity during the next
few years would accord the incoming government the requisite latitude to proceed, albeit gradually, with the advancement
of reforms and increased deregulation in an effort to further liberalize the domestic economy.
Sustained noninflationary economic growth of greater than 3%, together with a widening current account surplus
exceeding 3% (as a proportion of GDP) and a narrowing budget shortfall below -3% (also as a proportion of GDP)
through 2016, should reinforce investor confidence in Israeli stocks, sovereign debt, and other investment opportunities,
all of which should promote stability in, and perhaps a modest firming of, the shekel next year.
Chronic depreciation of the TRL in relation to the USD appears unlikely to give way to a steadier trend in the immediate
future. Policy disputes are surfacing between President Recep Tayyip Erdogan and Prime Minister Ahmet Davutoglu, as
Investors Are Becoming Less Comfortable Looking Past Soft Economic Data And Declining EarningsExpectations Lookout Report from Global Markets Intelligence
9
April 2, 2015

the Prime Minister is resisting the President's demands for an expansion of his executive powers at the detriment of
legislative authority. The discord between Erdogan and his hand-picked successor, Davutoglu, has taken on an air of
strident acrimony of late, jeopardizing their long-standing friendship and political alliance. Regardless of the differences
between the two leaders, an overhaul of the constitution is only achievable if the Turkish electorate confers a three-fifths
majority of parliamentary seats to the incumbent Justice and Development Party (AKP) in national elections scheduled for
this June. Until then, intensifying uncertainty among investors about the direction of economic policymaking will weigh
adversely on the Turkish currency despite the fact that the country still boasts solid public finances and a well-capitalized
and regulated financial sector.
Even so, Turkish economic activity should remain relatively volatile before and after the June elections. Having declined
by almost 10 percentage points over the last four years, domestic demand--principally private consumption and gross fixed
capital formation--is expected to regain some of its footing through 2017 as the pace of inflation moderates. Yet, with
huge external financing requirements, Turkey will stay highly dependent on variable portfolio capital inflows that are
subject to financial market volatility, notwithstanding the mitigating effects of the decline in the cost of imported oil
denominated in USD. Worse still, an interest-rate hike by the U.S. Federal Reserve would probably entail faster
TRL-to-USD depreciation by disrupting, if not throttling into reverse, the country's auspicious trend in capital flows.
Meanwhile, the PLN--having ceded substantial ground (20%) versus the USD since June 2014 while strengthening by
4.4% against the EUR in the past three months--may fluctuate narrowly this year before appreciating modestly in 2016.
Uncertainty prevails on the political front prior to parliamentary elections that are slated for later this year. The coalition
government of the center-right Civic Platform (PO) and rural-based Polish Peasants' party (PSL) retains a slender majority
in the national legislature (Sejm) and should see a strong challenge from its opponents in the coming political campaign.
With the PLN's stability already threatened by Russian subversion in Ukraine and Greece's possible exit from the euro
bloc, the heightened risk that the incumbent coalition, led by Prime Minister Ewa Kopacz, might lose to a fragmented
opposition could spell trouble ahead for the liberal policymaking atmosphere in Warsaw. These fears have been mirrored
by the 3.6% year-to-date decline (in USD terms) of the Warsaw stock exchange.
Economically, Poland is forecast to record stable, noninflationary real GDP growth of 3.0%-3.5% through 2016. A
projected increase in the unemployment rate to double-digit levels (according to Bloomberg median consensus estimates),
owing to slowing internal sources of demand--specifically household spending and business fixed investment--will limit the
upside to real economic activity nationally. Moreover, an expected expansion in Poland's trade deficit, attributable to
imports expanding faster than exports, should add to the headwinds that the real economy will face over the next three
years irrespective of any further credit accommodation by the National Bank of Poland, which has already decreased its
reference rate by 325 bps since October 2012 to prevent the PLN from appreciating further relative to the EUR.
Similar to our projections for the zloty and the Polish macro-economy, the HUF stands to lose further ground in its pairing
versus the USD in 2015, although the currency might reverse course and begin appreciating against its U.S. rival thereafter.
The governing Fidesz-Hungarian Civic Union, with the support of the Christian Democratic People's party--its
subordinate ally--is under no obligation to schedule parliamentary elections for another three years, having scored
decisively in three consecutive ballots last year, underpinning the dominance of the nationalist Fidesz party under Premier
Viktor Orban. A stable polity would normally imply continued steadiness in the policymaking climate were it not for the
regime's pro-Moscow stance and frequent conflicts with Brussels over its controversial economic policies, institutional
reforms ,and political practices that are construed as contrary to the pro-democratic and liberal principles that are the
foundation of the European Union. Yet, in spite of Budapest's differences with its detractors in Brussels, the regime's plans
to stimulate growth and manage the fiscal deficit and public debt remain intact.
Investors Are Becoming Less Comfortable Looking Past Soft Economic Data And Declining EarningsExpectations Lookout Report from Global Markets Intelligence
10
April 2, 2015

A slowdown in the Hungarian economy--notwithstanding any further fiscal or monetary stimulus furnished by the
government or central bank--appears unavoidable this year and next despite the country's still strong foreign trade
patterns that will cushion the downside influences on its real economic activity. Weaker real GDP growth and lower
interest rates will detract from the HUF's strength on its cross versus the EUR but may encourage investors to short the
HUF in relation to the USD. Still, unless Orban moves the policy course of his regime in a dramatically divergent direction,
we expect the HUF to depreciate further vis-à-vis the USD in 2015, perhaps regaining some strength during the coming
two years.
Finally, the ZAR's cumulative 45% plunge in value relative to the USD during the past four years has had little material
impact on the South African economy on account of the persistently frail overseas demand for its commodity exports.
Having taken an oppressive toll on the ZAR, feeble industrial demand from China and other sources worldwide are
unlikely to improve in the immediate future. While South Africa's economy may get some marginal relief in its external
accounts thanks to a declining trend in imports arising from fragile household demand, domestic sources of growth are
expected to contribute little, if any, upside momentum. A 25% unemployment rate will proceed to exact a heavy toll on
consumer spending and budgetary trends as the monetary authorities grapple with the twin goals of stabilizing the
currency and stimulating economic activity. Addressing labor demands and social inequality may further imperil the
government's fiscal targets.
Consequently, near-term prospects for ZAR-to-USD stability look unattainable. The unfavorable commodity demand
patterns will not undergo a reversal anytime soon, and the government of President Jacob Zuma seems defenseless in the
face of pervasive labor strife that has halted the production of key natural resources for months at a time. The Reserve
Bank of South Africa (RBSA) is caught in a critical policy dilemma, trying to decide whether to abandon its credit
tightening policy to stimulate domestic demand or to proceed with it in a fruitless attempt to restore stability to the ZAR.
Investors should expect further depreciation of the ZAR relative to the USD in 2015.
Given the preceding outlook for CEEMEA currencies, we recommend long positions in the Israeli shekel, Hungarian
forint, and Polish zloty versus the USD, hedging the HUF and PLN partially or fully against the dollar, and shorting or
avoiding entirely the RUB, ZAR, and TRL vis-à-vis both the dollar and euro.
Contact Information: John Krey, International Investment Analyst, [email protected].
S&P Dow Jones Index Commentary: S&P 500 2014 Buybacks Post 16.3% Increase
S&P Dow Jones Indices announced that preliminary fourth-quarter 2014 stock buybacks, or share repurchases, decreased
8.7% to $132.6 billion from the third quarter. However, for the full year, S&P 500 issues increased their buyback
expenditures by 16.3% to $553.3 billion.
The battle cry from the boardroom is "shareholder return" as companies continue spending more on buybacks and
dividends, partially because companies currently have record cash levels. Indeed, cash recently ticked up to a new record:
It is now the equivalent of 95 weeks of the current 12-month net (generally accepted accounting principal) income, 8.6%
of current market value, and 49% of long-term debt.
In addition, share count reduction continues to be the market takeaway because it has significantly increased EPS for 20%
of index issues in each of the past four quarters. Although fourth-quarter expenditures were down 8.7%, the number of
issues reducing their share count by at least 4% year-over-year and therefore increasing their EPS by at least that amount
continues to be approximately 20%--a significant level.
Buybacks reached their high mark in 2007 when companies spent $589.1 billion; the recession low point of $137.6 billion
Investors Are Becoming Less Comfortable Looking Past Soft Economic Data And Declining EarningsExpectations Lookout Report from Global Markets Intelligence
11
April 2, 2015

in 2009 is the lowest.
More issues reduced their share count--up to 308 issues in the fourth quarter from 257 in the third quarter and 276 in the
fourth quarter of 2013.
Significant changes (generally considered 1% or greater for the quarter) continued to strongly favor reductions as 117
issues reduced their share count by at least 1%, up from 101 in fourth-quarter 2014 and 112 in fourth-quarter 2013.
Share reduction changes of at least 4% (fourth-quarter 2014 over fourth-quarter 2013), which can be seen in EPS
comparisons, were flat at 99 in the fourth and third quarters of 2014 but up from the 83 posted in fourth-quarter 2013.
For the year, combined buyback and dividend expenditures reached a new record high of $903.7 billion, up from the
$787.4 billion spent in 2013.
Table 4
S&P 500 Sector Buybacks
Sector (mil. $)
Fourth-quarter
2014
Third-quarter
2014
Fourth-quarter
2013 2014 2013 Five-year
Second-quarter
2009 (low)
Third-quarter
2007 (high)
Consumerdiscretionary
22,841 21,327 18,080 81,747 70,226 333,805 2,350 34,902
Consumer staples 11,817 9,970 11,309 42,347 42,822 233,872 4,013 16,088
Energy 10,311 8,810 12,236 40,928 40,950 183,777 5,343 14,717
Financials 19,371 20,441 16,077 75,404 58,547 254,629 1,170 27,762
Health care 15,104 13,930 14,525 60,069 61,959 296,227 4,699 18,660
Industrials 15,535 16,498 16,230 66,718 53,735 214,618 1,681 17,521
Informationtechnology
32,046 42,906 34,528 154,703 121,448 518,192 4,757 23,904
Materials 5,007 10,866 3,899 28,179 10,306 56,320 159 6,503
Telecommunicationservices
92 286 2,228 2,267 14,866 30,991 13 3,947
Utilities 511 158 300 913 728 9,239 10 7,943
Total 132,634 145,193 129,411 553,275 475,587 2,131,670 24,195 171,947
Sector buyback
makeup (%)
Fourth-quarter
2014
Third-quarter
2014
Fourth-quarter
2013 2014 2013 Five-year
Second-quarter
2009
Third-quarter
2009
Consumerdiscretionary
17.2 14.7 14.0 14.8 14.8 15.7 9.7 20.3
Consumer staples 8.9 6.9 8.7 7.7 9.0 11.0 16.6 9.4
Energy 7.8 6.1 9.5 7.4 8.6 8.6 22.1 8.6
Financials 14.6 14.1 12.4 13.6 12.3 11.9 4.8 16.1
Health care 11.4 9.6 11.2 10.9 13.0 13.9 19.4 10.9
Industrials 11.7 11.4 12.5 12.1 11.3 10.1 6.9 10.2
Informationtechnology
24.2 29.6 26.7 28.0 25.5 24.3 19.7 13.9
Materials 3.8 7.5 3.0 5.1 2.2 2.6 0.7 3.8
Telecommunicationservices
0.1 0.2 1.7 0.4 3.1 1.5 0.1 2.3
Utilities 0.4 0.1 0.2 0.2 0.2 0.4 0.0 4.6
Source: S&P Dow Jones Indices.
On a sector basis, information technology continued to dominate buybacks, though its fourth-quarter 2014 percentage of
Investors Are Becoming Less Comfortable Looking Past Soft Economic Data And Declining EarningsExpectations Lookout Report from Global Markets Intelligence
12
April 2, 2015

buybacks declined to 24.2% from third-quarter's 29.6%.
Apple Inc. led the index for 2014 with a record-setting $45 billion in purchases, up 73.5% from its $25.9 billion 2013
purchases. ExxonMobil Corp. came in a distant second at $13.2 billion, down 17.6% from its 2013 $16 billion
expenditure, and Intel Corp. rounded out the top three as it spent $10.8 billion, significantly higher more than its $2.1
billion in 2013.
Table 5
Largest S&P 500 Buybacks
Company Sector 2014 (mil. $) 2013 (mil. $) Five-years (mil. $) 10-year (mil. $)
Apple Inc. Information technology 45,001 25,939 72,890 73,245
ExxonMobil Corp. Energy 13,183 15,998 85,397 220,435
Intel Corp. Information technology 10,792 2,147 34,125 61,100
IBM Corp. Information technology 9,998 10,307 62,721 114,146
Wells Fargo & Co. Financials 9,414 5,356 21,195 35,580
Oracle Corp. Information technology 8,099 10,750 32,433 45,176
Microsoft Corp. Information technology 8,048 6,371 40,155 120,963
Merck & Co. Inc. Health care 7,703 6,516 20,324 26,496
Johnson & Johnson Health care 7,124 3,538 27,618 49,487
Home Depot Inc. Consumer discretionary 7,000 8,546 25,608 46,315
Monsanto Co. Materials 6,817 1,629 9,123 10,342
Cisco Systems Inc. Information technology 6,419 8,235 31,787 69,588
Procter & Gamble Co. Consumer staples 6,254 5,005 30,378 74,010
The Walt Disney Co. Consumer discretionary 6,112 4,761 22,569 40,539
Boeing Co. Industrials 6,001 1,801 7,802 16,218
3M Co. Industrials 5,652 5,212 16,623 26,238
The Goldman Sachs Group Inc. Financials 5,469 6,175 26,515 52,432
Gilead Sciences Inc. Health care 5,349 582 13,004 17,004
Top 20 (mil. $) 174,435 128,868 580,267 1,099,315
S&P 500 (mil. $) 553,275 475,587 2,131,670 3,979,128
S&P 500 (%) 31.53 27.10 27.22 27.63
Source: S&P Dow Jones Indices.
Contact Information: Howard Silverblatt, Senior Index Analyst--S&P Dow Jones Indices, [email protected].
Leveraged Commentary And Data: Primary Loan Market Sputters To Lowest First-QuarterVolume Since 2010
Bolstered by a troika of large, well-rated, corporate merger and acquisition (M&A) loans--Dollar Tree Inc. ($6.2 billion),
Valeant Pharmaceuticals International Inc., ($5.15 billion), and Ball Corp. ($3 billion revolver)--new-issue volume rose in
the first quarter to $86.1 billion, including $56.4 billion of institutional tranches, from a three-year low of $66.6
billion/$43.4 billion during the past three months.
Still, participants are not exactly breaking out the cigars and champagne. Primary market volume has paled in comparison
to the liquidity-heavy/regulation-light first quarter of 2014 when arrangers placed $168 billion of new issues, including
$129 billion of institutional facilities. Indeed, the last year that total first-quarter volume was lower was in 2010.
Investors Are Becoming Less Comfortable Looking Past Soft Economic Data And Declining EarningsExpectations Lookout Report from Global Markets Intelligence
13
April 2, 2015

What's going on is no mystery. Office of the Comptroller of the Currency- and Federal Reserve-supervised arrangers
remain under intense regulatory pressure to lead only loans that would pass muster in shared national credit reviews. The
underwriting window, as a result, is narrower than it would normally be at this point in the cycle, arrangers say,
dampening volume, particularly on opportunistic issues.
Chart 4
M&A volume increased sequentially from the fourth quarter, and although it was down from the first quarter of 2014, it
held up slightly better than the primary market as a whole. In the first three months of 2015, issuers tapped the market for
$56.7 billion of acquisition-driven loans, including $42.7 billion of institutional tranches, versus $67.3 billion/$54.1
billion during the first three months of 2014.
Drilling down, the M&A total reflects progress beyond the three large corporate deals already mentioned. Despite
regulatory pressure on debt multiples and sky-high equity prices, straight leveraged buyout (LBO) loan volume rose
sequentially in the first quarter--largely as a result of PetSmart Inc. ($4.3 billion), Riverbed Technology Inc. ($1.6 billion),
and SIG Combibloc Group AG ($1.2 billion)--though it also dropped from the first quarter of 2014. All told, arrangers
inked $20.3 billion of such loans, including $18.2 billion of institutional facilities, versus $14.7 billion/$13.2 billion
during the prior three months and $25.3 billion/$22.8 billion during the first three months of 2014.
Investors Are Becoming Less Comfortable Looking Past Soft Economic Data And Declining EarningsExpectations Lookout Report from Global Markets Intelligence
14
April 2, 2015
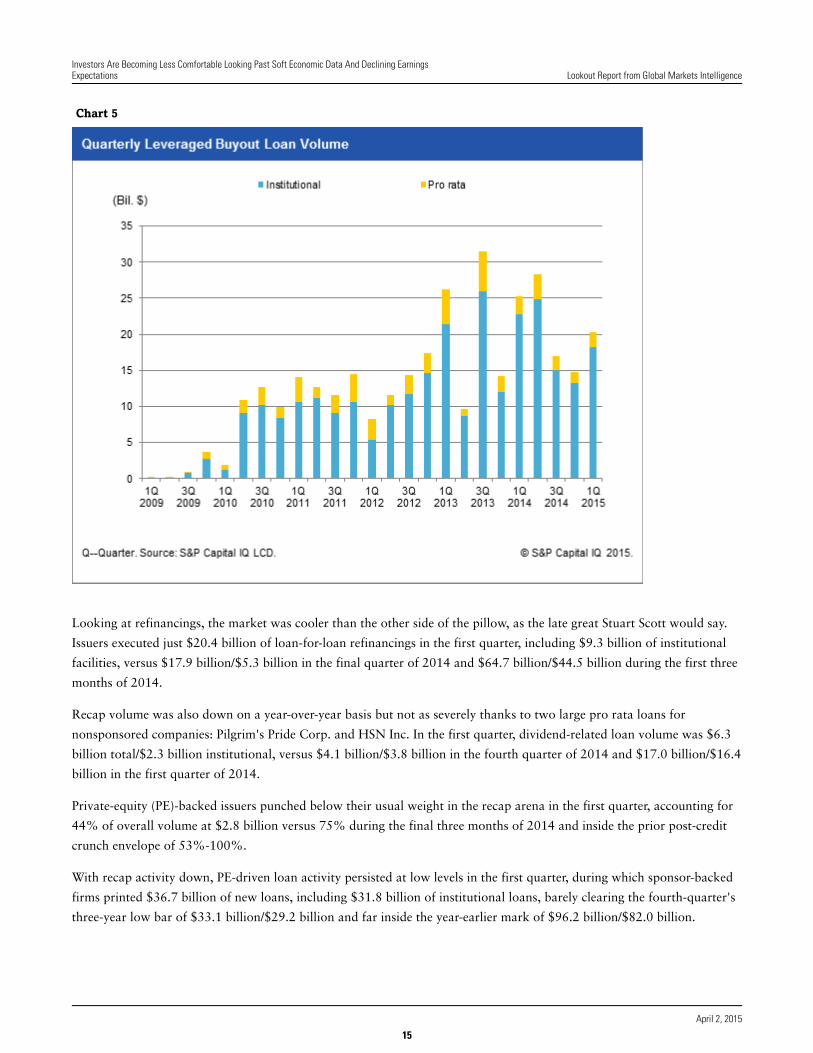
Chart 5
Looking at refinancings, the market was cooler than the other side of the pillow, as the late great Stuart Scott would say.
Issuers executed just $20.4 billion of loan-for-loan refinancings in the first quarter, including $9.3 billion of institutional
facilities, versus $17.9 billion/$5.3 billion in the final quarter of 2014 and $64.7 billion/$44.5 billion during the first three
months of 2014.
Recap volume was also down on a year-over-year basis but not as severely thanks to two large pro rata loans for
nonsponsored companies: Pilgrim's Pride Corp. and HSN Inc. In the first quarter, dividend-related loan volume was $6.3
billion total/$2.3 billion institutional, versus $4.1 billion/$3.8 billion in the fourth quarter of 2014 and $17.0 billion/$16.4
billion in the first quarter of 2014.
Private-equity (PE)-backed issuers punched below their usual weight in the recap arena in the first quarter, accounting for
44% of overall volume at $2.8 billion versus 75% during the final three months of 2014 and inside the prior post-credit
crunch envelope of 53%-100%.
With recap activity down, PE-driven loan activity persisted at low levels in the first quarter, during which sponsor-backed
firms printed $36.7 billion of new loans, including $31.8 billion of institutional loans, barely clearing the fourth-quarter's
three-year low bar of $33.1 billion/$29.2 billion and far inside the year-earlier mark of $96.2 billion/$82.0 billion.
Investors Are Becoming Less Comfortable Looking Past Soft Economic Data And Declining EarningsExpectations Lookout Report from Global Markets Intelligence
15
April 2, 2015

Chart 6
As this implies, sponsors were uncharacteristically reticent in early 2015, accounting for 42.6% of total loan volume.
That's down from 54% in 2014 and is the lowest quarterly figure since the second quarter of 2013 at 43%.
Other first-quarter highlights include:
Universe of outstanding loans: Growth slows
With volume down sharply and repayments running strong, the universe of S&P/LSTA Index loans grew an estimated
$7.6 billion during the first three months of 2015, the shallowest increase since October 2012, and down from a quarterly
average rise of $37.4 billion last year. The amount of Index loans climbed to $838 billion from $830 billion at year-end.
Investors Are Becoming Less Comfortable Looking Past Soft Economic Data And Declining EarningsExpectations Lookout Report from Global Markets Intelligence
16
April 2, 2015

Chart 7
Second-lien: down
Second-lien loans remained out of favor in the first quarter, generating a 1.25% return versus 2.13% for all S&P/LSTA
Index loans. Not coincidentally, new-issue second-lien volume fell to $2.2 billion in the first quarter – the lowest quarterly
figure since the fourth quarter of 2011--from $3.6 billion during the prior three months and $11.7 billion during the
comparable period in 2014.
Investors Are Becoming Less Comfortable Looking Past Soft Economic Data And Declining EarningsExpectations Lookout Report from Global Markets Intelligence
17
April 2, 2015

Chart 8
Repricings: down and out
Unsupportive conditions made spread-shaving virtually impossible in the first quarter. As a result, issuers managed to cut
pricing on a mere $963 million of loans, down from $1.5 billion during the prior period, marking the puniest quarterly
amount since the third quarter of 2011 when the market was rocked by a series of exogenous events.
Investors Are Becoming Less Comfortable Looking Past Soft Economic Data And Declining EarningsExpectations Lookout Report from Global Markets Intelligence
18
April 2, 2015

Chart 9
What's Hot I: Add-ons
In the first quarter, add-on loan volume defied the broader trend by climbing to a record $17.7 billion, including $11.9
billion of institutional tranches, surpassing the fourth-quarter's short-lived mark of $14.9 billion/$8.7 billion.
Investors Are Becoming Less Comfortable Looking Past Soft Economic Data And Declining EarningsExpectations Lookout Report from Global Markets Intelligence
19
April 2, 2015

Chart 10
Flourishing add-on activity is perhaps the exception that proves the rule in today's regulation-constrained new-issue
market. Issuers are keen to tap the market for incremental tranches in order to (1) avoid, at the same time, paying fees and
potentially higher yields to replace existing loans and (2) efficiently raise money from an existing lender group that is
already up to speed on their situation and therefore able to respond quickly.
The lion's share of first-quarter add-on loans, for this reason, financed bolt-on acquisitions.
What's Hot II: 'BB' loans
In the first quarter, the credit quality of the new-issue market improved markedly amid regulatory pressure on arrangers to
tamp down deal leverage and jumbo executions from well-rated corporate issuers. Furthermore, the weak technical
landscape in the fourth quarter and early 2015 discouraged lower-rated issuers from bringing deals to market.
Thus, institutional loans to issuers with at least one foot in 'BB' land--those rated either 'BB-' or higher from Standard &
Poor's Ratings Services or Ba3 or higher from Moody's--accounted for 30% of primary institutional loans. That's up from
23% in 2014 and marks the highest proportion since 2008.
Looking at all loans, including pro rata tranches, the trend is the same. Issuers rated 'BBB' or higher captured 40% of
first-quarter volume, also a 12-year high, versus 31% in 2014.
Investors Are Becoming Less Comfortable Looking Past Soft Economic Data And Declining EarningsExpectations Lookout Report from Global Markets Intelligence
20
April 2, 2015

Chart 11
What's Hot III: Term Loan As
Banks opened their vaults for $10.1 billion of new term loan As (TLAs) in the first quarter versus $8.5 billion in the fourth
quarter. As a percent of all funded term loans, by contrast, TLAs slipped in the first quarter to 15.5%, from 16.4% but
remained at the high-end of the post-credit-crunch band.
Outlook: Cloudy with a chance of rain
Looking ahead, arrangers expect acquisition-driven loan volume to persist at the steady pace of early 2015 with an
emphasis on strategic transactions--both corporate and PE-backed--that pass regulatory muster. As for LBO flow, the
calendar is spotty, arrangers say, for reasons already discussed.
As for opportunistic deal flow, the market's recent rally has not yet produced a revival. The calendar, in fact, continues to
skew heavily to M&A at $41.1 billion total/$33.9 billion acquisition-related as of March 25.
Investors Are Becoming Less Comfortable Looking Past Soft Economic Data And Declining EarningsExpectations Lookout Report from Global Markets Intelligence
21
April 2, 2015

Chart 12
That said, some arrangers say the stars are aligned for a modest comeback in such issuer-friendly deals in the months
ahead. For one thing, the loan calendar remains light as the data above illustrate. For another, the amount of visible
repayments is running strong. As of March 25, Leveraged Commentary and Data tracked a record $39.6 billion of visible
institutional repayments in the offing, up from $21.4 billion at year-end. The Heinz/Kraft tie-up alone is expected to
return nearly $6.4 billion to loan managers' coffers in the months ahead.
Arrangers still see volume in 2015 falling considerably from the $528 billion total in 2014. The annualized pace of the
first quarter, $344 billion, is perhaps a bit draconian. Players see $350 billion-$400 billion, give or take, as a more likely
outcome, though even this would be the lowest total since 2010.
All the same, regulatory pressure on credit multiples and borrower-friendly deals will likely keep recaps and large-cap
public-to-private LBOs in a box.
Europe: A bigger first-quarter bounce
Volume climbed more steeply in Europe than in the U.S. during the first quarter of 2015. Issuers tapped the European
market for €20.4 billion ($23.2 billion) of leveraged loans, up 54% from €13.2 billion ($16.6 billion) in the prior three
months. In the U.S., by comparison, volume is up 29% sequentially. European institutional volume growth, likewise, was
greater than that of the U.S. at 44%--to €12.7 billion ($14.4 billion) from €8.8 billion ($11.0 billion)--versus 30%. (Note
that the dollar sums reflect exchange rates at the times the deals were launched.)
Investors Are Becoming Less Comfortable Looking Past Soft Economic Data And Declining EarningsExpectations Lookout Report from Global Markets Intelligence
22
April 2, 2015

Chart 13
With Europe and America posting sequential increases, trans-Atlantic leveraged loan volume climbed to $104.3 billion
(dollar-equivalent) during the first quarter from $83.1 billion in the fourth quarter of 2014. Still, it lags the year-earlier
comp of $188.3 billion.
Investors Are Becoming Less Comfortable Looking Past Soft Economic Data And Declining EarningsExpectations Lookout Report from Global Markets Intelligence
23
April 2, 2015

Chart 14
Speculative-grade: Quick out of the blocks
Fueled by strong demand from retail investors, the speculative-grade market rallied in the first quarter with the BAML HY
Master Index generating a 2.45% gain in the first quarter. The new-issue market benefited as primary volume jumped to
$90.2 billion from a recent low of $65 billion in the fourth quarter and $74.9 billion during the first three months of
2014.
Investors Are Becoming Less Comfortable Looking Past Soft Economic Data And Declining EarningsExpectations Lookout Report from Global Markets Intelligence
24
April 2, 2015

Chart 15
With both loan and speculative-grade volume up, leveraged finance issuance increased to $176 billion in the first quarter,
from a recent low of $132 billion in the prior three months, but it remained far inside the year-earlier sum of $243 billion.
Contact Information: Steve Miller, Managing Director--Leveraged Commentary And Data,
Follow Steve on Twitter (@millerLCD) for an early look at LCD analysis plus market commentary.
R2P Corporate Bond Monitor
In North America, recent data remains mixed, but signs point to a likely upturn in consumer activity and spending.
Consumer confidence rose to 101.3 in March from 98.8 in February, close to a high of 103.8 that was set in mid-2008,
according to The Conference Board. The rise represented higher expectations stemming from the labor market's continued
strength. Initial claims for U.S. unemployment benefits fell by 9,000 to 282,000 for the week ended March 21, 2015, after
rising by 1,000 in the week ended March 14. The four-week moving average for claims now stands at 297,000 after
decreasing a sizable 7,750 from the previous week.
On a more disappointing note, the March release of the Institute for Supply Management PMI at 51.5 came in below
market expectations of 52.5 and the prior month's 52.9 level. The March manufacturing index result was the weakest seen
since 50.1 in May 2013 and just above the January 2014 weather-induced weakness at 51.8. On a much more positive
note, February U.S. factory goods orders rose 0.2% as opposed to expectations for a decline of 0.4%, breaking the string
Investors Are Becoming Less Comfortable Looking Past Soft Economic Data And Declining EarningsExpectations Lookout Report from Global Markets Intelligence
25
April 2, 2015

of six consecutive monthly declines in place since August 2014.
Eurozone (European Economic and Monetary Union) sentiment is increasing, following the past month's strong data.
Business and consumer confidence has continued its rise for a fourth consecutive month, according to the European
Commission. The economic sentiment indicator rose to 103.9 in March from 102.3 in February, its highest level in nearly
four years, driven by low oil prices, the weaker euro, and the impact of the ECB's quantitative easing program.
The eurozone composite PMI, according to Markit, rose to 54.1 in March from 53.3 in February, representing a
46-month high, of which the services and manufacturing sectors influenced. In addition, the services PMI rose to 54.3
from 53.7, and the manufacturing PMI rose to 51.9 from 51 in February. The readings represented a broad-based upturn
in business activity after the composite PMI showed upticks in each of the previous four months.
For more of our market views and sector credit opinions, please see, "Market Intellect: Fixed-Income Strategy:
Quantitative Easing and a Weaker Euro Boost Eurozone Activity," published March 30, 2015.
Credit markets
Risk-reward profiles, as measured by average Risk-to-Price scores, remained fairly flat in North America in the month
ended March 27, 2015, despite yields rising overall. In general, credit risks remained stable, as measured by the
probability of default, because energy sector improvements offset deterioration in the consumer staples sector following
the past three months of retail sales declines. Market risk, as measured by the bond price volatility, remained stable.
In Europe, risk reward profiles decreased despite fairly stable spread levels overall. As rates are likely to remain low
because of disinflationary pressures and low growth, European yields will likely remain low for some time despite having
seen stronger growth data. Because of financials and consumer staples, credit risk worsened in the month. However, with
the prospect of better business and consumer sentiment and ongoing quantitative easing, we expect probability of default
levels to improve in the coming months. Market risks remained stable.
Table 6
North American Risk-Reward Profiles By Sector*
Scores (%) OAS (bps) PD (%) BP Vol. (%)
Consumer discretionary (5) 7 0.058 (0.046)
Consumer staples (9) 7 0.114 (0.009)
Energy 26 6 (0.132) (0.089)
Financials 5 3 (0.001) 0.043
Health care (2) 2 (0.033) 0.012
Industrials (6) (4) (0.216) (0.003)
Information technology (9) (1) (0.011) (0.018)
Materials (7) 2 (0.017) (0.027)
Telecommunications services (6) 8 0.004 0.010
Utilities (11) 2 0.018 0.006
Average (2) 3 (0.022) (0.012)
*One-month average risk-to-price score and components changes to March 27, 2015. OAS--Option-adjusted spreads. bps--Basis points.
PD--Probability of default. BP Vol.--Bond-price volatility. Source: S&P Capital IQ.
Investors Are Becoming Less Comfortable Looking Past Soft Economic Data And Declining EarningsExpectations Lookout Report from Global Markets Intelligence
26
April 2, 2015

Table 7
Europe Risk-Reward Profiles By Sector*
Scores (%) OAS (bps) PD (%) BP Vol. (%)
Consumer discretionary (8) 4 0.047 (0.016)
Consumer staples 1 2 0.130 0.008
Energy 5 (10) 0.003 (0.008)
Financials (8) 1 0.283 (0.022)
Health care (17) 0 (0.033) (0.003)
Industrials (1) 10 0.055 (0.011)
Information technology (24) (15) 0.012 0.007
Materials (7) 13 0.119 0.036
Telecommunication services 2 3 0.085 (0.007)
Utilites (10) 4 0.055 (0.005)
Average (7) 1 0.076 (0.002)
*One-month average risk-to-price score and components changes to March 27, 2015. OAS--Option-adjusted spreads. bps--Basis points.
PD--Probability of default. BP Vol.--Bond-price volatility. Source: S&P Capital IQ.
Fabrice Jaudi, Vice President--Global Markets Intelligence, [email protected].
Kunaal Vora, Credit Research Analyst, London +44(0)207 176 8317; [email protected].
Capital Market Commentary: IPOs, M&A, And Debt
IPOs
Following the final quarter of 2014, which had 71 U.S. IPOs that raised $14 billion, first-quarter 2015 had a lackluster
performance. Only 30 IPOs were finalized with proceeds of only $4.6 billion. The recent quarter's results also performed
poorly compared with the first quarter of 2014, which had 71 IPOs that raised $11.6 billion. Furthermore, current results
show that this quarter's deal count for IPO underwriting is the slowest, in term of number of offerings, since third-quarter
2012 when 25 IPOs were completed and , the lowest level , based on proceeds, since the third quarter of 2011 when $4.2
billion was raised.
For the first quarter of 2015, health care was the most active sector in terms of deal count with 14 issues followed by
financials with 10 offerings. Meanwhile, information technology and materials only had two IPOs each, and consumer
discretionary and energy had just one apiece.
Three recently priced IPOs have doubled or more from their initial offer price:
• Shares of Spark Therapeutics Inc. have jumped more than 200%;
• Share of Shake Shack Inc. have climbed more than 130%; and
• Tantech Holdings Ltd. has advanced 100%.
Investors Are Becoming Less Comfortable Looking Past Soft Economic Data And Declining EarningsExpectations Lookout Report from Global Markets Intelligence
27
April 2, 2015

Table 8
2015 IPO Performance Year-To-Date
Effective date Issuer
Total transaction value
(mil. $)
Price per
share ($)
Price at latest day
close ($) Change (%)
Jan. 29, 2015 Spark Therapeutics Inc. 161.00 23.00 77.50 236.96
Jan. 29, 2015 Shake Shack Inc. 105.00 21.00 50.05 138.33
March 18, 2015 Tantech Holdings Ltd. 12.80 4.00 8.00 100.00
Jan. 22, 2015 Box Inc. 175.00 14.00 19.75 41.07
Jan. 29, 2015 TRACON Pharmaceuticals Inc. 36.00 10.00 14.04 40.40
Jan. 28, 2015 Entellus Medical Inc. 78.26 17.00 21.90 28.82
Jan. 15, 2015 County Bancorp Inc. 18.59 15.75 19.68 24.95
Jan. 29, 2015 InfraREIT Inc. 460.00 23.00 28.59 24.30
March 10, 2015 Summit Materials Inc. 400.00 18.00 22.15 23.06
Jan. 28, 2015 Flex Pharma Inc. 86.40 16.00 19.60 22.50
March 25, 2015 SolarEdge Technologies Inc. 126.00 18.00 21.93 21.83
Feb. 5, 2015 Columbia Pipeline Partners LP 1,076.66 23.00 27.69 20.39
Feb. 9, 2015 Avenue Financial Holdings Inc. 27.50 11.00 12.51 13.73
March 18, 2015 National Commerce Corp. 33.15 19.50 21.95 12.56
Feb. 11, 2015 Inovalon Holdings Inc. 600.00 27.00 30.21 11.89
Feb. 11, 2015 Invitae Corp. 101.60 16.00 16.76 4.75
March 26, 2015 Jernigan Capital Inc. 100.00 20.00 20.75 3.75
March 17, 2015 Goldman Sachs BDC Inc. 120.00 20.00 20.66 3.30
Feb. 12, 2015 Great Ajax Corp. 71.25 14.25 14.53 1.96
March 26, 2015 Calamos Dynamic Convertible andIncome Fund
555.00 25.00 25.01 0.04
Jan. 27, 2015 Ascendis Pharma A/S 108.00 18.00 17.35 (3.61)
Jan. 26, 2015 Zosano Pharma Corp. 49.50 11.00 10.11 (8.09)
Jan. 15, 2015 Patriot National Inc. 116.42 14.00 12.70 (9.29)
Feb. 17, 2015 Inotek Pharmaceuticals Corp. 40.00 6.00 5.42 (9.67)
Jan. 29, 2015 Avinger Inc. 65.00 13.00 11.09 (14.69)
March 5, 2015 MaxPoint Interactive Inc. 74.75 11.50 9.58 (16.70)
Feb. 4, 2015 Nexvet Biopharma Public Ltd. Co. 40.00 10.00 8.03 (19.70)
Feb. 13, 2015 Bellerophon Therapeutics LLC 60.00 12.00 9.18 (23.50)
Jan. 28, 2015 Presbia PLC 41.67 10.00 7.39 (26.10)
March 19, 2015 SteadyMed Ltd. 39.95 8.50 2.14 (74.82)
Source: S&P Capital IQ.
M&A
U.S. M&A activity during the first quarter was dominated by health care deals as more than $92 billion of $411 billion in
announced deals came from that sector. That's up from $58 billion in announced U.S. health care deals in the initial
quarter of 2014. In addition, according to S&P Capital IQ health care had a record high number of cross-border M&A
deals in 2014 with 669 transactions, up from 545 deals in 2013. This broke the previous record of 639 deals in 2007.
Several media outlets have reported that European drug companies Shire PLC, AstraZeneca PLC, and Roche Holding AG
are considering buying California-based BioMarin Pharmaceutical Inc. In the private realm, Apax Partners LLP, Advent
International Corp., and Barings Asia are reportedly seeking an acquisition in Indian health care facilities firm MEDall
Investors Are Becoming Less Comfortable Looking Past Soft Economic Data And Declining EarningsExpectations Lookout Report from Global Markets Intelligence
28
April 2, 2015

Medical Services Karnataka Pvt. Ltd. from Peepul Capital LLC.
Chart 16
Debt
The likely outlook for forthcoming fixed-income security offerings appears to be on a two-way track if indications hold
true based on recent Committee on Uniform Security Identification Procedures (CUSIP) requests. For example, based on a
more than 50% jump in the number of security identifiers for upcoming municipal bond offerings in the first quarter
compared with the year earlier, the number of underwritings has markedly increased. In contrast, five of six asset
classes--excluding municipal bonds--the number of CUSIP orders has slipped to 3,922 from 4,000 a year earlier, a 2% slip
(see table 9). Therefore, such asset groups as domestic corporate debt and private placement umber domestic debt may see
fewer issues ahead based on recent CUSIP indications.
Investors Are Becoming Less Comfortable Looking Past Soft Economic Data And Declining EarningsExpectations Lookout Report from Global Markets Intelligence
29
April 2, 2015
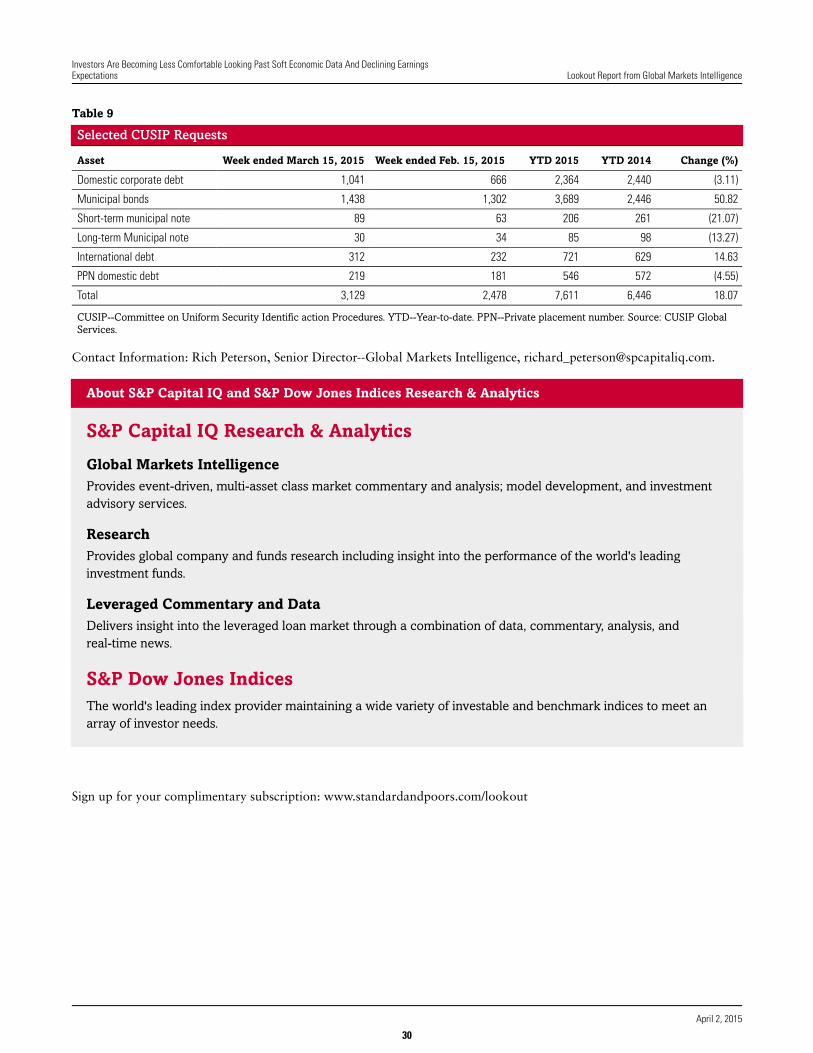
Table 9
Selected CUSIP Requests
Asset Week ended March 15, 2015 Week ended Feb. 15, 2015 YTD 2015 YTD 2014 Change (%)
Domestic corporate debt 1,041 666 2,364 2,440 (3.11)
Municipal bonds 1,438 1,302 3,689 2,446 50.82
Short-term municipal note 89 63 206 261 (21.07)
Long-term Municipal note 30 34 85 98 (13.27)
International debt 312 232 721 629 14.63
PPN domestic debt 219 181 546 572 (4.55)
Total 3,129 2,478 7,611 6,446 18.07
CUSIP--Committee on Uniform Security Identific action Procedures. YTD--Year-to-date. PPN--Private placement number. Source: CUSIP Global
Services.
Contact Information: Rich Peterson, Senior Director--Global Markets Intelligence, [email protected].
About S&P Capital IQ and S&P Dow Jones Indices Research & Analytics
S&P Capital IQ Research & Analytics
Global Markets Intelligence
Provides event-driven, multi-asset class market commentary and analysis; model development, and investment
advisory services.
Research
Provides global company and funds research including insight into the performance of the world's leading
investment funds.
Leveraged Commentary and Data
Delivers insight into the leveraged loan market through a combination of data, commentary, analysis, and
real-time news.
S&P Dow Jones Indices
The world's leading index provider maintaining a wide variety of investable and benchmark indices to meet an
array of investor needs.
Sign up for your complimentary subscription: www.standardandpoors.com/lookout
Investors Are Becoming Less Comfortable Looking Past Soft Economic Data And Declining EarningsExpectations Lookout Report from Global Markets Intelligence
30
April 2, 2015