loose stator core diagnostic methods · [email protected] mladen sasic . iris power ....
TRANSCRIPT
1
LOOSE STATOR CORE DIAGNOSTIC METHODS
Ozren Husnjak Ozren Oreskovic Veski Ltd Veski Ltd [email protected] [email protected]
Darinko Stich Zlatko Matic DEM – Dravske elektrarne Maribor Independent Consultant [email protected] [email protected]
Mladen Sasic Iris Power [email protected]
SUMMARY
Increased partial discharge was observed on a vertical, 25 MW, Kaplan, umbrella type unit. The decision was made to perform additional diagnostic measurements. A detailed slow-roll air gap and vibration measurements were performed and the loose stator core problem was detected. The loose core vibrations were related to the increased partial discharge.
First, slow-roll air gap measurement was performed with two, temporary mounted, air-gap sensors. One sensor was mounted on the stator core and the other on the rotor pole. Machine was rotated manually on lift oil with the sensors in the lower (first measurement) and upper (second measurement) plane of the stator core. The results obtained were the rotor and stator shapes in the measurement planes.
Second, vibration measurements in all relevant regimes were performed. Besides sensors being mounted on the bearings, one accelerometer was mounted on the stator frame, exactly at the joint between the two frame segments. The unit’s frame / core consists of three segments, in total. As indicated by the stator frame vibrations, the stator frame / core system passed through resonance during core temperature increase.
The main reason for the resonance was in the temperature dependent structure stiffness. The loose core segments were mutually loosely coupled when the core was cold having lower stiffness. As the core temperature increased they formed a more and more rigid ‘ring-shaped’ structure shifting the natural frequency of the system to the higher frequencies. This was detected from the stator frame vibrational response.
All of the measurements were performed using the CoDiS-PDS portable diagnostic system measurement device.
Additional vibration measurements regarding the stator frame and core are proposed with the emphasis on establishing vibrational modes. This should give an idea how to approach the repair process.
Keywords: Umbrella Unit, Loose Stator Core, Slow-Roll Air Gap Measurements, Segmented Stator, Partial Discharge, Core Vibrations, Frame Vibrations
INTRODUCTION
Initially, on a ~25 MW, three segmented stator unit, partial discharge (PD) measurements were performed. They showed an increasing trend indicating that the stator windings isolation system was showing signs of deterioration.
The decision was made to perform more detailed measurements to help find the root-cause of the problem. Among other – to measure the stator and rotor shapes. This was done for a unit in ‘cold’ state, after the

2
overhaul. The measurement was performed in two planes: one near the bottom and the other near the top of the stator core. Two magnetically attachable air gap sensors were used. The results showed that the difference between maximum and minimum stator air gap was (Max-Min) ~11.5 % in the lower measurement plane and (Max-Min) ~22.1 % in the upper measurement plane. For rotor, this was ~3.9 % in the lower measurement plane and ~7.9 % in the upper measurement plane.
Obviously, there are additional differences in the shape(s) – which are temperature dependant. So, it’s recommended to perform additional shape measurements for the unit with increased temperature (‘hot’) with the same procedure.
It was decided that during the ‘normal’ vibration measurements following the overhaul – additionally one sensor (accelerometer) be placed on the stator frame (in the radial direction) at the position of stator segment joints. The measurements showed there were resonance issues with the stator and it was decided to perform even more detailed vibration measurements on stator core and frame.
For this reason, stator cooling units were removed from the stator frame and 9 sensors placed on the stator: 1 on the stator frame and 8 on the stator core. The results confirmed that the system passed through resonance conditions during unit’s thermal stabilization. The results of these measurements were obtained after the writing of the article summary and are an addition to the methodology of stator loose core detection.
MEASUREMENT LAYOUT(S)
The partial discharge (PD) measurement layout is indicated in Fig. 1.
Fig. 1 Partial discharge measurement equipment.
On this unit – PD is monitored on-line since 2014. PD is presented as a short voltage impulse. Due to its time duration it’s possible to see such an impulse at several hundred MHz. From the high voltage line (bus bar) it’s possible to capture this high-frequency signal with a kind of high-frequency ‘sieve’. In its most simple form it is a simple circuit made from the capacitor and resistor (Fig. 2). Since the voltages at the terminals are high it is important that the capacitor is able to withstand it. At the same time it must have superior quality, since it’s connected to the vital part of the generator.
Fig. 2 PD measurement circuit.
The voltage signal from PD has a very small amplitude and there is a good chance it will be buried in electrical noise. It is, therefore, important to distinguish whether or not the signal is PD from the generator
High voltage bus bar
Epoxy Mica Capacitor (EMC)
signal cabel
measurement instrument

3
windings or electrical noise from the surroundings. For this reason, two capacitors per phase are used as shown on Fig. 3.
Fig. 3 Separation of PD signal from the electrical noise from the surroundings (IEC/TS 60034-27-2). Two capacitors per phase are used.
Capacitors related to a single phase are connected at different positions on the bar. The measuring instrument has two measurement channels. If the signal is detected on the capacitor closer to the generator before it's detected on the other one – that means it's related to the generator PD and not environmental electrical noise. This is the recommended way of separating signal from the noise and is suggested by the IEC/TS 60034-27-2 standard. The same standard correlates the part of the generator voltage signal at which the PD occurs to the part of the insulation system where the PD is occurring.
The measurement lasts a determined time during which the instrument records the all of the PD impulses it's able to detect. After that – the impulses are sorted by the individual signal levels and number of impulses in a given voltage range. As a base for the analysis – the system gives out the Qm value which shows the voltage of the impulses occurring 10 times per second.
Fig. 4 The number of PD impulses / s [pps] as a function of impulse voltage [mV].
The PD monitoring system installed in this power plant is produced by Iris Power which has more than 10000 references. Each year a table is produced by Iris Power which shows a statistics of the PD world-wide. For hydro units with 10... 12 kV the following table is relevant:
25 % of all generators on the world has Qm smaller than 41
50 % of all generators on the world has Qm smaller than 89
75 % of all generators on the world has Qm smaller than 196
90 % of all generators on the world has Qm smaller than 385
95 % of all generators on the world has Qm smaller than 638
Table 1 Qm(mV) for hydro generators (10... 12 kV).

4
For example, if the measurements show a Qm = 350, this means, that 90 % of similar generators which have PD measurements have smaller PD measured. This does not mean that the generator will experience malfunction in a short time period but is a reason to try and detect the root cause of the PD.
For a more serious analysis, the above table is 'sub-divided' depending on the generator age, insulation type, manufacturer.
Schematic overview of the sensor positions is indicated on Fig. 5.
Measurement and rotation direction. Direction of water indicated. 0° - direction X, 90° - direction Y.
Stator segment joints. Direction of water indicated. Measurements from 2017. and 2018. are indicated.
Fig. 5 Sensor positions. Schematic overview. Top view.
The left image shows bearing plane sensor directions (0° and 90°) and the right shows the positions of the three segmented stator joints.
Three different measurement layouts were established.
The first measurement layout consisted of 5 sensors: diagnostic trigger, 2 proximity probes and 2 magnetically attachable air-gap sensors. All are shown on Fig. 6 along with removed top covers.
Covers removed to perform the measurements.
Diagnostic trigger and two perpendicular proximity probes above generator guide
bearing.
Cables from air gap sensors visible. One sensor is on the rotor pole and the
other is on the stator core.
Fig. 6 Slow-roll stator / rotor shape measurements.
As it can be seen from Fig. 6, only a couple of covers had to be removed to perform the measurements. This makes the measurements easy to do during the overhaul (the best time would be when the overhaul is nearly finished or before it even started if corrections are to be applied during the overhaul).
The diagnostic trigger and proximity probes were located above the generator guide bearing. The trigger was helpful to determine the start / end of one full rotor revolution. The proximity sensors were used to
90°
Direction of water
180°
0°
Direction of water
measurement 03.03.2018.
measurement 31.01.2017.

5
determine the radial shaft movement in the plane of measurement. The air gap sensors were placed in such a way that one of the sensors was on one of the rotor poles and the other on the stator core. The sensor placed on the rotor pole measured the stator shape while the sensor placed on the stator core measured the rotor shape. The layout was used in two measurement planes to determine the similarity / difference in shape.
The second measurement layout consisted of 13 sensors: 1 diagnostic trigger, 6 proximity probes (positioned radially in the generator, thrust and turbine bearing planes), 6 absolute vibration sensors (2 on the generator housing, positioned radially; 2 on the turbine housing, positioned radially; 1 on the thrust bearing, positioned axially; 1 on the stator frame, at the segment joint, positioned radially). The most important phenomena was recorded by the sensor positioned at the stator segments joint and it’s shown on the right most part of Fig. 7, along with the sensors in the generator and turbine bearing planes.
Proximity probes installed below the generator bearing. They’re positioned
next to the MCM system probes.
Proximity probes installed on the turbine bearing. Next to the MCM system
probes. Accelerometer seen as well.
Accelerometer placed on the stator joint in radial direction
Fig. 7 Typical sensor layout for the second measurements.
The third measurement layout consisted of 10 sensors: 1 diagnostic trigger and 9 accelerometers (or velocity meters). One accelerometer was placed on one of the stator frame at the segment joint, similar to the previous measurements but at the different joint (check Fig. 5). The accelerometers / velocity meters were placed on the stator core at different positions on the left and right side of the selected segment joint.
Accelerometer placed on the stator joint in radial direction
Accelerometer placed on the stator core, in the middle of the, temporarily
removed, cooling unit
Velocity meter placed on the stator core, at the right side of the stator joint,
in the middle of the core (up-down)
Fig. 8 Typical accelerometer / velocity meter sensors installed during the measurement.

6
All of the measurements were performed using the CoDiS-PDS1 portable diagnostic system measurement device.
In the following paragraph, the most important results are shown.
RESULTS
The first indication to the existence of the problem were the PD measurements. When the unit was assembled, and during the first PD measurements in 2014 it was already known that there are 90 % similar units with smaller PD levels. By monitoring (trending) the PD through Qm it was shown that in the L3 phase there is an increasing trend. By 2018 the values have increased ~3 times.
Phase 1 Phase 2
Phase 3
Fig. 9 Measured Qm [mV] for all three phases. Qm+ (green), Qm- (blue). Phase 3 Qm values have increased ~3x from 2014.
So, PD indicated there was a reason to get concerned and at this stage other measurement techniques were used to help pin-point the root cause2. For this reason, detailed stator/rotor shape and vibration measurements were performed. The stator/rotor shape was measured in two planes. First measurement plane was near the bottom of the stator core and the second near the top of the core. The unit was rotated manually on lift oil and two revolutions were performed for one measurement plane. Waveforms from the measurements in the upper plane are shown on Fig. 10.
1 CoDiS-PDS = Computerized Diagnostic System – Portable Diagnostic System which is a portable version of the MCM system produced by Veski Ltd ([email protected])
2 The power plant had the vibration monitoring installed but only on the bearings (in 2017) and, additionally, at the segment joint (in 2018) but these were not used for the measurements. Instead, sensors from the CoDiS-PDS kit were used

7
Upper measurement plane, two full rotations. Diagnostic trigger (gray), sensor on rotor – giving stator shape (blue), sensor on stator – giving rotor shape
(green).
Upper measurement plane, zoom in to waveform data. Noise is ~50 µm. The arrow
points to the location of the stator joints.
Fig. 10 Waveforms obtained during measurement.
From the figure – it can be seen that:
two revolutions were performed – three diagnostic trigger spikes (gray) are visible
the rotational speed was not uniform (the rotor started from zero speed and slowly accelerated)
the measurements are repeatable (comparing the first and the second rotation)
the noise is ~50 µm
From the waveforms, knowing the starting angular position of the air gap sensor on rotor one can obtain the stator shape in polar diagram. Knowing the angular position of the air gap sensor on stator and the number of the pole which passes first near the sensor on stator after the trigger, one is able to determine rotor shape by the pole number. All of the results are shown on Fig. 11.
Stator (blue) and rotor (green) shape measured in a plane at the bottom of the stator core.
Stator (blue) and rotor (green) shape measured in a plane at the top of the stator core.
Rotor shape (air gap) by the pole numbers. Lower plane – black, upper plane – red.
Fig. 11 Stator and rotor shapes in two measurement planes.
From Fig. 11 it can be clearly seen that the stator shape is, approximately, elliptical. Also, it can be seen that the segmented stator was not assembled exactly round as there exist abrupt changes in the shape exactly at the angles where the stator segments are attached (stator joints). This is especially visible at the ~60° angle (from the direction of water in the direction of rotation) on Fig. 11 measured at the top of the stator core. Also, in between joints, there exist relatively large deviations in stator shape. The largest deviation is (Max – Min) ~(12.2 – 9.9) mm ~2.3 mm which is ~22.1 % (regarding the average air gap in this plane, which is 10.407 mm). The fact that the stator is, mostly, ‘elliptical’ reduces the unfavorable Unbalanced Magnetic Pull effect3. The assembly has a direct influence on the entire stator stiffness and its natural frequency as it will be seen from the vibration measurements.
Regarding the rotor shape, using the numbers shown on Fig. 11 it was calculated that the deviation from round shape is ~3.9% in the lower and ~7.1% in the upper stator plane. These numbers are acceptable.
3 Unbalanced Magnetic Pull effect exists if the rotor and stator axes don't coincide. Upon excitation, the rotor gets pulled to the stator in the direction of smallest air gap.
0°
90°
180°
270°
0°
90°
180°
270°

8
It is, however, more important to notice the existence of a rotor ‘zone’ which covers ~9 poles (from poles numbered 46-48 and 1-6) which are ~0.5 mm more prominent than the rest of the rotor. They are, in fact, related to the magnetic unbalance as established from the vibration measurements and shown in the next paragraph.
After these measurements were performed, it was time to measure the vibrations after the overhaul. So, as explained, beside ‘typical’ measurement layout with sensors positioned radially in the generator and turbine bearing planes, it was decided to add one additional sensor at the stator joint, opposite to the water direction (see Fig. 5 and Fig. 7) – in the radial direction.
The operating regimes covered were:
run-up and rotation on nominal speed (125 rpm), excitation off
~12:07 h excitation on
~12:21 h rotational speed change with excitation on
run-down
~12:35 h run-up, excitation on, synchronization
25% load (7 MW) for ~10 minutes
50% load (12 MW) for ~10 minutes
75% load (19 MW) for ~10 minutes
100% load (25 MW) from 13:07 h to 14:02 h
load decrease
rotational speed increase to ~171.5 rpm (excitation off)
run-down without brakes applied
They are shown on Fig. 12 and were taken from the power plant SCADA system.
Fig. 12 Process parameters from SCADA system. Active power – black (first Y axis), rotational speed – red (second Y axis), reactive power – green (second Y axis), excitation current – blue (third Y axis).
It is important to note that while the regimes were changing up to ~13:10 h, after that time they remained unchanged from (~13:10 h to ~14:00 h). The unit operated at ~25 MW with small amount of reactive energy (practically zero).
From the vibration measurements, one important quantity determined from the proximity probes (measuring shaft radial movement) is the ‘statical’ shaft position which is just the average value (distance) of the signal from the probe. This is the position (‘DC’ part) around which the shaft vibrates (‘AC’ part). If stator and rotor axes don’t coincide there will be a visible (sometimes significant) change in the statical shaft position in the radial direction due to rotor movement in the direction of the smallest air gap – when the excitation is on. In this case, due to the almost elliptical stator shape, the statical position doesn’t change significantly. On excitation it’s ~30 µm, mostly in the Y direction (sensor at 90°) (Fig. 5).
Also, when comparing the vibrations (‘AC’ part) – one can see the difference between the vibration vectors (amplitudes and phases) at 1x rotational frequency before and after excitation. Both ‘DC’ and ‘AC’ parts are shown as shaft centerline + synthesized orbit (from 1x rotating frequency) on Fig. 13 (outermost circle has a radius of 50 µm). On the same figure, also vibration vectors (amplitudes + phases) in different regimes (mechanical rotation on nominal speed, unexcited and excited unit are shown).

9
TOP: Shaft centerline and 1x synthesized orbit for unit on nominal speed, no excitation
BOTTOM: Shaft centerline and 1x synthesized orbit for unit on nominal speed, excited
Outer circle radius (left side of the figure) is 50 µm.
Vibration vectors (Ampl. & Ph. at 1x)
Gray: nominal speed, no excitation
Black: nominal speed, excited
Black dotted line: difference between excited and no excitation
Fig. 13 Generator bearing – shaft centerline + synthesized orbit data. 'Statical' part of the orbit is included into the plot, as seen from bottom orbit on the left side of the plot. On the right side, vibration vectors are shown as is the change with
excitation.
So, there is some amount of magnetic unbalance but, generally, the vibrations are not large and the unit operates in zone A (according to ISO 7919-5).
The most indicative sensor pointing out the vibration related problems was the accelerometer located at the stator frame at the position of stator joints (Fig. 7).
To understand the issues better, the most important temperature trends are shown on Fig. 14. These are the bearing temperature trends, stator core and winding temperature trends.
Fig. 14 Temperatures [°C]: Black – turbine bearing, red – stator core, green – thrust bearing, blue – generator bearing, brown – windings.
The Root Mean Square (RMS) value of vibrational velocity for the accelerometer on stator frame joint is given on Fig. 15.

10
Fig. 15 The RMS value of vibrational velocity during the measurements.
From this figure, it can be clearly seen that in mechanical rotation, no excitation (up to ~12:07 h) the overall (RMS) vibrations are, practically zero. At 12:07 h the unit was excited and it was then that the stator core started vibrating, due to magnetostriction4. Again afer synchronization and load increase (around ~12:35 h) one can clearly see vibrations increasing after each load increase (compare Fig. 12 and Fig. 18). This is due to the increased forces (which are due to the current through windings increase) between the two windings. The excitation frequency is 100 Hz.
As it was already mentioned, the regime remained unchanged from ~13:10 h to ~14:00 h. This means that the amplitudes of the excitation forces (and, of course, the frequency) remain unchanged in this time period. But, from the RMS of vibrations (Fig. 15), it can clearly be seen that in this period, the vibrations are, at first, slowly decreasing and then, around 13:30 h they start increasing again and pass through a maximum value beggining to decrease again. Since the excitation forces remain the same, the vibration should remain the same if the mechanical characteristics (stiffnesses) of the construction remain the same. Therefore, one can conclude that something has changed in the construction and, based on the dynamics of the process it’s related to the temperature dynamics (Fig. 14).
During the measurements, the values processed from the waveform data were always trended into the measurement files but the measurement system also enabled for ‘raw’ (original waveform) data to be stored. This was done at certain points in time and the trigger waveform and vibrational velocity waveforms are shown on Fig. 16 (TOP) and spectra (BOTTOM).
at 13:10:22 h at 13:43:36 h at 13:55:06 h
Waveform: Y scale ±20 mm/s
Spectra: Y scale 0-15 mm/s (RMS amplitudes shown)
Fig. 16 Waveforms and spectra at noted times.
From the waveforms and spectra it can be clearly seen how the amplitude on 100 Hz increases, reaches maximum value, then decreases. In fact, the most important contribution to the overall (RMS) – Fig. 15 value is that from 100 Hz which means that one can, practically, look at the RMS plot as an 100 Hz amplitude RMS plot. From the waveforms, one sees that the phase of vibrations relative to trigger changes for 180°. This behaviour is typical for vibrations in a resonance. At any given point in time, the
4This is a property of ferromagnetic materials due to which the materials change their shape or dimensions when in magnetic field.

11
most dominant frequency component was that on 100 Hz, although from spectra and waveform data it can also be seen that there exist higher harmonics too.
Currently, there is no accepted standard5 for the allowed vibration amplitudes on the stator frame / core but, according to IREQ/ Hydro Quebec recommendation, the limit for the cores with rigid support (Fig. 17) for the core peak-to-peak displacements would be around 30 µm (amplitudes) which would lead to ~6.4 mm/s amplitude RMS on 100 Hz
Fig. 17 IREQ / Hydro Quebec recommendations for highest stator core vibrations based on Cigre article from 1970.
The measured values were up to ~12.5 mm/s but this was on stator frame and they’re certainly higher on the core.
To determine how high they really are and to establish vibration shapes, new measurements were proposed with multiple sensors layed out on stator core on both sides of one on frame at the stator segment joint (similar to the previous measurements).
Additionally, the measurements were configured in such a way as to process and trend the 48x, 96x and 144x harmonics (corresponding to 48*125 rpm/60 = 100 Hz, 200 Hz, 300 Hz; 48 = number of poles, 125 rpm = unit’s rotational speed) of the rotational frequency. In other words, to trend the amplitude RMS of the peaks of spectra but also to trend the phases.
These measurements were performed with the stator cooling units temporarily removed from the stator frame in the zones on one and the other side of the stator segment joints to enable access to the stator core.
The sensors were positioned (schematically) like this (Fig. 18):
Fig. 18 Gray: accelerometer at the stator frame (on stator joint), red: sensors on stator core. All sensors measuring radially. Side view of the stator core.
So, 1 sensor was placed on the stator joint and the other 8 on the stator core at different positions in vertical and horizontal directions. The regimes covered are shown on Fig. 19.
5 At the time of writing this article, the latest draft of IEC 60034-33 contains the recommended 30 µm vibration limit
stator segments joint

12
Fig. 19 Process values from SCADA system. Black – active power, red – reactive power, green – excitation current, blue – stator current.
Regarding the temperatures, they are shown on Fig. 20.
Fig. 20 Temperature trends. Black – inlet air, red – generator space, green – stator core, blue – outlet air, brown – winding temperature.
The vibration response (RMS, 48x harmonic amplitude RMS and 48x harmonic phase) is shown on Fig. 21.

13
Fig. 21 TOP: RMS of vibrational velocity. MIDDLE: 48x harmonic amplitude RMS. BOTTOM: 48x harmonic phase.
Comparing Fig. 15 and Fig. 21 it can be seen there are similarities in vibrational behaviours. The maximum vibrations are noticed around ~43°C which is somewhat higher than the temperature at which they occured on 30.01.2017. but the vibrational behaviour shows a similar trend. After approximately half an hour the stator core temperature increases for 5°C and the vibrations decrease rapidly which is a sign that the natural frequency moved above 100 Hz.
From the trends, it is clearly seen that the vibrations are dominantly occuring on 100 Hz frequency (48x harmonic of rotational frequency) which is the frequency at which the magnetostrictive and electromagnetic forces in the windings are exciting the construction.
The resonant response time period of the stator frame and core is clearly seen as the sharp and large changes in vibration amplitudes and phases on 100 Hz frequency. This is due to the fact that there are changes in the stator frame and core vibration shapes when the system passes through resonant response.
The other thing worth mentioning is the comparison of the vibrational response from the 2017. to the 2018. measurements. On Fig. 15 the response on stator frame joint opposite to the water direction (see also Fig. 5 and Fig. 7) is shown and on Fig. 21 the response on stator frame joint at the position marked with red circle (60° from the water direction opposite to the rotation direction) – black full line (marked with Any0 on the plot, and with AV000 on the Fig. 18).
It can be clearly seen that there are significant differences between the two trends. This is a certain sign that the vibrational circumstances are not the same on two different stator joints.
14
It is possible that there is a position on the stator core on which the vibrations are larger than 31 mm/s which is the largest measured value on 03.03.2018. But, to evaluate the vibrational state and detect the root-cause the detailed identification of vibrations on different radial positions and stator core height is not necessary.
The presented results are enough to evaluate the core as completely unacceptable and unsafe for the stator winding isolation.
That’s why the most important result in the following analysis will be the identification of the root cause of the current state and the definition of the procedures to rectify it or, at least, to significantly improve the vibrational state.
The largest vibrations are visible on the stator core on the right side of the stator joint (sensor AV007, marked with Any7 on Fig. 21). At that position the vibration amplitudes reach extremly large values (up to 31 mm/s) when the stator core temperature is 43°C.
A sure sign that the system passes through resonant state is the abrupt change in the vibration phases. This change is the most evident when the largest vibrations on position 7 (stator core on the right side of the joint, at the middle).
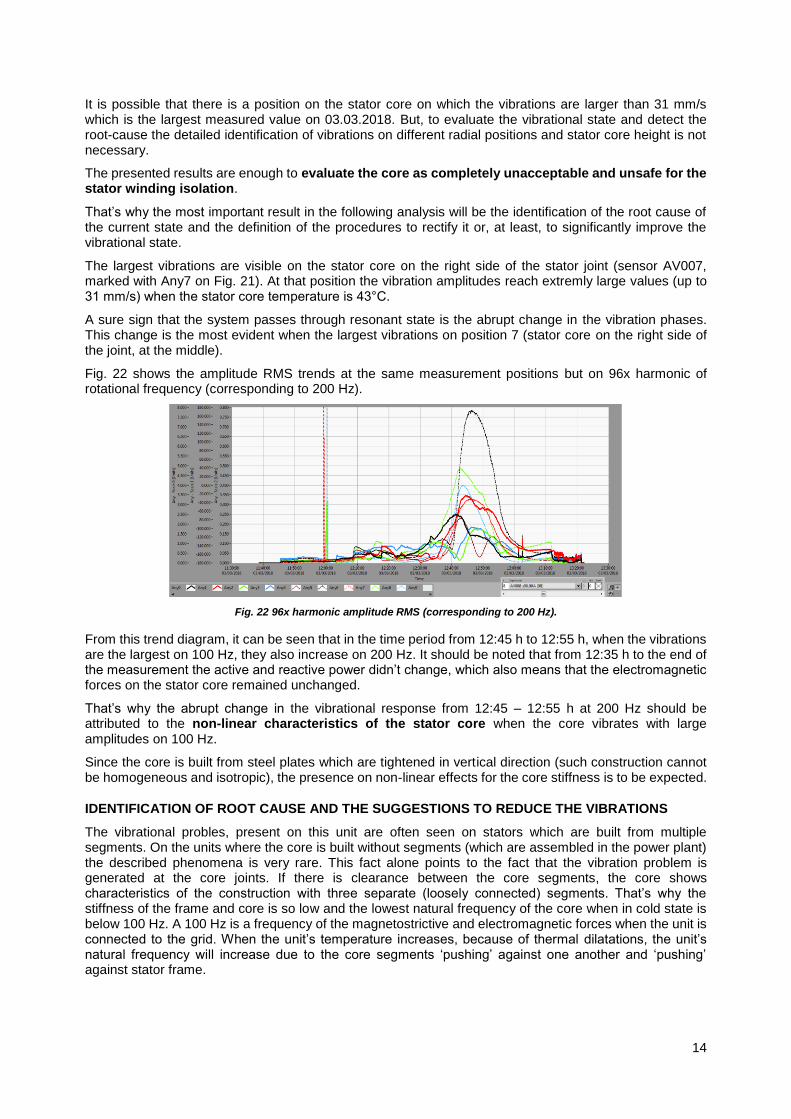
Fig. 22 shows the amplitude RMS trends at the same measurement positions but on 96x harmonic of rotational frequency (corresponding to 200 Hz).
Fig. 22 96x harmonic amplitude RMS (corresponding to 200 Hz).
From this trend diagram, it can be seen that in the time period from 12:45 h to 12:55 h, when the vibrations are the largest on 100 Hz, they also increase on 200 Hz. It should be noted that from 12:35 h to the end of the measurement the active and reactive power didn’t change, which also means that the electromagnetic forces on the stator core remained unchanged.
That’s why the abrupt change in the vibrational response from 12:45 – 12:55 h at 200 Hz should be attributed to the non-linear characteristics of the stator core when the core vibrates with large amplitudes on 100 Hz.
Since the core is built from steel plates which are tightened in vertical direction (such construction cannot be homogeneous and isotropic), the presence on non-linear effects for the core stiffness is to be expected.
IDENTIFICATION OF ROOT CAUSE AND THE SUGGESTIONS TO REDUCE THE VIBRATIONS
The vibrational probles, present on this unit are often seen on stators which are built from multiple segments. On the units where the core is built without segments (which are assembled in the power plant) the described phenomena is very rare. This fact alone points to the fact that the vibration problem is generated at the core joints. If there is clearance between the core segments, the core shows characteristics of the construction with three separate (loosely connected) segments. That’s why the stiffness of the frame and core is so low and the lowest natural frequency of the core when in cold state is below 100 Hz. A 100 Hz is a frequency of the magnetostrictive and electromagnetic forces when the unit is connected to the grid. When the unit’s temperature increases, because of thermal dilatations, the unit’s natural frequency will increase due to the core segments ‘pushing’ against one another and ‘pushing’ against stator frame.
15
If, during this temperature increase process, the natural frequency increases and is near 100 Hz, the vibrations will increase further. Only after additional temperature rise, the natural frequency exceeds 100 Hz and the vibrations decrease. This is exactly the effect present for this unit.
Additional methods to test how the core segments are expanding during the temperature increase would include the air gap measurements. One method would be to install two air gap sensors on stator (under 90°) and one on the rotor and, with the help of the diagnostic trigger and synchronized data acquisition obtain the true stator shape. The sensor on the rotor would give the shape influenced by vibrations, but the sensors on the stator are necessary to compensate for the influence of the vibrations thereby obtaining true stator shape.
The second method would be to make use of the ‘classical’ air gap measurements layout with 4 (or 8 or more) sensors glued to the stator core. The methodology is to determine average air gap on each sensor (from all poles) during the temperature increase. In this fashion one can detect the time at which the core segments would begin to ‘push’ against one another. While the segments are loosely coupled, the core thermal dilatations will be mostly tangential until the segments are connected. After this, the thermal dilatations will be in radial direction. This will be seen from the air gap average value.
So, generally, if the air gap sensors are installed in a power plant, it’s just a matter of connecting them to the CoDiS-PDS portable acquisition device and performing appropriate analyses.
Anyway, the most probable cause to the vibration instability for this unit is a loosely coupled stator core due to too large clearance in the stator core segments. It is here that one should search for the solution to the problem.
Since the vibrations are large and that they appear after one hour of operation on maximum load – the vibrational problem must be overviewed as critical. This state must be repaired because the windings will, most certainly fail due to deteriorated winding isolation system.
CONCLUSION
It was suggested to the power plant personnel to perform measurements of clearance between stator core segments. According to these results, it will be necessary to disassemble the stator segments (after windings next to the joints have been disassembled) and grind the frame plates in such a way as to compensate for the clearance between stator core segments.
Until such a procedure is performed it is advisable to conduct measures to reduce core vibrations by regulating active and reactive power during temperature increase in combination with stator cooling water flow regulation to speed up the heating process which will ensure that the system passes through resonance as fast as possible.
REFERENCES
[1] Mechanical vibration – Evaluation of machine vibration by measurements on non-rotating parts – Part 5: Machine sets in hydraulic power generating and pumping plants, ISO 10816-5, 2000.
[2] Mechanical vibration – Evaluation of machine vibration by measurements on rotating shafts – Part 5: Machine sets in hydraulic power generating and pumping plants, ISO 7919-5, 2005.
[3] Mechanical vibration -- Measurement and evaluation of machine vibration -- Part 1: General guidelines, ISO 20816-1, 2016.
[4] Hydroelectric Turbine Generator Units - Guide for Erection Tolerances and Shaft System Alignment, Part V, Canadian Electrical Association (CEA), 1989, rev. 1998
[5] C. M. Harris, A. G. Piersol: Harris shock and vibration handbook, McGraw Hill, 2002
AUTHOR BIOGRAPHIES
Ozren Husnjak
Education: Master of Science at Department of Physics, Faculty of Science in Zagreb

16
Working experience: Four years (2002.- 2006.) employed as an assistant at Department of Physics involved in experimental laboratory research on superconductivity.
Last 12 years (2006.-) employed at Veski on software development, vibration troubleshooting and problem solving.
Ozren worked on numerous Machine Condition Monitoring projects as system commissioning engineer and as a technical expert for machine condition evaluation.
Ozren Oreskovic:
Education: Master degree at Faculty of Mechanical Engineering and Naval Architecture in Zagreb
Working experience: over 11 years of experience, employed at Veski.
From 2004-2009 Worked as Field Service Engineer commissioning Machine Condition Monitoring systems and troubleshooting vibration problems on rotating machines.
From 2009-2012– Working as Sales and Marketing manager at Veski
From 2012 – Works as Managing director at Veski
Darinko Stich
B.Sc. engineer, graduated at University of Maribor, Faculty of Electrical Engineering. He has experience in operation, maintenance, commissioning and measurements on large hydrogenerators. Since 2004 he has been employed at hydropower plants Dravske elektrarne Maribor.
Zlatko Matić
Zlatko Matic has a Master degree at University of Lubljana, Faculty for electrical engineering, where he worked as research engineer and assistant professor for 20 years. After that he worked as a Project manager and consultant in company Tectra, which was the representative for various manufacturers of HV test and monitoring equipment. He has been retired since 2016.
Mladen Šašić
Manager of Rotating Machine Technical Services at IRIS POWER in Toronto, Canada, & with IRIS/ADWEL since 1995. Mladen received the B.S. degree in electrical engineering from Sarajevo University, Sarajevo, Yugoslavia, in 1987. He has more than 25 years of experience in design and testing of electrical power equipment. Mr. Sasic is a Registered Professional Engineer in Ontario, Canada.