los angeles county children and families first … first 5 la cafr... · · 2015-10-27children...
TRANSCRIPT

LOS ANGELES COUNTY CHILDREN AND FAMILIES
FIRST – PROPOSITION 10 COMMISSION (a Component Unit of the
County of Los Angeles, California)
COMPREHENSIVE ANNUAL FINANCIAL REPORT
For the Year Ended June 30, 2015

LOS ANGELES COUNTY CHILDREN AND FAMILIES
FIRST – PROPOSITION 10 COMMISSION (a Component Unit of the
County of Los Angeles, California)
COMPREHENSIVE ANNUAL FINANCIAL REPORT
For the Year Ended June 30, 2015
Raoul Ortega
Director of Finance
LOS ANGELES COUNTY CHILDREN AND FAMILIES FIRST – PROPOSITION 10 COMMISSION
FOR THE YEAR ENDED JUNE 30, 2015
Table of Contents
INTRODUCTION SECTION: Page(s) Letter of Transmittal .................................................................................................................................................. i Board of Commissioners .......................................................................................................................................... v Organizational Chart ............................................................................................................................................... vi GFOA Certificate of Achievement ......................................................................................................................... vii FINANCIAL SECTION: Independent Auditors’ Report ............................................................................................................................... 1-3 Management’s Discussion and Analysis (Required Supplementary Information) .............................................. 4-12 Basic Financial Statements:
Statement of Net Position and Governmental Fund Balance Sheet ................................................................. 13 Statement of Activities and Governmental Fund Revenues, Expenditures and Changes in Fund Balance ............................................................................................. 14 Notes to Basic Financial Statements ........................................................................................................... 15-28
Required Supplementary Information: Schedule of Revenues, Expenditures and Changes in Fund Balance –
Budget and Actual – General Fund ........................................................................................................... 29 Note for the Required Supplementary Information ......................................................................................... 30
Other Supplementary Information: Schedule of Cares Plus Funding ...................................................................................................................... 31
STATISTICAL SECTION (Unaudited): Financial Trends Net Position by Component ............................................................................................................................. 33 Changes in Net Position ................................................................................................................................... 34 Fund Balances – General Fund ........................................................................................................................ 35 Changes in Fund Balances – General Fund ..................................................................................................... 36 Revenue Capacity First 5 California County Tax Revenue Projections for Fiscal Years 2013-2018 ...................................... 37-38 Cigarette Taxes and Other Tobacco Products Surtax Revenue, 1959-60 to 2012-13 ...................................... 39 Demographic Information Demographic Data and Economic Statistics .................................................................................................... 40 Unemployment Rate ........................................................................................................................................ 41 Ten Largest Industries ...................................................................................................................................... 42 Operating Information Capital Assets Statistics ................................................................................................................................... 43 Authorized Positions by Function .................................................................................................................... 44 COMPLIANCE SECTION: Independent Auditors’ Report on Internal Control Over Financial Reporting and on Compliance and Other Matters Based on an Audit of Financial Statements Performed in Accordance with Government Auditing Standards ............................................................... 45-46 Independent Auditors’ Report on State Compliance ......................................................................................... 47-48


v
FIRST 5 LA
Commissioners Michael D. Antonovich, Los Angeles County Supervisor, Chair
Philip L. Browning, Vice Chair Judy Abdo
Nancy Haruye Au Jane Boeckmann
Duane Dennis Sandra Figueroa-Villa
Marvin J. Southard, D.S.W. Joseph Ybarra Jr., Ph.D.
Ex-Officio Commissioners
Patricia Curry Cynthia A. Harding, M.P.H.
Karla Pleitéz Howell Deanne Tilton
Alternate Commissioners
Suzanne Bostwick Dayton Gilleland
Terry Ogawa Rhelda Randal Shabazz Sylvia S. Swilley, M.D.
Christopher R. Thompson, M.D.
Executive Director Kim Belshé
Chief Operating Officer
John A. Wagner
Department Chief Teresa Nuno, Chief of Programs and Planning
Department Heads
Peter Barth, Policy and Intergovernmental Affairs Gala Collins, Human Resources
Barbara DuBransky, Program Development Jennifer L. Eckhart, Contract Compliance
Tara Ficek, Grants Management Rafael González, Best Start Communities
Roozbeh Hamouni, Information Technology Armando Jimenez, Research and Evaluation
Jessica Kaczmarek, Office of Strategic Planning and Integration Raoul Ortega, Finance
Jennifer L. Pippard, Community Investments Gabriel Sanchez, Communications and Marketing

vi
vii

1
INDEPENDENT AUDITORS' REPORT Board of Commissioners Los Angeles County Children and Families First – Proposition 10 Commission Los Angeles, California Report on the Financial Statements We have audited the accompanying financial statements of the governmental activities and the general fund of the Los Angeles County Children and Families First – Proposition 10 Commission (Commission), a component unit of the County of Los Angeles, California, as of and for the year ended June 30, 2015, and the related notes to the financial statements, which collectively comprise the Commission’s basic financial statements as listed in the table of contents. Management’s Responsibility for the Financial Statements Management is responsible for the preparation and fair presentation of these financial statements in accordance with accounting principles generally accepted in the United States of America; this includes the design, implementation, and maintenance of internal control relevant to the preparation and fair presentation of financial statements that are free from material misstatement, whether due to fraud or error. Auditors' Responsibility Our responsibility is to express opinions on these financial statements based on our audit. We conducted our audit in accordance with auditing standards generally accepted in the United States of America and the standards applicable to financial audits contained in Government Auditing Standards, issued by the Comptroller General of the United States. Those standards require that we plan and perform the audit to obtain reasonable assurance about whether the financial statements are free from material misstatement. An audit involves performing procedures to obtain audit evidence about the amounts and disclosures in the financial statements. The procedures selected depend on the auditor’s judgment, including the assessment of the risks of material misstatement of the financial statements, whether due to fraud or error. In making those risk assessments, the auditor considers internal control relevant to the entity’s preparation and fair presentation of the financial statements in order to design audit procedures that are appropriate in the circumstances, but not for the purpose of expressing an opinion on the effectiveness of the entity’s internal control. Accordingly, we express no such opinion. An audit also includes evaluating the appropriateness of accounting policies used and the reasonableness of significant accounting estimates made by management, as well as evaluating the overall presentation of the financial statements. We believe that the audit evidence we have obtained is sufficient and appropriate to provide a basis for our audit opinions.

2
Opinions In our opinion, the financial statements referred to above present fairly, in all material respects, the respective financial position of the governmental activities and the general fund of the Commission, as of June 30, 2015, and the respective changes in financial position thereof for the year then ended in accordance with accounting principles generally accepted in the United States of America. Other Matters Required Supplementary Information Accounting principles generally accepted in the United States of America require that the management’s discussion and analysis and budgetary comparison information on pages 4 through 12 and 29 through 30 be presented to supplement the basic financial statements. Such information, although not a part of the basic financial statements, is required by the Governmental Accounting Standards Board, who considers it to be an essential part of financial reporting for placing the basic financial statements in an appropriate operational, economic, or historical context. We have applied certain limited procedures to the required supplementary information in accordance with auditing standards generally accepted in the United States of America, which consisted of inquiries of management about the methods of preparing the information and comparing the information for consistency with management’s responses to our inquiries, the basic financial statements, and other knowledge we obtained during our audit of the basic financial statements. We do not express an opinion or provide any assurance on the information because the limited procedures do not provide us with sufficient evidence to express an opinion or provide any assurance. Other Information Our audit was conducted for the purpose of forming opinions on the financial statements that collectively comprise the Commission’s basic financial statements. The introductory section, schedule of CARES Plus funding, and statistical section are presented for purposes of additional analysis and are not a required part of the basic financial statements. The schedule of CARES Plus funding is the responsibility of management and was derived from and relates directly to the underlying accounting and other records to prepare the basic financial statements. Such information has been subjected to the auditing procedures applied in the audit of the basic financial statements and certain additional procedures, including comparing and reconciling such information directly to the underlying accounting and other records used to prepare the basic financial statements or to the basic financial statements themselves, and other additional procedures in accordance with auditing standards generally accepted in the United States of America. In our opinion the schedule of CARES Plus funding is fairly stated, in all material respects, in relation to the basic financial statements as a whole. The introductory and statistical sections have not been subjected to the auditing procedures applied in the audit of the basic financial statements and, accordingly, we do not express an opinion or provide any assurance on them.
3
Other Reporting Required by Government Auditing Standards In accordance with Government Auditing Standards, we have also issued our report dated October 8, 2015, on our consideration of the Commission’s internal control over financial reporting and on our tests of its compliance with certain provisions of laws, regulations, contracts, and grant agreements and other matters. The purpose of that report is to describe the scope of our testing of internal control over financial reporting and compliance and the results of that testing, and not to provide an opinion on internal control over financial reporting or on compliance. That report is an integral part of an audit performed in accordance with Government Auditing Standards in considering the Commission’s internal control over financial reporting and compliance.
Rancho Cucamonga, California October 8, 2015

Los Angeles County Children and Families First – Proposition 10 Commission Management’s Discussion and Analysis
(Unaudited)
4
This section of the Los Angeles County Children and Families First – Proposition 10 Commission (the “Commission”) comprehensive annual financial report presents management’s discussion and analysis of the Commission’s financial performance during the year ending June 30, 2015. This discussion and analysis is intended to be read in conjunction with the Commission’s basic financial statements and accompanying notes. Financial Highlights The Commission received a total of $99.8 million in revenues from First 5 California (the State),
reflecting a 7.88% decrease of $8.5 million from $108.3 million in FY 2013-14. Total program revenues for FY 2014-15 in the amount of $104.5 includes tobacco taxes, as well as pass-through funds for programs such as the Child Signature Program, Medi-Cal Administrative Activities and the LA County Partnership for Families program funded through the Department of Children and Family Services.
Commission expenses totaled $200.0 million in FY 2014-15, representing a 2.85% decrease of $5.9
million from $205.8 million in FY 2013-14. The Commission’s liabilities increased from $39.3 million in FY 2013-14 to $41.2 million in FY
2014-15, reflecting a total increase of approximately $1.9 million, or 4.89%. The Commission’s total net position decreased from $644.8 million in FY 2013-14 to $555.4 million
in FY 2014-15, a decline of approximately $89.4 million, or 13.86%. Overview of the Financial Statements The comprehensive annual financial report consists of two parts, this management’s discussion and analysis and the basic financial statements, including: government-wide financial statements, fund financial statements, and notes to the basic financial statements. The Commission’s financial statements offer key, high-level financial information about its activities. Government-wide Financial Statements The government-wide financial statements are designed to provide readers with a broad overview of the Commission’s finances, in a manner similar to a private-sector business. These statements provide both long-term and short-term information about the Commission’s overall financial status. The Statement of Net Position includes information on all of the Commission’s assets and liabilities, with the difference between assets and liabilities reported as net position. Changes in net position may serve as a useful indicator of whether the financial position of the Commission is improving or deteriorating. The Statement of Activities presents information showing how the Commission’s net position changed during the fiscal year. All changes in net position are reported as soon as the underlying event giving rise to the change occurs, regardless of the timing of related cash flows. Fund Financial Statements A fund is a grouping of related accounts that is used to maintain control over resources that have been segregated for specific activities or objectives. Fund accounting is used to ensure and demonstrate compliance with finance-related legal requirements. All of the Commission’s activities are accounted for in the general fund.
Los Angeles County Children and Families First – Proposition 10 Commission Management’s Discussion and Analysis
(Unaudited)
5
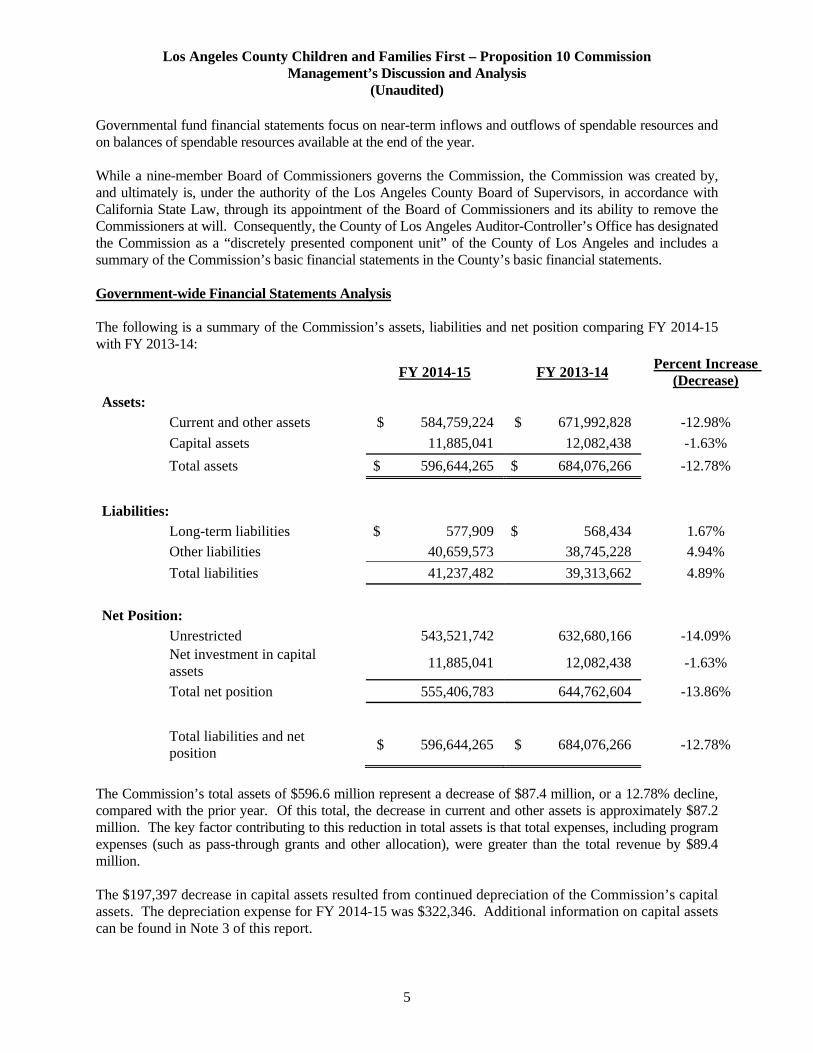
Governmental fund financial statements focus on near-term inflows and outflows of spendable resources and on balances of spendable resources available at the end of the year. While a nine-member Board of Commissioners governs the Commission, the Commission was created by, and ultimately is, under the authority of the Los Angeles County Board of Supervisors, in accordance with California State Law, through its appointment of the Board of Commissioners and its ability to remove the Commissioners at will. Consequently, the County of Los Angeles Auditor-Controller’s Office has designated the Commission as a “discretely presented component unit” of the County of Los Angeles and includes a summary of the Commission’s basic financial statements in the County’s basic financial statements. Government-wide Financial Statements Analysis The following is a summary of the Commission’s assets, liabilities and net position comparing FY 2014-15 with FY 2013-14:
FY 2014-15 FY 2013-14 Percent Increase
(Decrease)
Assets:
Current and other assets $ 584,759,224 $ 671,992,828 -12.98% Capital assets 11,885,041 12,082,438 -1.63%
Total assets $ 596,644,265 $ 684,076,266 -12.78%
Liabilities: Long-term liabilities $ 577,909 $ 568,434 1.67% Other liabilities 40,659,573 38,745,228 4.94% Total liabilities 41,237,482 39,313,662 4.89%
Net Position: Unrestricted 543,521,742 632,680,166 -14.09% Net investment in capital
assets 11,885,041 12,082,438 -1.63%
Total net position 555,406,783 644,762,604 -13.86%
Total liabilities and net position
$ 596,644,265 $ 684,076,266 -12.78%
The Commission’s total assets of $596.6 million represent a decrease of $87.4 million, or a 12.78% decline, compared with the prior year. Of this total, the decrease in current and other assets is approximately $87.2 million. The key factor contributing to this reduction in total assets is that total expenses, including program expenses (such as pass-through grants and other allocation), were greater than the total revenue by $89.4 million. The $197,397 decrease in capital assets resulted from continued depreciation of the Commission’s capital assets. The depreciation expense for FY 2014-15 was $322,346. Additional information on capital assets can be found in Note 3 of this report.

Los Angeles County Children and Families First – Proposition 10 Commission Management’s Discussion and Analysis
(Unaudited)
6
Other liabilities in FY 2014-15 increased by 4.94% over the prior year and are primarily due to greater activities related to Account Payable in the current year compared to the prior year in the amount of $1.82 million. The following is a summary of the Commission’s revenues, expenses and change in net position comparing FY 2014-15 with FY 2013-14:
FY 2014-15 FY 2013-14 Percent Increase
(Decrease)
Revenues: Program revenues Tobacco taxes $ 89,475,135 $ 90,280,307 -0.89% Other State Commission
program funds 10,283,414 18,009,907 -42.90%
Medi-Cal Administrative Activities
80,799 232,407 -65.23%
Partnership for Families funds
4,615,313 - 100%
Total program revenues 104,454,661 108,522,621 -3.75%
General revenues Investment income 3,903,275 6,368,593 -38.71% Net increase
in FMV of investments 2,152,879 - N/A
Other income 104,072 100,320 3.74% Total general revenues 6,160,226 6,468,913 -4.77% Total revenues 110,614,887 114,991,534 -3.81%
Expenses: Provider grants and other
allocations 168,766,806 189,910,283 -11.13%
Pass-through grants 14,225,131 N/A N/A
Salaries and benefits 13,423,832 12,682,373 5.85% Operating services 1,346,532 1,207,258 11.54% Consultant services 1,216,609 956,488 27.20% Professional services 404,560 543,038 -25.50% Other expenses 264,892 183,974 43.98% Depreciation 322,346 353,258 -8.75% Total expenses 199,970,708 205,836,672 -2.85% Change in net position: (89,355,821) (90,845,138) -1.64% Net position – beginning 644,762,604 735,607,742 -12.35% Net position – ending $ 555,406,783 $ 644,762,604 -13.86%

Los Angeles County Children and Families First – Proposition 10 Commission Management’s Discussion and Analysis
(Unaudited)
7
Revenues The Commission received a total of $110.6 million in revenues for FY 2014-15, reflecting a decrease of $4.4 million, or 3.81% compared with the prior year’s total revenues of $115.0 million. The overall changes in revenue are due to the following.
Tobacco Tax Tobacco tax revenue decreased from $90.3 million in FY 2013-14 to $89.5 million in FY 2014-15, a reduction of $805,172, or 0.89%. This decrease is primarily due to declining sales of tobacco products and increased administrative fees assessed by the State Board of Equalization for the collection of tobacco taxes. Other State Commission Program Funds Other State Commission program funds decreased from $18.0 million in FY 2013-14 to $10.3 million in FY 2014-15, a reduction of $7.7 million, or 42.90%. $9.9 million was recorded in FY 2014-15 for the Child Signature Program. In addition, $27,872 from the First 5 California Surplus Money Investment Fund (SMIF) was also recorded for FY 2014-15. The decrease from FY 2013-14 is primarily related to the timing of when First 5 LA received roughly $7.2 million in reimbursement for the FY 2012-13 First 5 California Child Signature Program and $293,725 for the FY 2012-13 First 5 California CARES Plus program, amounts that were recorded in FY 2013-14. Medi-Cal Administrative Activities The Medi-Cal Administrative Activities (MAA) program decreased from $232,408 in FY 2013-14 to $80,799 in FY 2014-15. The program, contracted through the County of Los Angeles, assists in the administration of the Medi-Cal program by improving the availability and accessibility of Medi-Cal services to eligible participants. While this decrease is a result of less activity reported this year than in the prior year, it is important to note that MAA reimbursements are based on activities that are reimbursed from 18 months prior to billing. Investment Income The Commission earned $3.9 million of investment income in FY 2014-15, which was an increase of roughly $300,000, or approximately 8.3%, compared with the $3.6 million earned in the prior year. In previous years, First 5 LA included the Fair Market Value adjustment under investment income within the Statement of Activities. For FY 2014-15, in order to promote greater transparency and to more accurately reflect true interest earned, First 5 LA separated these amounts within the Statement of Activities. For FY 2014-15, the Fair Market Value adjustment is $2.2 million, compared to $2.8 million in FY 2013-14. Partnership for Families Fund The Commission recorded $4.6 million in revenue under a new contract agreement with the Department of Children and Family Services (DCFS) to fund the Partnership for Families (PFF) program. While First 5 LA funding for PFF ended in December 2014, the program continued through funding from DCFS. First 5 LA agreed under contract to manage the program structure in order to allow DCFS additional time to continue with their formal procurement process and the eventual management of the program. Other Revenues The Commission generated other revenue primarily through a lease agreement it has with La Petite Academy. This revenue increased by $3,752, from $100,320 in FY 2013-14 to $104,072 in FY 2014-15.

Los Angeles County Children and Families First – Proposition 10 Commission Management’s Discussion and Analysis
(Unaudited)
8
Expenses The Commission expended approximately $200.0 million in FY 2014-15 compared with $205.8 million in FY 2013-14, a decrease of $5.87 million, or 2.85%. The $5.87 million net decrease in overall expenses encompasses the following from FY 2013-14.
Provider Grants and Other Allocations In previous years, the Commission included expenditures related to “pass-through grants” within the line item “Provider grants and other allocations”. For FY 2014-15, these pass-through funds were reflected separately in order to promote greater transparency and to more accurately reflect true “Provider grants and other allocations” expenditures. Because of this change, the table above reflects a larger variance compared to the prior year of 11.13%. When adjusted for prior year pass-through funds, the Commission experienced a decrease of $2.91 million, or 1.70%, expending approximately $168.8 million in FY 2014-15 compared to $171.7 million in FY 2013-14 for “Provider grants and other allocations”. The net decrease is a result of many initiatives ramping down or ending, even while some initiatives began to experience a ramp up of activities during FY 2014-15. The following details activity based on the Commission’s investment categories during the fiscal year:
Place-Based Investments: Spending for Place-Based investments increased by over $9.2 million from the prior year primarily due to a continued ramp up of the Welcome Baby and Select Home Visitation programs, as well as activities ramping up within the 14 Best Start Communities with further implementation of the Building Stronger Families Framework.
Countywide Strategies: An overall decrease within this investment category is due to the end of funding for the Matching Grant program and the Early Head Start Matching Grant program, as well as lower expenditures for Health Access (Healthy Kids) due to a decline in enrollment during FY 2014-15 and two program enhancements that were accounted for in FY 2013-14.
Countywide Initiatives: Significant increases over prior year expenditures were noted in Children’s Dental Care ($1.1 million, or 22.33%), Little by Little/One Step Ahead ($0.9 million, or 56.62%), Reducing Childhood Obesity ($5.0 million, or 67.72%), and Universal Assessment of Newborns ($3.4 million or 156.59%). These were offset by initiatives with decreases from the prior year, including Substance Abuse Treatment Services ($1.5 million, or 29.69%), Tot Parks and Trails ($3.2 million, or 74.15%), and a decrease in Permanent Supportive Housing in the amount of $10.0 million, which was recognized in FY 2013-14 with no further expenditures in FY 2014-15.
Prior Strategic Plan Investments: As anticipated for initiatives originating from the prior strategic plans, many of these investments ended or were winding down in FY 2014-15, including Baby Friendly Hospitals, Community Opportunities Fund, Family Place Libraries, and Oral Health & Nutrition. A number of initiatives also ended in FY 2013-14, with no expenditures in FY 2014-15, including Family Friends and Neighbors, School Readiness Initiative, Healthy Births, and Family Literacy.
Pass-through Grants In previous years, the Commission included expenditures related to “pass through grants” within the line item “Provider grants and other allocations”. For FY 2014-15, these expenditures were separated in order to promote transparency and to more accurately reflect true “Provider grants and other allocations” expenditures against the approved fiscal year budget. $14.2 million was recorded in FY 2014-15 as “pass through grants” compared to $18.2 million in FY 2013-14. Of the $14.2 million, $9.8 million was for the First 5 California Child Signature Program (CSP), $4.4 million was for the Los Angeles County Department of Children and Family Services Partnership for Families (LAC-PFF) program, and $33,456 was for Medi-Cal Administrative Activities.

Los Angeles County Children and Families First – Proposition 10 Commission Management’s Discussion and Analysis
(Unaudited)
9
Salaries and Benefits Salaries and Benefits increased from FY 2013-14 by $741,459 or 5.85%. The increase is due to fewer vacant positions than in FY 2013-14, as well as the implementation of Phase 1 of the recently adopted compensation philosophy by the Commission in November 2014. The adopted compensation philosophy included changes to the organization’s salary structure, a modification to the existing 403(b) match to lower the maximum contribution from six to three percent, and the introduction of a new non-elective employer contribution component to the plan. The increase in FY 2014-15 related to the new non-elective component is roughly $225,646. Operating Services Compared to the prior year, there was an 11.54% increase in costs related to general operating services. The Commission experienced significant increases in costs related to corporate insurance, workers compensation, printing, human resources costs, hardware and software maintenance and contingency funding. These increases were offset by decreases in office supplies, subscriptions and publications, capital outlay (equipment), Los Angeles County overhead, facilities and utilities expenses.
Consultant Services Consultant services increased from FY 2013-14 by $260,121 or 27.21%. The increase is primarily due to continued organizational development efforts, ongoing strategic planning processes and the compensation study. Professional Services Professional services decreased from FY 2013-14 by $138,478 or 25.50%. The decrease is primarily due to fewer costs related to legal fees, membership dues, and staff recruitment, as well as to the fact that First 5 LA prepaid dues for the FY 2014-15 First 5 Association annual memberships in FY 2013-14. The decrease was offset by increases in auditing fees and costs for Commission stipends.
Budgetary Highlights Based on the information provided in the Schedule of Revenues, Expenditures and Changes in Fund Balance – Budget and Actual – General Fund, the following analysis is presented. Final Revenue Budget vs. Actual Revenue The information below provides a summary of the primary factors that caused the variance between revenue estimates and actual revenue.
Tobacco Taxes Actual tobacco tax revenue of $89.5 million was approximately 1.89% higher than the anticipated amount of $87.8 million. The original estimate was based on data from the State Board of Equalization dated June 4, 2014. On June 2, 2015, updated State projections estimated $84.7 million in revenue for FY 2014-15, roughly $4.8 million below actual.
State Commission Program Funds
State Commission Program Funds in the amount of $11.1 million were recorded in FY 2014-15 for the First 5 California Child Signature Program, the CARES Plus program and SMIF.
Investment Income
Investment income of $3.9 million was earned in FY 2014-15. The monthly average return of 0.72% is lower than the 0.75% anticipated and included in the Long Term Financial Projection approved by the Commission in February 2015.
Los Angeles County Children and Families First – Proposition 10 Commission Management’s Discussion and Analysis
(Unaudited)
10
Original Expenditure Budget vs. Final Expenditure Budget The following provides a brief summary of the primary factors that contributed to the increase in the final budgeted expenditures compared with the original budgeted expenditures.
Provider Grants and Other Allocations The overall Program Budget (Provider Grants and Other Allocations) was adjusted downward during the year by $15.1 million, or 6.82%. In March 2015 the Commission approved a mid-year budget revision reducing the Best Start - Family Strengthening investment by $4.1 million, the Countywide Strategies by $2.0 million, the Countywide Initiatives by $7.2 million, and the Research & Evaluation projects by roughly $2.0 million. The overall reduction is driven by slower than anticipated ramp up, actual contracts coming in lower than the original budget estimates and underutilization within some of the direct service programs. General Operating Expenditures Funds were adjusted downward by $114,150 at mid-year. This decrease, which includes a number of transfers both in and out, is primarily due to a transfer of $85,000 in Contingency funding from the Executive and Best Start Communities Departments to cover needs within Consultant Services. Professional Services Funds were adjusted downward by $4,600 at mid-year to reflect a revised projection based on expenditures through January 2015.
Consultant Services Funds were adjusted upward at mid-year, resulting in a net increase of $471,000. This is driven primarily by additional needs identified to support the continued organizational development efforts and ongoing strategic planning implementation, as well as a small amount to support analysis and convening of stakeholders interested in informing the development of a future funding model for First 5 LA. Travel and Meeting Funds were adjusted upward at mid-year by $129,282 to reflect revised projections based on expenditures through January 2015. Specifically, the primary driver was $100,000 estimated for local meetings to convene external stakeholders around First 5 LA’s 2015-2020 Strategic Plan to create greater awareness and understanding about the Strategic Plan as well as provide an opportunity for parents, community leaders, nonprofit, and public representatives to share their insights and best thinking about implementation activities.
Final Expenditure Budget vs. Actual Expenditure Amounts The following provides a summary of the primary factors causing the significant variances in the actual expenditures compared with the final budgeted expenditures.
Provider Grants and Other Allocations The total Provider Grants and Other Allocations variance for FY 2014-15 is $37.3 million, excluding pass-through costs. Of that variance, the Countywide Initiatives represent $13.6 million, or 36.50%, Prior Strategic Plan Initiatives represent $12.0 million, or 32.12%, and Place-Based Initiatives represent $6.9 million, or 18.41%. Underutilization is primarily due to slower ramp up than originally anticipated, and in the case of Black Infant Health, other sources like Title V, State General and Title XIX funds that were identified, preserving allocated First 5 LA funds for use in later years.

Los Angeles County Children and Families First – Proposition 10 Commission Management’s Discussion and Analysis
(Unaudited)
11
Pass-through Grants The Commission’s annual fiscal year budget is developed to include planned expenditures of Commission funds only, programs that are funded via pass-through grants in which the Commission acts as an intermediary are not included in the annual budget. Because pass-through grants were included with Provider Grants and Other Allocations in previous years, expenditures related to pass-through grants were reflected separately beginning in FY 2014-15 to more accurately represent expenditures of Commission funded provider grants and other allocation and to promote transparency. Salaries and Benefits Salary and benefit costs were lower than budgeted, with a variance of $1.3 million. This is due to a combination of regular employee turnover and vacant positions, as well as a conservative budgeting approach. Specifically, for FY 2014-15 vacant positions were budgeted at the mid-range of the salary guidelines and were also budgeted for a full 12 months. Workers Compensation Insurance Costs related to Workers Compensation Insurance were higher than budgeted, with a variance of $43,520, or 35%. This is due to a deposit made during FY 2014-15 for FY 2015-16 premiums. Corporate Insurance Corporate Insurance costs were higher than budgeted, with a variance of $30,812, or 42%. This is due to payment for FY 2015-16 premiums that was paid in FY 2014-15. Telephone & Modems Expenditures exceeded the budget by $27,644, or 37%. The overage is primarily due to a significant increase in long-distance telephone charges related to conference calls. Equipment Repairs and Maintenance Equipment Repairs and Maintenance costs were lower than budgeted, with a variance of $56,081, or 95%. This is due to fewer repairs and maintenance than originally anticipated for FY 2014-15. Miscellaneous Service Charges Miscellaneous Service Charges, representing Los Angeles County Overhead costs, were lower than budgeted, with a variance of $51,415, or 90%. This underspending is primarily due to lower claims processed by Los Angeles County on behalf of First 5 LA under the Medi-Cal Administrative Activities program due to a lower participation rate. Professional Development Professional Development costs were lower than budgeted, with a variance of $209,906, or 85%. This is primarily due to the cost-effective approach of utilizing coaching consultants to support organization-wide development efforts through the course of the Strategic Planning and Implementation process. Further, due to the organization’s efforts to establish a comprehensive professional development approach, some intended expenses were temporarily placed on hold. External Reviewers Costs for External Reviewers were lower than budgeted, with a variance of $2,560, or 64%. This is due to the need being less than originally projected. Program Events Costs for Program Events were lower than budgeted, with a variance of $12,916, or 86%. This is because anticipated policy and advocacy events in Sacramento and Washington D.C. did not take place as originally expected.

Los Angeles County Children and Families First – Proposition 10 Commission Management’s Discussion and Analysis
(Unaudited)
12
The final budget for Operations remained the same at $19.4 million for FY 2014-15, while the Program Budget was decreased by $15.1 million due to reductions driven by slower than anticipated ramp up, actual contracts coming in lower than the original budget estimates and underutilization within some of the direct service programs. Other Potentially Significant Matters The State projects a continuing decrease of State Tax Allocations revenue. The projected annual revenue decrease is estimated to be 9.60% through FY 2015-16 based on the Department of Finance May revised published June 2, 2015. Contacting the Commission’s Financial Management This financial report is designed to provide the public with an overview of the Commission’s financial operations and condition. If you have questions about this report or need additional information, please contact the Commission’s Director of Finance at (213) 482-5902 or 750 N. Alameda Street Suite 300, Los Angeles, California 90012.

LOS ANGELES COUNTY CHILDREN AND FAMILIES FIRST - PROPOSITION 10 COMMISSION
STATEMENT OF NET POSITION AND GOVERNMENTAL FUND BALANCE SHEET JUNE 30, 2015
See accompanying notes to the basic financial statements.
13
General Adjustments Statement of NetFund (Note 1) Position
Assets
Cash 1,411,326$ -$ 1,411,326$ Investments 519,357,312 - 519,357,312 State receivable 24,052,149 - 24,052,149 Investment income receivable 526,801 - 526,801 Advances to grantees 39,411,636 - 39,411,636 Capital assets: - - -
Not depreciated - 2,039,000 2,039,000 Depreciable capital assets (net) - 9,846,041 9,846,041
Total assets 584,759,224$ 11,885,041$ 596,644,265$
Liabilities
Accounts payable and accrued liabilities 40,643,093$ -$ 40,643,093$ Other liabilities - 16,480 16,480 Compensated absences: - -
Due within one year - 75,544 75,544 Due in more than one year - 502,365 502,365
Total liabilities 40,643,093 594,389 41,237,482
Deferred Inflows of Resources
Unavailable revenue - State Commission Program Funds 6,574,807 (6,574,807) - Unavailable revenue - Partnership for Families Funds 913,320 (913,320) -
Total deferred inflows of resources 7,488,127 (7,488,127) -
Fund balance/net position
Fund balance:Nonspendable 39,411,636 (39,411,636) - Committed 340,879,636 (340,879,636) - Assigned 78,113,279 (78,113,279) - Unassigned 78,223,453 (78,223,453) -
Total fund balance 536,628,004 (536,628,004) -
Net position:Net investment in capital assets - 11,885,041 11,885,041 Unrestricted - 543,521,742 543,521,742
Total net position - 555,406,783 555,406,783
Total liabilities, deferred inflows of resourcesand fund balances/net position 584,759,224$ 11,885,041$ 596,644,265$

LOS ANGELES COUNTY CHILDREN AND FAMILIES FIRST - PROPOSITION 10 COMMISSION
STATEMENT OF ACTIVITIES AND GOVERNMENTAL FUND REVENUES, EXPENDITURES AND CHANGES IN FUND BALANCE
FOR THE YEAR ENDED JUNE 30, 2015
See accompanying notes to the basic financial statements.
14
General Adjustments Statement ofFund (Note 1) Activities
Revenues
Program revenuesOperating grants and contributions:
Tobacco taxes 89,475,135$ -$ 89,475,135$ State Commission Program Funds 11,050,327 (766,913) 10,283,414 Medi-Cal Administrative Activities 80,799 - 80,799 Partnership for Families Funds 3,701,993 913,320 4,615,313
Total program revenues 104,308,254 146,407 104,454,661
General revenuesInvestment income 3,903,275 - 3,903,275Net increase in FMV of investments 2,152,879 - 2,152,879Other revenues 104,072 - 104,072
Total general revenues 6,160,226 - 6,160,226
Total revenues 110,468,480 146,407 110,614,887
Expenditures/expenses
Provider grants and other allocations 168,766,806 - 168,766,806 Pass-through grants 14,225,131 - 14,225,131 Salaries and benefits 13,414,357 9,475 13,423,832 Operating services 1,346,532 - 1,346,532 Consultant services 1,216,609 - 1,216,609 Professional services 404,560 - 404,560 Other expenses 264,892 - 264,892 Capital outlay 124,949 (124,949) - Depreciation - 322,346 322,346
Total expenditures/expenses 199,763,836 206,872 199,970,708
Excess/(deficiency) of revenues over/(under) expenditures (89,295,356) - -
Change in Fund Balance (89,295,356) 89,295,356 -
Change in Net Position - (89,355,821) (89,355,821)
Fund balance/net positionBeginning of year 625,923,360 18,839,244 644,762,604 End of year 536,628,004$ 18,778,779$ 555,406,783$

LOS ANGELES COUNTY CHILDREN AND FAMILIES FIRST – PROPOSITION 10 COMMISSION
NOTES TO BASIC FINANCIAL STATEMENTS FOR THE YEAR ENDED JUNE 30, 2015
15
NOTE 1 – ORGANIZATION AND SUMMARY OF SIGNIFICANT ACCOUNTING POLICIES Reporting Entity With the passage of a ballot initiative in November 1998, California (the “State”) voters approved the establishment of the Los Angeles County Children and Families First – Proposition 10 Commission (the “Commission”), a component unit of Los Angeles County. A thirteen-member Board of Commissioners governs the Commission. The Commission was created by and ultimately is under the authority of the Los Angeles County Board of Supervisors, in accordance with California State Law, through its appointment of the Board of Commissioners and its ability to remove the commissioners at will. The Commission is a public entity legally separate and apart from the County. The initiative, Proposition 10, mandated an additional 50-cent-per-pack tax on cigarettes and a comparable increase in the tax of other tobacco products and required that the new funds be used on programs focused exclusively on early childhood development for children prenatal up to five years of age. Following the directive of Proposition 10 to fund programs at the community level, each of the State’s 58 counties created a Proposition 10 Commission as well as a trust fund to receive Proposition 10 revenues. In Los Angeles County, the Board of Supervisors passed an ordinance in December 1998 to establish the Los Angeles County Children and Families First – Proposition 10 Commission, and in May 1999 the Commission held its first meeting, elected officers and established a number of ad hoc committees to address organizational and planning issues. The Commissioners and others who were involved in the effort regarded Proposition 10 as an extraordinary and unprecedented opportunity to begin making a difference in the lives of pregnant women, young children and their families, and to do so at a point in their lives when it can make the most difference. In August 2002, the Commission introduced a new branding identity, First 5 LA, to signify the importance of the first five years of life. The Commission’s vision statement is that all children throughout Los Angeles’ diverse communities, “are born healthy and raised in a safe, loving and nurturing environment so that they grow up healthy in mind, body, and spirit, are eager to learn with opportunities to reach their full potential.” The Commission’s mission, in partnership with others, is to “strengthen families, communities, and systems of services and support so all children in LA County enter kindergarten ready to succeed in school and life.” Upon termination of the Commission, all assets of the Commission shall be returned to the State of California. The liabilities of the Commission shall not become liabilities of the County upon either termination of the Commission or the liquidation or disposition of the Commission’s remaining assets. Basis of Accounting and Measurement Focus Government-wide Financial Statements Government-wide financial statements consist of the statement of net position and the statement of activities. These statements are presented on an economic resources measurement focus. All economic resources and obligations of the reporting government are reported in the financial statements.

LOS ANGELES COUNTY CHILDREN AND FAMILIES FIRST - PROPOSITION 10 COMMISSION
NOTES TO BASIC FINANCIAL STATEMENTS FOR THE YEAR ENDED JUNE 30, 2015
16
NOTE 1 – ORGANIZATION AND SUMMARY OF SIGNIFICANT ACCOUNTING POLICIES (Continued) Government-wide Financial Statements (Continued) The government-wide financial statements are reported using the economic resources measurement focus and the accrual basis of accounting. With this measurement focus, all assets and liabilities associated with operation of the Commission’s fund are included on the statement of net position. The statement of activities presents a comparison of the direct expenses and program revenues for the Commission's governmental activities. Program revenues include grants and contributions restricted for the operational requirements of a particular program. Grants and similar items are recognized as revenue as soon as all eligibility requirements have been met. Program revenues include tobacco taxes, and state school matching funds. General revenues are all revenues that do not qualify as program revenues and include investment income and other income. Net position represent the resources that the Commission has available for use in providing services. Net position is composed of net investment in capital assets and unrestricted funds. At June 30, 2015, the Commission reported unrestricted net position of $543,521,742. Fund Financial Statements The fund financial statements consist of the balance sheet and the statement of revenues, expenditures and changes in fund balance of the Commission’s general fund. These statements are presented on a current-financial resources measurement focus. The fund financial statements focus on near-term inflows and outflows of spendable resources and on balances of spendable resources available at the end of the fiscal year. The statement of revenues, expenditures and changes in fund balance for the governmental fund generally presents increases (revenues) and decreases (expenditures) in net current assets. All operations of the Commission are accounted for in the general fund. The fund financial statements have been prepared on the modified accrual basis of accounting. Revenues are recognized in the accounting period in which they become both measurable and available to finance expenditures of the current period. Revenues are considered available if they are received within 60 days after year-end. Revenues susceptible to accrual include tax revenues, grants, and investment income. Expenditures are recognized in the accounting period in which the fund liability is incurred except for compensated absences which are recorded only when payment is due. Adjustments Between Fund Financial Statements and Government-Wide Financial Statements Capital Assets Capital assets are not considered to be financial resources and therefore, are not reported as an asset in the fund financial statements. Capital assets in the amount of $11,885,041 are capitalized and reported at cost, net of accumulated depreciation, in the government-wide financial statements. Capital assets purchased during the year in the amount of $124,949 are reported as expenditures on the fund financial statements and capitalized on the government-wide financial statements. Depreciation expense for the year ended June 30, 2015 amounted to $322,346 and is included in the government-wide financial statements.

LOS ANGELES COUNTY CHILDREN AND FAMILIES FIRST - PROPOSITION 10 COMMISSION
NOTES TO BASIC FINANCIAL STATEMENTS FOR THE YEAR ENDED JUNE 30, 2015
17
NOTE 1 – ORGANIZATION AND SUMMARY OF SIGNIFICANT ACCOUNTING POLICIES (Continued) Adjustments Between Fund Financial Statements and Government-Wide Financial Statements (Continued) Long-Term Liabilities As of June 30, 2015, the Commission estimated its liability for vested compensated absences to be $577,909. Compensated absence obligations are considered long-term in nature and are reported in the fund financial statements as expenditures in the period paid or when due and payable at year-end under the modified accrual basis of accounting. The compensated absences have been accrued in the government-wide financial statements and are included in long-term liabilities. The change in compensated absences during the year of $9,475 is reported in the statement of activities and does not require the use of current financial resources. For the year ended June 30, 2015, the Commission maintained a security deposit in the amount of $16,840 related to a facility use agreement with La Petite Academy for use of the first floor of the Commission’s building for the period of July 1, 2012 through June 30, 2020. Unavailable Revenue Under the modified accrual basis of accounting, revenue is recognized in the fund financial statements if it has been collected after year-end within the Commission’s established availability period of 60 days. All other accrued revenues due to the Commission are recognized as unavailable revenue at year-end in the fund financial statements. Governmental funds recognized unavailable revenue where receivables are not available to liquidate liabilities of the current period. As of June 30, 2015, the Commission has unavailable revenue of $7,488,127. The change in unavailable revenue during the year of $146,407 is reported in the statement of activities as this revenue was recognized in the prior year statement of activities. Net Position In the government-wide financial statements, net position represents the difference between assets less liabilities and is classified into two components.
Net investment in capital assets – This balance reflects the net position of the Commission that are invested in capital assets. This amount is generally not accessible for other purposes.
Unrestricted net position – This balance represents the net amount of the assets and liabilities that are available for general use.
Fund Balance GASB Statement No. 54, Fund Balance Reporting and Governmental Fund Type Definitions established fund balance classifications that comprise a hierarchy based primarily on the extent to which a government is bound to observe constraints imposed upon the use of the resources reported in governmental funds. With the implementation of GASB 54, the Commission established the following classifications and definitions of fund balance for the year ended June 30, 2015:
a. Nonspendable Portion of net resources that cannot be spent because they are not in an expendable form (e.g. Prepaid Expense) or the portion of net resources that cannot be spent because they must be maintained intact (e.g. revolving fund or the principal of an endowment).

LOS ANGELES COUNTY CHILDREN AND FAMILIES FIRST - PROPOSITION 10 COMMISSION
NOTES TO BASIC FINANCIAL STATEMENTS FOR THE YEAR ENDED JUNE 30, 2015
18
NOTE 1 – ORGANIZATION AND SUMMARY OF SIGNIFICANT ACCOUNTING POLICIES (Continued) Adjustments Between Fund Financial Statements and Government-Wide Financial Statements (Continued) Fund Balance (Continued)
b. Restricted (externally enforceable limitations on use)
Amounts constrained to specific purposes by their providers (such as creditors, grantors, contributors, or laws and regulations of other governments (e.g. funds advanced by First 5 CA under specific agreements for services such as matching funds for specific initiatives). Amounts constrained by limitations imposed by law through constitutional provisions or enabling legislation (e.g. funds legally restricted by County, state, or federal legislature, or a government’s charter or constitution; or amounts collected from non-spendable items such as long term portion of loan outstanding if those amounts are subject to legal constraint).
c. Committed (self-imposed limitations in place prior to end of the period)
Amounts constrained by limitations imposed at the highest level of decision making authority that requires the same formal action at the same level to remove or modify. The formal action required by the Board of Commissioners for funds to be committed is action by way of resolution allocating funding for a specific program or initiative.
d. Assigned (limitation resulting from intended use)
Amounts or limitations that are constrained by the Commission’s intent to be used for a specific purpose (the purpose of the assignment must be narrower than the general fund itself) and are not either restricted or committed. Adoption of a Strategic Plan or Long Term Financial Plan with general spending parameters would be examples of the Commission’s intent and would constitute an assignment. Accordingly, modification to the Commission’s intent would not require formal action. Further, the Commission may designate a body/committee or an official who can specify such purposes. However as of June 30, 2015, the Commission had not made such a designation.
e. Unassigned (residual net resources)
Resources in the fund balance that cannot be reported in any other classification including a minimum fund balance reserve based on 25% of the operating and programmatic budget.
When both restricted and unrestricted resources are available for use, it is the Commission’s policy to use restricted resources first and then unrestricted resources as needed. The spending priority of fund balance is restricted, committed, assigned, and then unassigned. Effect of New Governmental Accounting Standards Board (GASB) Pronouncements Effective This Fiscal Year GASB Statement No. 68 – In June 2012, GASB issued Statement No. 68, Accounting and Financial Reporting for Pensions – an amendment of GASB Statement No. 27. This Statement replaces the requirements of Statements No. 27 and No. 50 related to pension plans that are administered through trusts or equivalent arrangements. The requirements of Statements No. 27 and No. 50 remain applicable for pensions that are not administered as trusts or equivalent arrangements. The requirements of this Statement are effective for financial statements for fiscal years beginning after June 15, 2014. The Commission has determined that this statement does not have a material impact on the financial statements.
LOS ANGELES COUNTY CHILDREN AND FAMILIES FIRST - PROPOSITION 10 COMMISSION
NOTES TO BASIC FINANCIAL STATEMENTS FOR THE YEAR ENDED JUNE 30, 2015
19
NOTE 1 – ORGANIZATION AND SUMMARY OF SIGNIFICANT ACCOUNTING POLICIES (Continued) Effective This Fiscal Year (Continued) GASB Statement No. 69 – In January 2013, GASB issued Statement No. 69, Government Combinations and Disposals of Government Operations. This Statement establishes accounting and financial reporting standards related to government combinations and disposals of government operations. This Statement is effective for periods beginning after December 31, 2013. The Commission has determined that this statement does not have a material impact on the financial statements. GASB Statement No. 71 – In November 2013, GASB issued Statement No. 71, Pension Transition for Contributions Made Subsequent to the Measurement Date—an amendment of GASB Statement No. 68. This Statement addresses an issue regarding application of the transition provisions of Statement No. 68, Accounting and Financial Reporting for Pensions. The issue relates to amounts associated with contributions, if any, made by a state or local government employer or nonemployer contributing entity to a defined benefit pension plan after the measurement date of the government’s beginning net pension liability. The requirements of this Statement are effective for financial statements for fiscal years beginning after June 15, 2014. The Commission has determined that this statement does not have a material impact on the financial statements. Effective in Future Fiscal Years GASB Statement No. 72 – In February 2015, GASB issued Statement 72, Fair Value Measurement and Application. This Statement addresses accounting and financial reporting issues related to fair value measurements. The definition of fair value is the price that would be received to sell an asset or paid to transfer a liability in an orderly transaction between market participants at the measurement date. This Statement provides guidance for determining a fair value measurement for financial reporting purposes. This Statement also provides guidance for applying fair value to certain investments and disclosures related to all fair value measurements. This statement is effective for periods beginning after June 15, 2015. The Commission has not determined the effect on the financial statements. GASB Statement No. 73 – In June 2015, GASB issued Statement 73, Accounting and Financial Reporting for Pensions and Related Assets That Are Not within the Scope of GASB Statement 68, and Amendments to Certain Provisions of GASB Statements 67 and 68. The objective of this Statement is to improve the usefulness of information about pensions included in the general purpose external financial reports of state and local governments for making decisions and assessing accountability. This Statement establishes requirements for defined benefit pensions that are not within the scope of Statement No. 68, Accounting and Financial Reporting for Pensions, as well as for the assets accumulated for purposes of providing those pensions. In addition, it establishes requirements for defined contribution pensions that are not within the scope of Statement 68. It also amends certain provisions of Statement No. 67, Financial Reporting for Pension Plans, and Statement 68 for pension plans and pensions that are within their respective scopes. This statement is effective for periods beginning after June 15, 2015. The Commission has not determined the effect on the financial statements. GASB Statement No. 74 – In June 2015, GASB issued Statement 74, Financial Reporting for Postemployment Benefit Plans Other Than Pension Plans. The objective of this Statement is to improve the usefulness of information about postemployment benefits other than pensions (other postemployment benefits or OPEB) included in the general purpose external financial reports of state and local governmental OPEB plans for making decisions and assessing accountability. This statement is effective for periods beginning after June 15, 2016. The Commission has not determined the effect on the financial statements.

LOS ANGELES COUNTY CHILDREN AND FAMILIES FIRST - PROPOSITION 10 COMMISSION
NOTES TO BASIC FINANCIAL STATEMENTS FOR THE YEAR ENDED JUNE 30, 2015
20
NOTE 1 – ORGANIZATION AND SUMMARY OF SIGNIFICANT ACCOUNTING POLICIES (Continued) Effect of New Governmental Accounting Standards Board (GASB) Pronouncements (Continued) Effective in Future Fiscal Years (Continued) GASB Statement No. 75 – In June 2015, GASB issued Statement 75, Accounting and Financial Reporting for Postemployment Benefits Other Than Pensions. The primary objective of this Statement is to improve accounting and financial reporting by state and local governments for postemployment benefits other than pensions (other postemployment benefits or OPEB). It also improves information provided by state and local governmental employers about financial support for OPEB that is provided by other entities. This statement is effective for periods beginning after June 15, 2017. The Commission has not determined the effect on the financial statements. GASB Statement No. 76 – In June 2015, GASB issued Statement 76, The Hierarchy of Generally Accepted Accounting Principles for State and Local Governments. The objective of this Statement is to identify—in the context of the current governmental financial reporting environment—the hierarchy of generally accepted accounting principles (GAAP). This statement is effective for periods beginning after June 15, 2015. The Commission has not determined the effect on the financial statements. GASB Statement No. 77 – In August 2015, GASB issued Statement 77, Tax Abatement Disclosures. This Statement requires governments that enter into tax abatement agreements to disclose certain information about the agreements. The requirements of this Statement are effective for reporting periods beginning after December 15, 2015. The Commission has not determined the effect on the financial statements. Investments The Commission participates in the common investment pool of Los Angeles County. Investments are recorded at fair value at June 30, 2015. Advances to Grantees The Commission may provide advances to grantees/contractors that are repayable by the end of the fiscal year unless otherwise stipulated by contract or agreement. The Commission provided three advances to grantees for the fiscal year ended June 30, 2015. The largest of the advances is provided to Los Angeles Universal Preschool which provides quality preschool education and early childhood programs regardless of their families’ income. Capital Assets Capital assets are composed of buildings, building improvements, computer software and accessories, office equipment and furniture and fixtures and are recorded at cost. The Commission capitalizes assets with a cost in excess of $5,000 and/or special projects with a useful life greater than one year. The Commission depreciates capital assets using a straight-line method over the estimated useful life of fifty years for buildings, four years for computers and five years for office equipment and furniture and fixtures. Building improvements are depreciated over the remaining useful life of the building.

LOS ANGELES COUNTY CHILDREN AND FAMILIES FIRST - PROPOSITION 10 COMMISSION
NOTES TO BASIC FINANCIAL STATEMENTS FOR THE YEAR ENDED JUNE 30, 2015
21
NOTE 1 – ORGANIZATION AND SUMMARY OF SIGNIFICANT ACCOUNTING POLICIES (Continued) Deferred Inflows of Resources Deferred inflows of resources represent an acquisition of fund balance that applies to a future period and will not be recognized as an inflow of resources (revenue) until that time. The Commission has one type of deferred inflow, unavailable revenue, which occurs only under the modified accrual basis of accounting. Accordingly, the item is reported only in the governmental fund balance sheet. This amount is deferred and recognized as an inflow of resources in the period that the amounts become available.
Use of Estimates The preparation of financial statements in conformity with accounting principles generally accepted in the United States requires management to make estimates and assumptions that affect the amounts reported in the financial statements and accompanying notes. Actual results could differ from those estimates. NOTE 2 – CASH AND INVESTMENTS Total cash and investments at fair value, as of June 30, 2015 are as follows: Cash:
Cash on hand 150$ Cash in bank 1,411,176
Total Cash 1,411,326
Investments with County Treasurer:Pooled cash and investments 519,357,312
Total investments with County Treasurer 519,357,312
Total Cash and Investments 520,768,638$
Cash in Bank The California Government Code requires California banks and savings and loan associations to secure the Commission's deposits by pledging government securities as collateral. The market value of pledged securities must equal 110 percent of an agency's deposits. California law also allows financial institutions to secure an agency's deposits by pledging first trust deed mortgage notes having a value of 150 percent of an agency's total deposits and collateral is considered to be held in the name of the Commission. At June 30, 2015, cash held by financial institutions of $3,376,402 was entirely insured and collateralized as described above. The book balance at June 30, 2015 was $1,411,176.

LOS ANGELES COUNTY CHILDREN AND FAMILIES FIRST - PROPOSITION 10 COMMISSION
NOTES TO BASIC FINANCIAL STATEMENTS FOR THE YEAR ENDED JUNE 30, 2015
22
NOTE 2 – CASH AND INVESTMENTS (Continued) Pooled Cash and Investments Investments with the Los Angeles County Treasurer at June 30, 2015 are stated at fair value. The fair value of pooled investments is determined annually and is based on current market prices. The fair value of each participant’s position in the pool is the same as the value of the pool shares. The method used to determine the value of participants’ equity withdrawn is based on the book value of the participants’ percentage participation at the date of such withdrawals. The Los Angeles County Treasury is sponsored and administered by the County of Los Angeles and oversight is conducted by the County Treasury Oversight Committee. At June 30, 2015, the weighted average maturity for the County pool approximated 595 days and the County pool is not rated. For further information regarding the Los Angeles County Investment Pool, refer to the County of Los Angeles Comprehensive Annual Financial Report. The table below identifies the investment types that are authorized by the California Government Code or the Commission’s investment policy, where more restrictive. The table also identifies certain provisions of the California Government Code or the Commission’s investment policy for the Specifically Invested Portfolio, where more restrictive, that address interest rate risk, credit risk, and concentration of credit risk.
Type
Limit Per Issuer
Total Limit
Maximum Maturity
Certificates of Deposits (CDs) 5% 30% 5 Years Commercial Paper (CP) 5% 40% 5 Years Corporate Notes 5% 30% 5 Years Federal Agencies 15% 60% 5 Years U.S. Treasuries 100% 100% 5 Years Los Angeles County Investment Pool None None N/A
The County Treasurer's Investment Policy diversifies investments among issues and issuers with a minimum credit rating to mitigate credit risk. For an issuer of short-term debt, the rating must be no less than P-1/A (Moody's) or A-1/A (S&P) while an issuer of long-term debt shall be rated no less than A.

LOS ANGELES COUNTY CHILDREN AND FAMILIES FIRST - PROPOSITION 10 COMMISSION
NOTES TO BASIC FINANCIAL STATEMENTS FOR THE YEAR ENDED JUNE 30, 2015
23
NOTE 3 – CAPITAL ASSETS
Balance BalanceJuly 1, 2014 Increases Decreases June 30, 2015
Capital assets not depreciated:Land 2,039,000$ -$ -$ 2,039,000$
Capital assets, depreciable:Building and improvements 12,076,512 - - 12,076,512 Computer software and accessories 1,630,221 124,949 - 1,755,170 Office equipment 331,035 - - 331,035 Furniture and fixtures 627,670 - - 627,670
Total Depreciable Capital Assets 14,665,439 124,949 - 14,790,387
Less accumulated depreciation:Building and improvements (2,192,536) (242,680) - (2,435,216) Computer software and accessories (1,597,141) (17,635) - (1,614,776) Office equipment (235,980) (30,705) - (266,685) Furniture and fixtures (596,343) (31,326) - (627,669)
Total Accumulated Depreciation (4,622,000) (322,346) - (4,944,346)
Total Capital Assets, Depreciable (Net) 10,043,438 - - 9,846,041
Capital Assets, Net 12,082,439$ (197,397)$ -$ 11,885,041$
NOTE 4 – CHANGES IN COMPENSATED ABSENCES Compensated absences liability activities for the year ended June 30, 2015 is as follows:
Balance Balance Due WithinJuly 1, 2014 Increases Decreases June 30, 2015 One Year
Compensated absences 568,434$ 575,883$ (566,408)$ 577,909$ 75,544$

LOS ANGELES COUNTY CHILDREN AND FAMILIES FIRST - PROPOSITION 10 COMMISSION
NOTES TO BASIC FINANCIAL STATEMENTS FOR THE YEAR ENDED JUNE 30, 2015
24
NOTE 5 – FUND BALANCE Fund balance is classified using a hierarchy based primarily on the extent to which a government is bound to observe constraints imposed upon the use of the resources reported in governmental funds. Fund balance at June 30, 2015 consists of the following:
INITIATIVE/PROGRAM ALLOCATION
NONSPENDABLEAdvances: LA Care Health Plan 8,930,459$ LAUP 26,213,336 UCLA Dental Home Project 4,267,841 TOTAL 39,411,636$
COMMITTED
At-Risk Fathers Investment 598,500$ Baby Friendly Hospitals/Family Place Libraries 24,688,576 Black Infant Health 7,078,043 Children's Dental Care 28,400,965 Children's Vision Care 2,915,722 Communications & Marketing 4,672,000 Communications - Conference Funding 200,000 Communities: Place-Based - Community Capacity Building 17,029,000 Data Development & Integration 2,527,000 Data Partnership with Funders 3,242,605 Early Identification & Intervention - Autism & Other Developmental Delays 1,529,514 ECE Environmental Scan 80,000 Families: Place-Based - Welcome Baby/Select Home Visiting 36,603,000 Healthy Food Access 3,365,802 Healthy Kids 2,087,201 Information Resource and Referral 1,360,000 LAUP 61,040,779 Little by Little/One Step Ahead 24,592,135
Parent-Child Interaction Therapy 14,375,845 Partnerships for Families 150,000
Peer Support Groups for Parents 1,311,148 Reducing Childhood Obesity 20,240,665
LOS ANGELES COUNTY CHILDREN AND FAMILIES FIRST - PROPOSITION 10 COMMISSION
NOTES TO BASIC FINANCIAL STATEMENTS FOR THE YEAR ENDED JUNE 30, 2015
25
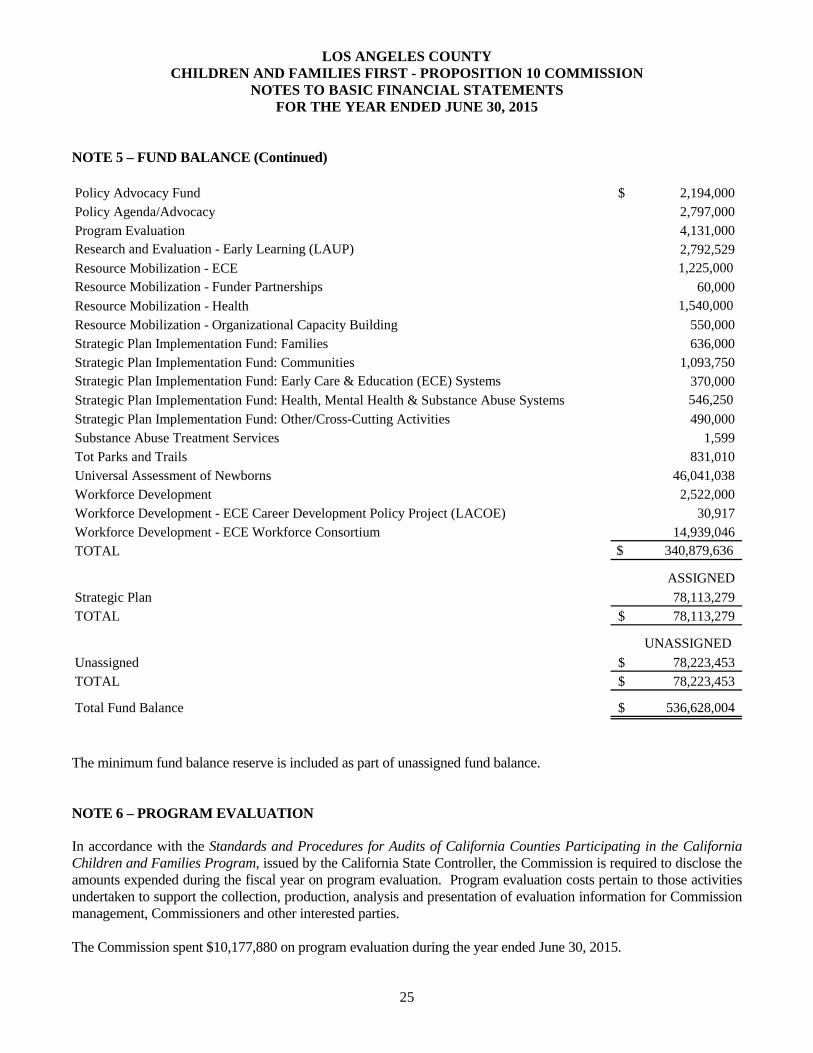
NOTE 5 – FUND BALANCE (Continued) Policy Advocacy Fund 2,194,000$ Policy Agenda/Advocacy 2,797,000 Program Evaluation 4,131,000 Research and Evaluation - Early Learning (LAUP) 2,792,529 Resource Mobilization - ECE 1,225,000 Resource Mobilization - Funder Partnerships 60,000 Resource Mobilization - Health 1,540,000
Resource Mobilization - Organizational Capacity Building 550,000 Strategic Plan Implementation Fund: Families 636,000 Strategic Plan Implementation Fund: Communities 1,093,750 Strategic Plan Implementation Fund: Early Care & Education (ECE) Systems 370,000 Strategic Plan Implementation Fund: Health, Mental Health & Substance Abuse Systems 546,250
Strategic Plan Implementation Fund: Other/Cross-Cutting Activities 490,000 Substance Abuse Treatment Services 1,599 Tot Parks and Trails 831,010 Universal Assessment of Newborns 46,041,038 Workforce Development 2,522,000 Workforce Development - ECE Career Development Policy Project (LACOE) 30,917 Workforce Development - ECE Workforce Consortium 14,939,046 TOTAL $ 340,879,636
ASSIGNED
Strategic Plan 78,113,279 TOTAL 78,113,279$
UNASSIGNED
Unassigned 78,223,453$ TOTAL 78,223,453$
Total Fund Balance 536,628,004$
The minimum fund balance reserve is included as part of unassigned fund balance. NOTE 6 – PROGRAM EVALUATION In accordance with the Standards and Procedures for Audits of California Counties Participating in the California Children and Families Program, issued by the California State Controller, the Commission is required to disclose the amounts expended during the fiscal year on program evaluation. Program evaluation costs pertain to those activities undertaken to support the collection, production, analysis and presentation of evaluation information for Commission management, Commissioners and other interested parties. The Commission spent $10,177,880 on program evaluation during the year ended June 30, 2015.

LOS ANGELES COUNTY CHILDREN AND FAMILIES FIRST - PROPOSITION 10 COMMISSION
NOTES TO BASIC FINANCIAL STATEMENTS FOR THE YEAR ENDED JUNE 30, 2015
26
NOTE 7 – DEFERRED COMPENSATION PLANS All regular and limited-term employees of the Commission participate in the 403(b) Savings and Investment Plan, a defined contribution plan administered by The Standard. Benefit provisions under the plan are established by the California Government Code Section 31694(a) and other applicable statutes. The 403(b) Savings and Investment Plan provides for service retirement, death, and disability benefits to plan members. The plan can be amended by executive management of the Commission. For the period of July through December 2014, employees hired before March 15, 2007, the Commission’s contribution is equal to 100% of the employee’s contribution, not to exceed 6% of the employee’s annual compensation. For employees hired on or after March 15, 2007, the Commission’s contribution is equal to 100% of the employee’s contribution up to 1% of the employee’s annual compensation after the employee’s one year employment anniversary, increasing by 1% each year to 6% after the employee’s sixth year employment anniversary. Effective January 1, 2015, changes to the Commission’s 403(b) Savings and Investment Plan were made such that all regular and limited-term employees are eligible to receive both an elective and a non-elective contribution based on years of completed service with the organization. The elective contribution requires employee participation in order to receive the employer match, and is between 1% and 3% depending on the employee’s contribution and the years of service the employee has completed with the organization: 1% for less than one year, 2% after one year and 3% after two years or more of completed service. The Commission also makes a separate, non-elective contribution into the retirement plan regardless of employee participation. This non-elective employer contribution is between 3% and 7.5% based on years of completed service with the organization: 3% for less than 5 years, 4.5% for 5 to 9 years, 6% for 10 to 14 years, and 7.5% after 15 years or more of completed service. Employer contributions are not 100% vested until an employee has completed three years of service with the organization, with a graded vesting schedule for employees who complete at least one year of service. The Commission contributed a total of $508,470 which comprised of $314,755 in elective contribution and $193,715 in non-elective contribution for the fiscal year ended June 30, 2015. NOTE 8 – UNAVAILABLE REVENUE The general fund reports unavailable revenue on the governmental fund balance sheet in connection with resources that have been earned, but are not yet available to finance expenditures of the current fiscal period. This type of deferred inflow of resources occurs only under the modified accrual basis of accounting. Accordingly, unavailable revenue is reported only in the general fund balance sheet. At the end of the current fiscal year, the components of unavailable revenue resulting from State Commission Program Funds not received within the 60-day period of availability were as follows: Unavailable Revenue:
Child Signature Program 6,243,274$ CARES Plus Program 331,533 Partnership for Families Program 913,320
Total Unavailable Revenue 7,488,127$

LOS ANGELES COUNTY CHILDREN AND FAMILIES FIRST - PROPOSITION 10 COMMISSION
NOTES TO BASIC FINANCIAL STATEMENTS FOR THE YEAR ENDED JUNE 30, 2015
27
NOTE 9 – RISK MANAGEMENT The Commission is exposed to various risks of loss related to general liability, property liability, health benefits, workers’ compensation and auto. These risks are addressed through commercial insurance policies. The Commission’s property and liability insurance is provided by insurance companies that are “Non-Admitted” insurance companies in the State of California. If such a company becomes insolvent, the California Insurance Guarantee Association will not settle unpaid claims. No claims or suits are pending against the Commission arising out of proposed claim settlements covered by insurance. No settlements exceeded insurance coverage during the last three years. NOTE 10 – COMMITMENTS AND CONTINGENCIES Operating Lease The Commission leases equipment from a third party which expires in July 2019 and is non-cancelable. The future minimum rental payments due under the lease are as follows:
For Year EndingJune 30, Annual
2016 61,957$ 2017 58,338 2018 18,522 2019 18,522 2020 1,544 Total 158,882$
The Commission recognized $61,957 in lease expense for the year ended June 30, 2015. Future Funding The Commission has entered into future funding commitments with various entities, which are contingent on State funding. NOTE 11 – RELATED PARTY TRANSACTIONS The Commission incurred expenses totaling $52,574 for County of Los Angeles services provided during the year ended June 30, 2015. The Commission paid $148,211,092 of provider grants, operating services, consultant services, and professional services to organizations which are represented by 18 members of the Board of Commissioners.

LOS ANGELES COUNTY CHILDREN AND FAMILIES FIRST - PROPOSITION 10 COMMISSION
NOTES TO BASIC FINANCIAL STATEMENTS FOR THE YEAR ENDED JUNE 30, 2015
28
NOTE 12 – FIRST 5 CALIFORNIA CARES PLUS PROGRAM CARES Plus is designed to improve the quality of early learning programs by focusing on increasing the quality, effectiveness, and retention of early educators. As a statewide professional development program, its main objectives are to improve both the quality of early learning programs, and ultimately, learning and developmental outcomes for young children. The Commission claimed $399,855 in CARES Plus Phase II reimbursable expenses for the period ended June 30, 2015. Phase II funds have a four-to-one Commission match to each dollar of First 5 funding. NOTE 13 – CHILD SIGNATURE PROGRAM The Child Signature Program is designed to prepare at-risk children for kindergarten by increasing opportunities for children to advance into elementary school with a focus on language, literacy, early math skills, and social and emotional development. As a statewide program, the Child Signature Program works to invest in high quality preschool programs that enhance the quality of care and education that children receive. The Commission claimed $9,855,687 in Child Signature Program reimbursable expenses for the period ended June 30, 2015.
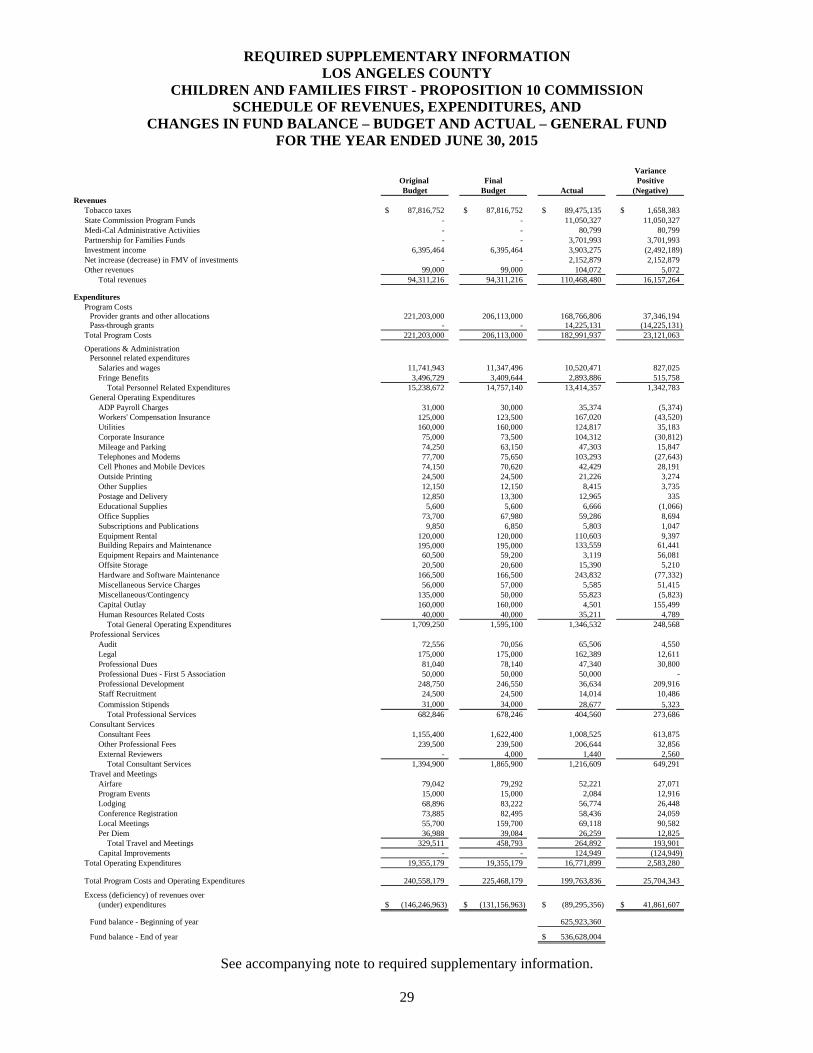
REQUIRED SUPPLEMENTARY INFORMATION LOS ANGELES COUNTY
CHILDREN AND FAMILIES FIRST - PROPOSITION 10 COMMISSION SCHEDULE OF REVENUES, EXPENDITURES, AND
CHANGES IN FUND BALANCE – BUDGET AND ACTUAL – GENERAL FUND FOR THE YEAR ENDED JUNE 30, 2015
See accompanying note to required supplementary information.
29
VarianceOriginal Final PositiveBudget Budget Actual (Negative)
RevenuesTobacco taxes 87,816,752$ 87,816,752$ 89,475,135$ 1,658,383$ State Commission Program Funds - - 11,050,327 11,050,327 Medi-Cal Administrative Activities - - 80,799 80,799 Partnership for Families Funds - - 3,701,993 3,701,993 Investment income 6,395,464 6,395,464 3,903,275 (2,492,189) Net increase (decrease) in FMV of investments - - 2,152,879 2,152,879 Other revenues 99,000 99,000 104,072 5,072
Total revenues 94,311,216 94,311,216 110,468,480 16,157,264
ExpendituresProgram Costs
Provider grants and other allocations 221,203,000 206,113,000 168,766,806 37,346,194 Pass-through grants - - 14,225,131 (14,225,131)
Total Program Costs 221,203,000 206,113,000 182,991,937 23,121,063
Operations & AdministrationPersonnel related expenditures
Salaries and wages 11,741,943 11,347,496 10,520,471 827,025 Fringe Benefits 3,496,729 3,409,644 2,893,886 515,758
Total Personnel Related Expenditures 15,238,672 14,757,140 13,414,357 1,342,783 General Operating Expenditures
ADP Payroll Charges 31,000 30,000 35,374 (5,374) Workers' Compensation Insurance 125,000 123,500 167,020 (43,520) Utilities 160,000 160,000 124,817 35,183 Corporate Insurance 75,000 73,500 104,312 (30,812) Mileage and Parking 74,250 63,150 47,303 15,847 Telephones and Modems 77,700 75,650 103,293 (27,643) Cell Phones and Mobile Devices 74,150 70,620 42,429 28,191 Outside Printing 24,500 24,500 21,226 3,274 Other Supplies 12,150 12,150 8,415 3,735 Postage and Delivery 12,850 13,300 12,965 335 Educational Supplies 5,600 5,600 6,666 (1,066) Office Supplies 73,700 67,980 59,286 8,694 Subscriptions and Publications 9,850 6,850 5,803 1,047 Equipment Rental 120,000 120,000 110,603 9,397 Building Repairs and Maintenance 195,000 195,000 133,559 61,441 Equipment Repairs and Maintenance 60,500 59,200 3,119 56,081 Offsite Storage 20,500 20,600 15,390 5,210 Hardware and Software Maintenance 166,500 166,500 243,832 (77,332) Miscellaneous Service Charges 56,000 57,000 5,585 51,415 Miscellaneous/Contingency 135,000 50,000 55,823 (5,823) Capital Outlay 160,000 160,000 4,501 155,499 Human Resources Related Costs 40,000 40,000 35,211 4,789
Total General Operating Expenditures 1,709,250 1,595,100 1,346,532 248,568 Professional Services
Audit 72,556 70,056 65,506 4,550 Legal 175,000 175,000 162,389 12,611 Professional Dues 81,040 78,140 47,340 30,800 Professional Dues - First 5 Association 50,000 50,000 50,000 - Professional Development 248,750 246,550 36,634 209,916 Staff Recruitment 24,500 24,500 14,014 10,486 Commission Stipends 31,000 34,000 28,677 5,323
Total Professional Services 682,846 678,246 404,560 273,686 Consultant Services
Consultant Fees 1,155,400 1,622,400 1,008,525 613,875 Other Professional Fees 239,500 239,500 206,644 32,856 External Reviewers - 4,000 1,440 2,560
Total Consultant Services 1,394,900 1,865,900 1,216,609 649,291 Travel and Meetings
Airfare 79,042 79,292 52,221 27,071 Program Events 15,000 15,000 2,084 12,916 Lodging 68,896 83,222 56,774 26,448 Conference Registration 73,885 82,495 58,436 24,059 Local Meetings 55,700 159,700 69,118 90,582 Per Diem 36,988 39,084 26,259 12,825
Total Travel and Meetings 329,511 458,793 264,892 193,901 Capital Improvements - - 124,949 (124,949)
Total Operating Expenditures 19,355,179 19,355,179 16,771,899 2,583,280
Total Program Costs and Operating Expenditures 240,558,179 225,468,179 199,763,836 25,704,343
Excess (deficiency) of revenues over (under) expenditures (146,246,963)$ (131,156,963)$ (89,295,356)$ 41,861,607$
Fund balance - Beginning of year 625,923,360
Fund balance - End of year 536,628,004$

LOS ANGELES COUNTY CHILDREN AND FAMILIES FIRST - PROPOSITION 10 COMMISSION
NOTE FOR THE REQUIRED SUPPLEMENTARY INFORMATION FOR THE YEAR ENDED JUNE 30, 2015
30
NOTE 1 – BUDGET ADOPTION
The Commission adopts a budget annually in accordance with generally accepted accounting principles based on estimates of revenue and anticipated expenditures. The Board of Commissioners has given the Executive Director authority to make budget adjustments between line items in the Commission’s annual budget for Operating and Administrative costs in an amount not to exceed $25,000. Any budget adjustment between line items in excess of $25,000 requires approval of the Board of Commissioners. The accompanying Schedule of Revenues, Expenditures, and Changes in Fund Balance – Budget and Actual – General Fund includes the budgeted expenditures for the year, along with management’s estimate of revenues for the year. The legal level of budgetary control is at the total fund level. The total budget for FY 2014-15 was $225.5 million, which included $206.1 million for Program costs and $19.4 million for Operating and Administrative costs. In previous years, the Commission included expenditures related to “pass-through grants” within the line item “Provider grants and other allocations”. For FY 2014-15, in order to promote greater transparency and to more accurately reflect true “Provider grants and other allocations” expenditures against the approved fiscal year budget, the Commission separated these amounts within the Schedule of Revenues, Expenditures, And Changes in Fund Balance – Budget and Actual – General Fund. In FY 2014-15, $14.2 million was recorded as “pass through grants”, which includes $9.8 million for the First 5 California Child Signature Program (CSP), $4.4 million for the Los Angeles County Department of Children and Family Services Partnership for Families (LAC-PFF) program, and $33,456 for Medi-Cal Administrative Activities. The Commission does not establish a budget for pass-through grants.

OTHER SUPPLEMENTARY INFORMATION

LOS ANGELES COUNTY CHILDREN AND FAMILIES FIRST - PROPOSITION 10 COMMISSION
SCHEDULE OF CARES PLUS FUNDING FOR THE YEAR ENDED JUNE 30, 2015
31
RevenueProgram Source Funds Expenditures
CARES Plus First 5 LA Program Funds 399,855$ 399,855$ County, Local Funds 1,599,420 1,599,420
LOS ANGELES COUNTY CHILDREN AND FAMILIES FIRST – PROPOSITION 10 COMMISSION
STATISTICAL SECTION (UNAUDITIED)
32
The information in this section is not covered by the Independent Auditor's Report, but it is presented as supplemental data for the benefit of the readers of the comprehensive annual financial report. The objectives of statistical section information are to provide financial statement users with additional information to understand and assess the Commission's economic condition.
Pages Financial Trends These schedules contain trend information to help the reader understand how the Commission's financial performance and well-being have changed over time. 33-36 Revenue Capacity These schedules contain trend information to help the reader assess the Commission's most significant revenue base. 37-39 Demographic Information These schedules offer economic and demographic indicators to help the reader Understand how the information in the Commission's financial report relates to the services the Commission provides and the activities it performs. 40-41 Operating Information This schedule contains infrastructure data to help the reader understand how the information in the Commission's financial report relates to the services the Commission performs. 42-44 Sources: Unless otherwise noted, the information in these schedules is derived from the comprehensive annual financial reports for the relevant years.
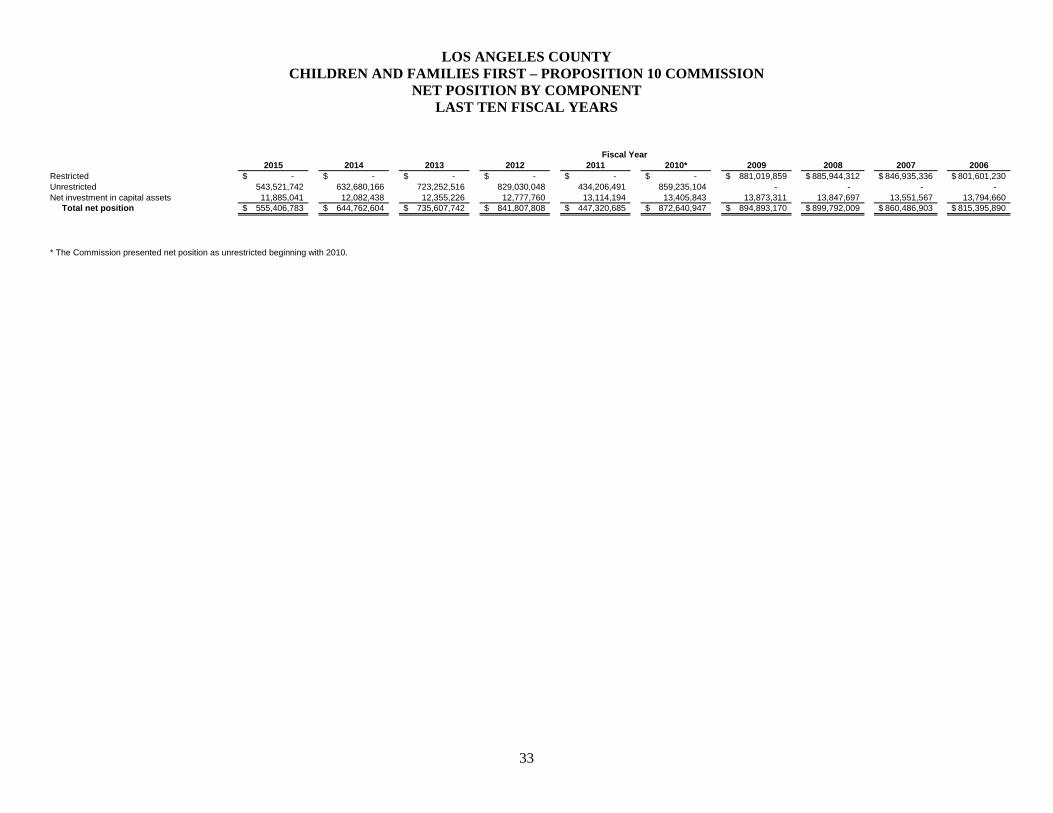
LOS ANGELES COUNTY CHILDREN AND FAMILIES FIRST – PROPOSITION 10 COMMISSION
NET POSITION BY COMPONENT LAST TEN FISCAL YEARS
33
2015 2014 2013 2012 2011 2010* 2009 2008 2007 2006Restricted -$ -$ -$ -$ -$ -$ 881,019,859$ 885,944,312$ 846,935,336$ 801,601,230$ Unrestricted 543,521,742 632,680,166 723,252,516 829,030,048 434,206,491 859,235,104 - - - - Net investment in capital assets 11,885,041 12,082,438 12,355,226 12,777,760 13,114,194 13,405,843 13,873,311 13,847,697 13,551,567 13,794,660 Total net position 555,406,783$ 644,762,604$ 735,607,742$ 841,807,808$ 447,320,685$ 872,640,947$ 894,893,170$ 899,792,009$ 860,486,903$ 815,395,890$
* The Commission presented net position as unrestricted beginning with 2010.
Fiscal Year

LOS ANGELES COUNTY CHILDREN AND FAMILIES FIRST – PROPOSITION 10 COMMISSION
CHANGES IN NET POSITION LAST TEN FISCAL YEARS
34
2015 2014 2013 2012 2011 2010 2009 2008 2007 2006Revenues
Tobacco taxes 89,475,135$ 90,280,307$ 94,112,590$ 100,187,619$ 100,269,182$ 102,504,928$ 114,925,729$ 122,655,958$ 125,602,050$ 132,633,446$ State School Readiness - - - - 28,465,232 19,011,847 15,445,577 15,098,348 11,563,470 15,343,412 State Commission Program Funds 10,283,414 18,009,907 2,749,082 8,098,412 7,933,188 7,162,800 6,438,881 5,673,958 2,300,312 1,490,053 Medi-Cal Administrative Activities 80,799 232,408 316,369 483,325 507,869 740,794 925,511 - - - Partnership for Families Fund* 4,615,313 - - - - - - - - - Investment income 3,903,275 6,368,593 (3,402,141) 915,935 12,004,422 16,094,660 28,102,852 34,996,079 42,823,178 30,799,531 Net increase (decrease) in FMV of investments 2,152,879 - - - - - - - - - Other revenues 104,072 100,320 98,880 9,048 290,093 465,061 453,762 467,302 290,768 314,658
Total revenues: 110,614,887$ 114,991,535$ 93,874,779$ 109,694,339$ 149,469,986$ 145,980,090$ 166,292,312$ 178,891,645$ 182,579,778$ 180,581,100$
ExpensesProvider grants and other allocations 168,766,806$ 189,910,283$ 185,753,622$ 124,709,026$ 133,261,213$ 157,019,407$ 160,239,867$ 130,894,482$ 129,614,460$ 119,067,100$ Pass-through grants** 14,225,131 N/A N/A N/A N/A N/A N/A N/A N/A N/AAB 99 N/A N/A N/A (424,388,705) 424,388,705 N/A N/A N/A N/A N/AFirst 5 California (SRI) N/A N/A N/A 1,137,220 2,506,120 N/A N/A N/A N/A N/ASalaries and benefits 13,423,832 12,682,373 11,583,915 11,153,057 10,685,423 8,818,136 8,161,291 6,638,952 5,841,908 5,822,732 Operating services 1,346,532 1,207,259 1,159,609 1,138,850 1,324,708 832,164 1,090,947 693,968 855,192 860,634 Consultant services 1,216,609 956,488 549,676 331,046 1,523,221 677,379 653,301 415,736 415,822 531,042 Professional services 404,560 543,038 426,726 540,606 398,819 208,008 400,036 276,610 204,353 232,044 Other expenses 264,892 183,974 149,116 114,384 116,223 80,355 69,045 90,880 85,332 191 Depreciation 322,346 353,258 452,182 471,732 585,814 596,868 576,664 575,911 471,698 465,298
Total expenses: 199,970,708$ 205,836,673$ 200,074,846$ (284,792,784)$ 574,790,246$ 168,232,317$ 171,191,151$ 139,586,539$ 137,488,765$ 126,979,041$
Change in net position (89,355,821)$ (90,845,138)$ (106,200,066)$ 394,487,123$ (425,320,260)$ (22,252,227)$ (4,898,839)$ 39,305,106$ 45,091,013$ 53,602,059$
* Beginning January 2015, the Partnership for Families initiative is being funded by the LA County Department of Children and Family Services (DCFS), with First 5 LA acting as a pass-through entity and receiving reimbursement from DCFS.**Beginning FY 2015, pass-through grants were separately identified on the financial statements. In the prior years, it was included as part of the provider grants and other allocations line item.
Fiscal Year

LOS ANGELES COUNTY CHILDREN AND FAMILIES FIRST – PROPOSITION 10 COMMISSION
FUND BALANCES – GENERAL FUND LAST TEN FISCAL YEARS*
35
2015* 2014* 2013* 2012* 2011* 2010 2009 2008 2007 2006Fund Balance
Nonspendable 39,411,636$ 37,578,099$ 27,022,268$ 19,960,620$ -$ Committed 340,879,636 451,133,640 561,003,855 631,710,435 632,471,832 Assigned 78,113,279 57,716,899 64,902,466 153,086,390 - Unassigned 78,223,453 79,494,722 70,816,380 16,691,138 (205,716,806)
Total Fund Balance 536,628,004$ 625,923,360$ 723,744,969$ 821,448,583$ 426,755,026$
ReservedReserved for encumbrances 129,094,692$ 341,203,752$ 504,505,166$ 639,223,219$ 679,128,690$ Reserved for obligations 189,699,943 45,820,595 52,670,634 13,125,130 39,107,652 Reserved for First 5 California 19,004,928 30,050,843 52,161,039 31,794,550 60,712,820
Total Reserved 337,799,563$ 417,075,190$ 609,336,839$ 684,142,899$ 778,949,162$
UnreservedDesignated 249,875,172$ 284,028,356$ 272,696,682$ 162,356,525$ 1,298,235$ Unreserved 271,842,909 174,167,089 - - 18,384,748
Total Fund Balance 859,517,644$ 875,270,635$ 882,033,521$ 846,499,424$ 798,632,145$
* Fund balance presentation changed in fiscal year 2010-2011 due to the implementation of GASB 54.
Fiscal Year

LOS ANGELES COUNTY CHILDREN AND FAMILIES FIRST – PROPOSITION 10 COMMISSION
CHANGES IN FUND BALANCES – GENERAL FUND LAST TEN FISCAL YEARS
36
2015 2014 2013 2012 2011 2010 2009 2008 2007 2006Revenues
Tobacco taxes 89,475,135$ 90,280,307$ 94,112,590$ 100,187,619$ 100,269,182$ 102,504,928$ 114,925,729$ 122,655,958$ 127,012,312$ 131,223,184$ State School Readiness - - - - 39,242,565 19,011,847 15,445,577 15,098,348 13,534,763 17,640,707 State Commission Program Funds 11,050,327 10,668,187 10,741,413 7,960,036 95,713 2,441,868 4,633,722 2,198,287 1,480,228 2,217,327 Medi-Cal Administrative Activities 80,799 232,408 316,369 483,325 507,869 740,794 925,511 - - - Partnership for Families Funds* 3,701,993 - - - - - - - - - Investment income 3,903,275 6,368,593 (3,402,141) 915,935 12,004,422 16,094,660 28,102,852 34,996,079 42,823,178 30,799,531 Net increase (decrease) in FMV of investments 2,152,879 - - - - - - - - - Other income 104,072 100,320 98,880 9,048 290,093 427,960 415,048 428,588 252,054 506,613
Total revenues: 110,468,480$ 107,649,815$ 101,867,110$ 109,555,963$ 152,409,844$ 141,222,057$ 164,448,439$ 175,377,260$ 185,102,535$ 182,387,362$
Expenditures:Provider grants and other allocations 168,766,806$ 189,910,283$ 185,753,622$ 124,709,026$ 133,261,213$ 157,019,407$ 160,239,867$ 130,894,482$ 129,614,460$ 119,067,100$ Pass-through grants** 14,225,131$ N/A N/A N/A N/A N/A N/A N/A N/A N/AAB 99 - - - (424,388,705) 424,388,705 N/A N/A N/A N/A N/AFirst 5 California (SRI) - - - 1,137,220 2,506,120 N/A N/A N/A N/A N/ASalaries and benefits 13,414,357 12,589,911 11,502,328 11,144,681 10,619,053 8,774,370 8,155,851 6,599,446 5,831,492 5,802,008 Operating services 1,346,532 1,207,258 1,159,609 1,138,850 1,324,708 832,164 1,090,947 693,968 855,192 860,634 Consultant services 1,216,609 956,488 549,676 331,046 1,523,221 677,379 653,301 415,736 415,822 531,042 Professional services 404,560 543,038 426,726 540,606 398,819 208,008 400,036 276,610 204,353 232,044 Other expenses 264,892 183,974 149,116 114,384 116,223 80,355 69,045 90,880 85,332 191 Capital outlay 124,949 80,471 29,648 135,298 294,166 123,599 602,278 872,041 228,605 892,796
Total expenditures: 199,763,836$ 205,471,423$ 199,570,724$ (285,137,594)$ 574,432,228$ 167,715,282$ 171,211,325$ 139,843,163$ 137,235,256$ 127,385,815$
Excess (deficiency) of revenues over expenditures (89,295,356)$ (97,821,608)$ (97,703,614)$ 394,693,557$ (422,022,384)$ (26,493,225)$ (6,762,886)$ 35,534,097$ 47,867,279$ 55,001,547$
* Beginning January 2015, the Partnership for Families initiative is being funded by the LA County Department of Children and Family Services (DCFS), with First 5 LA acting as a pass-through entity and receiving reimbursement from DCFS.**Beginning FY 2015, pass-through grants were separately identified on the financial statements. In the prior years, it was included as part of the provider grants and other allocations line item.
Fiscal Year
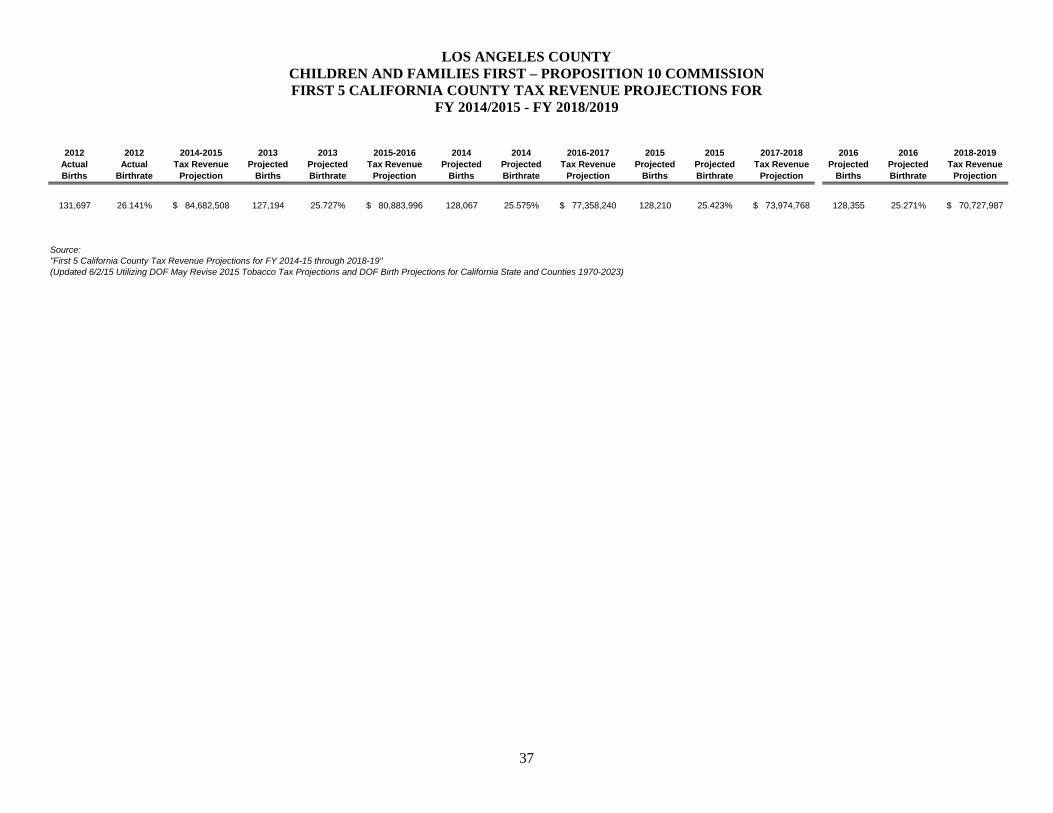
LOS ANGELES COUNTY CHILDREN AND FAMILIES FIRST – PROPOSITION 10 COMMISSION FIRST 5 CALIFORNIA COUNTY TAX REVENUE PROJECTIONS FOR
FY 2014/2015 - FY 2018/2019
37
2012 Actual Births
2012 Actual
Birthrate
2014-2015Tax Revenue
Projection
2013Projected
Births
2013Projected Birthrate
2015-2016Tax Revenue
Projection
2014Projected
Births
2014Projected Birthrate
2016-2017Tax Revenue
Projection
2015Projected
Births
2015Projected Birthrate
2017-2018Tax Revenue
Projection
2016Projected
Births
2016Projected Birthrate
2018-2019Tax Revenue
Projection
131,697 26.141% 84,682,508$ 127,194 25.727% 80,883,996$ 128,067 25.575% 77,358,240$ 128,210 25.423% 73,974,768$ 128,355 25.271% 70,727,987$
Source: "First 5 California County Tax Revenue Projections for FY 2014-15 through 2018-19"(Updated 6/2/15 Utilizing DOF May Revise 2015 Tobacco Tax Projections and DOF Birth Projections for California State and Counties 1970-2023)

LOS ANGELES COUNTY CHILDREN AND FAMILIES FIRST – PROPOSITION 10 COMMISSION
FIRST 5 CALIFORNIA COUNTY TAX REVENUE PROJECTIONS FOR FY 2014/2015 - FY 2018/2019
38
2012 Actual Births 131,6972012 Actual Birthrate 26.141%FY 2014-15 Tax Revenue Projection 84,682,508$
2013 Projected Births 127,1942013 Projected Birthrate 25.727%FY 2015-16 Tax Revenue Projection 80,883,996$
2014 Projected Births 128,0672014 Projected Birthrate 25.575%FY 2016-17 Tax Revenue Projection 77,358,240$
2015 Projected Births 128,2102015 Projected Birthrate 25.423%FY 2017-18 Tax Revenue Projection 73,974,768$
2016 Projected Births 128,355$ 2016 Projected Birthrate 25.271%FY 2018-19 Tax Revenue Projection 70,727,987$
Source: "First 5 California County Tax Revenue Projections for FY 2014-15 through 2018-19"(Updated 6/2/15 Utilizing DOF May Revise 2015 Tobacco Tax Projections and DOF Birth Projections for California State and Counties 1970-2023)

LOS ANGELES COUNTY CHILDREN AND FAMILIES FIRST – PROPOSITION 10 COMMISSION CIGARETTE TAXES AND OTHER TOBACCO PRODUCTS SURTAX REVENUE, 1059-60 TO 2012-13
(In thousands of dollars)
39
Cigarette taxOther tobacco products
surtax
Fiscal year Revenue a/Distributors' discounts b/
Gross value of tax indicia c/ Refunds Revenue Rate
2013-14 $751,513,000 $6,443,000 $757,956,000 $600,000 $86,424,000 29.82%2012-13 782,115,000 6,705,000 788,820,000 498,000 82,548,000 30.68%2011-12 820,322,000 7,032,000 827,355,000 1,017,000 80,424,000 31.73%2010-11 828,831,000 7,105,000 835,937,000 1,308,000 77,016,000 33.02%2009-10 838,709,000 7,187,000 845,896,000 1,583,000 84,617,000 41.11%2008-09 912,724,000 7,819,000 920,543,000 626,000 85,506,000 45.13%2007-08 955,030,000 8,185,000 963,215,000 727,000 85,929,000 45.13%2006-07 998,723,000 8,558,000 1,007,281,000 1,330,000 79,946,000 46.76%2005-06 1,026,497,000 8,795,000 1,035,293,000 1,707,000 67,348,000 46.76%2004-05 1,024,272,000 8,778,000 1,033,051,000 1,653,000 58,441,000 46.76%2003-04 1,021,366,000 8,755,000 1,030,121,000 4,721,000 44,166,000 46.76%2002-03 1,031,772,000 8,845,000 1,040,617,000 13,248,000 40,996,000 48.89%2001-02 1,067,004,000 9,146,000 1,076,150,000 10,774,000 50,037,000 52.65% d/
2000-01 1,110,692,000 9,503,000 1,120,195,000 8,741,000 52,834,000 54.89%1999-00 1,166,880,000 9,980,000 1,176,859,000 9,413,000 66,884,000 66.50%1998-99 841,911,000 e/ 7,206,000 849,117,000 6,808,000 42,137,000 f/ 61.53% f/
1997-98 612,066,000 5,244,000 617,309,000 5,448,000 39,617,000 29.37%1996-97 629,579,000 5,394,000 634,973,000 5,060,000 41,590,000 30.38%1995-96 639,030,000 5,469,000 644,499,000 6,193,000 32,788,000 31.20%1994-95 656,923,000 5,628,000 662,551,000 11,159,000 28,460,000 31.20%1993-94 647,993,000 g/ 5,553,000 653,546,000 8,353,000 19,773,000 23.03%1992-93 667,479,000 5,715,000 673,195,000 9,138,000 21,480,000 26.82%1991-92 711,275,000 6,086,000 717,362,000 7,791,000 22,016,000 29.35%1990-91 729,612,000 6,242,000 735,854,000 7,904,000 24,064,000 34.17%1989-90 770,042,000 h/ 6,581,000 776,623,000 11,615,000 24,956,000 h/ 37.47%1988-89 499,712,000 h/ 4,273,000 503,984,000 4,968,000 9,994,000 h/ 41.67%1987-88 254,869,000 2,180,000 257,049,000 2,970,0001986-87 257,337,000 2,202,000 259,539,000 2,661,0001985-86 260,960,000 2,231,000 263,190,000 2,834,0001984-85 265,070,000 2,267,000 267,337,000 2,390,0001983-84 265,265,000 2,267,000 267,532,000 2,756,0001982-83 273,748,000 2,336,000 276,084,000 2,060,0001981-82 278,667,000 2,383,000 281,050,000 1,843,0001980-81 280,087,000 2,395,000 282,482,000 1,567,0001979-80 272,119,000 2,327,000 274,446,000 1,645,0001978-79 270,658,000 2,315,000 272,973,000 1,408,0001977-78 275,042,000 2,352,000 277,394,000 1,239,0001976-77 270,502,000 2,315,000 272,817,000 832,0001975-76 269,852,000 2,309,000 272,161,000 927,0001974-75 264,182,000 2,262,000 266,444,000 745,0001973-74 259,738,000 2,222,000 261,960,000 632,0001972-73 253,089,000 2,167,000 255,256,000 626,0001971-72 248,398,000 2,127,000 250,525,000 677,0001970-71 240,372,000 2,058,000 242,430,000 552,0001969-70 237,220,000 2,032,000 239,253,000 455,0001968-69 238,836,000 2,046,000 240,882,000 492,0001967-68 208,125,000 i/ 1,862,000 209,987,000 328,0001966-67 75,659,000 1,543,000 77,202,000 129,0001965-66 74,880,000 1,528,000 76,407,000 88,0001964-65 74,487,000 1,520,000 76,007,000 61,0001963-64 71,530,000 1,459,000 72,989,000 71,0001962-63 70,829,000 1,445,000 72,274,000 79,0001961-62 68,203,000 1,390,000 69,593,000 47,0001960-61 66,051,000 j/ 1,675,000 k/ 67,726,000 76,0001959-60 61,791,000 l/ 767,000 l/ 62,558,000 67,000
Net of refunds for tax indicia on cigarettes that become unfit for use (See Refunds).
A discount of .85 percent of gross value of tax indicia is granted to distributors for affixing the stamps. From July 1, 1960, until August 1, 1967, the discount rate was 2 percent.Includes sales of indicia purchased on credit. Effective July 16, 1961, distributors have been able to purchase tax indicia on credit.
From July 1, 2001, through September 9, 2001, the surtax rate on smokeless tobacco ranged from 131 percent for moist snuff to 490 percent for chewing tobacco. Effective September 10, 2001, the surtax rate on smokeless tobacco was lowered to 52.65 percent.Effective January 1, 1999, the overall tax rate on cigarettes was increased from 37 cents to 87 cents per pack under voter-approved Proposition 10. The additional 50-cent-per-
pack tax was imposed to raise funds for early childhood development programs. Excludes $87,978,766 in 1998-99 from the floor stocks taxes for both cigarettes and other tobacco products levied on January 1, 1999.
From July 1, 1998, through December 31, 1998, the surtax rate was 26.17 percent for other tobacco products. Effective January 1, 1999, the new surtax imposed under Proposition 10 raised the combined surtax rate to 61.53 percent for other tobacco products. The new surtax is equivalent (in terms of the wholesale costs of other tobacco products) to a 50-cent-per-pack tax on cigarettes.
Effective January 1, 1994, the overall tax rate on cigarettes was increased from 35 cents to 37 cents per pack. The additional 2-cent-per-pack tax was imposed to raise funds for breast cancer research and education.
Effective January 1, 1989, an additional 25-cent-per-pack surtax was imposed on cigarettes and a new 41.67 percent surtax was imposed on other tobacco products. Excludes $57,927,856 in 1988-89 and $595,000 in 1989-90 from the floor stocks tax levied on January 1, 1989.Effective August 1, 1967, the tax rate was increased from 3 cents to 7 cents per pack. On October 1, 1967, the rate was further increased to 10 cents per pack, with the stipulation that 30 percent of the tax be allocated to cities and counties. Includes $6,515,209 from the 4-cent-per-pack floor stocks tax levied on August 1, 1967; and $4,889,485 from the 3-cent-per-pack floor stocks tax imposed October 1, 1967.Refunds made for distributors' discounts in the 1960-61 fiscal year on purchases made in the 1959-60 fiscal year have been deducted. These refunds amounted to $324,000.
Effective July 1, 1960, a discount was allowed at the time tax indicia were purchased.
Includes $2,673,048 from the 3-cent-per-pack floor stocks tax imposed July 1, 1959; and also includes the amount of distributors' discounts which were refunded after purchase of indicia. During July and August of 1959, the tax was collected by invoice and no discount was allowed on these collections of $8,123,700, nor on the $2,673,048 tax on floor stocks.

LOS ANGELES COUNTY CHILDREN AND FAMILIES FIRST – PROPOSITION 10 COMMISSION
DEMOGRAPHIC DATA AND ECONOMIC STATISTICS 2005-2014
40
Demographic Data2005** 2006** 2007** 2008** 2009*** 2010 (1) 2011 (1) 2012 (1) 2013 (1) 2014 (1)
Total Population 10,185,761 10,216,702 10,252,245 10,341,412 10,449,155 9,824,194 9,862,211 9,945,864 10,010,961 10,082,664
White 2,952,183 2,903,508 2,856,544 2,822,775 2,938,369 2,743,456 2,719,057 2,721,500 2,709,464 2,693,506Black 890,227 876,209 862,622 853,032 882,167 826,260 828,970 830,607 831,808 833,267American Indian 26,072 25,584 25,056 24,588 30,808 19,509 19,619 19,652 19,629 19,658Asian 1,334,812 1,360,995 1,387,824 1,423,826 1,378,338 1,327,692 1,332,691 1,342,581 1,357,306 1,373,175Native Hawaiian & Other Pacific Islander 27,266 27,544 27,773 28,137 29,001 23,191 23,103 23,277 23,433 23,579Hispanic or Latino 4,751,677 4,807,354 4,864,925 4,944,987 5,008,069 4,702,784 4,753,038 4,818,170 4,874,755 4,940,756Other n/a n/a n/a n/a n/a n/a n/a n/a n/a n/aMulti-race 203,524 215,509 227,501 244,067 182,403 181,302 185,733 190,077 194,566 198,723
Female 5,097,968 5,123,747 5,151,888 5,195,931 5,266,592 4,980,734 4,998,722 5,039,635 5,071,249 5,105,963 Male 5,087,793 5,092,955 5,100,357 5,145,481 5,182,563 4,843,460 4,863,489 4,906,229 4,939,712 4,976,701
Under 5 years 765,652 742,159 728,334 731,216 716,228 644,882 645,529 645,026 644,356 658,930 5-9 years 796,592 760,560 732,624 735,376 744,818 631,973 625,415 632,530 637,383 638,471 10-14 years 935,203 902,600 852,918 802,998 769,538 674,968 658,984 648,192 638,396 631,525 15-19 years 749,867 820,767 885,245 926,946 870,100 749,322 732,741 716,854 700,066 683,907 20-24 years 604,700 647,886 690,477 712,834 725,816 751,717 755,888 758,178 759,628 757,233 25-29 years 546,918 580,169 621,590 647,647 677,682 758,633 762,396 756,706 754,773 755,997 30-39 years 1,488,217 1,417,302 1,352,485 1,307,857 1,420,833 1,429,814 1,429,718 1,441,415 1,454,389 1,466,136 40-49 years 1,619,676 1,604,965 1,582,764 1,578,500 1,592,529 1,421,700 1,418,870 1,423,408 1,416,725 1,408,130 50-59 years 1,199,203 1,234,103 1,259,906 1,295,706 1,315,677 1,229,799 1,253,379 1,281,390 1,303,781 1,321,414 60-69 years 700,827 722,021 754,663 794,316 827,207 784,117 817,011 856,522 891,983 930,186 70-79 years 461,665 459,992 459,524 465,714 466,110 439,892 447,281 462,564 479,911 497,179 80+ years 317,241 324,179 331,715 342,302 322,617 307,377 314,999 323,079 329,570 333,556
Source:** State of California, Department of Finance, E-3 Race / Ethnic Population Estimates with Age and Sex Detail, 2000–2008. Sacramento, CA, June 2010.*** State of California, Department of Finance, Race/Ethnic Population with Age and Sex Detail, 2000–2050. Sacramento, CA, July 2007. (data are projections calculated between census surveys)(1) State of California, Department of Finance, Population Projections for California and Its Counties 2010-2060. Sacramento, CA, January 2013. (These data supersede the previously used data source.)
Economic Data2005 2006 2007 2008 2009 2010 2011 2012 2013 2014
LA County Personal Income 357,594,039 384,722,373 398,281,877 410,482,294 395,372,354 404,473,004 425,673,042 455,788,782 466,098,988 N/ALA County Per Capita Personal Income 36,540 39,508 41,058 42,165 40,396 41,163 43,062 45,800 46,506 N/A
California Personal Income 1,395,992,214 1,499,308,841 1,564,289,335 1,596,229,973 1,537,094,676 1,578,553,439 1,685,635,498 1,805,193,769 1,856,614,186 1,944,369,223 California Per Capita Personal Income 38,964 41,623 43,152 43,608 41,587 42,282 44,749 47,505 48,434 50,109
United States Personal Income 10,605,595,000 11,376,405,000 11,990,104,000 12,429,234,000 12,080,223,000 12,417,659,000 13,189,935,000 13,873,161,000 14,151,427,000 14,708,582,165 United States Per Capita Personal Income 35,888 38,127 39,804 40,873 39,379 40,144 42,332 44,200 44,765 46,129
Source:Bureau of Economic Analysis: http://www.bea.gov/iTable/iTable.cfm?reqid=70&step=1&isuri=1&acrdn=4 (Tables SA1-3 and CA1-3)Personal income data are shown in thousands of dollars; per capita income data are shown in dollars.2014 economic data is not yet available for Los Angeles County
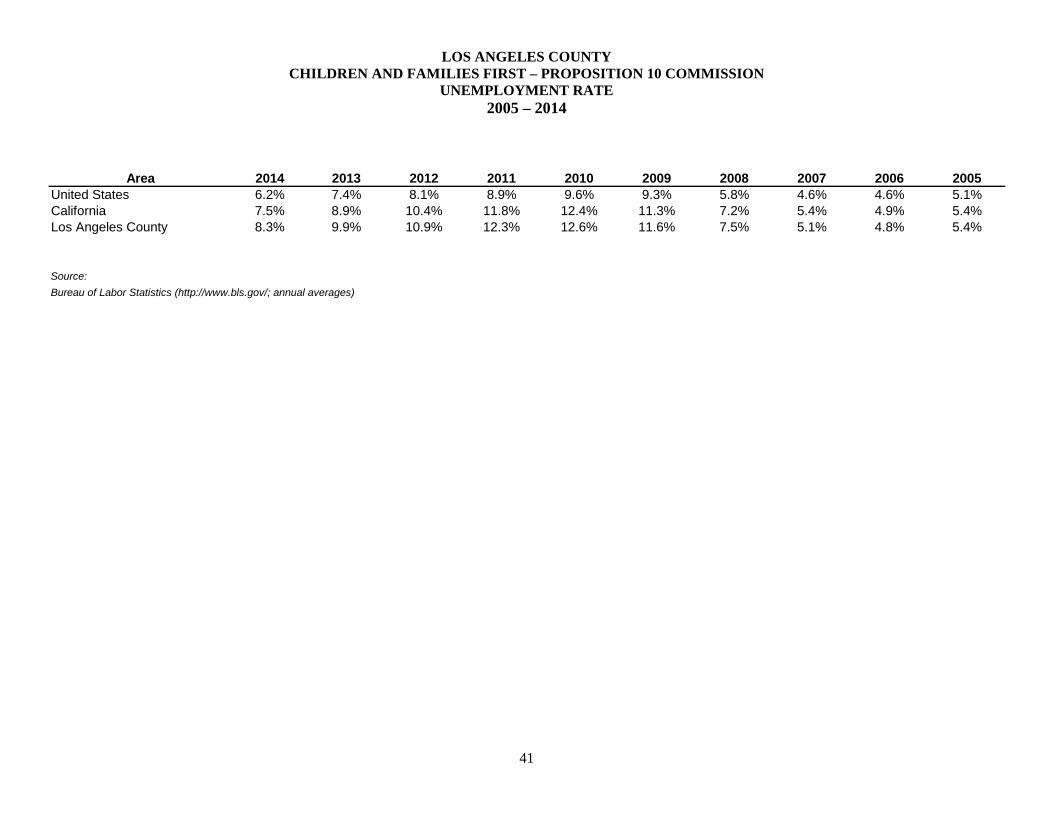
LOS ANGELES COUNTY CHILDREN AND FAMILIES FIRST – PROPOSITION 10 COMMISSION
UNEMPLOYMENT RATE 2005 – 2014
41
Area 2014 2013 2012 2011 2010 2009 2008 2007 2006 2005United States 6.2% 7.4% 8.1% 8.9% 9.6% 9.3% 5.8% 4.6% 4.6% 5.1%California 7.5% 8.9% 10.4% 11.8% 12.4% 11.3% 7.2% 5.4% 4.9% 5.4%Los Angeles County 8.3% 9.9% 10.9% 12.3% 12.6% 11.6% 7.5% 5.1% 4.8% 5.4%
Source:Bureau of Labor Statistics (http://www.bls.gov/; annual averages)
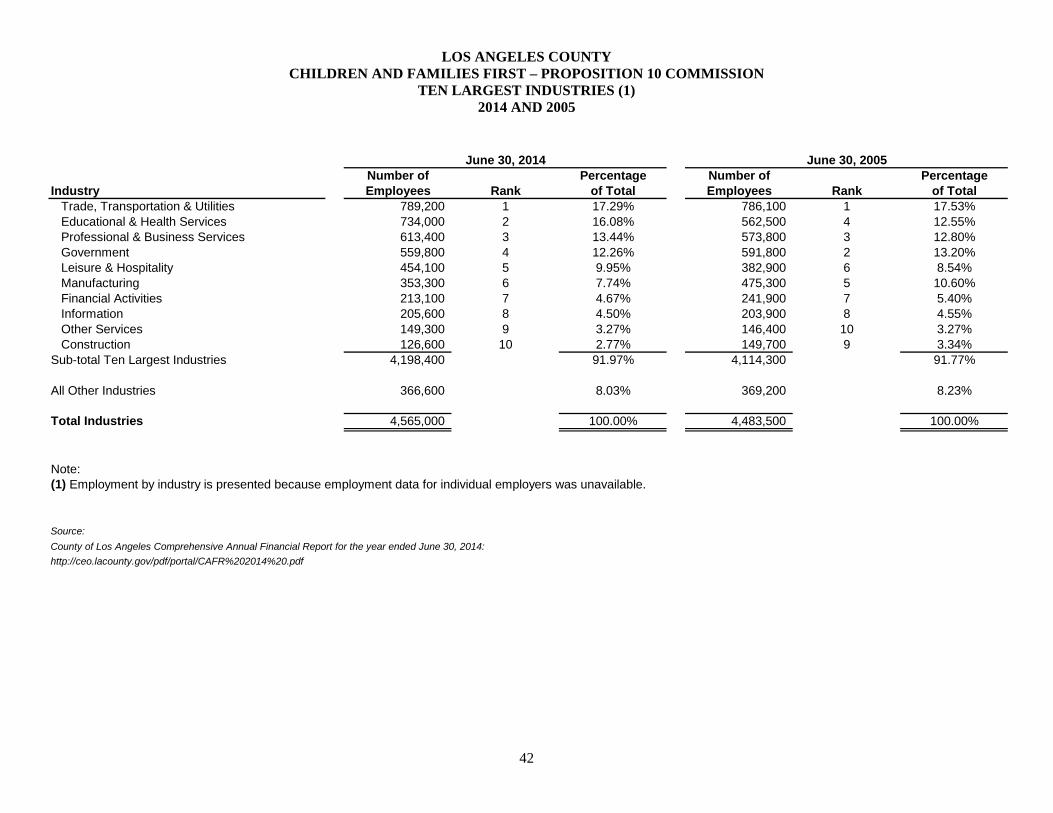
LOS ANGELES COUNTY CHILDREN AND FAMILIES FIRST – PROPOSITION 10 COMMISSION
TEN LARGEST INDUSTRIES (1) 2014 AND 2005
42
Number of Percentage Number of PercentageIndustry Employees Rank of Total Employees Rank of Total
Trade, Transportation & Utilities 789,200 1 17.29% 786,100 1 17.53%Educational & Health Services 734,000 2 16.08% 562,500 4 12.55%Professional & Business Services 613,400 3 13.44% 573,800 3 12.80%Government 559,800 4 12.26% 591,800 2 13.20%Leisure & Hospitality 454,100 5 9.95% 382,900 6 8.54%Manufacturing 353,300 6 7.74% 475,300 5 10.60%Financial Activities 213,100 7 4.67% 241,900 7 5.40%Information 205,600 8 4.50% 203,900 8 4.55%Other Services 149,300 9 3.27% 146,400 10 3.27%Construction 126,600 10 2.77% 149,700 9 3.34%
Sub-total Ten Largest Industries 4,198,400 91.97% 4,114,300 91.77%
All Other Industries 366,600 8.03% 369,200 8.23%
Total Industries 4,565,000 100.00% 4,483,500 100.00%
Note:(1) Employment by industry is presented because employment data for individual employers was unavailable.
Source:County of Los Angeles Comprehensive Annual Financial Report for the year ended June 30, 2014:http://ceo.lacounty.gov/pdf/portal/CAFR%202014%20.pdf
June 30, 2014 June 30, 2005

LOS ANGELES COUNTY CHILDREN AND FAMILIES FIRST – PROPOSITION 10 COMMISSION
CAPITAL ASSETS STATISTICS
43
Capital Assets (Land, Building, Furniture & Equipment) are used by the Commission for general operating and administrative function. The Commission has only one (1) centrally located building supported by other capital assets.

LOS ANGELES COUNTY CHILDREN AND FAMILIES FIRST – PROPOSITION 10 COMMISSION
AUTHORIZED POSITIONS BY FUNCTION
44
Functional Area 2015 (4) 2014 (3) 2013 (2) 2012 (1) 2011 (1)
Executive 4.5 5.5 3 2 2Administration 34.5 34 35 33 29Programs 101.5 91.5 92 91 96
Total 140.5 131 130 126 127
Note:(1) Data are budgeted authorized positions approved as part of the fiscal year budget. Prior toFY 2010-11, positions were reported by department only, and not according to functional area.
Source:(1) First 5 LA Approved FY 2011-12 Operating Budget (FY 2010-11 data were included for comparison purposes)(2) First 5 LA Approved FY 2012-13 Operating Budget(3) First 5 LA Approved FY 2013-14 Operating Budget(4) First 5 LA Approved FY 2014-15 Operating Budget
Fiscal Year

45
INDEPENDENT AUDITORS' REPORT ON INTERNAL CONTROL OVER FINANCIAL REPORTING AND ON COMPLIANCE AND OTHER MATTERS BASED ON AN AUDIT OF
FINANCIAL STATEMENTS PERFORMED IN ACCORDANCE WITH GOVERNMENT AUDITING STANDARDS
Board of Commissioners Los Angeles County Children and Families First – Proposition 10 Commission Los Angeles, California We have audited, in accordance with the auditing standards generally accepted in the United States of America and the standards applicable to financial audits contained in Government Auditing Standards issued by the Comptroller General of the United States, the financial statements of the governmental activities and the general fund of the Los Angeles County Children and Families First – Proposition 10 Commission (Commission), a component unit of the County of Los Angeles, California, as of and for the year ended June 30, 2015, and the related notes to the financial statements, which collectively comprise the Commission’s basic financial statements, and have issued our report thereon dated October 8, 2015. Internal Control Over Financial Reporting In planning and performing our audit of the financial statements, we considered the Commission’s internal control over financial reporting (internal control) to determine the audit procedures that are appropriate in the circumstances for the purpose of expressing our opinions on the financial statements, but not for the purpose of expressing an opinion on the effectiveness of the Commission’s internal control. Accordingly, we do not express an opinion on the effectiveness of the Commission’s internal control. A deficiency in internal control exists when the design or operation of a control does not allow management or employees, in the normal course of performing their assigned functions, to prevent, or detect and correct, misstatements on a timely basis. A material weakness is a deficiency, or a combination of deficiencies, in internal control, such that there is a reasonable possibility that a material misstatement of the entity’s financial statements will not be prevented, or detected and corrected on a timely basis. A significant deficiency is a deficiency, or a combination of deficiencies, in internal control that is less severe than a material weakness, yet important enough to merit attention by those charged with governance. Our consideration of internal control was for the limited purpose described in the first paragraph of this section and was not designed to identify all deficiencies in internal control that might be material weaknesses or, significant deficiencies. Given these limitations, during our audit we did not identify any deficiencies in internal control that we consider to be material weaknesses. However, material weaknesses may exist that have not been identified.

46
Compliance and Other Matters As part of obtaining reasonable assurance about whether the Commission’s financial statements are free from material misstatement, we performed tests of its compliance with certain provisions of laws, regulations, contracts, and grant agreements, noncompliance with which could have a direct and material effect on the determination of financial statement amounts. However, providing an opinion on compliance with those provisions was not an objective of our audit, and accordingly, we do not express such an opinion. The results of our tests disclosed no instances of noncompliance or other matters that are required to be reported under Government Auditing Standards. Purpose of this Report The purpose of this report is solely to describe the scope of our testing of internal control and compliance and the results of that testing, and not to provide an opinion on the effectiveness of the entity’s internal control or on compliance. This report is an integral part of an audit performed in accordance with Government Auditing Standards in considering the entity’s internal control and compliance. Accordingly, this communication is not suitable for any other purpose.
Rancho Cucamonga, California October 8, 2015

47
INDEPENDENT AUDITORS’ REPORT ON STATE COMPLIANCE
Board of Commissioners Los Angeles County Children and Families First – Proposition 10 Commission Los Angeles, California Compliance We have audited the Los Angeles County Children and Families First – Proposition 10 Commission’s (Commission), a component unit of the County of Los Angeles, California, compliance with the requirements specified in the State of California’s Standards and Procedures for Audits of Local Entities Administering the California Children and Families Act, issued by the State Controller’s Office, applicable to the Commission’s statutory requirements identified below for the year ended June 30, 2015. Management’s Responsibility Management is responsible for compliance with the requirements of the laws and regulations applicable to the California Children and Families Act. Auditors' Responsibility Our responsibility is to express an opinion on the Commission’s compliance with the requirements referred to above based on our audit. We conducted our audit of compliance in accordance with auditing standards generally accepted in the United States of America, the standards applicable to financial audits contained in Government Auditing Standards issued by the Comptroller General of the United States, and the State of California’s Standards and Procedures for Audits of Local Entities Administering the California Children and Families Act, issued by the State Controller’s Office. Those standards and the State of California’s Standards and Procedures for Audits of Local Entities Administering the California Children and Families Act require that we plan and perform the audit to obtain reasonable assurance about whether noncompliance with the requirements referred to above that could have a direct and material effect on the statutory requirements listed below. An audit includes examining, on a test basis, evidence about the Commission’s compliance with those requirements and performing such other procedures as we considered necessary in the circumstances.
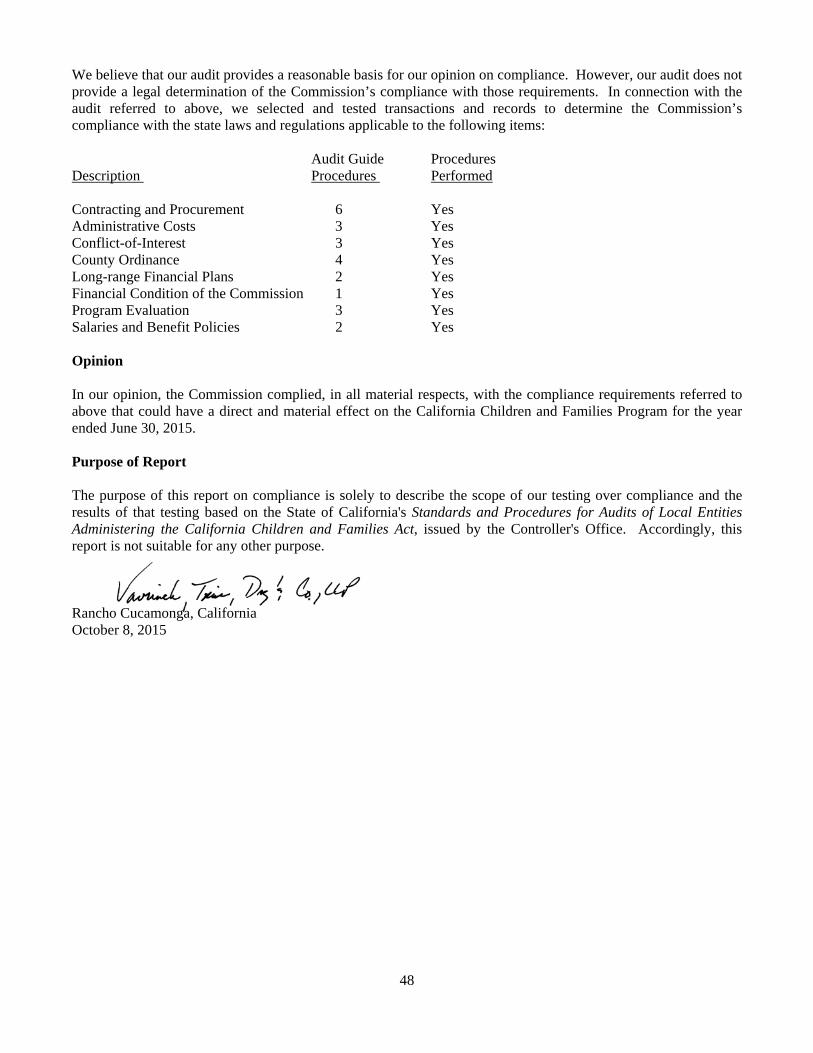
48
We believe that our audit provides a reasonable basis for our opinion on compliance. However, our audit does not provide a legal determination of the Commission’s compliance with those requirements. In connection with the audit referred to above, we selected and tested transactions and records to determine the Commission’s compliance with the state laws and regulations applicable to the following items:
Audit Guide Procedures Description Procedures Performed Contracting and Procurement 6 Yes Administrative Costs 3 Yes Conflict-of-Interest 3 Yes County Ordinance 4 Yes Long-range Financial Plans 2 Yes Financial Condition of the Commission 1 Yes Program Evaluation 3 Yes Salaries and Benefit Policies 2 Yes Opinion In our opinion, the Commission complied, in all material respects, with the compliance requirements referred to above that could have a direct and material effect on the California Children and Families Program for the year ended June 30, 2015. Purpose of Report The purpose of this report on compliance is solely to describe the scope of our testing over compliance and the results of that testing based on the State of California's Standards and Procedures for Audits of Local Entities Administering the California Children and Families Act, issued by the Controller's Office. Accordingly, this report is not suitable for any other purpose.
Rancho Cucamonga, California October 8, 2015