lot 4: industrial and laboratory furnaces and ovens ... · report title: sustainable industrial...
TRANSCRIPT

Page 1 of 469
Business Unit: Integrity
In Association with
Report Title: Sustainable Industrial Policy – Building on the Eco-design Directive – Energy-Using Products Group Analysis / 2 Lot 4: Industrial and Laboratory Furnaces and Ovens – Tasks 1 – 7 Final Report
Authors: ERA: Dr. P. Goodman, Dr. C Robertson and Mr. A. Skarstein BIO: Mr L. Lyons and Mr S. Pahal
Client: European Commission, DG Enterprise Client Reference: ENTR-2009-35
Contract SI2.549003 Report Number: 2012-0230 Project Number: 043122753 Report Version: FINAL Report
Report checked by:
Approved by:
Dr Paul Goodman Senior Consultant
Dr Chris Robertson Head of Regulatory Compliance
12 September 2012
Ref. 043122753 ENTR Lot 4 Final Report v4.doc

ERA Technology Limited ERA Report No. 2012-0230
043122753 ENTR Lot 4 Final Report v6 2 © ERA Technology Ltd
© ERA Technology Limited 2012 All Rights Reserved No part of this document may be copied or otherwise reproduced without the prior written permission of ERA Technology Limited. If received electronically, recipient is permitted to make such copies as are necessary to: view the document on a computer system; comply with a reasonable corporate computer data protection and back-up policy and produce one paper copy for personal use.
Disclaimer The project team does not accept any liability for any direct or indirect damage resulting from the use of this report or its content. This report contains the results of research by the authors and is not to be perceived as the opinion of the European Commission. The European Commission is not responsible for any use that may be made of the information contained therein. Document Control
This document may be distributed freely in whole, without alteration, subject to Copyright.
ERA Technology Limited Cleeve Road Leatherhead Surrey KT22 7SA, England Tel : +44 (0) 1372 367350 Fax: +44 (0) 1372 367359 E-mail: [email protected]
Read more about ERA on our Internet page at: www.era.co.uk/rfa or about this study www.eco-furnace.org

ERA Technology Limited ERA Report No. 2012-0230
043122753 ENTR Lot 4 Final Report v6 3 © ERA Technology Ltd
Executive Summary Industrial and laboratory furnaces and ovens include a very wide variety of equipment. These range from small 1 kWh power laboratory ovens (i.e., that consume less than 1 kWh/hour of electricity), up to a cement kiln that typically consumes 2.2 PJ (0.61 TWh) of primary energy/ year and produces 586,000 tonnes of cement annually. All industrial furnaces and ovens consume very large amounts of energy, most of which in the EU is derived from fossil fuels, and so are significant emitters of greenhouse gases (GHGs), most commonly carbon dioxide via fuels combustion. The EU cement and steel industries each generate about 2% of the EU’s carbon dioxide emissions.
Most furnaces and ovens are used by industry and professionals and there are many different types, most of which are non-standard, or custom designed. Uses include manufacture of metals, metal parts, glass, ceramics such as bricks, cement, food and semiconductors. Smaller ovens and furnaces are used by research and analytical laboratories, schools and colleges (e.g. pottery), hospitals and by a small number of home users for jewellery and pottery.
Task 1 considers the definition and classification of furnaces and ovens reviewed for this eco-design study.
The definition of an oven or furnace unit has been considered as this is important especially for large industrial furnaces and ovens that are often used as integral parts of more complex production processes. A simple definition could be “A furnace or oven is a device whose primary function is to apply heat to the interior of an enclosed chamber to achieve at least 90°C internally”. In some processes the excess heat exhausted from a furnace may be reused either to preheat burner air or feedstock materials (this improves energy efficiency) or it may be used elsewhere for building heating, electricity generation or to preheat materials for a different thermal process. The reuse of energy within a furnace as an integral part of the furnace can reduce energy consumption; energy reuse elsewhere outside the furnace unit may not be considered per se, when calculating the furnace’s energy efficiency,, but this energy reuse at the facility level is no less valid.
There are many ways to classify furnaces and ovens but classifications have been sought that might be important for specification of eco-design requirements, or to facilitate obtaining data that has been used to achieve the objectives of this study. Classifications that have been considered include size, energy source, batch/ continuous and process type. Classifying via industry sector is another useful classification for obtaining sales data, especially for the larger size furnaces and ovens.
There are many European, national and other standards that affect industrial and laboratory furnaces and ovens but very few are concerned with energy consumption or energy efficiency. Notably, ISO is developing a new standard (ISO WD 13579-1) that is a detailed and comprehensive method for the calculation of energy consumption and energy efficiency for any thermal process.
There is a lot of legislation that affects furnaces and ovens, including safety legislation and legislation that controls emissions to air, water and land. The largest types of furnace and oven are covered in the EU by the Industrial Emissions directive (IED) and by the EU greenhouse gas emissions trading scheme (GHG ETS). IED effectively controls emissions of hazardous substances but is not very effective in maximising energy efficiency. Japan has legislation that regulates the energy efficiency of large industrial furnaces.

ERA Technology Limited ERA Report No. 2012-0230
043122753 ENTR Lot 4 Final Report v6 4 © ERA Technology Ltd
The main eco-design impacts of furnaces and ovens are energy consumption with the associated CO2GHG emissions, and the use and potential emissions of hazardous substances. Hazardous substances from larger installations are already regulated by a variety of directives and EU regulations, and so the main opportunity for eco-design benefits lies with energy efficiency improvements. There are a lot of publications that describe energy efficiency improvements achievable with currently-available technologies, some being very significant. It is also clear from discussion with stakeholders that users of furnaces and ovens do not always install the most energy-efficient design, as these are often more expensive than simpler designs with payback times that can be longer than acceptable, in the context of the user’s business model. Payback time can be a misleading metric, and return on investment (ROI) is used during the decision process regarding new large-scale investments in industrial facilities. It should be noted, however, that industry fails to invest in new equipment for many reasons. There are therefore opportunities for energy savings, when comparing furnaces that are supplied to EU users with those designs that could be supplied. The difference is less significant for some of the largest furnaces, where energy costs are a large proportion of production costs; therefore, such large-scale users tend to install the most energy-efficient designs. This difference can be more significant, however, for mid-range furnaces, which are often used by SMEs with limited access to capital, although these financial restrictions can also be an issue with larger enterprises. Energy efficiency is not generally considered as a high priority by users at the smaller-scale end of the market, namely laboratory ovens and furnaces, and information on efficiency and consumption of these models is very limited. This occurs because some manufacturers do not measure the energy efficiency of their products (as energy consumption has not been a priority to users), and in addition – there is still no harmonised measurement method standard in existence.
The initial estimate of potential energy savings from using the best available technology compared to standard designs indicated that this could be as much 100TWh /year, although this was based on very limited data. Much larger energy savings (many hundreds of TWh/y) will eventually be achieved by replacement of the large number of old, inefficient furnaces in the EU by modern efficient designs.
Task 2 considers the furnace and oven market.
This market is very diverse and data on sales of furnaces and ovens are not published. Prodcom Eurostat data is not useful as this does not provide data for numbers of most types of furnace and oven that are placed on the EU market. The only comprehensive source of freely-available published data (stock levels) is from the IPPC directive’s guidance on best available techniques (BREFs) although this is very limited, omitting data for many sectors, and it does not include smaller installations. For some types of furnace, the IPPC BREFs give data on EU energy consumption and an indication of the energy consumption of different types of furnace. As a result, it has been necessary to obtain accurate data from industry. This has required a considerable effort, but eventually has provided sufficient data on sales and stocks in the EU for subsequent tasks of this study.
The largest furnaces and ovens are usually custom designed. These may be designed by furnace manufacturers, furnace design consultants or by the user themselves. Construction may be by a furnace manufacturer, specialist installer or by the user. Medium-size and smaller furnace and oven designs are more often standard models but adapted standard designs or custom designs are also supplied in the EU. These are usually designed and constructed by a furnace or oven manufacturer and many of the smaller models are supplied by distributors. Furnace and oven manufacturers are

ERA Technology Limited ERA Report No. 2012-0230
043122753 ENTR Lot 4 Final Report v6 5 © ERA Technology Ltd
mostly SMEs in the EU although there are some large multinational group companies with subsidiaries that specialise in ovens and furnaces.
Purchase and operating cost data has been obtained from stakeholders and from published sources. Purchase prices vary enormously ranging from over €1 billion for a new blast furnace installation to c.€500 for a small laboratory oven. Users incur costs from energy use as well as from installation, maintenance and, for some furnaces, regular refurbishment is also needed.
Task 3 investigates the technical requirements of users of furnaces and ovens from provision of information, requirements in use, through to disposal.
The information supplied by manufacturers to users depends on the type of furnace / oven with rather more information being available including energy consumption predictions for the largest furnaces and ovens whereas more limited information concentrating on available functions and specifications is provided for laboratory ovens and furnaces.
The requirements of users vary considerably depending on the business sector and the type of furnace or oven. Variables that are important to users include size, throughput, maximum temperature, temperature uniformity and control, price and running costs.
Most furnaces and ovens have very long useful lives with some coke ovens used by the steel industry being over 100 years old although 20 – 30 years life is more typical for most types of industrial furnace and oven. At end of life some materials such as steel are recycled whereas most refractories and insulation material are land-filled although refractories can be recycled for other uses if separated.
Task 4 assesses the environmental impacts and life-cycle costs of base cases.
Two approaches have been used to assess base cases. Laboratory ovens and furnaces are standard designs and models are produced in relatively large numbers. Thus it follows that the standard MEEUP EcoReport approach is suitable and therefore was used. Large industrial furnaces and ovens are all custom designed, and it is very difficult to define representative examples. There are also relatively few of some of the largest designs sold; instead, many large furnaces are regularly refurbished.
Many mid-size furnaces and ovens are custom designed and there are also standard models of several types. Base case analyses of industrial furnaces and ovens have been carried out using MEEUP, in order to calculate EU-27 impacts, but using selected designs, and estimated average annual energy consumption values. As might be expected, the largest impacts are due to energy consumption in the use phase. Current technology types used for furnaces and ovens being sold in the EU are described, together with the differences in designs that affect environmental impacts. Seven base cases were selected for analysis: • BC1 Laboratory ovens • BC2 Medium-sized industrial batch oven • BC3 Medium-sized industrial continuous oven • BC4 Medium-sized industrial batch furnace
• BC5 Medium-sized industrial continuous furnace • BC6 Large-size industrial furnace • BC7 Large-size industrial oven.

ERA Technology Limited ERA Report No. 2012-0230
043122753 ENTR Lot 4 Final Report v6 6 © ERA Technology Ltd
Task 5 contains a technical analysis of Best Available Technologies (BAT) and Best Not yet Available Technologies (BNAT).
The BAT and BNAT of industrial and laboratory furnaces and ovens has been investigated and is described here. Historical changes made by the furnace industry, current stocks of furnaces and ovens and future developments are all described. The main best available technical aspects that affect eco-design include: (i) novel designs of heat sources, such as self-regenerative gas burners; (ii) low thermal conductivity insulation; (iii) heat recovery techniques, and (iv) advanced process control. Technical aspects of furnaces and ovens that affect energy consumption, CO2 emissions and hazardous substances are all reviewed. Manufacturers of larger furnaces and ovens have been and are continuing to carry out research into novel designs that are more energy efficient and these are described in this report. However there are limitations on what will be possible as all processes require a certain amount of energy even if they are 100% efficient and so the approaches that are being considered to reduce emissions of carbon dioxide are also investigated. Current BAT designs, and related performance levels, have been determined by collecting data on the performance of several parameters that reflect the main energy losses from furnaces and ovens. These data show that significant reductions in energy consumption are achievable, although industry has many technical and financial constraints that limit these improvements.
Task 6 determines the improvement potential of eco-design options. A sensitivity analysis is also carried out
Ecodesign options have been determined from the performance parameter data provided by stakeholders. Heat recovery, insulation and gas / air ratio based on BAT performance parameters from stakeholders and some intermediate levels have been considered as eco-design options. The cost of achieving the ecodesign options has been determined from a variety of sources and these, along with the potential energy savings determined in Task 5, have been used to calculate life-cycle costs for the ecodesign options and also certain combinations of options. Sensitivity analyses have been carried out to determine the effect on the main environmental impact and LCC due to: product price, product lifetime, annual energy consumption, energy tariffs, discount rate, product stock, installation costs and quantity of materials used for construction. Energy tariffs have a significant impact on LCC.
Task 7 comprises a policy and impact analysis
The impact of ecodesign options and other potential policy options is determined in Task 7. Reductions in GHG emissions and energy consumption by 2035 beyond BaU from BAT and LLCC options have been determined for all seven base cases.
The energy saving potential of industrial ovens and furnaces (BC2 – BC7) was assessed for the following three scenarios against the Business as Usual (BaU) scenario (assumes that products on the market do not include any new improvement options in future):

ERA Technology Limited ERA Report No. 2012-0230
043122753 ENTR Lot 4 Final Report v6 7 © ERA Technology Ltd
• Policy recommendation scenario: assumes the full implementation of three Tiers of Minimum Energy Performance Standards - MEPS (1st Tier in 2014, 2nd Tier in 2018 and 3rd Tier in 2024)
• Least Life-Cycle Cost (LLCC) scenario: assumes that the LLCC options for all product categories are implemented from 2014.
• Best Available Technology (BAT) scenario: assumes that the BAT options are implemented from 2014.
These savings would be achieved using three eco-design options in three tiers, as follows:
Ecodesign options
Tier 1 (from 2014 onwards)
Tier 2 (from 2018 onwards)
Tier3 (from 2024 onwards)
Heat recovery
For BC6 and BC7 only – energy saving and cost is
half of total difference between BaU and BAT
For all industrial, energy saving and cost is half of total difference between
BaU and BAT
BAT
Insulation Same as BaU BAT BAT Gas/ air For BC2 – BC7, energy
saving and cost is half of total difference between
BaU and BAT
BAT BAT
The energy saving potential of the laboratory ovens (BC 1) was only assessed for the LLCC and BAT scenarios. The projected total electricity savings between 2011 and 2035 for all the base cases (BC1 – BC7) for the three scenarios are presented in the table below.
Final Energy Electricity savings over the period 2011-2035 (TWh) Ecodesign Options Policy
recommendation scenario
LLCC scenario BAT scenario
BC1 - 0.4 0.4 BC2 16 23 23 BC3 2 3 3 BC4 14 20 20 BC5 2 2 2 BC6 - - -BC7 - - - TOTAL BC1 – BC7: Final Energy
34 48.4 48.4
TOTAL BC1 – BC7: Primary Energy *
85 121 121
* Average EU-wide electricity generation factor of 2.5 is used to convert Final energy to Primary Energy (the energy derived from primary fuels in order to generate the output electricity to the grid).
ERA Technology Limited ERA Report No. 2012-0230
043122753 ENTR Lot 4 Final Report v6 8 © ERA Technology Ltd
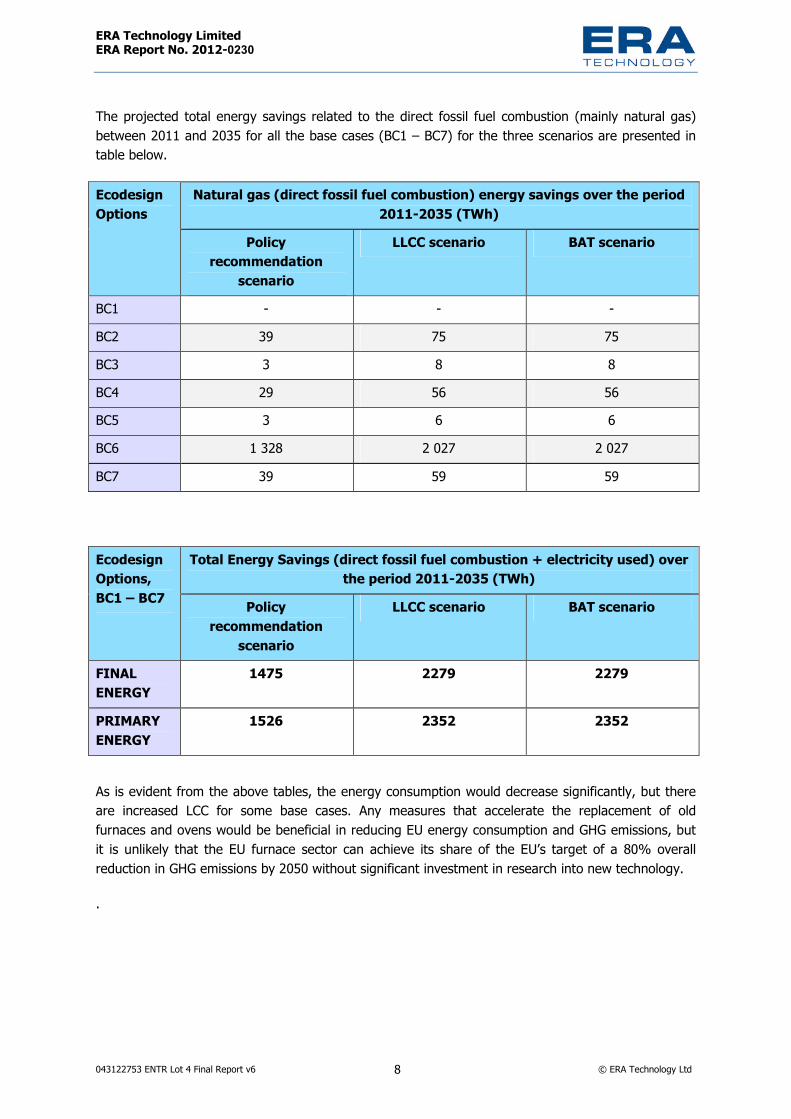
The projected total energy savings related to the direct fossil fuel combustion (mainly natural gas) between 2011 and 2035 for all the base cases (BC1 – BC7) for the three scenarios are presented in table below.
Natural gas (direct fossil fuel combustion) energy savings over the period 2011-2035 (TWh)
Ecodesign Options
Policy recommendation
scenario
LLCC scenario BAT scenario
BC1 - - - BC2 39 75 75 BC3 3 8 8 BC4 29 56 56 BC5 3 6 6 BC6 1 328 2 027 2 027 BC7 39 59 59
Total Energy Savings (direct fossil fuel combustion + electricity used) over the period 2011-2035 (TWh)
Ecodesign Options, BC1 – BC7 Policy
recommendation scenario
LLCC scenario BAT scenario
FINAL ENERGY
1475 2279 2279
PRIMARY ENERGY
1526 2352 2352
As is evident from the above tables, the energy consumption would decrease significantly, but there are increased LCC for some base cases. Any measures that accelerate the replacement of old furnaces and ovens would be beneficial in reducing EU energy consumption and GHG emissions, but it is unlikely that the EU furnace sector can achieve its share of the EU’s target of a 80% overall reduction in GHG emissions by 2050 without significant investment in research into new technology.
.

ERA Technology Limited ERA Report No. 2012-0230
043122753 ENTR Lot 4 Final Report v6 9 © ERA Technology Ltd
Contents Page No.
0. Introduction 20 0.1 Scope of study - definition of furnaces and ovens 22 0.2 Eco-design impacts of ovens and furnaces 22 0.3 Energy consumption and efficiency 23
1. Task 1 - Definition 27 1.1. Product definition 28
1.1.1 Definitions from standards and legislation 33 1.1.2 New, rebuilt and refurbished equipment 35
1.2. Product classification 37 1.2.1 Prodcom categories 53 1.2.2 Other classifications 54 1.2.3 Definition by industry sector 54
1.3. Primary production performance parameters: units used 60 1.4. Measurement and other standards 61
1.4.1 Standards at community level 61 1.4.2 Standards at Member State level within the EU 63 1.4.3 Third country standards 64
1.5. Existing legislation 67 1.5.1 Legislation and agreements at EU level 67 1.5.2 Legislation at Member State level 76 1.5.3 Third country legislation 78
1.6. First screening of the volume of sales and trade, environmental impact and potential for improvement of the products 82
2. Task 2 – Economic and Market Analysis 83 2.1. Generic economic data 83 2.2. Market and stock data 86
2.2.1 Annual sales and current stocks 88 2.2.2 Industry financial estimates of EU oven and furnace production and consumption 94 2.2.3 Installed ovens’ and furnaces’ average product life 95 2.2.4 Energy consumption 96
2.3. Market channels and production structures 97 2.3.1 Laboratory and smaller- medium size industrial ovens and furnaces 97 2.3.2 Large-scale furnaces and ovens 100
2.4. User expenditure base data 102 2.4.1 Purchase costs 103 2.4.2 Operating costs 106
3. Task 3 – User requirements 114 3.1. User information 114
3.1.1 Information on products 115 3.2. User behaviour in the use phase 116
3.2.1 Furnace and oven operational issues 124 3.3. End of life behaviour 126
4. Task 4 – Assessment of Base Cases 128 4.1. Approach specific to ENTR Lot 4 128
Click heading to go to any section �

ERA Technology Limited ERA Report No. 2012-0230
043122753 ENTR Lot 4 Final Report v6 10 © ERA Technology Ltd
4.1.1 Base Case 1: Laboratory Ovens and Furnaces 130 4.1.2 Base Cases 2 – 5: Small and medium-size industrial 131 4.1.3 Base Cases 6 and 7: Large industrial Furnaces and Ovens 135
4.2. Product-specific inputs 139 4.2.1 Production phase 139 4.2.2 Design of furnace and oven components 145 4.2.3 Furnace and oven design – impact on energy consumption 178 4.2.4 Distribution phase 186 4.2.5 Use phase 186 4.2.6 End of life phase 192
4.3. Hazardous substances 192 4.3.1 Production phase 192 4.3.2 Use phase 193 4.3.3 End of life 193
4.4. Definition of Base Cases 194 4.4.1 Laboratory ovens 194 4.4.2 Small and medium-size industrial 195 4.4.3 Large industrial furnaces and ovens 200
4.5. Base case environmental impact assessment 203 4.5.1 Base case 1: Laboratory oven 204 4.5.2 Base case 2: Medium-sized Industrial Batch Oven (MIBO) 206 4.5.3 Base case 3: Medium-sized Industrial Continuous Oven (MICO) 211 4.5.4 Base case 4: Medium-sized Industrial Batch Furnace (MIBF) 215 4.5.5 Base case 5: Medium-sized Industrial Continuous Furnace (MICF) 220 4.5.6 Base case 6: Large Industrial Furnace (brick kiln) 224 4.5.7 Base case 7: Large Industrial Oven (drying oven: bricks and tiles) 227
4.6. Base case Life-Cycle Costs 230 4.7. EU-27 total impact 232 4.8. Task 4 - Conclusions 237
5. Task 5 – Technical Analysis of BAT and BNAT 238 5.1. Definition of BAT 239
5.1.1 Historical eco-design technology developments 239 5.1.2 Improvement potential for BAT insulation 245 5.1.3 Improvement potential from heat recovery 246 5.1.4 Improvement potential from BAT heat sources 247 5.1.5 Improvement potential for process control 247 5.1.6 Improvement potential by changing from batch to continuous processes 247 5.1.7 Improvement potential from other design changes 248
5.2. Improvement potential for BAT designs of industrial and laboratory furnaces and ovens 248 5.2.1 Large furnaces and ovens: best new and refurbished designs 248 5.2.2 BAT medium-size industrial furnace and oven design 256 5.2.3 BAT laboratory furnace and oven design 258 5.2.4 BAT designs for base cases 259
5.3. Performance parameters of EU furnaces and ovens 269 5.3.1 Performance parameter conclusions 284
5.4. Definition of BNAT 292 5.4.1 Cement 293 5.4.2 Steel manufacture 295 5.4.3 Glass 298 5.4.4 Ceramics 299 5.4.5 Non-ferrous metals 299 5.4.6 Other industrial processes 300 5.4.7 Laboratory ovens and furnaces 300

ERA Technology Limited ERA Report No. 2012-0230
043122753 ENTR Lot 4 Final Report v6 11 © ERA Technology Ltd
5.4.8 Other BNAT technologies 300 5.4.9 Other methods of reducing energy consumption 301
5.5. Conclusions – improvement potential 302 5.6. Technical constraints and barriers to improvements of environmental performance 306
5.6.1 Laboratory furnaces and ovens 306 5.6.2 Industrial furnaces and ovens 307 5.6.3 Financial reasons for lack of investment 316
5.7. Environmental impact indicators 318 5.8. Correlation between energy consumption and emissions 319
6. Task 6 Improvement Potential 322 6.1. Identification of design options 322
6.1.1 BC1: Laboratory oven/ furnace eco-design options 324 6.1.2 BC 2 – 7 Industrial furnaces and ovens 326 6.1.3 Legislation and standards available regarding eco-design options 344 6.1.4 How will market forces address eco-design options 349 6.1.5 Effect of eco-design options on new designs 354 6.1.6 Size of disparity between products on the EU market and the eco-design options 358
6.2. Analysis BAT and LLCC 361 6.2.1 Base case 1: Laboratory ovens 364 6.2.2 Base case 2a: Medium Industrial Batch Oven - electric 366 6.2.3 Base case 2b: Medium Industrial Batch Oven - gas 369 6.2.4 Base case 3a: Medium Industrial Continuous Oven - electric 373 6.2.5 Base case 3b: Medium Industrial Continuous Oven - gas 375 6.2.6 Base cases 4a: Medium Industrial Batch Furnace - electric 379 6.2.7 Base case 4b: Medium Industrial Batch Furnace - gas 381 6.2.8 Base cases 5a: Medium Industrial Continuous Furnace - electric 385 6.2.9 Base case 5b: Medium Industrial Continuous Furnace - gas 387 6.2.10 Base case 6: Large Industrial Furnace - gas 391 6.2.11 Base case 7: Large Industrial Oven - gas 395
6.3. Analysis of BNAT 399 6.4. Sensitivity analysis of main parameters 401
6.4.1 Assumptions related to product price 402 6.4.2 Assumptions related to product lifetime 404 6.4.3 Assumptions related to the annual energy (electricity/natural gas) consumption 408 6.4.4 Assumptions related to the energy (electricity/natural gas) tariff 412 6.4.5 Assumptions related to the discount rate 417 6.4.6 Assumptions related to product stock 421 6.4.7 Assumptions related to installation cost 422 6.4.8 Assumptions related to the quantity of materials used for construction 424
6.5. System improvement 425 6.6. Conclusions of the sensitivity analysis 425
7. Task 7 – Policy and impact analysis 426 7.1. Policy Analysis 428 7.2. Scenario Analysis 430
7.2.1 Base Case 1 (Laboratory ovens) 430 7.2.2 Base Case 2 – Base Case 7 (industrial ovens and furnaces) 433 7.2.3 Other policy options 457 7.2.4 Qualitative hazardous substance policy options 462
7.3. Impact Analysis 464
ERA Technology Limited ERA Report No. 2012-0230
043122753 ENTR Lot 4 Final Report v6 12 © ERA Technology Ltd
Tables List Page No.
Table 1. Examples of furnaces and ovens used exclusively in either laboratories or industry settings 32 Table 2. Standards that categorise and define furnaces and ovens 33 Table 3. Definitions of furnaces and ovens from standards and EU legislation 34 Table 4. Examples of furnace and oven designs and the capacity and energy consumption by size classification. 38 Table 5. Main energy sources used in furnaces and ovens 44 Table 6. Classification of furnaces and ovens into the four main design types showing typical shapes of heated
enclosures 45 Table 7. Basic designs of furnaces and ovens 46 Table 8. Examples of common types of furnace and oven and their main uses 48 Table 9. Prodcom categories that include furnaces and ovens 53 Table 10. Examples of types of furnace and oven used by main industry sectors 55 Table 11. European standards for furnaces and ovens 61 Table 12. Standards at Member State level for furnaces and ovens 63 Table 13. Standards from outside EU for furnaces and ovens 64 Table 14. Refractory and thermal insulation standards 66 Table 15. EU legislation applicable to furnaces and ovens (in date order) 67 Table 16. Scope of industry sectors with BAT Guidance under the Industrial Emissions Directive and industries
regulated by the EU ETS Regulation 71 Table 17. National emission limits for refractory ceramic fibres in EU Member States 77 Table 18. Maximum outer surface temperature as specified by Japanese Energy Act 78 Table 19. Burner air ratios (λ values) by fuel and furnace type (Japanese Energy Act) 79 Table 20. Waste heat recovery requirements (Japanese Energy Act) 80 Table 21. Number and value of exports, imports and production of furnace burners for liquid fuel in EU, 2008 84 Table 22. Production of electric and non-electric bakery and biscuit ovens in EU, 2008 85 Table 23. Volume and value of exports, imports and production of non-electric industrial or laboratory furnaces and
ovens in EU, 2008 86 Table 24. Numbers of installations with furnaces and ovens in EU from IPPC BREF guidance 87 Table 25. Estimated current and future EU sales of furnaces and ovens and current stocks by sector 88 Table 26. Sources of sales and stock data 90 Table 27. Estimated EU annual sales, stock levels and numbers refurbished of furnaces and ovens based on data from
stakeholders, IPPC BREFs and other sources 92 Table 28. Average characteristics of small and medium size industrial furnaces and ovens 93 Table 29: Sales and stock of small / medium-sized industrial furnaces and ovens 93 Table 30. EU State production of furnaces and ovens 2008 94 Table 31. Average lifetimes of examples of furnaces and ovens in the EU 95 Table 32. Calculated energy consumption by furnaces and ovens by main industry sectors and type of energy source
used 96 Table 33. Laboratory furnace and oven manufacturers 98 Table 34. Small – medium size industrial furnace and oven manufacturers 98 Table 35. Suppliers of component parts of furnaces and ovens 100 Table 36. Manufacturers of large furnaces and ovens. 101 Table 37. Selected illustrative examples of price, throughput or capacity of ovens and furnaces and for some larger
installations 103 Table 38. The evolution of electricity rates between mid-2007 and mid-2009 for customers (500-2000 MWh) in EU-27
(all taxes included) 106 Table 39. Electricity rates in the first semester of 2009 according to tax breakdown in EU-27 for average industrial
consumers (500 – 2000MWh) 106 Table 40. Natural gas rates (including taxes) for consumers in the consumption band IC (1000-10000 GJ), between
2008 and 2009 in EU-27 (taxes included) 107 Table 41. Natural gas tax rates for consumers in the range 1000-10000 GJ, between 2008 and 2009 in EU-27 107 Table 42. Average EU Coal price without VAT based on 18 Member States, in June 2005 108 Table 43. Fuel prices without VAT from 2006 to 2009 based on weekly spot price history of distillate heating oil
excluding taxes (in €/GJ) 108 Table 44. Summary of the rates used for energy in this study 109 Table 45. Water consumption and effective rate for eight European cities 111

ERA Technology Limited ERA Report No. 2012-0230
043122753 ENTR Lot 4 Final Report v6 13 © ERA Technology Ltd
Table 46. EU-27 interest rates 112 Table 47. EU-27 annual inflation rates (%) 112 Table 48. User expenditure base data 113 Table 49 User data for furnace and oven use per day and per year 117 Table 50 Extent and frequency of refurbishment of ovens and furnaces 127 Table 51. Size classifications used for base case assessment 128 Table 52. Stocks, sales, average energy consumption, estimated improvement potential of laboratory equipment 130 Table 53. Examples of standard medium-size designs and designs that would be regarded as being BAT 131 Table 54. Sales, stocks and energy consumption of small and medium size industrial furnaces and ovens 135 Table 55. Data used for calculation of average large furnace and oven energy consumption 138 Table 56. Average energy consumption of the main types of cement kilns and the proportion of each used in the EU
(source: IPPC BREF guide) 139 Table 57. Numbers of cement installations in the EU by type of kiln (source: Cembureau) 140 Table 58. Numbers of lime kilns in used in EU by type (source: 2009 draft IPPC BREF guide) 140 Table 59. Numbers and types of glass melting furnaces of >20 tonnes per day (all types of glass). (Source: draft IPPC
BREF 2009) 141 Table 60. The main types of container glass melting furnace, numbers in EU in 2005 and average energy consumption
(source: draft IPPC BREF) 142 Table 61. Main types of kiln used in EU for ceramics manufacture (data from IPPC BREF and from stakeholders) 143 Table 62. Furnace designs used for aluminium scrap processes (note electric furnace energy consumption are kWh of
electricity which is not primary energy) 144 Table 63. Important characteristics of dense refractory and of insulation materials used in furnaces and ovens 146 Table 64. Thermal conductivity and advantages and disadvantages of a selection of thermally insulating materials (data
from various sources) 148 Table 65. Specific heat capacity of three types of furnace refractory and insulation 150 Table 66. Furnace materials based on chemical composition 150 Table 67. Comparison of refractory brick insulation with lightweight insulation 152 Table 68. Comparison of dense fire brick insulation with HTIW insulation 152 Table 69. Main heat sources and fuels used in furnaces and ovens 154 Table 70. Energy per mole CO2 for fossil fuels and energy per kg fuel 155 Table 71. Dependence on fuel carbon content of flame emissivity. 157 Table 72. Impact of use of hot burner air on gas consumption and size of investment for a furnace operating at c.
1100°C 158 Table 73. Furnace energy consumption per tonne of aluminium melted using different types of gas burner (data from
stakeholder) 159 Table 74. Fuel saved through preheating combustion air (natural gas with 10% excess air) 161 Table 75. Cost and payback periods for recuperative and regenerative burners 165 Table 76. Heat balance for typical electric arc furnace. 170 Table 77. Examples of laboratory oven ventilation data 181 Table 78. Impact of kiln furniture on energy consumption of ceramic kiln used for porcelain production 182 Table 79. Examples of the best energy efficiencies currently achieved by new large furnaces 191 Table 80. Composition of a laboratory oven, by category of material 194 Table 81. Base cases for modelling small to medium-size industrial ovens and furnaces 196 Table 82: Main characteristics of medium-sized industrial Base cases 197 Table 83. Composition of the Medium-sized Industrial Base cases, by category of material 197 Table 84. Package volume of Medium-sized Industrial Base cases 198 Table 85: Inputs for the use phase of Medium-sized industrial Base cases 198 Table 86. Economic inputs for the Medium-sized Industrial Base cases 199 Table 87: Main characteristics of large industrial base cases 201 Table 88. Composition of the large industrial furnace and oven base cases, by category of material 201 Table 89. Packaged volume of large industrial base cases 202 Table 90: Inputs for the use phase of large industrial base cases 202 Table 91. Economic inputs for the large industrial furnaces and ovens base cases 203 Table 92. Life-cycle analysis of Base case 1 using the EcoReport tool 204 Table 93. Life-cycle analysis of BC2a using the EcoReport tool 206 Table 94. Life-cycle analysis of BC2b using the EcoReport tool 208 Table 95. Life-cycle analysis of BC3a using the EcoReport tool 211

ERA Technology Limited ERA Report No. 2012-0230
043122753 ENTR Lot 4 Final Report v6 14 © ERA Technology Ltd
Table 96. Life-cycle analysis of BC3b using the EcoReport tool 213 Table 97. Life-cycle analysis of BC4a using the EcoReport tool 215 Table 98. Life-cycle analysis of BC4b using the EcoReport tool 217 Table 99. Life-cycle analysis of BC5a using the EcoReport tool 220 Table 100. Life-cycle analysis of BC5b using the EcoReport tool 222 Table 101. Life-cycle analysis of BC6 using the EcoReport tool 224 Table 102. Life-cycle analysis of BC7 using the EcoReport tool 227 Table 103: Life cycle costs of base cases considered in this study (euros) 230 Table 104. Life cycle costs (Euros) for BC6 and BC7, with minimal and high installation costs 231 Table 105. Proportion of life cycle costs due to cost of energy for BC6 and BC7 with minimal and high installation costs 231 Table 106: Annual EU impacts of the stock of laboratory and industrial furnaces and ovens 233 Table 107: Annual EU impacts of sales of laboratory and industrial furnaces and ovens 234 Table 108: Impacts of the laboratory and industrial furnaces and ovens per functional unit (kW)* per year 235 Table 109. Decrease in pollutant emissions from industrial processes in EU since 1990 240 Table 110. Improvements in energy efficiency achieved by industry for industrial furnaces 241 Table 111. WBSCD data for European grey cement production 242 Table 112. WBSCD data for Europe and European countries 243 Table 113. BAT design modifications of steel production furnaces and thermal processes 251 Table 114. Heat losses from three similar sized electric arc furnaces 253 Table 115. Available heat loss data as percentage of input heat for large and medium furnace process characteristics –
gas (fossil fuel) heated 267 Table 116. Drying oven energy consumption (kWh/kg of water) 269 Table 117. Types of furnaces and ovens, throughput, power rating, energy consumption, lifetimes and capacity
utilisation 270 Table 118. Range of flue gas temperature at 3% oxygen and estimated potential energy saving 273 Table 119. Estimated percentage of heat recovered from combustion gases 275 Table 120. Ranges of maximum temperature of external surface of insulation (note that these depend on ambient
temperature and other variables) 277 Table 121. Range of heat loss (in W/m2) from external surface of insulation 279 Table 122. Stakeholder data - range of fossil fuel : air ratio supplied to burners as λ values and stakeholders estimates
of energy saving achievable by superior control 281 Table 123. Energy lost data for water cooling of ovens and furnaces 282 Table 124. Electrically heated ovens and furnaces, range of heat lost in vented air 283 Table 125. Range of energy consumption for drying processes (MJ/kg water evaporated unless stated otherwise) 284 Table 126. Current average and BAT combustion gas temperatures after heat recovery 286 Table 127. Alternative types of silica based cements 293 Table 128. Energy saving from use of scrap materials instead of virgin sources 301 Table 129. Summary of improvement potential of eco-design options of laboratory, medium-size and large industrial
furnaces and ovens 304 Table 130. Main environmental impact indicators and options for their reduction 318 Table 131. Types of furnace and oven that eco-design options are applicable 322 Table 132. Suitability of other design options 324 Table 133. Heat recovery eco-design options from CECOF and based on performance parameter data 329 Table 134. Insulation eco-design options (ambient 20°C) 333 Table 135. Insulation eco-design costs, energy savings and payback periods 336 Table 136. Fuel/ air ratio ecodesign option costs, energy savings and payback periods 339 Table 137. Estimated percent energy savings for BC 2 – BC5 358 Table 138. Calculation used to determine TWh/y energy savings for each medium-size furnace and oven design 359 Table 139. Estimated energy savings for BC6 & BC7 359 Table 140. Eco-design options used for base cases and their suitability 361 Table 141. Estimated proportion of small / medium industrial furnaces and ovens that are appropriate for the relevant
eco-design options, in each case 363 Table 142. Estimated proportion of large industrial furnaces and ovens that are appropriate for eco-design options 363 Table 143: Summary of the cost and benefit effects of implementing individual improvement options for the Base case 364 Table 144: Environmental impacts of the Base case and its improvement options 364 Table 145: Summary of the cost and benefit effects of implementing individual improvement options for the Base case 366 Table 146: Environmental impacts of the Base case and its improvement options 366

ERA Technology Limited ERA Report No. 2012-0230
043122753 ENTR Lot 4 Final Report v6 15 © ERA Technology Ltd
Table 147: Summary of the cost and benefit effects of implementing individual improvement options for the Base case 369 Table 148: Environmental impacts of the Base case and its improvement options 370 Table 149: Summary of the cost and benefit effects of implementing individual improvement options for the Base case 373 Table 150: Environmental impacts of the Base case and its improvement options 373 Table 151: Summary of the cost and benefit effects of implementing individual improvement options for the Base case 375 Table 152: Environmental impacts of the Base case and its improvement options 376 Table 153: Summary of the cost and benefit effects of implementing individual improvement options for the Base case 379 Table 154: Environmental impacts of the Base case and its improvement options 379 Table 155: Summary of the cost and benefit effects of implementing individual improvement options for the Base case 381 Table 156: Environmental impacts of the Base case and its improvement options 382 Table 157: Summary of the cost and benefit effects of implementing individual improvement options for the Base case 385 Table 158: Environmental impacts of the Base case and its improvement options 385 Table 159: Summary of the cost and benefit effects of implementing individual improvement options for the Base case 387 Table 160: Environmental impacts of the Base case and its improvement options 388 Table 161: Summary of the cost and benefit effects of implementing individual improvement options for the Base case 391 Table 162: Environmental impacts of the Base case and its improvement options 392 Table 163: Summary of the cost and benefit effects of implementing individual improvement options for the Base case 395 Table 164: Environmental impacts of the Base case and its improvement options 396 Table 165. Heat recovery performance parameters from stakeholders at 3% oxygen and BNAT Improvement potential 400 Table 166. Insulation performance parameters as W/m2 from stakeholders and BNAT Improvement potential 401 Table 167. Dates for implementation of eco-design option tiers 435 Table 168. LLCC options for base-cases 437 Table 169 BAT improvement options by Base Case 439 Table 170. Cumulative primary energy savings 2011 – 2035 from policy options 441

ERA Technology Limited ERA Report No. 2012-0230
043122753 ENTR Lot 4 Final Report v6 16 © ERA Technology Ltd
Figures List Page No.
Figure 1. Simplified cement production process - boundary of furnace process and furnace itself...........................................30 Figure 2. Iron production in a blast furnace process showing three sources of CO2 ...............................................................31 Figure 3. Examples of medium-size ovens and furnaces ......................................................................................................41 Figure 4. Diagrams showing the basic designs of small / medium electric batch ovens, medium size gas fired tunnel
furnaces and retort (and crucible melting) furnace.....................................................................................................42 Figure 5. Furnace and oven classifications ..........................................................................................................................51 Figure 6. EU15 production (blue) and apparent consumption (pink) of furnaces between 1995 and 2008...............................94 Figure 7. Water prices in Europe......................................................................................................................................110 Figure 8. Water cost break down in the Rhone region of France for 15 years......................................................................111 Figure 9. Relationship between temperature of flue gas and percent energy saving for recuperative burners in a
furnace at 980°C....................................................................................................................................................162 Figure 10. Relationship between cost of capital investment and value of energy saved to determine optimum financial
situation................................................................................................................................................................164 Figure 11. Batch foundry furnace for heating large steel parts ...........................................................................................179 Figure 12. Energy consumption per litre volume of cavity for maintaining maximum temperature of empty laboratory
ovens....................................................................................................................................................................188 Figure 13. Energy consumption per unit volume (litres) of empty laboratory furnaces at maximum rated temperature ..........188 Figure 14. Empty furnaces at 1 000°C, energy consumption relationship with cavity volume................................................189 Figure 15. Distribution of a laboratory oven’s environmental impacts by life-cycle phase .....................................................205 Figure 16. Distribution of BC2a’s environmental impacts by life-cycle phases ......................................................................207 Figure 17. Distribution of BC2b’s environmental impacts by life-cycle phase........................................................................209 Figure 18. Distribution of BC3a’s environmental impacts by life-cycle phase........................................................................212 Figure 19. Distribution of BC3b’s environmental impacts by life-cycle phase........................................................................214 Figure 20. Distribution of BC4a’s environmental impacts by life-cycle phase........................................................................216 Figure 21. Distribution of BC4b’s environmental impacts by life-cycle phase........................................................................218 Figure 22. Distribution of BC4a’s environmental impacts by life-cycle phase........................................................................221 Figure 23. Distribution of BC5b’s environmental impacts by life-cycle phase........................................................................223 Figure 24. Distribution of BC6 environmental impacts by life-cycle phase............................................................................225 Figure 25. Distribution of BC7 environmental impacts by life-cycle phase............................................................................228 Figure 26: Share of EU impacts of the stock .....................................................................................................................236 Figure 27. Flow diagram of a twin shaft regenerative lime kiln (side A is heating, side B is cooling)......................................249 Figure 28. Heat recovery – flue gas temperature ..............................................................................................................285 Figure 29. Energy consumption saving (or loss) from thicker insulation ..............................................................................314 Figure 30: Base case – LCC and electricity costs ...............................................................................................................365 Figure 31: Base case – TEC and LCC ................................................................................................................................366 Figure 32: Base case – LCC and electricity costs ...............................................................................................................368 Figure 33: Base case – TEC (total energy costs) and LCC ..................................................................................................368 Figure 34: Base case 2b – LCC and energy costs...............................................................................................................372 Figure 35: Base case 2b – TEC and LCC ...........................................................................................................................372 Figure 36: Base case – LCC and electricity costs ...............................................................................................................374 Figure 37: Base case – TEC and LCC ................................................................................................................................375 Figure 38: Base case 3b – LCC and energy costs...............................................................................................................378 Figure 39: Base case 3b – TEC and LCC ...........................................................................................................................378 Figure 40: Base case – LCC and electricity costs ...............................................................................................................380 Figure 41: Base case – TEC and LCC ................................................................................................................................381 Figure 42: Base case 4b – LCC and energy costs...............................................................................................................384 Figure 43: Base case 4b – TEC and LCC ...........................................................................................................................384 Figure 44: Base case – LCC and electricity costs ...............................................................................................................386 Figure 45: Base case – TEC and LCC ................................................................................................................................387 Figure 46: Base case 5b – LCC and energy costs...............................................................................................................390 Figure 47: Base case 5b – TEC and LCC ...........................................................................................................................390 Figure 48: Base case 6 – LCC and energy costs ................................................................................................................394 Figure 49: Base case 6 – TEC and LCC .............................................................................................................................394

ERA Technology Limited ERA Report No. 2012-0230
043122753 ENTR Lot 4 Final Report v6 17 © ERA Technology Ltd
Figure 50: Base case 7 – LCC and energy costs ................................................................................................................398 Figure 51: Base case 7 – TEC and LCC .............................................................................................................................398 Figure 52: Product price – variation of LCC compared to base case....................................................................................403 Figure 53: Product price - Share of the product price in the LCC ........................................................................................403 Figure 54: Product lifetime - Variation of the LCC compared to the Base Case ....................................................................404 Figure 55: Product lifetime - Variation of ratio of cost of energy consumption and LCC compared to the Base Case ..............404 Figure 56: Base Case 2b (Medium Industrial Batch Oven – gas) and its improvement options – Impact of lifetime on the
LCC (€) .................................................................................................................................................................405 Figure 57: Base Case 3b (Medium Industrial Continuous Oven – gas) and its improvement options – Impact of lifetime
on the LCC (€).......................................................................................................................................................405 Figure 58: Base Case 4b (Medium Industrial Batch Furnace – gas) and its improvement options – Impact of lifetime on
the LCC (€) ...........................................................................................................................................................406 Figure 59: Base Case 5b (Medium Industrial Continuous Furnace – gas) and its improvement options – Impact of
lifetime on the LCC (€) ...........................................................................................................................................406 Figure 60: Base Case 6 (Large Industrial Furnace – gas) and its improvement options – Impact of lifetime on the LCC
(€) ........................................................................................................................................................................407 Figure 61: Base Case 7 (Large Industrial Oven – gas) and its improvement options – Impact of lifetime on the LCC (€)........407 Figure 62: Annual energy consumption - Variation of the LCC compared to the Base Case ..................................................408 Figure 63: Annual energy consumption - Variation of ratio of cost of energy consumption and LCC compared to the
Base Case .............................................................................................................................................................409 Figure 64: Base Case 2b (Medium Industrial Batch Oven – gas) and its improvement options – Impact of annual energy
consumption on the LCC (€) ...................................................................................................................................409 Figure 65: Base Case 3b (Medium Industrial Continuous Oven – gas) and its improvement options – Impact of annual
energy consumption on the LCC (€)........................................................................................................................410 Figure 66: Base Case 4b (Medium Industrial Batch Furnace – gas) and its improvement options – Impact of annual
energy consumption on the LCC (€)........................................................................................................................410 Figure 67: Base Case 5b (Medium Industrial Continuous Furnace – gas) and its improvement options – Impact of
annual energy consumption on the LCC (€) .............................................................................................................411 Figure 68: Base Case 6 (Large Industrial Furnace – gas) and its improvement options – Impact of annual energy
consumption on the LCC (€) ...................................................................................................................................411 Figure 69: Base Case 7 (Large Industrial Oven – gas) and its improvement options – Impact of annual energy
consumption on the LCC (€) ...................................................................................................................................412 Figure 70: Energy tariff - Variation of the LCC compared to the Base Case .........................................................................413 Figure 71: Energy tariff - Variation of ratio of cost of energy consumption and LCC compared to the Base Case ...................413 Figure 72: Base Case 2b (Medium Industrial Batch Oven – gas) and its improvement options – Impact of energy tariff
on the LCC (€).......................................................................................................................................................414 Figure 73: Base Case 3b (Medium Industrial Continuous Oven – gas) and its improvement options – Impact of energy
tariff on the LCC (€)...............................................................................................................................................414 Figure 74: Base Case 4b (Medium Industrial Batch Furnace – gas) and its improvement options – Impact of energy
tariff on the LCC (€)...............................................................................................................................................415 Figure 75: Base Case 5b (Medium Industrial Continuous Furnace – gas) and its improvement options – Impact of
energy tariff on the LCC (€)....................................................................................................................................415 Figure 76: Base Case 6 (Large Industrial Furnace – gas) and its improvement options – Impact of energy tariff on the
LCC (€) .................................................................................................................................................................416 Figure 77: Base Case 6 (Large Industrial Oven – gas) and its improvement options – Impact of energy tariff on the LCC
(€) ........................................................................................................................................................................416 Figure 78: Discount rate - Variation of the LCC compared to the Base Case........................................................................417 Figure 79: Discount rate - Variation of ratio of cost of energy consumption and LCC compared to the Base Case..................417 Figure 80: Base Case 2b (Medium Industrial batch Oven – gas) and its improvement options – Impact of discount rate
on the LCC (€).......................................................................................................................................................418 Figure 81: Base Case 3b (Medium Industrial Continuous Oven – gas) and its improvement options – Impact of discount
rate on the LCC (€)................................................................................................................................................418 Figure 82: Base Case 4b (Medium Industrial batch Furnace – gas) and its improvement options – Impact of discount
rate on the LCC (€)................................................................................................................................................419 Figure 83: Base Case 5b (Medium Industrial Continuous Furnace – gas) and its improvement options – Impact of
discount rate on the LCC (€)...................................................................................................................................419 Figure 84: Base Case 6 (Large Industrial Furnace – gas) and its improvement options – Impact of discount rate on the
LCC (€) .................................................................................................................................................................420 Figure 85: Base Case 6 (Large Industrial Oven – gas) and its improvement options – Impact of discount rate on the
LCC (€) .................................................................................................................................................................420 Figure 86: Energy consumption (in TWh) of the EU stock of BC 1 to BC 5 ..........................................................................421
ERA Technology Limited ERA Report No. 2012-0230
043122753 ENTR Lot 4 Final Report v6 18 © ERA Technology Ltd
Figure 87: Energy consumption (in TWh) of the EU stock of BC 6 and BC 7........................................................................421 Figure 88: Installation cost - Variation of the LCC compared to the Base Case ....................................................................422 Figure 89: Installation cost - Variation of ratio of cost of energy consumption and LCC compared to the Base Case ..............422 Figure 90: Base Case 6 (Large Industrial Furnace – gas) and its improvement options – Impact of installation cost on
the LCC (€) ...........................................................................................................................................................423 Figure 91: Base Case 7 (Large Industrial Oven – gas) and its improvement options – Impact of installation cost on the
LCC (€) .................................................................................................................................................................423 Figure 92: Quantity of materials used for construction – impact on the environmental impacts of BC 6 and BC 7 ..................424 Figure 93: Comparison of total energy consumption (in TWh) for the two scenarios over the period 2011–2035 for BC 1......431 Figure 94: Comparison of total expenditure (in million Euros) for the two scenarios over the period 2011–2035 for BC 1 ......432 Figure 95: Comparison of GHG emissions (in million tonnes CO2 equivalent) for the two scenarios over the period
2011–2035 for BC 1 ...............................................................................................................................................432 Figure 96: Base case share (in %) of total energy consumption over the period 2011-2035 in BaU scenario.........................433 Figure 97: Base case share (in %) of total expenditure over the period 2011-2035 in BaU scenario .....................................434 Figure 98 Base case share (in %) of total GHG emissions over the period 2011-2035 in BaU scenario..................................434 Figure 99: Base case share (in %) of total energy consumption over the period 2011-2035 in ‘Policy recommendation’
scenario ................................................................................................................................................................435 Figure 100: Base case share (in %) of total expenditure over the period 2011-2035 in ‘Policy recommendation’ scenario ......436 Figure 101: Base case share (in %) of total GHG emissions over the period 2011-2035 in ‘Policy recommendation’
scenario ................................................................................................................................................................436 Figure 102: Base case share (in %) of total energy consumption over the period 2011-2035 in ‘LLCC’ scenario ....................437 Figure 103: Base case share (in %) of total expenditure over the period 2011-2035 in ‘LLCC’ scenario.................................438 Figure 104: Base case share (in %) of total GHG emissions over the period 2011-2035 in ‘LLCC’ scenario ............................438 Figure 105: Base case share (in %) of total energy consumption over the period 2011-2035 in ‘BAT’ scenario......................439 Figure 106: Base case share (in %) of total expenditure over the period 2011-2035 in ‘BAT’ scenario ..................................440 Figure 107: Base case share (in %) of total GHG emissions over the period 2011-2035 in ‘BAT’ scenario .............................440 Figure 108: Comparison of total energy consumption (in TWh) for the four scenarios over the period 2011–2035 for BC
2a.........................................................................................................................................................................441 Figure 109: Comparison of total energy consumption (in TWh) for the four scenarios over the period 2011–2035 for BC
2b.........................................................................................................................................................................442 Figure 110: Comparison of total energy consumption (in TWh) for the four scenarios over the period 2011–2035 for BC
3a.........................................................................................................................................................................442 Figure 111: Comparison of total energy consumption (in TWh) for the four scenarios over the period 2011–2035 for BC
3b.........................................................................................................................................................................443 Figure 112: Comparison of total energy consumption (in TWh) for the four scenarios over the period 2011–2035 for BC
4a.........................................................................................................................................................................443 Figure 113: Comparison of total energy consumption (in TWh) for the four scenarios over the period 2011–2035 for BC
4b.........................................................................................................................................................................444 Figure 114: Comparison of total energy consumption (in TWh) for the four scenarios over the period 2011–2035 for BC
5a.........................................................................................................................................................................444 Figure 115: Comparison of total energy consumption (in TWh) for the four scenarios over the period 2011–2035 for BC
5b.........................................................................................................................................................................445 Figure 116: Comparison of total energy consumption (in TWh) for the four scenarios over the period 2011–2035 for BC
6...........................................................................................................................................................................445 Figure 117: Comparison of total energy consumption (in TWh) for the four scenarios over the period 2011–2035 for BC
7...........................................................................................................................................................................446 Figure 118: Comparison of total GHG emissions (in million tonnes CO2 equivalent) for the four scenarios over the period
2011–2035 for BC 2a .............................................................................................................................................446 Figure 119: Comparison of total GHG emissions (in million tonnes CO2 equivalent) for the four scenarios over the period
2011–2035 for BC 2b .............................................................................................................................................447 Figure 120: Comparison of total GHG emissions (in million tonnes CO2 equivalent) for the four scenarios over the period
2011–2035 for BC 3a .............................................................................................................................................447 Figure 121: Comparison of total GHG emissions (in million tonnes CO2 equivalent) for the four scenarios over the period
2011–2035 for BC 3b .............................................................................................................................................448 Figure 122: Comparison of total GHG emissions (in million tonnes CO2 equivalent) for the four scenarios over the period
2011–2035 for BC 4a .............................................................................................................................................448 Figure 123: Comparison of total GHG emissions (in million tonnes CO2 equivalent) for the four scenarios over the period
2011–2035 for BC 4b .............................................................................................................................................449 Figure 124: Comparison of total GHG emissions (in million tonnes CO2 equivalent) for the four scenarios over the period
2011–2035 for BC 5a .............................................................................................................................................449

ERA Technology Limited ERA Report No. 2012-0230
043122753 ENTR Lot 4 Final Report v6 19 © ERA Technology Ltd
Figure 125: Comparison of total GHG emissions (in million tonnes CO2 equivalent) for the four scenarios over the period 2011–2035 for BC 5b .............................................................................................................................................450
Figure 126: Comparison of total GHG emissions (in million tonnes CO2 equivalent) for the four scenarios over the period 2011–2035 for BC 6 ...............................................................................................................................................450
Figure 127: Comparison of total GHG emissions (in million tonnes CO2 equivalent) for the four scenarios over the period 2011–2035 for BC 7 ...............................................................................................................................................451
Figure 128: Comparison of total expenditure (in million Euros) for the four scenarios over the period 2011–2035 for BC 2a.........................................................................................................................................................................451
Figure 129: Comparison of total expenditure (in million Euros) for the four scenarios over the period 2011–2035 for BC 2b.........................................................................................................................................................................452
Figure 130: Comparison of total expenditure (in million Euros) for the four scenarios over the period 2011–2035 for BC 3a.........................................................................................................................................................................452
Figure 131: Comparison of total expenditure (in million Euros) for the four scenarios over the period 2011–2035 for BC 3b.........................................................................................................................................................................453
Figure 132: Comparison of total expenditure (in million Euros) for the four scenarios over the period 2011–2035 for BC 4a.........................................................................................................................................................................453
Figure 133: Comparison of total expenditure (in million Euros) for the four scenarios over the period 2011–2035 for BC 4b.........................................................................................................................................................................454
Figure 134: Comparison of total expenditure (in million Euros) for the four scenarios over the period 2011–2035 for BC 5a.........................................................................................................................................................................454
Figure 135: Comparison of total expenditure (in million Euros) for the four scenarios over the period 2011–2035 for BC 5b.........................................................................................................................................................................455
Figure 136: Comparison of total expenditure (in million Euros) for the four scenarios over the period 2011–2035 for BC 6...........................................................................................................................................................................455
Figure 137: Comparison of total expenditure (in million Euros) for the four scenarios over the period 2011–2035 for BC 7...........................................................................................................................................................................456

ERA Technology Limited ERA Report No. 2012-0230
043122753 ENTR Lot 4 Final Report v6 20 © ERA Technology Ltd
0. Introduction The Eco-design of Energy using Products (EuP) Directive 2005/32/EC was adopted as a framework directive to set up the procedures required to assess energy-using products and to adopt implementing measures, if needed, to achieve eco-design improvements, in particular reductions in energy consumption which will be needed to achieve the EU’s targets for reducing emissions of global warming gases (GHG). This directive was replaced in 2009 with the Eco-design of Energy-related Products (ErP) Directive (2009/125/EC) which has similar aims but a broader scope.
The Eco-design Directive by itself does not provide binding requirements for specific products, but provides the framework and defines conditions and criteria for introducing directly binding requirements (implementing measures). The Directive states that a product category shall be covered by an implementing measure when it:
• represents a significant volume of sales in the EU market (indicatively, >200,000 units a year), • has a significant environmental impact, and • presents a significant potential for improvement. These can, however, be indicative only, for example, if there is significant improvement potential but less than 200 000 per year. The “Study for preparing the first Working Plan of the Eco-design Directive” carried out for the European Commission by EPTA Ltd. in 20071 showed that industrial and laboratory ovens and furnaces were the fourth largest category for emissions of greenhouse gases and the sixth largest user of energy. These products consume significant quantities of energy, mostly derived from fossil fuels although this includes a relatively small number of very large furnaces in the EU. The Intergovernmental Panel on Climate Change (IPCC) estimate that industry – overall - produces 19.4% of global greenhouse gas emissions, second only to electricity generation at 25.9% globally2 and a significant proportion of energy used by industry will be from furnaces and ovens.
Furnaces and ovens include a very wide range of products mostly used by industry although a small number of furnaces are used in households for hobbies such as pottery and jewellery. Ovens and furnaces range from laboratory products with a capacity of less than 5 litres, up to blast furnaces which can produce over 1 million tonnes of steel annually. Some laboratory instruments contain small heated chambers (ovens or furnaces) which are integral parts of these products, although the primary functions of these products are not as furnaces or ovens. Energy efficiency is not generally considered when buying small laboratory ovens, but industry is becoming increasingly conscious of the energy efficiency of their processes, due to the very high cost of energy. Significant reductions in energy consumption are widely reported as being achievable, but the capital cost of new plant is significant; therefore, new technology is not adopted as quickly as it becomes available. Industrial furnaces tend to have very long lives, over 20 years being common, but regular refurbishment is carried out to extend the product life, and this can be an opportunity to make energy efficiency improvements.
1 EPTA study for preparing the first Working Plan of the Ecodesign Directive, Report for tender No: ENTR/06/026, http://ec.europa.eu/enterprise/policies/sustainable-business/files/workingplan_finalreport_en.pdf.2 Intergovernmental Panel on Climate Change, “Climate change synthesis report 2007”, http://www.ipcc.ch/pdf/assessment-report/ar4/syr/ar4_syr_spm.pdf.

ERA Technology Limited ERA Report No. 2012-0230
043122753 ENTR Lot 4 Final Report v6 21 © ERA Technology Ltd
One significant difference between this study and previous eco-design preparatory studies is that industrial furnaces and ovens are used to make products that are used by consumers and other users, whereas most of the previous eco-design preparatory studies were performed for products that are themselves directly used by consumers in the EU. Eco-design studies aim to ensure that the life cycle environmental impact of products is minimised, and this is achieved by implementing measures that regulate the design of products; this policy can be very successful with products that are placed on the EU market for use within EU. Users of industrial furnaces, however, have an option to locate new installations either in or outside the EU, and this decision is usually based on economics. There has been a trend for many years to relocate manufacturing to locations outside the EU, usually in Asia(but to still make products for sale in the EU). Therefore, any policy options adopted that increase EU manufacturers’ costs could accelerate this trend. As furnaces located outside the EU are not subject to EU legislation, and it is well known that energy efficiency of new furnaces in some countries is inferior to those in EU, relocating industrial facilities outside of the EU would result in higher world-wide emissions of greenhouse gases (GHGs).
The aim of this study is to look at all eco-design aspects of these products, although energy efficiency is likely to be the aspect where the largest gains are achievable. The cost of introduction of these improvements is important as this can be a barrier to adoption. It will be important to understand what barriers exist to adopting eco-design improvements in order to develop a range of options that the Commission will consider for this category of equipment.
The study comprises seven Tasks:
Task 1 defines the scope and classification of products to be included in this study. Standards and legislation will also be identified.
Task 2 collects economic and market data that will be used in later Tasks. Market data is a useful parameter for identifying potential product types for use as base cases. There are a very large variety of ovens and furnaces on the EU market which can be classified in many different ways.
Task 3 investigates user requirements and behaviour including end of life.
Task 4 is an assessment of selected base cases, and provides technical information on selected products including bill of materials and energy consumption. Standard products currently on the market need to be identified which can in later Tasks be compared with best available technology (BAT) and the best not yet available technology (BNAT). As industrial furnaces and ovens vary so much, a modular approach will be used for medium-size furnaces and ovens and a comparison of current and best available technologies will be made for very large installations to determine environmental impacts, and the potential for their improvement.
Task 5 reviews the potential for improvement by reviewing the BAT and the BNAT, and for comparing these with the standard technology that is in current use in the EU.
Task 6 determines the eco-design improvement potential and presents a sensitivity analysis of key parameters.
Task 7 presents an analysis of policy options and their potential impact.
Tasks 1 – 4 investigate the current situation whereas Tasks 5 – 7 consider the potential for eco-design improvements in the future. Initially during Tasks 1 - 3, all types of furnace and oven are

ERA Technology Limited ERA Report No. 2012-0230
043122753 ENTR Lot 4 Final Report v6 22 © ERA Technology Ltd
considered. However, any types that are shown to be designed using the best available technology, thus revealing no significant improvement potential, may not need further investigation. If there is no prospect of new furnaces of a specific type being installed in the EU in the next 10 – 15 years, then no further investigation is needed, since the eco-design directive can only influence the design of new furnaces. However, where complete refurbishment is carried out, so that - in effect - a new furnace is constructed, this might be regarded as a "new furnace".
0.1 Scope of study - definition of furnaces and ovens The title of the study “industrial and laboratory furnaces and ovens” has been chosen as the scope of this study and so any equipment, product or process that could be regarded as a furnace or oven will need to be considered. The first Task defines a “furnace” and “oven” and these are generally regarded as having a primary function to apply heat to materials which are inside an enclosed space. However not all heated enclosures are ovens or furnaces. For example, a boiler heats water inside a container, and premature babies are kept warm inside special incubators, but neither would be regarded as an oven or furnace. There are many different heat source including electric heating, gas burners, etc, but exothermic chemical reactions can also generate heat inside the furnace, such as in steel blast furnaces. It will therefore be essential to define what is a furnace or oven.
0.2 Eco-design impacts of ovens and furnaces The energy consumption of furnaces and ovens in use is very large, and is probably the most significant environmental impact, although emissions of hazardous materials during fabrication, use and end of life are also important.
Furnaces and ovens are used for a very wide variety of industrial and laboratory processes. Users are not likely to heat an empty oven or furnace (except possibly for small laboratory ovens which are left on when not being used), and industrial furnaces and ovens will almost always be used to heat materials to carry out one specific type of process. Raising the temperature, melting, boiling or causing chemical reactions to these materials usually consumes energy, and can also cause the emission of hazardous substances, often as gases. Some processes are exothermic, such as the injection of oxygen into liquid pig iron in a basic oxygen furnace (BOF), where the carbon dissolved in the iron burns with the oxygen to produce CO2 and heat. This process generates more energy than is needed to maintain the iron as a liquid, and excess energy can be re-used elsewhere in the steel plant (but is not needed by the BOF). Hazardous gases can also be emitted from gas, coal or oil burners, such as carbon monoxide, and also potent greenhouse gases (GHGs) such as nitrogen oxides, and the production of these gases should ideally be avoided, but - if unavoidable - they should be trapped and disposed of safely. Ovens and furnaces that are used for processes where chemical reactions occur can emit hazardous gases. For example smelting of copper sulphide ores generates sulphur dioxide. This is inevitable and necessary for copper metal production and the furnace and other associated equipment is designed to trap this gas and convert it into a useful chemical – sulphuric acid. The sulphuric acid is not however produced by the furnace itself but by ancillary processes. Hazardous substances might be released in life cycle phases other than the use phase of a furnace or oven, but these releases of substances will be mainly during the production and end of life phases; therefore, these substances will be considered in this study.
It is likely that the main environmental impact of furnaces and ovens will be from energy consumption. Hazardous materials emissions from the processes carried out inside furnaces and ovens can be significant, but are already regulated in the EU for large installations although.

ERA Technology Limited ERA Report No. 2012-0230
043122753 ENTR Lot 4 Final Report v6 23 © ERA Technology Ltd
However, the control of the release of hazardous substances is regulated less effectively for smaller installations. In order to understand the energy efficiency of an oven or furnace, it is important to differentiate the following terms:
• “Energy efficiency” - which is the ratio or percentage of energy consumed compared to the total input of energy and material; and
• “Energy consumption” which is the total quantity of energy consumed by the process. A complicating factor is the energy source. Ovens and furnaces can be heated directly by burning flammable materials, most commonly fossil fuels such as gas, coal and oil (each emits different amounts of CO2, and energy efficiency can also vary for a specific process). A proportion of the heat of combustion is utilised in the oven or furnace process, but some is lost as hot ventilated combustion gases. Electric heating can be more energy efficient in that almost 100% of the electricity can in theory be converted into heat energy inside the oven or furnace. However generation of electricity is only about 30 - 45% efficient as there are generating and transmission losses. As most electricity in EU is generated from fossil fuels (with an average of c.40% efficiency), each kWh of heat energy input to the oven or furnace from electrical heating will usually result in the emission of more CO2 than by the same amount of heat energy derived directly from fossil fuels such as gas or oil. Electric heating is less popular for processes that consume large quantities of energy because the cost of electric heat energy is greater than the cost of heat energy from fossil fuels such as natural gas. Currently estimates for the average CO2 emissions/kWh electricity generated vary with figures quoted from 0.45kg CO2/kWh3 for all of Europe to 0.39 kg CO2/kWh (2007)4 for the EU-27 States compared to natural gas emissions of only 0.184kg CO2/kWh of energy5. Coal and oil are more carbon intensive than natural gas, but are usually cheaper and more widely available. The difference in CO2 emissions / kWh between electricity and gas will change over time, as the major sources of electricity generated in the EU changes from fossil fuels to renewable energy sources, or nuclear energy. EU policy includes a target that at least 20% of energy should be generated from renewable sources by 2020. Although the proportion of non-fossil fuel generated electricity, including nuclear energy, could be larger than 20%, it is not likely to be sufficient to make the use of electric heating of ovens and furnaces preferable to fossil fuel combustion in terms of global warming gas emission by 20206,possibly with the exception of where a low energy efficiency fossil fuel process (some can be only 20% efficient) is compared with a high energy efficiency electrically heated process (>75% is possible).
0.3 Energy consumption and efficiency The principal function of ovens and furnaces is to heat materials. However the heat energy input is used in a variety of ways such as:
• To raise temperature of materials, e.g. metal heat treatment; • To evaporate liquids such as in drying processes;
3 Carbon Monitoring for Action (CARMA), www.carma.org 4 Eurelectric calculation. 5 Market Transformation Programme report BNXS01 “Carbon dioxide emission factors for UK Energy Use” version 4.2, 2010. 6 http://ec.europa.eu/energy/strategies/index_en.htm. See also World Energy Outlook 2009 Fact Sheet, October 2009, www.worldenergyoutlook.org/docs/weo2009/fact_sheets_WEO_2009.pdf
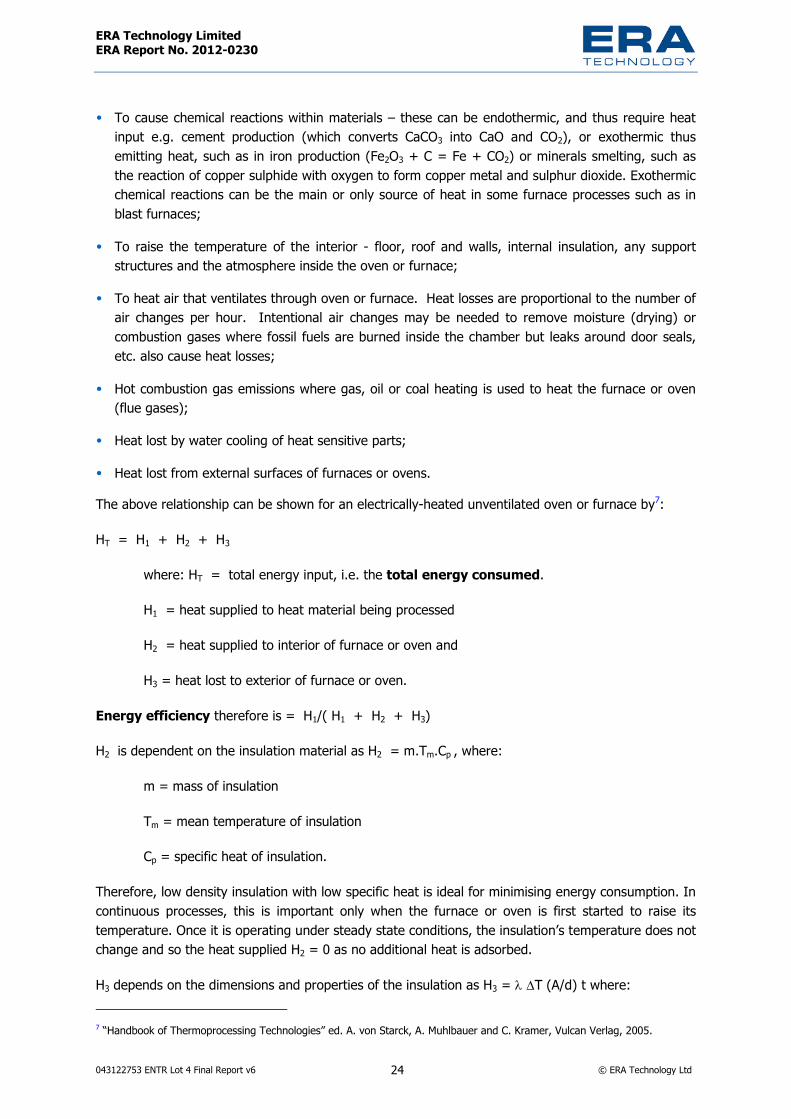
ERA Technology Limited ERA Report No. 2012-0230
043122753 ENTR Lot 4 Final Report v6 24 © ERA Technology Ltd
• To cause chemical reactions within materials – these can be endothermic, and thus require heat input e.g. cement production (which converts CaCO3 into CaO and CO2), or exothermic thus emitting heat, such as in iron production (Fe2O3 + C = Fe + CO2) or minerals smelting, such as the reaction of copper sulphide with oxygen to form copper metal and sulphur dioxide. Exothermic chemical reactions can be the main or only source of heat in some furnace processes such as in blast furnaces;
• To raise the temperature of the interior - floor, roof and walls, internal insulation, any support structures and the atmosphere inside the oven or furnace;
• To heat air that ventilates through oven or furnace. Heat losses are proportional to the number of air changes per hour. Intentional air changes may be needed to remove moisture (drying) or combustion gases where fossil fuels are burned inside the chamber but leaks around door seals, etc. also cause heat losses;
• Hot combustion gas emissions where gas, oil or coal heating is used to heat the furnace or oven (flue gases);
• Heat lost by water cooling of heat sensitive parts; • Heat lost from external surfaces of furnaces or ovens. The above relationship can be shown for an electrically-heated unventilated oven or furnace by7:
HT = H1 + H2 + H3
where: HT = total energy input, i.e. the total energy consumed.
H1 = heat supplied to heat material being processed
H2 = heat supplied to interior of furnace or oven and
H3 = heat lost to exterior of furnace or oven.
Energy efficiency therefore is = H1/( H1 + H2 + H3)
H2 is dependent on the insulation material as H2 = m.Tm.Cp , where:
m = mass of insulation
Tm = mean temperature of insulation
Cp = specific heat of insulation.
Therefore, low density insulation with low specific heat is ideal for minimising energy consumption. In continuous processes, this is important only when the furnace or oven is first started to raise its temperature. Once it is operating under steady state conditions, the insulation’s temperature does not change and so the heat supplied H2 = 0 as no additional heat is adsorbed.
H3 depends on the dimensions and properties of the insulation as H3 = λ ∆T (A/d) t where: 7 “Handbook of Thermoprocessing Technologies” ed. A. von Starck, A. Muhlbauer and C. Kramer, Vulcan Verlag, 2005.
ERA Technology Limited ERA Report No. 2012-0230
043122753 ENTR Lot 4 Final Report v6 25 © ERA Technology Ltd
λ = thermal conductivity of insulation material
∆T = temperature difference between the inside and outside of the furnace or oven
A = cross-sectional area of insulated surface
d = thickness of insulation
t = time (process time).
Therefore H3 is lowest with:
• Low thermal conductivity insulation – via selecting an appropriate insulation material (see Table 63),
• The lowest practical process temperature – limited by process requirements • Small oven / furnace cavity size – needs to accommodate parts or materials. A full oven or
furnace is therefore more efficient that one only part full. • Thick insulation (although thicker insulation will have a larger heat capacity) - see Table 63, • A short process time – e.g. use more powerful heating to shorten pre-heat time. Many ovens and furnaces are ventilated, for example for drying materials. This heated air generally has to be replaced by fresh cold air that requires heating. Oil, gas and coal burners generate hot combustion gases and as much of this heat as possible should be transferred to the furnace / oven and the materials being processed, but inevitably some heat energy is lost in the exhaust gases.
These heat losses can be minimised in a variety of ways. The flow-rate of air through a drying oven should be as low as possible to minimise energy consumption although this will slow drying processes. Effective heat transfer from hot gases from flames into the oven or furnace is achieved by good burner and furnace design, but inevitably heat is lost as hot exhaust gas emissions although this heat can sometimes be used to pre-heat burner air (recuperative and regenerative burners), heat feed materials or for heating buildings, all of which reduce overall energy consumption.
For furnaces that have burners (gas, oil or coal), the heat supplied by the fuel Hf into a furnace under steady state conditions (i.e. excluding start up and shut down) is8:
Hf = Hc + Hs + Hg, where:
Hc = heat supplied to material being processed in furnace
Hs = Heat lost by heating the furnace itself (insulation, structure, etc.) and
Hg = heat lost in flue gases.
Hf = Qf x CV (Qf = fuel flow rate, CV = calorific value of fuel) and the heat losses in flue gases are proportional to the flue gas flow rate, the mean specific heat of the flue gas and the difference between the flue gas exit temperature and the ambient temperature. 8 P. Mullinger and B. Jenkins, “Industrial and Process Furnaces”, Elsevier, 2008

ERA Technology Limited ERA Report No. 2012-0230
043122753 ENTR Lot 4 Final Report v6 26 © ERA Technology Ltd
Oven and furnace designs should take into account the variables that affect energy consumption and energy efficiency, but it is inevitable that some energy will be consumed to carry out the process for which the oven or furnace is being used, and this is unavoidable, whether it be for heat treatment, melting metals, or drying, etc. Energy will be consumed even if the oven / furnace energy efficiency were 100% (which is impossible) and the only way to reduce EU energy consumption from very high energy-efficiency furnaces and ovens is by reducing the consumption of manufactured products produced by furnaces and ovens, which is not likely to be an acceptable option. Furthermore, a large quantity of commodities and fabricated products are imported into the EU that have been made using furnaces and ovens located outside the EU. The energy efficiency of these furnaces and ovens may be inferior to those in the EU (and cannot be regulated by the EU). Although more energy-efficient processes are being introduced world-wide, and older less energy-efficient processes are being installed, but in many countries these are not as energy efficient as new furnaces in the EU.
One way to combat these inefficiencies is to encourage the consumption (in the EU) of fabricated products and commodities that have been produced using energy-efficient processes. Such "indirect energy efficiency" considerations (i.e., regulating product groups via the embedded energy of the output products from furnaces or ovens) are outside the scope of this study. However, it is important that EU manufacturers are not placed at a competitive disadvantage that results in an increase in the imports into the EU of products which have been manufactured/ processed using less energy-efficient processes, as this latter product provenance route would increase global carbon emissions. Relocation of manufacturing to countries outside the EU has been occurring for many years, although heavy or fragile products made with very large furnaces - such as ceramics, glass and cement – still tend to be made in the EU, in general. In these cases, the raw materials are widely available, and for a number of these products there may be a low value to weight ratio, resulting in lower international trade of the finished items. It is conceivable that new EU energy efficiency legislation could cause the investment economics to change, such that a new furnace built in the EU is more expensive than a new - but less energy efficient - furnace built outside the EU. Many stakeholders have said that the payback period (based on the additional cost for the energy-efficient design, and the value of the energy saved) would be considered, and that often, if it is more than 3 years, then manufacturers say that there is a risk that they would decide to relocate production outside the EU. However, there are many other reasons why investment decisions are made, and these will be discussed in Task 7. Many stakeholders have pointed out that production of some products is already more expensive within the EU than outside of the EU, and that a lot of manufacturers have already moved. However, this can be for many reasons other than for possible additional costs from new, or anticipated, EU legislation.
Most furnace and oven processes have energy efficiencies that are much less than 100%; thus, there should be scope for improvements in energy efficiency, and a reduction in energy consumption, and this will be studied in Tasks 4, 5 and 6. Carbon dioxide emissions are equally important to address as energy consumption, and the two areas are sometimes not directly related, depending on energy sources, etc. Therefore, this environmental impact will also be considered.
However, the first Task in this study is to define furnaces and ovens.

ERA Technology Limited ERA Report No. 2012-0230
043122753 ENTR Lot 4 Final Report v6 27 © ERA Technology Ltd
1. Task 1 - Definition Task 1 examines the scope of this preparatory study, and therefore considers the definition of ovens and furnaces. The functions and characteristics of ovens and furnaces are assessed, as well as defining the boundaries for this study. Ovens and furnaces are very varied in their size, design and functions but all apply heat to materials within an enclosed space. ISO committee TC244 defines these products as “heated enclosures”. However, too simple a definition could include products that are not within the scope of this study however, for example, kettles used for boiling water (to make beverages) which are enclosed vessels that are internally heated. Industrially, there are many thermal processes, but only some of these would be regarded as being either a furnace or an oven, and so it will be important to define these clearly. Ovens and furnaces have many different designs; most perform the function of heating items in a chamber in which the interior is a gas (air or other gases), but spaces with a vacuum are also used. There are some types of larger furnaces in which the heat source is directed into the material that is being treated so as to melt (e.g. metal melting), burn it (e.g. incinerators) or cause a chemical reaction (e.g. cement kilns and smelters). The aim of this Task is to define the boundaries for laboratory and industrial ovens, and furnaces and investigate possible differentiating characteristics.
Ovens and furnaces often have additional functions as well as heating. Examples include:
• Cooling, such as with fans or sometimes using refrigeration (or by immersion in oil) • Movement, such as on a conveyor or by rotating cylindrical structures • Controlled atmosphere, inert gas, humidity, vacuum, reducing atmosphere, etc. Many ovens and furnaces are designed for specific purposes and so include features that enable these to be carried out. For example:
• Condensation and removal of flux residues from conveyorised oven soldering processes (reflow ovens)
• Specific temperature profiles, which are used for many procedures including heat treatment of metals, reflow soldering, firing thick-film electronic circuits, thermal cycle testing of products and heat sterilisation
• Weighing materials automatically inside the furnace for analytical purposes, such as thermal asphalt binder analysis
• Waste heat recovery, which can be used to preheat raw materials, combustion air and fuel or used elsewhere in production plant such as for heating buildings or to generate electricity. This is important for minimising energy losses, and so has been studied in detail.
Some ovens and furnaces are used as components that are part of other products. For example, several types of analytical instruments contain components that need to be heated to a precisely controlled temperature, and this is achieved by placing them inside a heated cavity which is essentially an oven, but the product that is placed on the EU market is the analytical instrument.
The following sections describe the wide variety of ovens and furnaces placed on the EU market, together with applicable standards and legislation.

ERA Technology Limited ERA Report No. 2012-0230
043122753 ENTR Lot 4 Final Report v6 28 © ERA Technology Ltd
1.1. Product definition A clear definition is needed for furnaces and ovens, which must define the equipment, but exclude the processes that are carried out inside the furnaces or ovens. This is not always straightforward, as, for example, the heat input for metal smelting furnaces is often from the process itself. In these cases, the process is not part of the furnace, but it is the heat source. It is important for this study to define what is included and what is excluded from the definition of a furnace or oven. Some suggestions are:
1. An enclosed chamber in which materials are inserted, heated to raise their temperature in a controlled way to cause a physical or chemical change in the material which is then removed after completion of the heating process.
2. An enclosed space in which materials are heated to one or more specific temperatures as part of a production process or test procedure.
3. An enclosed structure in which the interior is heated and materials enter at one location, and in which the heat causes chemical or physical changes to occur before the materials emerge from the same or a different part of the enclosed structure.
4. An enclosed compartment in which parts are placed for a period of time, where they are exposed to changes in temperature and other environmental conditions such as humidity, atmospheric pressure or chemical composition of the atmosphere.
A possible definition could be defined by the main function of the equipment and it is important not to confuse this with the intended process that is carried out within the furnace or oven. A furnace or oven is a device whose primary function is to apply heat to the interior of an enclosed chamber, but it is not:
• A boiler which is used to heat water. • Equipment intended for carrying out several functions where heating is only one of several
functions and so heating is not the only primary function. One example would be a chemical reactor vessel used to carry out reactions in fluids where stirring and accurate weighing of constituents are primary functions as well as heating. The chemical industry would not regard these are ovens or furnaces as many functions as well as heating are carried out. Ovens and furnaces are, however, used by the chemical industry where materials are heated in an enclosed chamber, and heating is the primary function. A blast furnace is in fact a chemical reactor, because chemical reactions occur but these are referred to as furnaces as the main function of the equipment is to retain the heat generated internally within the chamber. As a main function of the blast furnace equipment is to provide heat (from the chemical reaction) internally, this could be regarded as a furnace in this study.
• An analytical instrument that includes a heated chamber as a component • Thermal processes carried out without an enclosure such as “glass-blowing” in an open flame or
heating metal billets within an induction coil • Paper production from pulp, where the pulp is dried by passing it over steam heated rollers. Note
that this thermal process is not enclosed

ERA Technology Limited ERA Report No. 2012-0230
043122753 ENTR Lot 4 Final Report v6 29 © ERA Technology Ltd
Larger industrial furnaces are often used in production lines or within complex multi-stage processes (such as steel production and in oil refineries) with other equipment, and so it is often difficult to consider the energy consumption and efficiency of a furnace or oven in isolation. Heat input can be from a previous process step, e.g. in the form of hot liquid metal, and heat output can be utilised in either different stages within the process or elsewhere, such as to heat buildings.
There is some industrial equipment that is called a “furnace”, but which is not a typical furnaces. For example, a blast furnace is in fact a chamber for carrying out chemical reactions. There is no direct heat input (except at start-up) and the energy source which is coal, oil or gas is injected through the “tuyeres”, and coal is also mixed with the iron ore so that heat is generated from the chemical reactions that occur between the ore and carbon within the blast furnace, which is an enclosed chamber, and so does therefore meet most definitions of furnaces. In a blast furnace, the heat energy is generated by the chemical reactions within the chamber and a lot of the excess heat generated is utilised by other processes within the steel production plant. The generation of heat by a chemical reaction should not exclude equipment from being defined as a furnace because the combustion of gas is a common heat source, and because the heat is from the chemical reaction between oxygen and hydrocarbons.
There are some processes in which materials are heated but without an enclosed chamber. Some induction heating is designed with the induction coils being located around the metal parts being heated, and there is no need for insulation. This device is clearly not a traditional furnace, and so its eco-design cannot be considered in the same way as traditional furnaces. However, such a method of heating may be energy efficient.
For this study it will be important to define what is included and excluded from a “furnace or oven”.
Excluded from the furnace or oven definition would be ancillary equipment such as hygiene equipment for emissions, external conveyors that feed material into and out of the furnace or oven and external equipment that uses waste heat for washing, electricity generation, heating buildings, etc. Carbon capture and storage would be excluded as it would be carried out as a separate process which consumes additional energy. Materials that are processed within the furnace or oven are also excluded as they are not an integral part of the furnace or oven. One type of furnace, for example could be used to heat many different materials. The energy consumed and any related emissions, will depend on the quantity and type of material that is heated, as the material itself will usually absorb heat and chemical changes may occur that emit other substances. Heating limestone (CaCO3), for example will emit CO2. This emitted CO2 is inevitable and cannot be prevented if limestone is heated at above its decomposition temperature; moreover, where this occurs, it is the intended process. Equipment where the heating of materials is not its primary function (i.e. it is only one of many processes and not the most important) should not be considered as being an oven or furnace. This may therefore exclude incubators where cooling and atmosphere control can be equally or more important than heating.
Included would be the heaters or burners, internal fans, internal supports for materials (shelves, conveyors), temperature control equipment and actuators and motors that move internal parts of the oven or furnace or move the oven / furnace itself (such as in a rotary furnace). Re-use of waste heat to pre-heat burner air may be considered as part of the scope, and external heat exchangers to pre-heat feedstock before they enter the furnace or oven enclosure could also be included. Emissions from combustion of burner gases will be considered by this study but emissions from materials that are processed within the oven or furnace will usually be excluded, as they are process specific.

ERA Technology Limited ERA Report No. 2012-0230
043122753 ENTR Lot 4 Final Report v6 30 © ERA Technology Ltd
Possibly included or excluded: – Some ovens and furnaces cool or quench parts and materials after heating. The cooling stage may be an integral part of the furnace, or it may be a separate process. There may also be heat exchangers used to recover waste heat for reuse that are separate from the main oven / furnace function. Re-used heat can be used directly in the furnace or used elsewhere for heating buildings or other processes. Examples where heat reuse could be considered to be part of the scope may include:
• Recuperative and regenerative burners which re-use hot emissions to preheat air and fuel for the burners, giving improved energy efficiency. This equipment is an integral part of the furnace design, although it involves structures that are outside of the heated enclosure.
• Most cement kiln processes can use hot exhaust and cooling gases to pre-heat raw materials. This may be in separate cyclones prior to the rotary kiln itself rather than inside the rotary furnace. These cyclones are separate chambers to the kiln, but are an integral part of the process equipment. The cement kiln is a type of furnace but the energy consumption and overall energy efficiency depend on the entire process design as shown in Figure 1.
Boundary of process
Rotary cement kiln – boundary of
“furnace”
Raw material pre-heater
Clinker
Heat returned to pre-heatersBoundary of process
Rotary cement kiln – boundary of
“furnace”
Raw material pre-heater
Clinker
Heat returned to pre-heaters
Figure 1. Simplified cement production process - boundary of furnace process and furnace itself
Figure 1 illustrates why it is important to consider the whole process to assess energy efficiency where the heat emissions from the furnace or oven are re-used within the process. If the rotary kiln only were considered without the re-use of heat, it would appear unrealistically inefficient.
Carbon dioxide and other GHG emissions • The impact of a furnace process on global warming is due to any greenhouse gases (GHGs) that
are emitted. Carbon dioxide is usually the most significant GHG emitted but nitrogen oxides and other gases (methane, ozone and fluoro-compounds) will also contribute. • Electric heating - Carbon dioxide is emitted during electricity generation, where fossil fuels
are used, but electricity generation and transmission are excluded from the scope of this study.
• Combustion for heating using fossil fuels directly, such as natural gas, coal and oil are included. Such combustion processes emit carbon dioxide, as shown:
• CH4 (methane) + 2O2 → CO2 + 2H2O
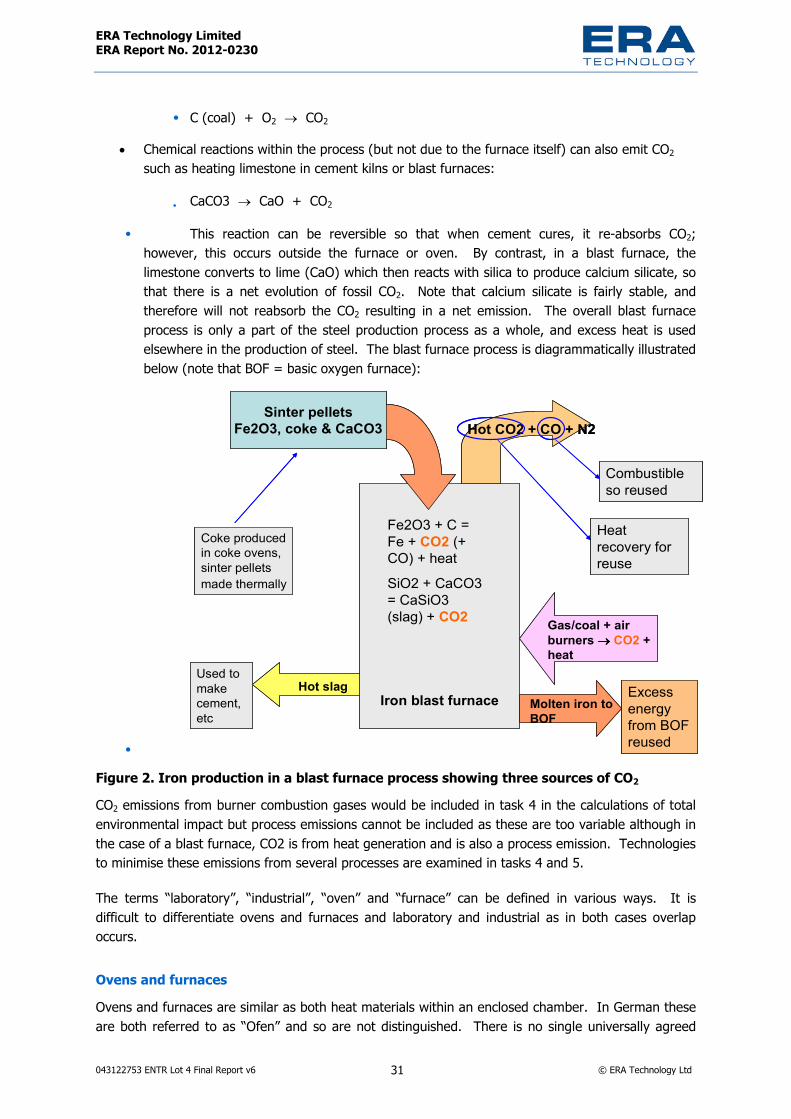
ERA Technology Limited ERA Report No. 2012-0230
043122753 ENTR Lot 4 Final Report v6 31 © ERA Technology Ltd
• C (coal) + O2 → CO2
• Chemical reactions within the process (but not due to the furnace itself) can also emit CO2such as heating limestone in cement kilns or blast furnaces:
• CaCO3 → CaO + CO2
• This reaction can be reversible so that when cement cures, it re-absorbs CO2;however, this occurs outside the furnace or oven. By contrast, in a blast furnace, the limestone converts to lime (CaO) which then reacts with silica to produce calcium silicate, so that there is a net evolution of fossil CO2. Note that calcium silicate is fairly stable, and therefore will not reabsorb the CO2 resulting in a net emission. The overall blast furnace process is only a part of the steel production process as a whole, and excess heat is used elsewhere in the production of steel. The blast furnace process is diagrammatically illustrated below (note that BOF = basic oxygen furnace):
•
Sinter pelletsFe2O3, coke & CaCO3
Molten iron to BOF
Hot slag
Fe2O3 + C = Fe + CO2 (+ CO) + heatSiO2 + CaCO3 = CaSiO3 (slag) + CO2
Hot CO2 + CO + N2
Gas/coal + air burners →→→→ CO2 +heat
Combustible so reused
Heat recovery for reuse
Iron blast furnace
Coke produced in coke ovens, sinter pellets made thermally
Used to make cement, etc
Excess energy from BOF reused
Figure 2. Iron production in a blast furnace process showing three sources of CO2
CO2 emissions from burner combustion gases would be included in task 4 in the calculations of total environmental impact but process emissions cannot be included as these are too variable although in the case of a blast furnace, CO2 is from heat generation and is also a process emission. Technologies to minimise these emissions from several processes are examined in tasks 4 and 5.
The terms “laboratory”, “industrial”, “oven” and “furnace” can be defined in various ways. It is difficult to differentiate ovens and furnaces and laboratory and industrial as in both cases overlap occurs.
Ovens and furnaces Ovens and furnaces are similar as both heat materials within an enclosed chamber. In German these are both referred to as “Ofen” and so are not distinguished. There is no single universally agreed

ERA Technology Limited ERA Report No. 2012-0230
043122753 ENTR Lot 4 Final Report v6 32 © ERA Technology Ltd
difference between ovens and furnaces but many manufacturers regard ovens as operating below c.600°C and furnaces at higher temperatures although other manufacturers use a lower temperature to differentiate. Most ovens are used at temperatures of up to c.350°C whereas some so-called “high-temperature” ovens operate at up to 650°C. British Standard BS 4642:1970 states that ovens are not normally used at >500°C. Ovens tend to use sheet metal for the inner surfaces of the heating chamber whereas furnaces use refractory materials. Sheet metal is more resilient to physical impact and is not prone to cracking from thermal shock but metals will corrode and oxidise. Various grades of stainless steels are often used, particularly for laboratory ovens, but the rate of oxidation becomes unacceptable at temperatures above c.700°C. All metals also soften as the temperature increases and so metals lose their strength at high temperatures. Melting of some metals would also be an issue at >1000°C so that refractories are the only viable option for the inner surfaces of most types of furnace which operate at above c.700°C. Vacuum furnaces are an exception though which can be used at >1000°C but have water-cooled steel walls and so the inner surface is cooler than the materials being heated. As a classification, it may not be necessary to differentiate between ovens and furnaces for eco-design requirements, although it should be noted that the requirements considered may be temperature dependent.
Laboratory or industrial There is considerable overlap between laboratory ovens and furnaces and industrial ovens and furnaces although – typically - laboratory products are smaller than industrial versions. There are some specific types of product that are designed and used exclusively in laboratories and other types that are designed exclusively for industrial applications. There are also some types of products that could be classified as an oven, and yet which are not used either in laboratories or by industry, for example heat sterilisers, are used in hospitals.
Table 1. Examples of furnaces and ovens used exclusively in either laboratories or industry settings Ovens and furnaces used only in laboratories or other non-industrial environments
Ovens and furnaces nearly always used only in industrial environments
Laboratory glassware driers Blast furnace Incubators Cement kiln Environmental test chambers Solder reflow ovens Ashing furnaces (used for testing so could be located in factories)
Biscuit ovens
Heat sterilisers Metal heat treatment furnaces
Many types of ovens and furnaces are used in both laboratories and in industrial environments so that their design or functions cannot be used to define their location of use. However, it may not be necessary to differentiate between laboratory or industrial as both are professional uses. A small number of furnaces are used by consumers but these are the same designs as professional laboratory-type equipment.

ERA Technology Limited ERA Report No. 2012-0230
043122753 ENTR Lot 4 Final Report v6 33 © ERA Technology Ltd
Definitions of laboratory ovens and furnaces provided by stakeholders are:
Laboratory oven: <750 litres capacity and designed to be used from 100° up to 600°C;
Laboratory furnace: <50 litres capacity and >600°C although some laboratory furnaces are larger so manufacturers use an upper limit of 60 or 120 litres capacity. Laboratory furnaces of >60 litres are however very uncommon.
The above definitions are based on information from manufacturers of primarily laboratory ovens and furnaces. The definition below is used by one manufacturer of both industrial and laboratory ovens and is different:
Laboratory ovens: <400°C and <100 litre capacity;
Laboratory furnaces: >400°C and <30 litre capacity;
A clear definition is needed to distinguish "laboratory" from "industrial" ovens and furnaces, if differing eco-design requirements are to be set accordingly. If this is the case, it will affect manufacturers, since laboratory designs tend to be standard models which can be type-tested, whereas industrial designs are often custom designs which cannot be type-tested.
1.1.1 Definitions from standards and legislation Several standards define the terminology used for ovens and furnaces with UK standard BS4642:1970 being particularly useful for its comprehensive list of furnace types and some ovens. Useful standards include:
Table 2. Standards that categorise and define furnaces and ovens Standard no. Title BS 4642:1970 (UK) Glossary of industrial furnace terms UNI 7415 (Italy) Forni Industriali. Termini, definizioni e classificazione (industrial furnaces –
terms, definitions and classifications) – now superseded by EN746/1 SAC GB/T 17195 (China) Industrial furnace terminology VDMA 24202 (Germany) Industrial furnaces, classification VDMA 24351 (Germany) Drying technology – General terms
Several standards include key categories and definitions and these are listed in Table 3.

ERA Technology Limited ERA Report No. 2012-0230
043122753 ENTR Lot 4 Final Report v6 34 © ERA Technology Ltd
Table 3. Definitions of furnaces and ovens from standards and EU legislation Standard no. Definitions BS 4642:1970 This standard defines over 210 different types of furnaces and ovens. Definitions
include: Furnace - A structure within which heat is generated to a controlled temperature by the combustion of fuel, or by the application of electrical or other energy, generally constructed or lined with refractory material and designed to suit the nature and dimensions of the material to be processed. Oven - An alternative term for “furnace”, derived from the German; more properly, a heated chamber not normally used above about 500 °C. Incinerator - A refractory lined chamber and equipment connected to a chimney, designed to burn solid, liquid or gaseous wastes and to produce inoffensive gases and sterile residues containing little or no combustible material. Muffle - A furnace in which the working space and the charge therein are isolated from the heating medium and any combustion products. Blast furnace - A vertical, refractory lined structure incorporating within its height a hearth, bosh and stack; used for the reduction of ores to metal.
EN 50156-1:2004 Furnace - a structure within which heat is generated to a controlled temperature by combustion of fuel
2000/76/EC Incineration plant means any stationary or mobile technical unit and equipment dedicated to the thermal treatment of wastes with or without recovery of the combustion heat generated. This includes the incineration by oxidation of waste as well as other thermal treatment processes such as pyrolysis, gasification or plasma processes in so far as the substances resulting from the treatment are subsequently incinerated. Co-incineration plant means any stationary or mobile plant whose main purpose is the generation of energy or production of material products and: — which uses wastes as a regular or additional fuel; or — in which waste is thermally treated for the purpose of disposal. If co-incineration takes place in such a way that the main purpose of the plant is not the generation of energy or production of material products but rather the thermal treatment of waste, the plant shall be regarded as an incineration plant
ASME EA-1-2009 Furnace – a term generically used (in this standard) to describe heating equipment such as furnaces, melters, ovens and heaters
Oxford English Dictionary
Furnace – An enclosed structure for intense heating by fire, especially of metals. Kiln – Furnace or oven for burning, baking or drying, especially for calcining lime or firing pottery.
Trinks et. al.9 Industrial process heating furnaces – are insulated enclosures designed to deliver heat to loads
The definitions in Table 3 of furnaces and ovens include “structure in which heat is generated” and “controlled temperature” as key aspects. “Heated chamber” is also used although the words structure and chamber may both be suitable for both ovens and furnaces. A clear and concise definition will be
9 W. Trinks, et. al., “Industrial Furnaces” 6th Edition, John Wiley & Sons Inc., 2004
ERA Technology Limited ERA Report No. 2012-0230
043122753 ENTR Lot 4 Final Report v6 35 © ERA Technology Ltd
needed if any implementing measures are adopted although this can define the scope for ovens and furnaces by stating what is included and also what is excluded.
This could be:
A furnace or oven is a device whose primary function is to apply heat to the interior of an enclosed chamber
This definition should however exclude:
• Boilers (equipment used to boil water, i.e. kettles and boilers); • Chemical reactors in which fluid materials are processed and heating is not the only primary
function of the equipment; • Large combustion plant (electricity generation); • Environmental chambers that control temperature (and sometimes also the atmosphere) with a
maximum temperature of less than 60°C (such as premature baby incubators); • Analytical instruments that include heated compartments as component parts; • Thermal processes where materials are heated in the open without an enclosure; • Chambers whose primary functions include cooling using refrigeration (such as incubators); • Domestic and commercial catering ovens (need a definition to differentiate with factory food
manufacture) as these are being studied in a separate eco-design study; • Waste to energy incinerators as most of these do not consume primary energy for heating
because their main function is energy recovery from waste materials. These are in effect, electricity (and heat) generation plant;
• Thermal processes with no enclosure; • Grain and crop driers as the internal temperature is often less than 100°C (typically drying air
temperatures are from 49 to 110°C, depending on the type of grain10). A definition that considers most of these issues would be:
A furnace or oven is a device whose primary function is to apply heat to the interior of an enclosed chamber to achieve at least 90°C internally
Most of these examples (but neither water boilers nor large combustion plant) will be assessed in Tasks 1 - 3 of this study to provide data that can be used to determine what actions to take.
1.1.2 New, rebuilt and refurbished equipment Another definition that is needed is for new furnaces that are placed on the EU market to differentiate these from repairs to existing furnaces. This is because it is common practice with industrial furnaces, 10 Information provided by Grain drier manufacturer Opico.

ERA Technology Limited ERA Report No. 2012-0230
043122753 ENTR Lot 4 Final Report v6 36 © ERA Technology Ltd
especially the larger sizes, to rebuild furnaces within existing installations. The four main types of installation are:
1. Completely new furnaces and ovens that are installed into an empty space at an existing or new factory installation. These may be constructed at one location as a finished product and then moved to where it is used or it may be constructed on site from parts purpose-designed elsewhere.
2. Rebuild an existing furnace and oven in an existing installation. This usually replaces almost all of the parts so is in effect a new furnace. Often only the outer casing is reused. almost all of the parts, so it is - in effect - a new furnace. Often only the outer casing is reused. This is an opportunity to improve environmental performance, but is limited by the space available for a larger structure. It is often not possible to have thicker insulation, as the furnace would need to be larger, which would mean that the outer casing could not be re-used. Thicker insulation, with the same outer dimensions, would reduce capacity and thus would limit throughput, and this may not be sufficient, meaning that an additional furnace would be needed to maintain productivity. Another example is that installation of a pre-heating stage may not be possible if there is no space available at the location where it would be required.
3. Refurbishment is quite common for existing furnaces. This is usually less extensive than a rebuild and only worn or defective parts are replaced although this often includes replacement of insulation, burners and process control equipment. The specification may be changed and the performance can be improved. Refurbishment of furnaces and ovens is often carried out by specialists at a location different to where it had been used and then they are sold to different users.
4. Repairs are made to existing furnaces and ovens. This can be fairly minor work, replacement of worn refractory and insulation or other parts that are defective. Refractory replacement of some types of furnace such as glass melters is routinely carried out. The furnace or oven is not usually relocated after being repaired but the specification may change. This can be an opportunity to improve performance, but in some sectors insulation is sometimes replaced with thinner layers to increase capacity (and to reduce maintenance costs). Such actions will however increase energy consumption.
The eco-design directive is applicable only to new products. Clearly within the four types of installation mentioned above, (1) above refers to new products, but (2) could also be interpreted as being a new product - although this may depend on the extent of the rebuild. Types (3) and (4) do not represent new products since the essential characteristics of the original furnace and oven are retained, but its performance can be altered. If a rebuild is interpreted as being the production of a new furnace or oven, this needs a clear definition to distinguish such a situation from refurbishment. A rebuild is where all of the main parts of a furnace are replaced, including the refractory materials, thermal insulation, heat sources and process control equipment.

ERA Technology Limited ERA Report No. 2012-0230
043122753 ENTR Lot 4 Final Report v6 37 © ERA Technology Ltd
1.2. Product classification It is possible to classify industrial and laboratory furnaces and ovens in many ways but the aim of classification for this study is to identify a classification method that can be used for defining eco-design requirements. The main classifications used for furnaces and ovens are described here:
Classification by Size One useful classification option is by size, as below, because there are differences in the markets for laboratory; small – medium size industrial; and finally; very large industrial furnaces and ovens:
Size classification Characteristics Large / very large; likely to be used in installations that are usually within scope of the IPPC directive and possibly also the ETS regulations
Energy costs in the use phase are very high so there is an incentive for good energy efficiency, although this does not guarantee the maximum possible efficiency irrespective of cost. IPPC (now IED) regulates pollutant emissions and ETS aims to regulate carbon dioxide emissions.
Medium-size industrial – used for lower volume production (see below – typical applications and furnace / oven design)
Manufacturers produce a variety of standard designs of medium size furnace that are used for lower volume production of a wide variety of products. It is fairly common for modified versions to be built for individual applications and custom-designed furnaces and ovens, sometimes based on standard features, are also constructed. Designs are usually much less complex than for very large furnaces. Some consume significant amounts of energy and there is potential for eco-design improvements. Some medium-size furnaces will be used in installations within the scope of IPPC and ETS.
Small industrial – smaller versions of medium-size as well as some specific designs
Most are standard designs or custom-modified versions. Small size, therefore, energy consumption is less significant, but a larger percentage improvement potential may be achievable. Occasionally used (but not designed for use) in laboratories.
Laboratory ovens and furnaces – intended for research and testing, although some used for light industrial applications
Mostly standard designs and essentially similar to small industrial with considerable overlap. There are relatively few main basic designs with large numbers of a few designs being sold. Ovens and furnaces designed for the laboratory market are often used by industry for small-scale manufacturing processes. These are used for a very wide variety of processes
The size classification is useful as it can be used as a means of obtaining data on furnaces and ovens because of the following characteristics of the markets for these products:
Large industrial: Sold in relatively small numbers in the EU, extremely complex in design with almost every furnace and oven being different. Most are within the scope of the Industrial Emissions Directive and the EU ETS so there is some data published on energy consumption and emissions.
Small and medium industrial: Sold in much larger numbers and designed for use in the manufacturing sectors. Some are designed specifically for particular applications (e.g. vacuum furnaces are usually used for metal heat treatment) whereas others may be used for a variety of applications (e.g. chamber ovens which can be used for drying, curing coatings and any other process where materials are heated). This equipment is used for smaller-scale manufacturing, often by SMEs but also by larger organisations that may have many ovens and furnaces for heating small quantities

ERA Technology Limited ERA Report No. 2012-0230
043122753 ENTR Lot 4 Final Report v6 38 © ERA Technology Ltd
of materials. The manufacturers of small and medium size industrial furnaces tend to be different to those that manufacture large industrial and laboratory equipment.
Laboratory: These are sold in large numbers with fewer design options than medium-size industrial equipment. Designed to have flexibility for laboratory situations where the equipment may be required to be used for many different processes (needs to resist chemical attack, many different temperatures, many different quantities and heating times). Used for research and testing so relatively small quantities of material are heated.
Examples of furnaces and ovens of these three size classifications are:
Table 4. Examples of furnace and oven designs and the capacity and energy consumption by size classification. Size classification and furnace / oven
design Applications and typical size / capacity
Large – illustrative examples, see also Table 10 and section 5 Cement kiln (rotary furnace with pre-heater, pre-calciner and heat recovery from product
Cement clinker manufacture – typically 500 tonnes per day consuming c.2GWh / day
Steel production by traditional process – coke oven, sinter plant, blast furnace, basic oxygen furnace
Steel – typically 1 million tonnes per year
Electric arc furnace Scrap steel recycling – typically 80 tonnes per batch consuming c. 30 MWh / batch
Tunnel kiln Bricks, roof tiles and other clay ceramics products – typically 1 - 200 tonnes per day consuming c. 60 MWh / day. Brick kilns in Germany range from 50 – 400t/day
Roller kiln Wall tiles, tableware and other products made with synthetic clay – typically 100 tonnes per day
End fired regenerative glass melting furnace
Manufacture of molten glass for containers (bottles, jars, etc.) - >500 tonnes per day
Side fired regenerative glass melting furnace
Manufacture of molten glass for windows (buildings and automotive) - c. 700 – 1000 tonnes per day. Glass melting furnaces consume on average c.700 kWh / day
Continuous metal heat treatment furnaces (various types)
Walking beam furnace: Heat treatment of large slabs of steel - >100,000 tonnes per year, can be over 250 000 tonnes per year consuming over 100,000 MWh/y Mild steel strip annealing furnaces: treat up to 1 million tonnes per year and stainless steel up to 150 000 tonnes per year
Batch metal heat treatment furnaces Cover “bell-type”: Heat treatment of steel strip in reducing atmosphere e.g. N2 + H2, typically 100 tonnes per batch Pusher heat treatment furnace: Typically used for aluminium slabs, batch size 500 - 1200 tonnes
Induction melting furnace Melting metals. For steel these have capacity typically >80 tonnes per batch and for non-ferrous, e.g. aluminium metals typically <50 tonnes per batch

ERA Technology Limited ERA Report No. 2012-0230
043122753 ENTR Lot 4 Final Report v6 39 © ERA Technology Ltd
Size classification and furnace / oven design
Applications and typical size / capacity
Bakery ovens Bread and other baked product manufacture. Size varies considerably, the largest bread oven can produce over 120 tonnes per day and consumes 50MWh primary energy / day, large biscuit ovens have internal volumes of 160 000 litres, are rated at 800 kW and produce 30 tonnes / day whereas small continuous biscuit ovens with a an internal volume of 9000 litres are also used - made by Tecan, Germany, these are medium-size. There are smaller batch food manufacture ovens that may be regarded as “medium-size”
Medium and small industrial furnaces and ovens (most common designs) Batch chamber oven Drying and curing of coatings – all types of materials (chemicals,
washed parts, printed circuit boards, food (rack ovens) – chamber size typically c.100 – 10 000 litres but up to 30 000 litres produced as standard designs
Batch chamber furnace Ceramics, e.g. tableware, and speciality products such as semiconductors fabrication, annealing glassware, heating powdered chemicals, metals heat treatment, – chamber size typically c.100 – 10,000 litres produced as standard designs c.5 litres to 10 000 litres. Larger custom designs up to 100 000 litres (up to 100 tonnes capacity and up to c.500kW rated power) have been built
Continuous tunnel oven Food (biscuits), printed circuit boards, drying and curing materials (e.g. painted panels), capacity typically up to 10 000 litres. Typical 7-zone solder reflow ovens consume about 16kWh per hour or 160kWh per day.
Continuous tunnel furnace Firing small-scale speciality ceramic parts, brazing heat exchangers, ceramic circuit boards, annealing metals and glass parts, typically 150 litres (range 20 – 300 litres)
Vacuum furnace Heat treatment of metals, vacuum brazing typically up to 5 tonnes per batch capacity
Metal melting crucible furnace Melting usually non-ferrous metals (copper, copper alloys, aluminium alloys) capacity up to c.2 tonnes
Retort furnace – material is loaded into a retort that fits into a corresponding space in the furnace
Processes where it is necessary to seal parts inside a separate chamber (the retort) or if rapid temperature change is needed such as metal heat treatment
Rack ovens – batch ovens specifically designed for baking.
Largest are used in factories and smallest for commercial catering. Rated power in the range 40 – 160 kW, typically produce 50 - 200 kg / batch
Laboratory, most common designs Oven (note that vacuum ovens are also produced which are sealed to withstand the vacuum pressure but otherwise are similar to ventilated ovens)
Drying glassware, heating samples for research or testing to <350°C, capacity 6 – 750 litres

ERA Technology Limited ERA Report No. 2012-0230
043122753 ENTR Lot 4 Final Report v6 40 © ERA Technology Ltd
Size classification and furnace / oven design
Applications and typical size / capacity
Furnace Heating samples of materials or parts to >400°C for research or testing, capacity 3 – 120 litres
Incubator Constant temperature and atmosphere for biological processes, capacity 15 – 1000 litres
Heat steriliser Designed to sterilise equipment (Petri dishes, surgical equipment, etc.), capacity 14 – 760 litres
Laboratory tube furnace Research into processes where materials are heated in controlled atmosphere, typically < 10 litres capacity
Large size furnaces and ovens are very complex and are described in section 5. Manufacturers of standard design ovens and furnaces publish catalogues which show examples of their more frequently supplied products. Examples are available from Nabertherm11, Linn High Therm12, RDM (Ovens)13 and Solo Swiss14. Note that many of these also supply laboratory ovens and furnaces although these may be relatively small proportions of their sales. Examples of medium-size ovens and furnaces are shown here (images with thanks from Solo Swiss Group):
11 Nabertherm website for example http://www.nabertherm.de/produkte/index/en illustrates applications and design types. More details at http://www.nabertherm.de/produkte/thermprozesstechnik/thermprozesstechnik_englisch.pdf 12 http://www.linn-high-therm.de/images/stories/ifurnaces.pdf 13 http://www.rdmengineering.co.uk/ovens.htm 14 http://www.soloswiss.com/products/index.html

ERA Technology Limited ERA Report No. 2012-0230
043122753 ENTR L
Figure 3. ExThe followingdesigns:
Small batch chamber oven
Medium size batch furnace (heat treatment with quench tank)
Medium-size continuous heat treatment furnace with on-line quenching
Small batch chamber oven
Medium size batch furnace (heat treatment with quench tank)
Medium-size continuous heat treatment furnace with on-line quenching
Quench tank
ot 4 Final Report v6 41
amples of medium-size ovens and furn diagrams illustrate the main components
© ERA Technology Ltd
aces of simpler, medium size furnace and oven

ERA Technology Limited ERA Report No. 2012-0230
043122753 ENTR Lo
Small
Cross-section cooling at exitbelow or abov
`
Figure 4. Diamedium size
Parts bheatedParts bheated
Door
Vent
Heating elements
Convection fan
Door
Vent
Heating elements
Convection fan
– medium size electrically heated oven (laboratory ovens are the same design)
Thermal insulation
Conveyer belt
eing
Gas side - burners
Cooling
Hot combustion
gases
Thermal insulation
Conveyer belt
eing
Gas side - burners
Cooling
Hot combustion
gases
t
side view of medium-size gas heated continuous tunnel furnace with conveyer belt and . Alternative electrically heated designs will have infrared or convection heaters above, e and below the conveyer belt.
Furnace
Retort with parts
Furnace
Retort with parts
4 Final Report v6 42
grams showing the basic designs ofgas fired tunnel furnaces and retort
Retort furnace: These can be heated electrically or with gas burners. Versions where the retort is inserted into a side opening of the furnace are also produced. Metal melting furnace design is similar with the retort being replaced by a crucible ideally with a lid.
© ERA Technology Ltd
small / medium electric batch ovens, (and crucible melting) furnace

ERA Technology Limited ERA Report No. 2012-0230
043122753 ENTR Lot 4 Final Report v6 43 © ERA Technology Ltd
It is important to point out that no “standard” definitions of large, medium, small or laboratory furnaces and ovens exist, and that these terms are used here as a means of obtaining the data required by this study. Also, there will be overlap between these classifications; for example, laboratory ovens are also used for industrial applications. The safety standard usually used by manufacturers for laboratory equipment is EN 61010-1:2001, but this does not define “laboratory” although it does state that the scope of this standard is:
“Electrical laboratory equipment: This is equipment which measures, indicates, monitors or analyses substances, or is used to prepare materials, and includes in vitro diagnostic (IVD) equipment.
This equipment may also be used in areas other than laboratories, for example self-test IVD equipment may be used in the home”.
The possible boundaries between small, medium and large industrial are discussed in Task 4.
Classification by Process Another classification approach is based on the process being carried out. This is important as this affects the design and the materials that can be used. For example, high temperature insulating wool insulation cannot be used for glass melting furnaces as the liquid glass would rapidly attack it. The main four types of process are.
Process Reason Processes that involve chemical reactions where gases and liquid are present as the major phase for at least part of the process, e.g. metal smelters
The interior lining material needs to withstand the materials within these furnaces. These are often exothermic reactions and so removal of heat may be more important than retaining it.
Furnaces for heating predominantly solids where chemical reactions occur but the material inside the kiln remains as a solid even though melting of phases within the solid material may occur, e.g. cement kilns
The internal furnace lining does not need to have the same chemical resistance as metal smelter linings but these processes can cause significant abrasion of the internal surface where rotary and shaft kilns are used but is less important for tunnel kilns. Retaining heat is usually essential for high energy efficiency
Melting materials such as glass and metal melting furnaces (N.B. melting glass from mineral raw materials requires chemical reaction whereas melting scrap does not)
Liquid metals and liquid glass are very corrosive to many types of ceramic insulation and also to metals and so this limits the choice of furnace lining materials. Good thermal insulation is needed
Heating solids such as drying and metal heat treatment
A much greater variety of thermal insulation can be used as chemical interaction is much less likely (except from gases within the chamber). Therefore insulation with lower thermal mass and low thermal conductivity can be used
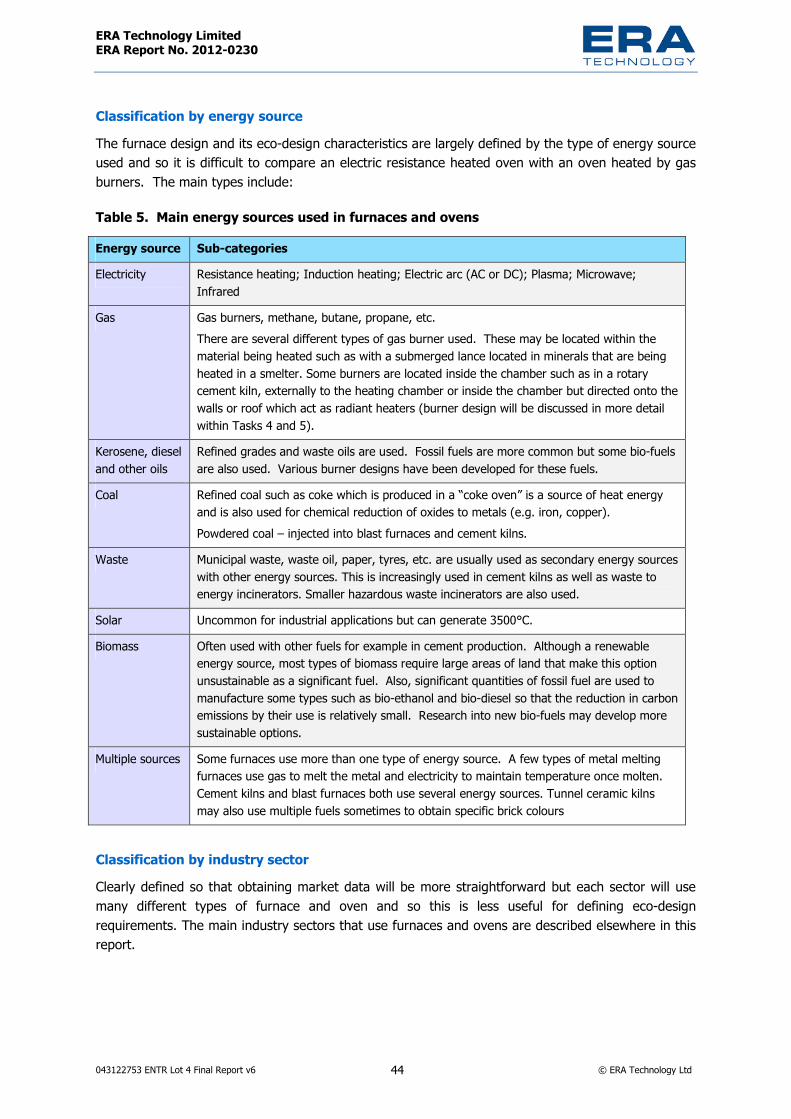
ERA Technology Limited ERA Report No. 2012-0230
043122753 ENTR Lot 4 Final Report v6 44 © ERA Technology Ltd
Classification by energy source The furnace design and its eco-design characteristics are largely defined by the type of energy source used and so it is difficult to compare an electric resistance heated oven with an oven heated by gas burners. The main types include:
Table 5. Main energy sources used in furnaces and ovens Energy source Sub-categories Electricity Resistance heating; Induction heating; Electric arc (AC or DC); Plasma; Microwave;
Infrared Gas Gas burners, methane, butane, propane, etc.
There are several different types of gas burner used. These may be located within the material being heated such as with a submerged lance located in minerals that are being heated in a smelter. Some burners are located inside the chamber such as in a rotary cement kiln, externally to the heating chamber or inside the chamber but directed onto the walls or roof which act as radiant heaters (burner design will be discussed in more detail within Tasks 4 and 5).
Kerosene, diesel and other oils
Refined grades and waste oils are used. Fossil fuels are more common but some bio-fuels are also used. Various burner designs have been developed for these fuels.
Coal Refined coal such as coke which is produced in a “coke oven” is a source of heat energy and is also used for chemical reduction of oxides to metals (e.g. iron, copper). Powdered coal – injected into blast furnaces and cement kilns.
Waste Municipal waste, waste oil, paper, tyres, etc. are usually used as secondary energy sources with other energy sources. This is increasingly used in cement kilns as well as waste to energy incinerators. Smaller hazardous waste incinerators are also used.
Solar Uncommon for industrial applications but can generate 3500°C. Biomass Often used with other fuels for example in cement production. Although a renewable
energy source, most types of biomass require large areas of land that make this option unsustainable as a significant fuel. Also, significant quantities of fossil fuel are used to manufacture some types such as bio-ethanol and bio-diesel so that the reduction in carbon emissions by their use is relatively small. Research into new bio-fuels may develop more sustainable options.
Multiple sources Some furnaces use more than one type of energy source. A few types of metal melting furnaces use gas to melt the metal and electricity to maintain temperature once molten. Cement kilns and blast furnaces both use several energy sources. Tunnel ceramic kilns may also use multiple fuels sometimes to obtain specific brick colours
Classification by industry sector Clearly defined so that obtaining market data will be more straightforward but each sector will use many different types of furnace and oven and so this is less useful for defining eco-design requirements. The main industry sectors that use furnaces and ovens are described elsewhere in this report.
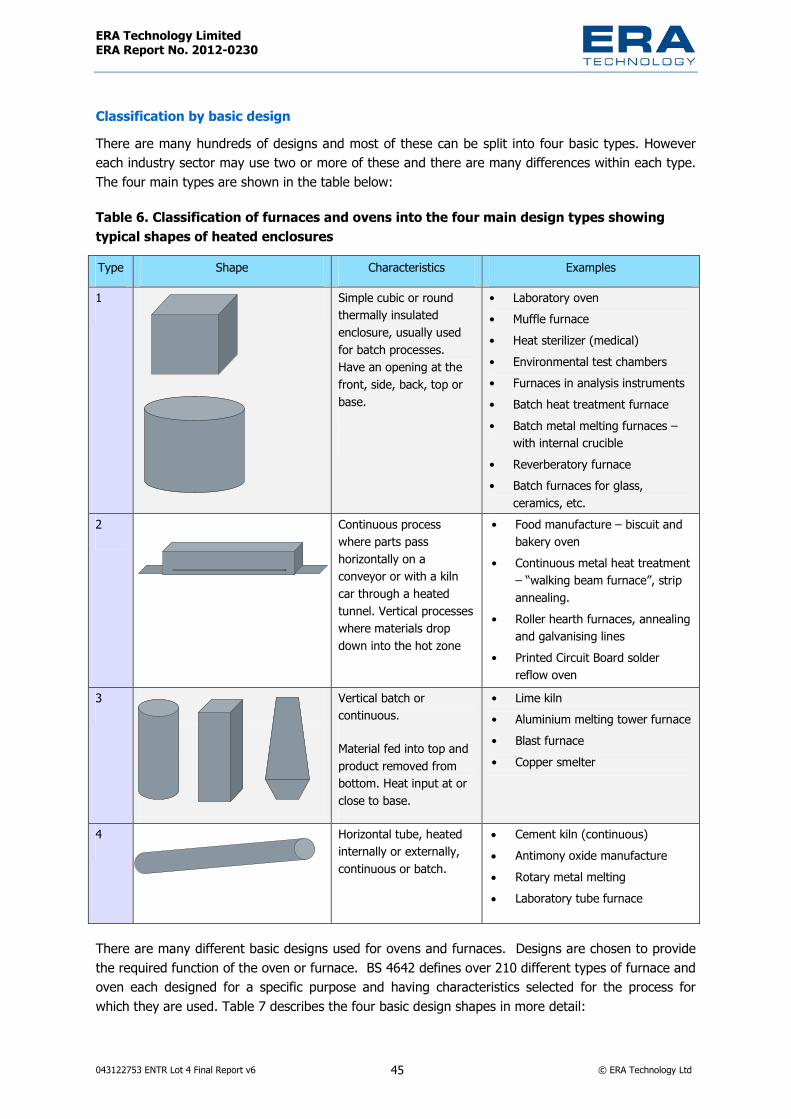
ERA Technology Limited ERA Report No. 2012-0230
043122753 ENTR Lot 4 Final Report v6 45 © ERA Technology Ltd
Classification by basic design There are many hundreds of designs and most of these can be split into four basic types. However each industry sector may use two or more of these and there are many differences within each type. The four main types are shown in the table below:
Table 6. Classification of furnaces and ovens into the four main design types showing typical shapes of heated enclosures Type Shape Characteristics Examples
1 Simple cubic or round thermally insulated enclosure, usually used for batch processes. Have an opening at the front, side, back, top or base.
• Laboratory oven • Muffle furnace • Heat sterilizer (medical) • Environmental test chambers • Furnaces in analysis instruments • Batch heat treatment furnace • Batch metal melting furnaces –
with internal crucible • Reverberatory furnace • Batch furnaces for glass,
ceramics, etc. 2 Continuous process
where parts pass horizontally on a conveyor or with a kiln car through a heated tunnel. Vertical processes where materials drop down into the hot zone
• Food manufacture – biscuit and bakery oven
• Continuous metal heat treatment – “walking beam furnace”, strip annealing.
• Roller hearth furnaces, annealing and galvanising lines
• Printed Circuit Board solder reflow oven
3 Vertical batch or continuous.
Material fed into top and product removed from bottom. Heat input at or close to base.
• Lime kiln • Aluminium melting tower furnace • Blast furnace • Copper smelter
4 Horizontal tube, heated internally or externally, continuous or batch.
• Cement kiln (continuous) • Antimony oxide manufacture • Rotary metal melting • Laboratory tube furnace
There are many different basic designs used for ovens and furnaces. Designs are chosen to provide the required function of the oven or furnace. BS 4642 defines over 210 different types of furnace and oven each designed for a specific purpose and having characteristics selected for the process for which they are used. Table 7 describes the four basic design shapes in more detail:

ERA Technology Limited ERA Report No. 2012-0230
043122753 ENTR Lot 4 Final Report v6 46 © ERA Technology Ltd
Table 7. Basic designs of furnaces and ovens Basic designs Variations Type 1: Static enclosure with a door at the front, top, sides or base. Materials being heated batch-wise are either solid or if these melt may be held in a separate container (a crucible) or supported on the base or “hearth” made of ceramic bricks. This is the most common design being essentially an enclosure having a roof, floor and four walls.
Heated internally or externally, fan assisted or gravity convection. Atmosphere can be air, controlled gases or vacuum. Heat can be applied by heaters on the side walls, the roof, the base or internally such as via heated shelves. Electric or gas / oil burner are used for heating. These can be constructed so that the materials are loaded into the oven or furnace through a door or the oven / furnace is hoisted up and down over the materials that are to be heated.
Type 2: Enclosed chamber with conveyor that carries material through one or more hot zones. Used for continuous processes.
Internally heated with one or more heat zones. Atmosphere can be controlled. Many are linear but some circular designs are also used.
Type 3: Vertical cylinder or similar shapes mainly used as continuous processes with feedstock loaded into the top and product removed from the base although products from some processes emerge from the top as fumes.
Usually filled from the top and heated either at the base, internally or externally. Blast furnaces have this type of shape although they are narrower at the top and base than in the middle region.
Type 4: Horizontal cylinder used either batch-wise with material pre-loaded or continuously where material is fed in at one end and emerges after processing from the other.
Tube furnace, static or rotating, heated externally or internally. Atmosphere can be air, controlled gases or vacuum. Cement kilns are tilted about 5 degrees from horizontal so that material travels from one end to the other in a continuous process.
Intended users – professional / consumer The vast majority of furnaces sold in the EU are used by professionals and in manufacturing processes, but a small number are sold to consumers for hobbies such as pottery and jewellery production. These are usually purpose-designed for this market with relatively low prices, although most are similar in design to laboratory furnaces.
Intended users – Commercial catering / food manufacture Domestic cooking ovens are used by consumers, and commercial catering ovens are used by small businesses such as restaurants and hotels, but also by institutions such as schools and hospitals as well as in office canteens. Domestic and commercial catering ovens have been studied by the DG ENER Lot 22 preparatory study15 and so these do not need to be covered by the present study. This study will however consider ovens used for food manufacture used in factories and it will be important to define these two types of oven. This may not be straightforward as some commercial catering ovens are used in food production factories and some small food manufacturing ovens are used in large catering establishments and in supermarket bakeries. In practice, the difference between food manufacture and commercial catering may be summarised as follows:
15 DG ENER Lot 22 and 23 preparatory studies, www.ecocooking.org

ERA Technology Limited ERA Report No. 2012-0230
043122753 ENTR Lot 4 Final Report v6 47 © ERA Technology Ltd
Food manufacture - food is prepared and packaged for distribution to retail and other outlets for sale to consumers who may not eat the food on the date of purchase. Factory-made bread, for example, may be consumed on the same day of production as being sold by the retailer to the customer. The retailer will be at different premises to the manufacturer, but this cannot be used as a differentiator since some commercial catering is carried out centrally and then distributed to other locations, where it is served. Commercial catering – food is usually prepared for immediate consumption. This might be at the same premises (e.g. restaurants) or elsewhere (e.g. pizza home delivery). Some consumers may, however, not consume the food immediately, and instead decide to store it for a period. The essential characteristic is that the food is prepared and then supplied directly to the consumer, rather than via a third party retailer. The food will usually be intended for consumption soon after preparation (within the same day) although some consumers may choose to consume it later. Typical catering ovens are different in design to food manufacture ovens but there will be some overlap. For example, smaller bread manufacturers may use the same type of oven as a large supermarket bakery. One differentiator for gas ovens is that those that are used for commercial catering are within scope of the EU Gas Appliances Directive [“GAD”] (2001/142/EC) but industrial food manufacture ovens are excluded from the scope of the GAD. It is not possible to differentiate electrically-heated ovens in this way. There are two main types of industrial food oven used:
- Large tunnel ovens used to manufacture bread, biscuits, etc. These typically produce more than 10 tonnes of product per day. These are not used for commercial catering although small ovens with conveyers are used in retail premises to cook pizzas etc. but much less than 10 tonnes per day.
- Batch bakery ovens. These are used in factories and for commercial catering and designs are essentially the same and so it is not possible to define industrial batch bakery ovens except by where they are used. Batch bakery ovens have however been studied in Ecodesign ENER Lot 22 and it would therefore be appropriate to consider the eco-design of all batch bakery ovens by a single implementing measure.
Several other types of industrial food ovens are used such as spray driers but these are not used for commercial catering.
Additional functions of heated chambers Ovens and furnaces are essentially enclosed chambers in which materials are heated and their main function is to heat these materials. However there are many different types of equipment that heat materials within an enclosed chamber, but which have other functions. These ovens and furnaces are designed with either additional functions, or for specific purposes, and some of these are not normally referred to as “ovens” or “furnaces”. For example:
• Incubators – enclosure at a controlled temperature. The temperature used typically varies from 5°C to 90°C. Where temperatures of <35°C are used, the incubators usually need to provide cooling with refrigeration as well as heating because controlling temperature at <35°C in hot climates is difficult or impossible without a refrigeration function. Some types of incubator also inject carbon dioxide and control the CO2 concentration within the chamber. There are also

ERA Technology Limited ERA Report No. 2012-0230
043122753 ENTR Lot 4 Final Report v6 48 © ERA Technology Ltd
anaerobic incubators that operate using an oxygen-free atmosphere. Heating is not the only primary function, and so these appliances perhaps should not be defined as ovens.
• Environmental chamber – used for testing and comprise two main types. One type cycles temperature between a maximum and minimum (and some can follow more complex cycles) whereas other types control and vary relative humidity as well as temperature. Much less common are heated chambers in which the atmosphere is controlled by injecting gases such as H2S that are used for corrosion testing. Environmental chambers usually provide both heating and cooling, often using refrigeration or cooling by evaporation of liquid CO2. As with incubators, heating is not the only primary function, and therefore these appliances perhaps should not be defined as ovens.
• Sterilisers – there are several types of product called sterilisers and several of these are “ovens”. Sterilisation can be achieved chemically, using radiation or by heat. Heat sterilisation can be achieved using immersion in hot water as well as by heating in a chamber i.e. an oven (typically at 180°C). Autoclaves are another type, which sterilise by heating in pressurised steam (typically at c.130°C).
• Plant growth chambers – These are used to grow plants in a controlled environment. The temperature is set at c.30°C and the humidity and ambient light is controlled. Temperature control requires both heating and cooling (refrigeration). These appliances do not meet the definition of an oven, as heating is not the only primary function.
Ovens and furnaces are available in many different designs and sizes, many of which are defined in UK standard BS 4642:1970. This defines a fairly comprehensive list of ovens and furnaces, although it is now nearly 40 years old and thus new equipment types are not included.
A selection of types of ovens and furnaces is listed in Table 8 to illustrate the variety on the EU market. These have been classified into three sizes although some of these are constructed in very wide size ranges:
Table 8. Examples of common types of furnace and oven and their main uses Name of product Main functions Comments Drying oven Oven designed for drying materials
(chemicals, parts, paint, laboratory glassware, etc.).
Controlled air flow-through rate is necessary to remove water vapour from materials being dried. Drying ovens are designed for specified numbers of changes of air per hour.
Vacuum oven Heat materials at a relatively low temperature to remove moisture or solvents. Useful for heat-sensitive materials.
Removes liquids at a lower temperature than is possible at room temperature. There is no air heat flowing through a vacuum so heat transfer can be slow but no heat is lost in heating air inside the chamber.
Analytical instruments
Ovens and furnaces are part of these products which are used to analyse materials. Examples include gas chromatographs, liquid chromatography, total organic carbon analysis, atomic adsorption analysers and thermal analysers for steel and for hydrocarbons.
Ovens and furnaces are designed specifically to be installed as part of the analytical instruments. Some models include low power modes.
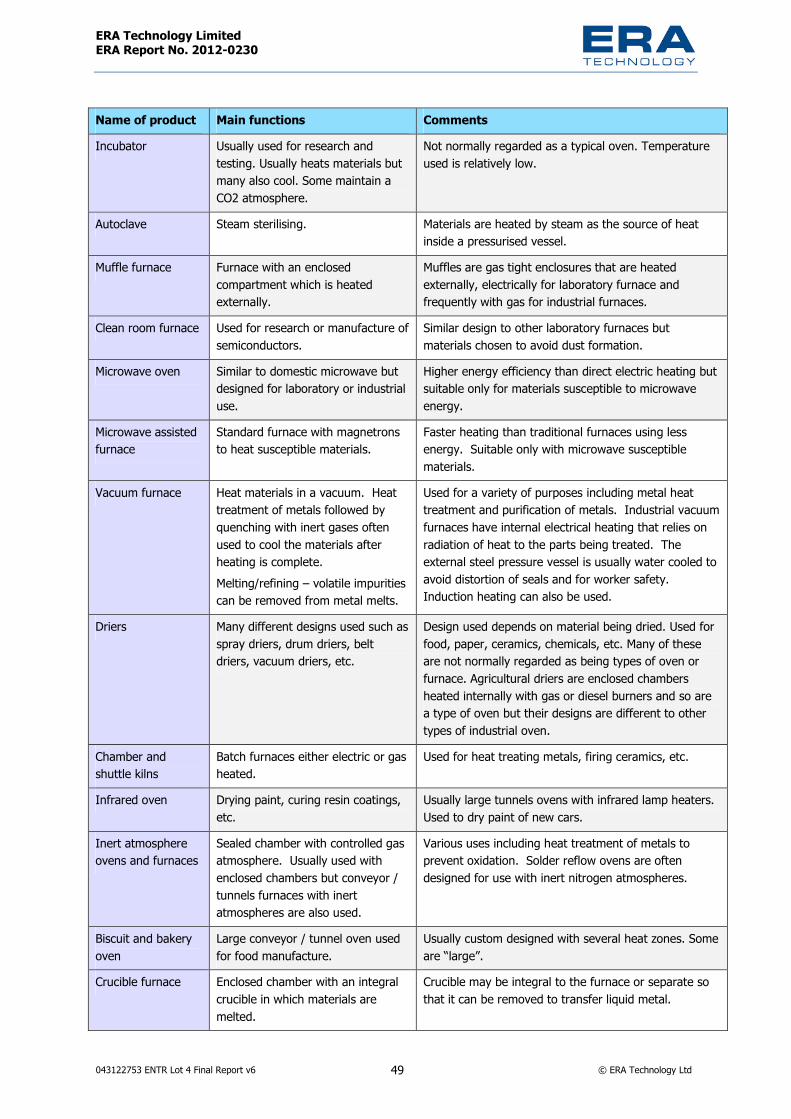
ERA Technology Limited ERA Report No. 2012-0230
043122753 ENTR Lot 4 Final Report v6 49 © ERA Technology Ltd
Name of product Main functions Comments Incubator Usually used for research and
testing. Usually heats materials but many also cool. Some maintain a CO2 atmosphere.
Not normally regarded as a typical oven. Temperature used is relatively low.
Autoclave Steam sterilising. Materials are heated by steam as the source of heat inside a pressurised vessel.
Muffle furnace Furnace with an enclosed compartment which is heated externally.
Muffles are gas tight enclosures that are heated externally, electrically for laboratory furnace and frequently with gas for industrial furnaces.
Clean room furnace Used for research or manufacture of semiconductors.
Similar design to other laboratory furnaces but materials chosen to avoid dust formation.
Microwave oven Similar to domestic microwave but designed for laboratory or industrial use.
Higher energy efficiency than direct electric heating but suitable only for materials susceptible to microwave energy.
Microwave assisted furnace
Standard furnace with magnetrons to heat susceptible materials.
Faster heating than traditional furnaces using less energy. Suitable only with microwave susceptible materials.
Vacuum furnace Heat materials in a vacuum. Heat treatment of metals followed by quenching with inert gases often used to cool the materials after heating is complete. Melting/refining – volatile impurities can be removed from metal melts.
Used for a variety of purposes including metal heat treatment and purification of metals. Industrial vacuum furnaces have internal electrical heating that relies on radiation of heat to the parts being treated. The external steel pressure vessel is usually water cooled to avoid distortion of seals and for worker safety. Induction heating can also be used.
Driers Many different designs used such as spray driers, drum driers, belt driers, vacuum driers, etc.
Design used depends on material being dried. Used for food, paper, ceramics, chemicals, etc. Many of these are not normally regarded as being types of oven or furnace. Agricultural driers are enclosed chambers heated internally with gas or diesel burners and so are a type of oven but their designs are different to other types of industrial oven.
Chamber and shuttle kilns
Batch furnaces either electric or gas heated.
Used for heat treating metals, firing ceramics, etc.
Infrared oven Drying paint, curing resin coatings, etc.
Usually large tunnels ovens with infrared lamp heaters. Used to dry paint of new cars.
Inert atmosphere ovens and furnaces
Sealed chamber with controlled gas atmosphere. Usually used with enclosed chambers but conveyor / tunnels furnaces with inert atmospheres are also used.
Various uses including heat treatment of metals to prevent oxidation. Solder reflow ovens are often designed for use with inert nitrogen atmospheres.
Biscuit and bakery oven
Large conveyor / tunnel oven used for food manufacture.
Usually custom designed with several heat zones. Some are “large”.
Crucible furnace Enclosed chamber with an integral crucible in which materials are melted.
Crucible may be integral to the furnace or separate so that it can be removed to transfer liquid metal.

ERA Technology Limited ERA Report No. 2012-0230
043122753 ENTR Lot 4 Final Report v6 50 © ERA Technology Ltd
Name of product Main functions Comments Induction furnace Furnace which uses induction
heating usually to heat a metal crucible in which materials metals are melted.
Typically, RF coils which are usually a water-cooled copper pipe formed into a coil shape and connected to the high frequency generator and this surrounds a metallic crucible which is heated.
Electron beam furnace
Uses an intense electron beam to melt metals which have very high melting temperatures such as tungsten.
Metal melted on a water-cooled copper hearth so that it is in contact only with itself to avoid contamination. No ceramics available that can withstand molten tungsten or other metals at 3000°C.
Tunnel or conveyor oven
Materials or parts travel on a conveyor through a chamber with one or more heating zones.
Common continuous oven design used for cooking food, drying and other processes. Tunnel ovens can have more than 10 separate heating zones to provide a specific temperature profile suitable for a specific process, such as melting solder on printed circuit boards (these are referred to as reflow ovens).
Tunnel and roller kilns
Continuous furnace – similar to ovens but designed for higher temperatures.
Continuous furnace with one or more zones. Parts pass through in kiln cars on conveyors or without kiln cars on a series of rollers.
Plasma furnace Plasma heating can be used with a variety of furnace designs.
Plasma provides high intensity heat directly and so can be very energy efficient. Used for producing nanomaterials, metal refining and waste treatment.
Blast furnace A vertical, refractory lined structure fed with raw materials at the top, burners are situated towards the base and liquid iron is removed from the bottom.
Used for the reduction of ores to metal, particularly iron from iron ore on a very large scale (see Table 10 for more details).
Reverberatory furnace
Round or rectangular furnaces lined with refractory bricks and heated using burners on the walls and roof.
Used for melting and refining of a variety of metals including aluminium. Designs vary depending on the intended process. Low energy efficiency although this can be improved by using regenerative burners.
Shaft (tower) furnace
Vertical furnace in which material is fed into the top and heated at or near to the base.
Lime kilns, continuous metal melting, etc., can be fairly energy efficient as heat rises through charge and heats cold feed descending through shaft.
Retort furnace These utilise an enclosure that contains the parts that are to be heated. The retort is lowered and raised into and out of a separate outer enclosure that contains the heaters.
The advantage is that the heated parts can be rapidly removed from the heat source and transferred to a second cooling chamber that, for example contain cold oil which cools much more quickly than air flow cooling.
Fluidised bed furnace
Various uses including incineration and mineral processing.
Fluidised beds are used to achieve more uniform temperature control.
A summary of the most useful classification approaches is described below:

ERA Technology Limited ERA Report No. 2012-0230
043122753 ENTR Lot 4 Final Report v6 51 © ERA Technology Ltd
Size
Chemical reactions involving gas, liquid & solid
Chemical reactions where material remains mainly solid throughout
Mainly melting of solids
Heating solids, predominantly phase changes only
Steel blast furnace (Cont) 3
Cement kilns (Cont) 4
Glass melting furnaces (Cont) 1, 2
Ceramics roller and tunnel kilns (Cont) 2
Steel Direct Reduction furnace (Cont) 3 Lime Kiln (Cont) 3
Non-ferrous metal melting - shaft furnace (Cont) 3
Ceramics drying ovens (Batch & Cont) 1, 2
Basic oxygen furnace (Batch) 1
Coating curing (Cont) 2
Metal holding furnace (Batch) 1
Metals heat treatment (various types - Batch & Cont) 1 & 2
Metal smelters (e.g. copper) (Cont) 1 - 4
Chemical production furnaces (Batch) 1
Induction metal melting (Batch) 1
Chemical dryers (box oven - Batch) 1
Petrochem furnaces, e.g. crackers (Cont) 1
Electric arc furnace (Batch)1
Paper dryers (Cont - usually steam heat) 2
WtE incinerators (Cont) 3
Galvanising furnace (Cont) 2 Glass Lehr furnace (Cont) 2
Hazardous waste incinerators, no energy recovery (Batch) 1
Ceramic powder rotary kilns (Cont) 4
Metal melting (foundries - Batch) 1
Food manufacture (Batch & Cont) 1& 2 (also some large-size)
Semiconductor & PV (Cont) 1
Metal scrap recovery (Batch) 1
Printed circuit boards (Cont) 2
Fluidised bed furnace (Batch) 1
Glass melting (remelting - Batch) 1 Microwave dryers 1, 2
Rotary furnace for zinc oxide production (Batch) 4
Electron beam melting (Batch) 1
Electric dryers (Batch & Cont) 1, 2Infrared drying and curing ovens (Cont + some batch) 2 & some 1Chamber and shuttle kilns (Batch) 1Conveyor ovens - various processes (Cont) 2Box ovens (Batch) 1Grain dryers (Fluidised bed / mixed flow - Cont) 1Rotary drum dryers (usually Cont) 4Spray dryers (various materials - Continuous) 1Metals heat treatment (various types - Batch & Cont) 1 & 2Laboratory drying ovens (Batch) 1Incubators (Batch) 1Autoclaves (Batch) 1
Artisan furnaces (Batch) 1Dental furnace (Batch) 1
Medium size industrial (standard /
custom designs)
Very Large size (Usually custom
designs)
Process type
Laboratory furnaces (Batch) 1, 4
Laboratory (most standard design)
and small standard design industrial
Figure 5. Furnace and oven classifications
1 "Box"2 Tunnel / conveyer3 Tower / shaft4 Horizontal tube / rotary
ElectricGasCoal/oil/gas combinationWaste Electric or gas (or oil)
Key to shape
Key to power source

ERA Technology Limited ERA Report No. 2012-0230
043122753 ENTR Lot 4 Final Report v6 52 © ERA Technology Ltd
One question that needs to be decided is the boundary between the three size ranges in Figure 5. Suggestions are:
• Laboratory furnaces are <60 litres capacity (a limit of <120 litres could be used) • Laboratory ovens are <750 litres capacity • “Medium-size” furnaces and ovens – batch <10 tonnes capacity and larger than laboratory
capacity • “Medium-size” furnaces and ovens – continuous <20 tonnes/day and larger than laboratory
capacity. 20 tonnes / day is suggested as the boundary to denote "medium-size", as this is the lower limit for the scope of the IED for several types of installation, although several sectors have higher limits. Batch furnaces of > 10 tonnes, and continuous furnaces with capacity of >20 tonnes per day, are relatively large and complex. The lower limit of the EU Emissions Trading Scheme’s scope for several industrial processes is 20MW, but this is a far larger capacity than 20 tonnes per day, and so cannot be considered as equivalent.
Therefore, “large” furnaces and ovens could be classified as:
• batch = >10 tonnes capacity • continuous = >20 tonnes/day.

ERA Technology Limited ERA Report No. 2012-0230
043122753 ENTR Lot 4 Final Report v6 53 © ERA Technology Ltd
1.2.1 Prodcom categories EU Prodcom data for production and sales includes the following categories for “ovens and furnaces”, excluding domestic and commercial catering oven Prodcom categories. Categories from the 2008 Prodcom version 2 data are as follows:
Table 9. Prodcom categories that include furnaces and ovens Category no. Category description 28.21.11.30 Furnace burners for liquid fuel 28.21.11.50 Furnace burners for solid fuel or gas (including combination burners) 28.21.11.70 Mechanical stokers (including their mechanical grates, mechanical ash dischargers and similar
appliances) 28.21.12.30 Non-electric furnaces and ovens for the roasting, melting or other heat-treatment of ores,
pyrites or of metals 28.21.12.70 Industrial or laboratory furnaces and ovens, non-electric, including incinerators (excluding
those for the roasting, melting or other heat treatment of ores, pyrites or metals, bakery ovens, drying ovens and ovens for cracking operations)
28.21.13.30 Electric bakery and biscuit ovens 28.21.13.51 Resistance heated industrial or laboratory furnaces and ovens (excluding bakery and biscuit
ovens) 28.21.13.53 Electrical induction industrial or laboratory furnaces and ovens 28.21.13.55 Electrical industrial/laboratory furnaces/ovens, induction/dielectric heating equipment.
Including dielectric furnaces/ovens excluding infra-red radiation ovens, resistance heated furnaces/ovens
28.21.13.57 Electric infra-red radiation ovens 28.21.14.30 Parts for furnace burners for liquid fuel, for pulverized solid fuel or for gas, for mechanical
stokers, mechanical grates, mechanical ash discharges and similar appliances 28.21.14.50 Parts for non-electric industrial or laboratory furnaces and ovens 28.21.14.70 Parts for industrial or laboratory electric, induction or dielectric furnaces and ovens or heating
equipment 28.93.15.30 Bakery ovens, including biscuit ovens, non-electric 28.93.15.80 Non-domestic equipment for cooking or heating food (excluding non-electric tunnel ovens, non-
electric bakery ovens, non-electric percolators) 32.50.11.50 Instruments and appliances used in dental sciences (excluding drill engines) 32.50.12.00 Medical, surgical or laboratory sterilisers
Clearly, several of these categories are for furnace accessories such as burners and there are several relevant categories that are for ovens and furnaces. There are however two categories, 32.50.11.50 and 32.50.12.00, which include a variety of different products, many of which are not furnaces or ovens, e.g. particularly category 32.5.12.00 in which dental laboratory furnaces are a very small proportion. There are also several categories which include products within the scope of the DG ENER Ecodesign Lot 22 “oven” preparatory, study such as 28.93.15.80.

ERA Technology Limited ERA Report No. 2012-0230
043122753 ENTR Lot 4 Final Report v6 54 © ERA Technology Ltd
1.2.2 Other classifications Ovens and furnaces could alternatively be defined and differentiated by their functions and characteristics, such as:
Temperature There is no standard temperature definition for the boundary between ovens and furnaces as discussed above. Some manufacturers refer to ovens as having a maximum temperature of 600°Cand furnaces as having maximum temperatures >600°C, although others have said that they regard the boundary as being 400°C. Some furnaces can be controlled to operate at <600°C, although the temperature control may be less precise than an oven at < c. 300°C, depending on the type of temperature controller and the furnace design. Most laboratory ovens sold in the EU operate at up to 250°C or 300°C and can be controlled to a minimum temperature of c.40°C. If lower temperatures are required, refrigeration is used. Products sold as “ovens” have intended operating temperature of at least 100°C. In practice, there is no need to differentiate ovens and furnaces, as each eco-design option can be specific to a certain temperature range.
Throughput The throughput of furnaces varies enormously with small laboratory furnaces processing as little as a few kilograms per year to blast furnaces that can produce over 3 million tonnes of iron annually. The choice of furnace design is often based on throughput requirements. For example, tower furnaces are energy efficient for melting scrap aluminium but are only suitable for large installations. SMEs may not process sufficient material for this type of furnace, and so have to use a less energy-efficient design, such as a gas fired crucible furnace.
Functions Ovens and furnaces perform many hundreds of different functions utilising the design features described in this report. Smaller ovens and furnaces tend to be standard off-the-shelf products although many of these are modified to suit particular requirements. Many larger industrial ovens and furnaces are custom designs, although most custom designs are based on one of the basic types described in this report, with the size, dimensions, fuel, temperature and ancillary equipment being specific to the specific process requirements.
The design of an oven or furnace can affect its energy efficiency and other aspects of the process and these issues are described in Task 4. Examples include the many designs of aluminium melting furnaces which are described in Table 62.
1.2.3 Definition by industry sector Certain industries use specific types of oven and furnace although most sectors use many different types. More in-depth technical discussion of these furnaces will be included in task 4. Types of ovens and furnaces designed for specific industrial applications include the following examples:

ERA Technology Limited ERA Report No. 2012-0230
043122753 ENTR Lot 4 Final Report v6 55 © ERA Technology Ltd
Table 10. Examples of types of furnace and oven used by main industry sectors Industry sector Description and design types of oven or furnace
The steel industry uses a variety of oven and furnace types which include: • Coke ovens - used to convert coal into coke which is mixed with iron ore and
limestone to produce the sinter which is the blast furnace feedstock. • Blast furnaces - used to convert iron ore into iron. Blast furnaces operate
continuously for many years until the refractory insulation needs to be replaced. A mixture of iron ore, carbon (coal or coke) and limestone are fed into the top and the furnace is heated usually by gas or oil burners located near to the base. Liquid iron and slag collect at the bottom and are run out either into moulds or to the next process step (the basic oxygen furnace).
• Basic Oxygen Furnace (BOF) – these are used to purify crude iron and convert it into steel. Oxygen is injected via a lance into liquid iron. The oxygen reacts with impurities, especially carbon to produce gaseous oxides (such as carbon monoxide and dioxide). This type of furnace can be a net energy producer as the oxygen / carbon reaction is exothermic. Although called a “furnace”, this is not a typical furnace as there is no heat input (as normally understood). Heat enters the furnace in the form of hot liquid pig iron and by the exothermic oxidation reactions.
• Open hearth furnace – used to convert pig iron into steel. Less energy efficient than the BOF, and therefore, most have been closed down in the EU and elsewhere (the hearth is the floor of a furnace).
• Electric arc furnace – these are used to melt scrap iron although they are also used by other industries mainly for melting metals. Some arc furnaces are used to treat a mixture of scrap metal and mineral feed-stocks (These are essentially type 1).
• Heat treatment furnaces – uses a variety of designs. Include very large continuous furnaces that consume very large amounts of energy.
• Insulated vessels are also used for holding liquid steel for moving it from one process stage to another and for feeding into casting processes. As there is no heating, these would not be regarded as furnaces.
Steel industry
• Direct reduction furnaces use either gas or coal so there is no need to make coke. Fourteen different direct reduction furnace designs have been developed and these are all used with electric arc furnaces to produce steel (one plant in Germany).
Foundries / metal melting
Metals are melted in melting furnaces for producing specific alloy compositions and for casting into moulds to make metal castings. Used primarily for aluminium alloys, steel, zinc alloys and copper alloys. Metals are melted in many types of furnace including induction melting, vacuum melting, crucible, rotary, etc. A wide variety of purpose designed furnaces are used. The design depends on the metal ore or scrap composition. There are several designs that have been developed by metal refiners and others developed by furnace manufacturers. Some examples are:
Non-ferrous metals production and recycling
• Production of copper metal from sulphide ores (and some scrap) uses two basic types of smelting furnace – bath smelting or flash smelting although the draft non-ferrous metals IPPC BREF lists 14 types of furnace that are used to refine copper. Flash smelters operate at a very high rate whereas bath smelters produce sulphur dioxide emissions at a higher concentration that is easier to collect. Further furnace processes are used to purify crude copper and scrap copper (fire refining) and others are used to recover metals from slags which are by-products of smelting. Fabricated
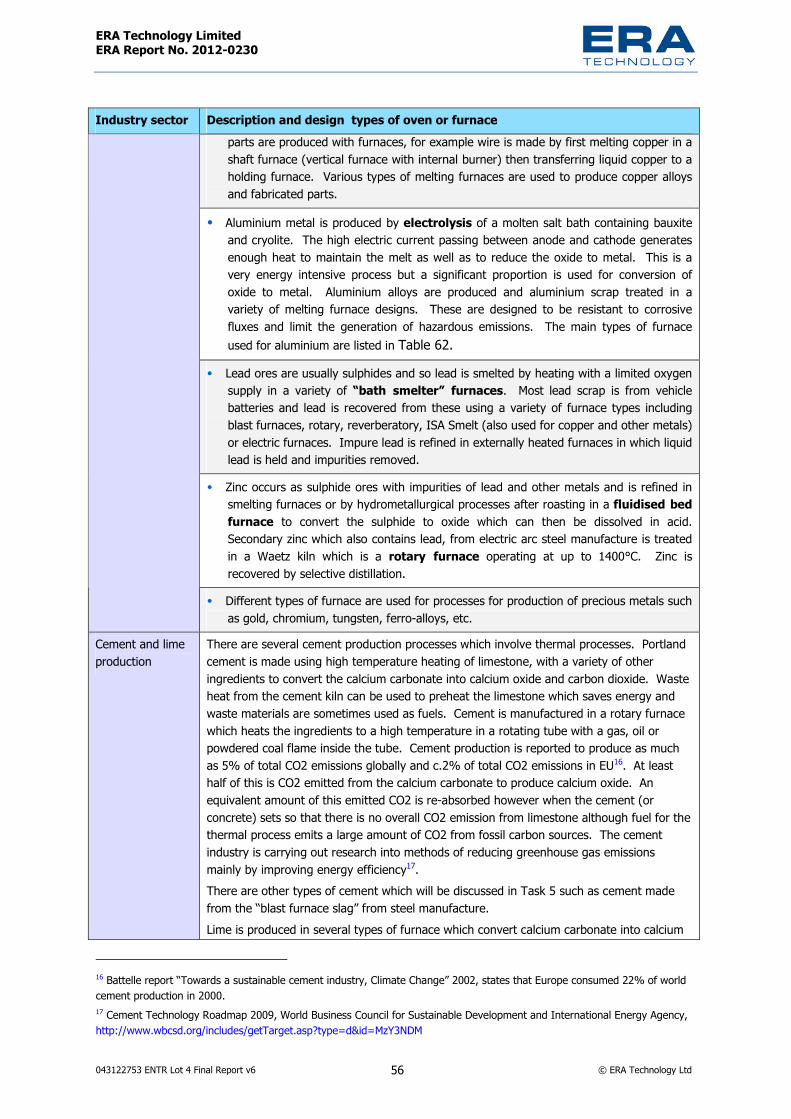
ERA Technology Limited ERA Report No. 2012-0230
043122753 ENTR Lot 4 Final Report v6 56 © ERA Technology Ltd
Industry sector Description and design types of oven or furnace parts are produced with furnaces, for example wire is made by first melting copper in a shaft furnace (vertical furnace with internal burner) then transferring liquid copper to a holding furnace. Various types of melting furnaces are used to produce copper alloys and fabricated parts.
• Aluminium metal is produced by electrolysis of a molten salt bath containing bauxite and cryolite. The high electric current passing between anode and cathode generates enough heat to maintain the melt as well as to reduce the oxide to metal. This is a very energy intensive process but a significant proportion is used for conversion of oxide to metal. Aluminium alloys are produced and aluminium scrap treated in a variety of melting furnace designs. These are designed to be resistant to corrosive fluxes and limit the generation of hazardous emissions. The main types of furnace used for aluminium are listed in Table 62.
• Lead ores are usually sulphides and so lead is smelted by heating with a limited oxygen supply in a variety of “bath smelter” furnaces. Most lead scrap is from vehicle batteries and lead is recovered from these using a variety of furnace types including blast furnaces, rotary, reverberatory, ISA Smelt (also used for copper and other metals) or electric furnaces. Impure lead is refined in externally heated furnaces in which liquid lead is held and impurities removed.
• Zinc occurs as sulphide ores with impurities of lead and other metals and is refined in smelting furnaces or by hydrometallurgical processes after roasting in a fluidised bed furnace to convert the sulphide to oxide which can then be dissolved in acid. Secondary zinc which also contains lead, from electric arc steel manufacture is treated in a Waetz kiln which is a rotary furnace operating at up to 1400°C. Zinc is recovered by selective distillation.
• Different types of furnace are used for processes for production of precious metals such as gold, chromium, tungsten, ferro-alloys, etc.
Cement and lime production
There are several cement production processes which involve thermal processes. Portland cement is made using high temperature heating of limestone, with a variety of other ingredients to convert the calcium carbonate into calcium oxide and carbon dioxide. Waste heat from the cement kiln can be used to preheat the limestone which saves energy and waste materials are sometimes used as fuels. Cement is manufactured in a rotary furnace which heats the ingredients to a high temperature in a rotating tube with a gas, oil or powdered coal flame inside the tube. Cement production is reported to produce as much as 5% of total CO2 emissions globally and c.2% of total CO2 emissions in EU16. At least half of this is CO2 emitted from the calcium carbonate to produce calcium oxide. An equivalent amount of this emitted CO2 is re-absorbed however when the cement (or concrete) sets so that there is no overall CO2 emission from limestone although fuel for the thermal process emits a large amount of CO2 from fossil carbon sources. The cement industry is carrying out research into methods of reducing greenhouse gas emissions mainly by improving energy efficiency17.There are other types of cement which will be discussed in Task 5 such as cement made from the “blast furnace slag” from steel manufacture. Lime is produced in several types of furnace which convert calcium carbonate into calcium
16 Battelle report “Towards a sustainable cement industry, Climate Change” 2002, states that Europe consumed 22% of world cement production in 2000. 17 Cement Technology Roadmap 2009, World Business Council for Sustainable Development and International Energy Agency, http://www.wbcsd.org/includes/getTarget.asp?type=d&id=MzY3NDM

ERA Technology Limited ERA Report No. 2012-0230
043122753 ENTR Lot 4 Final Report v6 57 © ERA Technology Ltd
Industry sector Description and design types of oven or furnace oxide. These include rotary kilns (similar to cement kilns), shaft kilns (top-fed vertical structures) and parallel flow regenerative kilns (the most numerous type in EU and is essentially a U-shaped structure).
Metal heat treatment
A variety of heat treatment processes are carried out with metal parts. The process conditions depend on the alloy and the treatment required. For example: • Steels are re-heated in batch or continuous processes for subsequent metal forming
processes and this is usually carried out in air. Annealing is usually carried out in protective atmospheres such as hydrogen in bell-type batch furnaces but strip steel can also be annealed by continuous processes.
• Nickel alloys and copper alloys are heat treated in either vacuum furnaces or furnaces containing an inert atmosphere. Some processes require high pressure such as nitriding of steel in which steel is heated in ammonia gas which dissociates into nitrogen and hydrogen. Most heat treatment procedures require rapid quenching which is achieved by injecting cold inert gases after the heating cycle.
• Aluminium alloy heat treatment requires lower temperatures in air, typically c.200°C but is alloy dependent and can be 150 – 600°C (<500°C electric and >500°C gas heated).
• Brazing of aluminium, copper and steel alloys may be carried out in vacuum, inert gas furnaces or in reducing atmospheres.
Ceramics Ceramics are brittle materials and are susceptible to cracking when exposed to rapid temperature changes. Ceramics production may require a drying stage followed by a high temperature treatment. Furnaces designed for sintering industrial ceramics, bricks, pottery, tiles, etc. are designed with controlled rates of temperature increase and cooling. Tunnel and roller kilns are used for some products but these are inevitably large with long heat treatment times (typically 36 hours)18 but times can vary from 2.5 hours for some types of clay blocks up to 60 hours for some types of facing bricks. • Brick and tile kilns tend to be very large and the design depends on the type of clay
used. New furnaces for bricks and roof tile are tunnel kilns whereas porcelain and wall tiles are made in roller kilns.
• Pottery kilns are of a wide range of size and design depending on throughput, usually roller kilns for high throughput and batch shuttle furnaces for artisans and other small-scale users.
• A variety of ceramic powders and manufactured in rotary furnaces
• A variety of driers are used to dry materials before firing. These include spray driers and fluidised bed driers.
Glass Glass is produced from a mixture of raw materials often with some scrap glass (cullet). The raw materials melt fairly slowly and a variety of chemical reactions occur before the final glass composition is produced. Different types of furnace are used depending on the scale of the process and the product but glass making and melting is the most energy consuming phase of glass product manufacture accounting for c.75% of the total furnace energy. Glass production can involve many furnace steps: glass melting, formation into shapes (containers, sheet, etc.), controlled cooling (Lehrs), annealing, coating, toughening, etc.
18 BBC Radio 4 interview “You and yours”, Simon Parks, December 2009.

ERA Technology Limited ERA Report No. 2012-0230
043122753 ENTR Lot 4 Final Report v6 58 © ERA Technology Ltd
Industry sector Description and design types of oven or furnace Glass melting, float glass production and controlled cooling use three separate furnaces but these operate consecutively and continuously. Large scale processes use cross-fired regenerative furnaces and these are used for float glass and often for container glass. Regenerative end port furnaces, recuperative unit melters, oxy-fuel and electric furnaces are used for medium and small size installations. Batch furnaces are used for smaller scale production whereas large-scale installations are continuous processes. Glass articles when made are in a highly stressed state and susceptible to cracking. These are heat treated in a furnace at a temperature below the softening temperature and cooled slowly to remove these stresses. Glass sheet manufacture furnaces are often designed and built by the users.
Waste incineration
Used for disposal of organic waste. Incinerators are designed for three types of application: • Destruction of clinical waste (e.g. from hospitals) and hazardous waste such as
chemicals. Energy recovery is not normally carried out. • Municipal waste disposal, either with or without energy recovery although most new
waste incinerators in EU do not consume primary energy for heating (except at start up) and use waste materials as the fuel for energy generation. Energy may be recovered as heat, electricity or both. Waste to energy incinerators are essentially design type 3.
Incineration of waste can produce a variety of toxic emissions such as chlorobenzodioxins and furans from organohalogens if the process is not operated correctly although halogen-free plastics also emit toxic emissions such as polycyclic aromatic hydrocarbons (PAH). The waste gases are heated to high temperature to destroy these toxic substances. Municipal incinerators did emit toxic substances in the 1990s but modern plant are much safer and meet very strict emissions standards. Waste incinerators are designed and constructed by specialist furnace manufacturers. Municipal wastes contain plastics and so the CO2 emitted contributes to global warming as the original source of carbon in the plastics is oil. Combustion of biomass such as food waste however does not contribute towards global carbon as the original carbon source is carbon dioxide removed from the air by plants. It is considered that 50% of energy produced from municipal waste is renewable. (Note that furnaces used to cremation of deceased persons and animals have similarities in design and operation to waste incinerators)
Drying and curing of coatings
Low temperature processes used by many industry sectors including infrared drying.Used for example for drying paint coatings on car bodies. Continuous ovens would be design type 2, whereas batch ovens are type 1.
Galvanising and hot metal dipping
Steel is coated with zinc and by some other metals (e.g. tinplate and terne plate) by immersion of steel sheet in a bath of molten zinc or other metals. This is usually carried out as a continuous process where rolls of steel sheet pass through the molten metal bath. A process used to make zinc coated steel for automotive applications involves first annealing the sheet in continuous annealing ovens following by zinc coating. The zinc coating tank is not a typical “oven” or “furnace” process and it may be only one of the thermal steps in a more complex production process.
Oil refinery furnaces
Oil refineries carry out a variety of chemical processes in equipment that is referred to as “furnaces”. For example, high molecular weight hydrocarbons are “cracked” to produce

ERA Technology Limited ERA Report No. 2012-0230
043122753 ENTR Lot 4 Final Report v6 59 © ERA Technology Ltd
Industry sector Description and design types of oven or furnace lower molecular weight hydrocarbons such as ethylene in “cracker furnaces”. These consist of arrays of metal pipes through which the feed materials pass and are heated. As the feed materials are heated in an enclosed chamber by a continuous process, these are types of furnace. The main two designs are cylindrical heaters (tall cylinder) and cabin heaters (“box” shapes). These are large continuous furnaces designed to heat the material passing through them within wide bore tubes. The nearest match in Table 7 would be type 1. There are similarities with boilers in which water is heated within much narrower tubes that pass through the heating chamber. 90% of oil refinery furnaces are designed and built by the oil companies for their own use.
Chemical industry There are many thermal processes used by the chemical industry but only a small proportion would be regarded as “ovens” or furnaces”. Chemical reactors in which materials are added, stirred, heated, etc. are clearly not within the scope of this study as heating is not the primary function. However some ovens are used for drying solids and furnaces are used to heat solid materials to cause chemical changes such as the production of silicon carbide, carbon black and sodium silicate (by heating a mixture of sodium carbonate and sand).
Electronics industry
Reflow ovens – Printed circuit boards are assembled using tunnel ovens having many heat zones. These are designed to accurately control temperature to melt solder without damaging heat sensitive components Hybrid furnaces – these are similar in design to reflow ovens but have higher temperatures needed to fabricate ceramic circuits Semiconductor and photovoltaic furnaces – there are many different thermal processes used to fabricate semiconductor devices and silicon photocells. Controlled temperature and atmosphere and clean room conditions are important
Automotive industry
Vacuum and controlled atmosphere furnaces – used for vacuum brazing of aluminium heat exchangers Drying/curing ovens – for paint coatings
Aerospace Vacuum and inert gas furnaces – A wide variety of heat treatment processes used for a variety of alloys. Processes required to follow various standards such as SAE AMS 2750 D2005
Paper Rotary drum driers – used for drying paper that are not normally regarded as being ovens or furnaces
Agriculture Grain driers – electric, gas or oil heated continuous driers. Portable units are usually fluidised bed driers whereas large commercial installations use continuous mixed flow driers. These operate at relatively low temperatures.
Food Continuous belt ovens of various designs are used for manufacture of cooked food. Various types of driers such as drum driers, spray driers and vacuum driers are used for drying and dehydrating food products but some driers are not enclosed.
Laboratory applications Chemical analysis and testing laboratories
Use smaller laboratory ovens and furnaces. Furnace types include muffle furnaces and crucible furnaces. Microwave ovens are used to dissolve materials for chemical analysis. Fairly accurate temperature control is often essential for materials testing.
Medical sterilizers Various types are available including simple heat sterilisers that are essentially ovens which heat parts at 80°C or 150°C for a specific time period. Some heat steriliser manufacturers produce sterilisers and laboratory ovens which appear externally to be identical.

ERA Technology Limited ERA Report No. 2012-0230
043122753 ENTR Lot 4 Final Report v6 60 © ERA Technology Ltd
Industry sector Description and design types of oven or furnace Incubators Incubators are enclosed chambers in which materials are held at controlled temperature
and the environmental conditions may also be controlled, e.g. humidity and CO2 concentration. As these tend to control temperature at around 30 - 40°C, cooling is also necessary, especially in southern Europe.
Laboratory instrument components
Some laboratory instruments include components that are small heated chambers which may be regarded as being ovens or furnaces. Examples include: Gas chromatograph: The gas separation coil is housed in a heated chamber to maintain an elevated temperature. This chamber is a type of oven. Atomic absorption spectrometer: Some types use small carbon furnaces to vaporise the substance being analysed. The shape of heated compartment varies depending on the type of analytical instrument.
Other heated enclosed chambers
There are many other examples of equipment in which an enclosed chamber is heated. These include premature baby incubators which are clearly not “ovens”. Therefore a definition is required that excludes heated chambers that are not ovens or furnaces.
1.3. Primary production performance parameters: units used For this study, one of the most important performance parameter is likely to be the energy consumption in the use phase. However, such "use phase" energy consumption can be measured in a variety of ways. Examples of these include:
• Power rating in kW - this is usually not the same as energy consumption. This is always quoted for electric laboratory ovens and furnaces. Power rating is the maximum power consumption of the equipment which is required by installers to ensure that the power supply is adequate. Rated power consumption is another option and would be measured as kWh, MWh, etc.
• Power consumption per unit weight of materials processed e.g. in kWh / tonne, MJ/kg, etc. This is often known for larger-scale processes (e.g. published in IPPC BREF guides) although the value for a specific furnace or oven will depend on throughput and raw materials composition. Care needs to be taken when quoting energy consumption for electric ovens and furnaces. The electric energy consumed is not the same as the total primary energy consumed when including electricity generation, typically 30% efficient in EU.
• Annual energy consumption such as GWh/year defines the energy consumed annually by a furnace or oven. It can be calculated from energy consumed per unit weight multiplied by throughput. This parameter will be specific to one process and depends on many variables. Energy consumed during one year for all furnaces in a specific industry sector is of limited value as this will inevitably include many different types of furnace and process of different ages and efficiency.
• Energy efficiency (%) – an important parameter which can be calculated for larger scale processes but is usually not known for small-scale ovens and furnaces.
Power or energy consumption and energy efficiency are the two most useful performance parameters although these are routinely measured only for larger-scale industrial processes. Manufacturers usually measure energy consumption, as this has a direct influence on operating costs, but they should also be able to determine energy efficiency. For this study, we propose to use kWh/tonne (of product) as the units for energy consumption, because users of industrial furnaces usually use these

ERA Technology Limited ERA Report No. 2012-0230
043122753 ENTR Lot 4 Final Report v6 61 © ERA Technology Ltd
units, and it is possible to convert other units to these selected units. The units that we propose to use, to compare furnaces and ovens, via which we can judge relative environmental impacts, are kW for furnace and oven power ratings are often quoted as kW, MW, etc.
1.4. Measurement and other standards There are many standards that are applicable to industrial and laboratory furnaces and ovens. However, most relate to safety, and there are very few that address energy consumption. Relevant standards are listed and discussed below, in three groups; EU standards, EU Member States’ standards and standards published outside the EU.
1.4.1 Standards at community level Table 11. European standards for furnaces and ovens Standard number Title Status, EU
directive* EN ISO 13732- 1 Ergonomics of the thermal environment — Methods for the assessment of
human responses to contact with surfaces Part 1: Hot surfaces Sets limits for safe temperatures for external surfaces of furnaces that can be touched by workers. Inaccessible surfaces may be hotter but would be a source of heat loss
Current
EN 1539 Driers and ovens, in which flammable substances are released - safety requirements
Current
EN 1547:2000-A1:2009
Industrial thermoprocessing equipment – noise test code for industrial thermoprocessing equipment including its ancillary handling equipment
Current
EN 12950 Thermal installations for the cement, lime and gypsum industry – safety requirements
Current
EN 14001: 2004 Environmental management systems—Requirements with guidance for use Current EN 14681:2006 Requirements for machinery and equipment for production of steel by
electric arc furnaces Current, ATEX
EN 50014:1993 Electrical apparatus for potentially explosive atmospheres. General requirements
Current, ATEX
EN 50519 Assessment of workers’ exposure to electric and magnetic fields of industrial induction heating equipment
Draft only
EN IEC 60398 Industrial electroheating installations – general test methods Current EN 60676:2002, IEC 60676:2002
Industrial electroheating equipment. Test methods for direct arc furnaces Current
EN 60779:2005 Industrial electroheat Equipment. Test methods for electroslag remelting furnaces
Current
EN 61307 Industrial microwave heating installations. Test methods for the determination of power output
Current
EN 61308:2006 High-frequency dielectric heating installations. Test methods for the determination of power output
Current
EN 61922:2002 High-frequency induction heating installations. Test methods for the determination of power output of the generator
Current
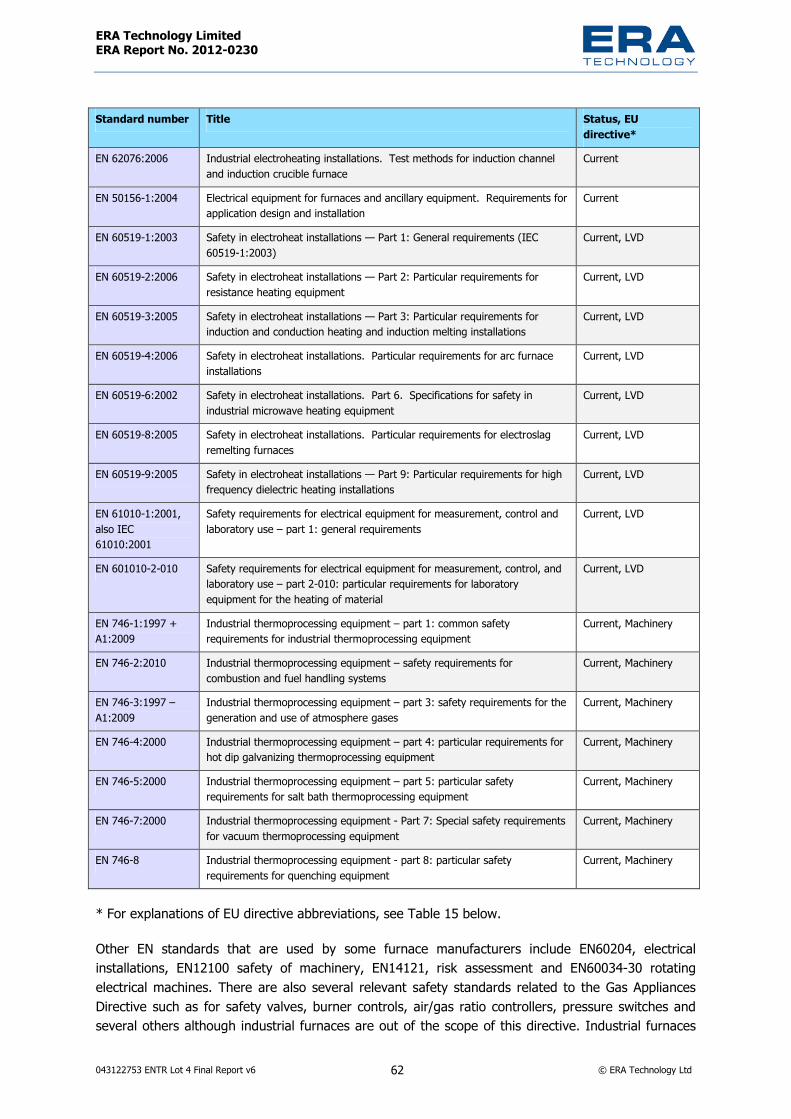
ERA Technology Limited ERA Report No. 2012-0230
043122753 ENTR Lot 4 Final Report v6 62 © ERA Technology Ltd
Standard number Title Status, EU directive*
EN 62076:2006 Industrial electroheating installations. Test methods for induction channel and induction crucible furnace
Current
EN 50156-1:2004 Electrical equipment for furnaces and ancillary equipment. Requirements for application design and installation
Current
EN 60519-1:2003 Safety in electroheat installations — Part 1: General requirements (IEC 60519-1:2003)
Current, LVD
EN 60519-2:2006 Safety in electroheat installations — Part 2: Particular requirements for resistance heating equipment
Current, LVD
EN 60519-3:2005 Safety in electroheat installations — Part 3: Particular requirements for induction and conduction heating and induction melting installations
Current, LVD
EN 60519-4:2006 Safety in electroheat installations. Particular requirements for arc furnace installations
Current, LVD
EN 60519-6:2002 Safety in electroheat installations. Part 6. Specifications for safety in industrial microwave heating equipment
Current, LVD
EN 60519-8:2005 Safety in electroheat installations. Particular requirements for electroslag remelting furnaces
Current, LVD
EN 60519-9:2005 Safety in electroheat installations — Part 9: Particular requirements for high frequency dielectric heating installations
Current, LVD
EN 61010-1:2001, also IEC 61010:2001
Safety requirements for electrical equipment for measurement, control and laboratory use – part 1: general requirements
Current, LVD
EN 601010-2-010 Safety requirements for electrical equipment for measurement, control, and laboratory use – part 2-010: particular requirements for laboratory equipment for the heating of material
Current, LVD
EN 746-1:1997 + A1:2009
Industrial thermoprocessing equipment – part 1: common safety requirements for industrial thermoprocessing equipment
Current, Machinery
EN 746-2:2010 Industrial thermoprocessing equipment – safety requirements for combustion and fuel handling systems
Current, Machinery
EN 746-3:1997 – A1:2009
Industrial thermoprocessing equipment – part 3: safety requirements for the generation and use of atmosphere gases
Current, Machinery
EN 746-4:2000 Industrial thermoprocessing equipment – part 4: particular requirements for hot dip galvanizing thermoprocessing equipment
Current, Machinery
EN 746-5:2000 Industrial thermoprocessing equipment – part 5: particular safety requirements for salt bath thermoprocessing equipment
Current, Machinery
EN 746-7:2000 Industrial thermoprocessing equipment - Part 7: Special safety requirements for vacuum thermoprocessing equipment
Current, Machinery
EN 746-8 Industrial thermoprocessing equipment - part 8: particular safety requirements for quenching equipment
Current, Machinery
* For explanations of EU directive abbreviations, see Table 15 below.
Other EN standards that are used by some furnace manufacturers include EN60204, electrical installations, EN12100 safety of machinery, EN14121, risk assessment and EN60034-30 rotating electrical machines. There are also several relevant safety standards related to the Gas Appliances Directive such as for safety valves, burner controls, air/gas ratio controllers, pressure switches and several others although industrial furnaces are out of the scope of this directive. Industrial furnaces

ERA Technology Limited ERA Report No. 2012-0230
043122753 ENTR Lot 4 Final Report v6 63 © ERA Technology Ltd
and ovens would be in scope of the machinery directive, the “equipment and protective systems intended for use in potentially explosive atmospheres” (ATEX) directive and safety and health of workers at work directives, all of which require that equipment is safe to use. Harmonised standards are all voluntary but are intended to be the best way to demonstrate compliance with the applicable directives. For example, the Machinery Directive’s harmonised standards EN746-1 to 3 include gas fuel handling safety.
1.4.2 Standards at Member State level within the EU Table 12. Standards at Member State level for furnaces and ovens Country Standard number Title Status Germany DIN 12880 Electrical laboratory devices - heating ovens and incubators Current Germany DIN 17052-1:2000-
10 Heat treatment furnaces - Part 1: Requirements for temperature uniformity
Current
Germany DIN 24201 Industrial furnaces - heating and heat-treating furnaces - concepts Current Germany VDG S 80 Ausfuehrung von notauffanggruben Current Germany VDI 2046 Safety code for operation of industrial furnaces with protective and
reaction gases Cancelled
Germany VDI 3730 Characteristic noise emission values of technical sound sources; processing furnaces
Current
Germany VDMA 24202 Industrial furnaces, classification Current Germany VDMA 24206 Acceptance and ordering of thermoprocessing equipment for the steel,
iron and non-ferrous metals industry Current
Germany VDMA 24351 Drying technology - general terms Current Italy UNI 7415 Forni industriali. Termini, definizioni e classificazione Cancelled Italy UNI 7416 Industrial furnaces - rules for ordering, testing and acceptance Current Italy UNI 8016 Agglomeration furnace for ferrous minerals - terminology Current Italy UNI 8129-1 Refractories for industrial furnaces - classification, sizes and test
methods Withdrawn
Italy UNI 8129-2 Refractories for industrial furnaces - data for offer, order, testing and acceptance
Withdrawn
Poland PN H-01201 Heat treatment - furnaces using a controlled atmosphere - safety requirements for construction and operating
Current
Poland PN H-01202 Heat treatment - furnaces for heat treatment with a controlled atmosphere - requirements and tests
Current
Poland PN H-01203 Heat treatment - vacuum furnaces - safety requirements for construction and operating
Current
Poland PN H-01204 Heat treatment - industrial vacuum furnaces - requirement and investigation
Current
UK BS 2648(1955) Performance requirements for electrically-heated laboratory drying ovens
Current
UK BS 4642(1970) Glossary of industrial furnace terms Current UK BS 6466(1984) Code of practice for design and installation of ceramic fibre furnace
linings (note that this is fairly out of date) Current

ERA Technology Limited ERA Report No. 2012-0230
043122753 ENTR Lot 4 Final Report v6 64 © ERA Technology Ltd
1.4.3 Third country standards Table 13. Standards from outside EU for furnaces and ovens Country Standard no. Title Status China SAC GB/T 17195 Industrial furnace terminology Current India BIS IS 14860 Guidelines on fuel saving in vertical mixed-feed lime shaft kilns
(Bureau of Indian Standards) Current
Japan JIS G0702 Method of heat balance for continuous furnace for steel Current Japan JIS G0703 :1995 Method of heat balance of electric arc furnace Current Japan JIS R0303:2004 Heat balancing of cement rotary kiln Current Japan JIS R0304 Heat balancing of continuous drier for ores and other materials Current Japan JIS B8415 General Safety Code for Industrial Combustion Furnaces
(01/03/2006) Current
Russia GOST 12.2.007.9 Safety in electro-heat installations - part 1: general requirements Current South Africa SANS 329 Industrial thermoprocessing equipment - safety requirements for
combustion and fuel-handling systems Current, Same as EN 746-2
USA SAE AMS 2750 D2005
Pyrometry Current
USA SAE AMS 2759:2004
Heat Treatment of Steel Parts–General Requirements Current (under revision). Standards also exist for other alloy types
USA AMS 2769 Heat treatment of parts in vacuum Current USA ASTM D 2436 Specification for forced-convection laboratory ovens for electrical
insulation ASTM D 2436 Superseded by ASTM D 5423 and ASTM D 5374
USA ASTM D 5374 Test methods for forced-convection laboratory ovens for evaluation of electrical insulation
Current
USA ASTM D5423 Specification for Forced-Convection Ovens for Evaluation of Electrical Insulation
Current
USA ASTM E145 Specification for Gravity-Convection And Forced-Ventilation Oven Current USA NFE 33 060 Industrial driers - guide for acceptance testing Current USA NFPA 86 National Fire Protection Association, USA. Standard for ovens and
furnaces Current
USA ASME EA-1 :2009 Energy Assessment for Process Heating Systems Current IEC IEC/TS
60680:2008 Test methods of plasma equipment for electroheat and electrochemical applications
Current
International ISO/NP 13577 Industrial furnace and associated thermal processing equipment -- General safety requirements
Draft
International ISO/NP 13578 Industrial furnaces and associated thermal processing equipment -- Safety requirements for combustion and fuel handling systems
Draft
International ISO/NP 13579-1 Industrial furnaces and associated thermal processing equipment -- Method of energy balance and efficiency -- Part 1: General methodology (more details below)
Draft

ERA Technology Limited ERA Report No. 2012-0230
043122753 ENTR Lot 4 Final Report v6 65 © ERA Technology Ltd
Country Standard no. Title Status International ISO/NP 13579-2 Industrial furnaces and associated thermal processing equipment --
Method of energy balance and efficiency -- Part 2: Reheating furnace for steel
Draft
International ISO/NP 13579-3 Industrial furnaces and associated thermal processing equipment -- Method of energy balance and efficiency -- Part 3: Batch type aluminium melting furnace
Draft
International ISO/NP 13579-4 Industrial furnaces and associated thermal processing equipment -- Method of energy balance and efficiency -- Part 4: Controlled atmosphere furnace
Draft
International ISO/FDIS 22967 : 2010
Forced draught gas burners Current
International ISO/FDIS 22968 : 2010
Forced draught oil burners Current
International IEC 60050-841 International Electrotechnical Vocabulary - Part 841: Industrial electroheat
Being amended
International IEC 60239:2005 Graphite electrodes for electric arc furnaces - Dimensions and designation
Current
International IEC 60397 Test methods for batch furnaces with metallic heating resistors Current International IEC 60676 Industrial electroheating equipment - Test methods for direct arc
furnaces (includes measurement method for heat losses from water cooling)
Current
The only detailed standard (currently draft) for measuring energy efficiency in industrial thermo-processes is ISO 13579-1. ASME EA-1-2009 also describes the requirements for conducting an assessment of a thermal process, but it does not provide a procedure for measurement of energy consumption or energy efficiency, nor does it provide detailed instructions for measurement of energy consumption or losses. ASME has however published guidance on how to implement their standard.
ISO 13579-1 “Industrial furnaces and associated thermal processing equipment -- Method of measuring energy balance and calculation of efficiency -- Part 1: General methodology”. This draft standard describes a detailed procedure for determining the energy consumption and energy efficiency of a specific thermal process. It is suitable to calculate energy efficiency and consumption of both continuous and batch processes The standard describes how to calculate the energy efficiency of the overall process and it defines the boundary of the process which includes energy used to heat the product as well as product handling (e.g. electricity for internal conveyors). The standard defines the methods for measurement of process inputs and outputs/ variables, such as fuel volume, temperatures and gas analysis and it defines procedures used for recuperative and regenerative burners. The calculation method is described in detail, and includes energy consumed by compressors, fans and pumps as well as heat input and losses. This ISO standard is ideal for calculation of the energy consumed and energy efficiency of one specific furnace process as it includes the raw materials and the output materials. However, the results reflect only this one process, and if the same equipment is used for treating different materials, the energy characteristics would be different, and so would need to be recalculated. The standard will be useful for comparison of alternative furnaces that could be used for a specific process, in order to select the most energy efficient, and also to calculate how much energy would be saved by using one process instead of another.

ERA Technology Limited ERA Report No. 2012-0230
043122753 ENTR Lot 4 Final Report v6 66 © ERA Technology Ltd
The main limitation of ISO 13579-1 is with smaller furnaces and ovens that are not designed for a specific production process. Laboratory ovens and furnaces are frequently designed to heat any type of materials to a range of possible temperatures. Heating rate and time are also flexible. Although this ISO standard is not intended to be used with laboratory ovens and furnaces, it can be used to obtain data that may enable the comparison of different ovens and furnaces (different models or from different manufacturers), but a realistic test load would need to be used and there is no standard test load defined.
Very few standards cover environmental impacts per se, and none were found which addressed environmental impacts other than energy consumption.
Refractory and insulation material standards There are CEN, ISO and ASTM standards which control the quality or performance of refractory materials and thermal insulation: these are listed below.
Table 14. Refractory and thermal insulation standards Standard no. Title EN 1094- 1, 2, 4 and 6
Insulating refractory products – part 1 Terminology, classification and methods of test for high temperature insulation wool products, — Part 2: Classification of shaped products, part 4: Determination of bulk density and true porosity, - part 6: Determination of permanent change in dimensions of shaped products on heating
EN 1402 – 1 - Unshaped refractory materials ISO 836:2001 Terminology for refractories ISO/DIS 1927 Unshaped refractory materials (there are 8 sub-parts) ISO 10081 Classification of dense shaped refractory products – includes several parts of specific types of
materials such as part 1 “Alumina-silica” and part 2 “Basic products containing less than 7% residual carbon”.
ISO 10084-4 Classification of dense shaped refractory products – special products ISO 2245:2006 Shaped insulating refractory products – classification (there are many other ISO standards
for various types of refractories) ASTM C553-08 Standard Specification for Mineral Fibre Blanket Thermal Insulation for Commercial and
Industrial Applications. Suitable for glass-fibre and mineral-fibre insulation at up to 649°C ASTM C892-05 Standard Specification for High-Temperature Fibre Blanket Thermal Insulation. Includes
assessment of non-fibrous content but not intended for furnace insulation (EN 1094-1 is used in the EU)
ASTM C195-07 Standard Specification for Mineral Fibre Thermal Insulating Cement. For cements used at up to 1038°C
ASTM has published many insulation related standards but most are not for thermal furnace insulation. There are many ISO standards for thermal insulation but these relate mainly to building insulation.
One issue with fibre insulation is that the performance is affected by the proportion of granular material that is also present. Granules are formed with HTIW but can be separated. Fibres are much more effective for insulation than round particles but there is no standard for particulate content of fibre insulation intended for industrial furnaces.

ERA Technology Limited ERA Report No. 2012-0230
043122753 ENTR Lot 4 Final Report v6 67 © ERA Technology Ltd
1.5. Existing legislation A wide variety of legislation affects ovens and furnace in the EU and the rest of the world. Legislation affects the design of ovens and furnaces by regulating safety aspects, energy consumption or emissions. Other legislation affects these products indirectly.
1.5.1 Legislation and agreements at EU level EU directives and regulations that directly or indirectly affect industrial and laboratory furnaces and ovens are listed here. Some are applicable only to large installations whereas others apply only to specific industry sectors.
Table 15. EU legislation applicable to furnaces and ovens (in date order) Directive or regulation
Legislation and status Description and impact on ovens and furnaces
93/42/EEC Medical Devices Directive Includes sterilisers in its scope. 94/9/EC Equipment and protective
systems intended for use in potentially explosive atmospheres (ATEX) directive
Ovens and furnaces that are intended for use in potentially explosive atmospheres need to be designed to comply with this directive.
2000/60/EC Directive establishing a framework for the Community action in the field of water policy,
Sets up framework for managing water (rivers, lakes, coastal water, etc.) to prevent pollution including from industrial processes.
2000/76/EC Directive on incineration of waste (now combined with IPPC as IED)
Incinerators are a type of furnace. This directive regulates waste incineration, waste to energy incinerators and processes such as cement manufacture that use waste as fuel.
2001/81/EC National emission ceiling for certain atmospheric pollutants
Sets maximum emission limits in kilo-tonnes for each EU15 State for SO2, NOx, VOC and NH3 by 2010.
2002/95/EC Restriction of certain Hazardous Substances (RoHS) directive (under review)
Laboratory ovens and furnaces are regarded by manufacturers as being in category 9 of the WEEE directive and so currently excluded from RoHS. However RoHS is under review and it is likely that this category will be included in the scope of the recast directive.
2002/96/EC Waste electrical and electronic equipment (WEEE) directive (under review)
The scope of this directive includes laboratory ovens and furnaces but excludes ovens and furnaces used as part of large-scale stationary industrial tools which are understood to be manufacturing processes. This directive requires manufacturers and importers to finance the cost of end-of-life safe and environmentally sound disposal.
Regulation 1774/2002
Health rules concerning animal by-products not intended for human consumption
Animal waste incinerators must be type-approved by a notified body and be able to achieve at least 850°C for 2 seconds to destroy any hazardous emissions. The obligations are less onerous than the waste incinerator directive 2000/76/EC for other types of waste

ERA Technology Limited ERA Report No. 2012-0230
043122753 ENTR Lot 4 Final Report v6 68 © ERA Technology Ltd
Directive or regulation
Legislation and status Description and impact on ovens and furnaces
2003/87/EC Scheme for greenhouse gas emission allowance trading
Sets up the European Union Greenhouse Gas Emission Trading System (EU ETS) which affects the largest carbon emitters, e.g. coke ovens (for steel production), mineral refining including blast furnaces, cement kilns, glass manufacture and ceramic production (firing bricks, tiles, pottery, etc. in furnaces).
2003/96/EC Energy Taxation Directive Postulated latest changes to this Directive – if adopted – would require Member States to impose minimum CO2 taxes on energy sources based on Euros / tonne of fossil CO2 emitted and minimum energy consumption taxes based on Euros/GJ. This includes taxes on energy used for transport, heating and electricity but also has a number of exemptions. The imposition of new joint energy and CO2 tax levels has been delayed until at least 2013.This is intended to be compatible with ETS.
Regulation 850/2004
Persistent organic pollutants Requires the reduction in emissions of dioxins and furans that may be emitted from some furnace processes. Emission limits set nationally
2004/107/EC Directive on relating to arsenic, cadmium, mercury, nickel and polycyclic aromatic hydrocarbons in ambient air
Sets limits As, Cd, Hg, Ni and polycyclic aromatic hydrocarbons. Large furnaces may emit a variety of toxic substances such as polycyclic aromatic hydrocarbons and so these need to be designed to minimise these emissions.
2004/108/EC Electromagnetic compatibility (EMC) directive
Applicable to electrical products ensuring that electromagnetic emissions are within specified limits and that the equipment is not affected by electromagnetic energy.
2004/35/EC Directive on environmental liability with regard to the prevention and remedying of environmental damage
Intended to apply to large-scale industrial processes and requires polluters to pay for remedial action to repair damage. Large-scale processes would include blast furnaces, smelters and cement kilns.
2004/40/EC “EMF” Directive (minimum health and safety requirements regarding the exposure of workers to the risks arising from physical agents (electromagnetic fields))
May affect induction and microwave ovens and furnaces.
2006/118/EC Groundwater directive Imposes limits in ground-waters for substances that may be emitted from furnaces and ovens.
2006/42/EC Machinery directive This applies particularly where ovens or furnaces with automated moving parts. For example, remotely controlled doors, conveyors, etc. However manufacturers of most larger furnaces and ovens assume that this directive applies.
2006/21/EC Management of waste from extractive industries
Many extractive metallurgical processes rely on a variety of large furnaces so this directive will regulate the use of smelters.

ERA Technology Limited ERA Report No. 2012-0230
043122753 ENTR Lot 4 Final Report v6 69 © ERA Technology Ltd
Directive or regulation
Legislation and status Description and impact on ovens and furnaces
2006/32/EC Energy end-use efficiency and energy services
Requirement for energy efficiencies with a binding national target of 9% savings in energy use within 9 years. This allows Member States to fund energy efficiency improvements (grants, loans, guarantees, etc.).
2006/95/EC Low voltage directive (LVD) Regulates the safety of electrical equipment. This affects the design to prevent electric shock, excessively hot surfaces, radiation, sharp edges and other hazards.
1907/2006/EC Registration, evaluation, authorisation of chemicals (REACH) regulations
Requires that downstream users are informed of safe use of substances of very high concern if present at >0.1% of articles. Two types of insulation materials and classified as SVHCs, and thus their supply and use could be affected by this legislation. REACH also restricts certain materials such as asbestos which were used in EU furnaces previously and is still used in some countries.
2023/2006/EC Food contact materials Regulation
Relevant to ovens used for food manufacture.
2008/50/EC Ambient air quality directive Measure to monitor and limit emissions of SO2, NOx, CO, benzene, particulates, Pb and ozone. Will affect industrial ovens and furnaces.
2009/105/EC Simple pressure vessels (2009/105/EC replaces 87/404/EEC)
Furnaces that operate at pressures of >0.5 bar and intended to contain air or nitrogen need to comply with these directives. This sets limits of 300°C for steel vessels and 30 bar maximum pressure. Autoclaves which use pressurised steam may be considered a type of oven and could be included. Vacuum ovens are excluded as this directive excludes vessels with pressure of <0.5 bar.
2009/142/EC Gas Appliance directive Scope includes gas fired ovens and furnaces except for those designed specifically for industrial applications, i.e. domestic and commercial. This is a safety directive.
Regulation 640/2009
Eco-design requirements of electric motors
Motors are used as components of ovens and furnaces. This regulation excludes motors designed for use at > 400°C and in explosive atmospheres. There are also other exclusions and this regulation is limited to motors with rated power output between 0.75KW and 375KW. There are also proposals for regulations for fans and pumps which are also used as components of ovens and furnaces.
2010/75/EU The industrial pollution prevention and control directive has been amended and combined with other directives, including the Large Combustion Plant Directive 2001/80/EC and waste incineration directive 2000/76/EC, into the Industrial Emissions Directive.
Requires that operators apply for permits for specified processes (listed in Annex I). Many EU operators of larger furnaces and ovens will be obliged to comply with this directive and obtain approvals for operating production processes and these must rely on using BAT. Includes in scope; steel installations, coke ovens, metal refineries and smelters (ferrous and non-ferrous), cement and lime kilns, glass production, ceramics production and municipal waste incinerators. This is described in more detail below.

ERA Technology Limited ERA Report No. 2012-0230
043122753 ENTR Lot 4 Final Report v6 70 © ERA Technology Ltd
Industrial Emissions Directive (IED) 2010/75/EU [previously the Integrated Pollution Prevention and Control (IPPC) directive 2008/1/EC] The Industrial Emissions Directive (IED) requires operators of certain installations to apply for and obtain an operating permit before commissioning their processes. Processes within scope include many types of industrial processes that use furnaces as well as others such as meat processing. There were calculated to be 14,59219 installations in the EU in 2008 which had been granted IPPC permits and these would have contained one or more furnaces or ovens (i.e. including cement, steel, ceramics and glass production, etc). Germany had the most installations of these types with 3054 of which 1286 were involved in processing metals (heat treatment, etc.).
The IED and IPPC directives specify the minimum daily production of installations to be within scope and 20 tonnes per day is fairly typical for those involving furnaces, although some are higher. Installations can include more than one furnace, and there will be many smaller installations with furnaces that are excluded from the scope of this directive, as they produce less than the minimum amounts specified by IPPC. However because of the nature of certain processes which are viable only on a large scale, all or most of these will be in scope and this includes production of cement, steel, float glass and most brick and roof tiles. Some processes usually operate on a small scale such as pottery production and so most installations are excluded from IPPC.
The main aim of the IPPC directive is to prevent pollution to air, water and land. The approach used is to ensure that processes use the best available technology for the prevention of pollution and this should be used in order to be granted a permit. The European Commission has developed a series of detailed guidance references (BREFs) for all industries within the scope of IPPC. These BREFs explain the best available technologies and give indications of the emissions levels that can be achieved. Member States grant permits for installations within their jurisdiction and these permits impose limits on emission levels that are based on the data in the BREF guidance, although these levels can vary considerably between Member States. Energy efficiency is a requirement of IPPC, except where the installation is within the scope of the EU greenhouse gas Emission Trading System directive. Energy efficiency issues are described in sector-specific sector BREFs as well as in a BREF specifically on energy efficiency, which is aimed at all sectors - including for use by SMEs. BREFs describe best available technology for energy efficiency, although often there are several options for a process and no specific limits are given. For example, the 2005 BREF Reference Document on Best Available Techniques in the “Smitheries and Foundries” Industry states that the best type of melting furnace is selected on the basis of technical and economic criteria. For melting aluminium, for example, six types of furnace are described, and some are far more energy efficient than others. For furnaces that are smaller than those within the scope of ETS, but still within the scope of the IED, IPPC has not in the past effectively regulated energy efficiency. GHG emissions are not regulated by IED, if the installation is in scope of ETS; thus, the energy efficiency of these installations is effectively not regulated by IED. It remains to be seen whether IED will be more effective than IPPC for those installations that are within the scope of IED, but not in scope of ETS.
Permits vary considerably in Member States and the European Commission has found that both the timescales for permits and the limit values in permits vary considerably. Some permits have emission limits that are higher than the range specified in the relevant BREF document. This has been allowed under the IPPC regime, as BREFs were for guidance only, and so best available technology was not 19 Calculation using data from sectors that use ovens and furnaces extracted from http://eea.eionet.europa.eu/Public/irc/eionet-circle/reporting/library?l=/ippc/ippc_permitting/permitting_eu27xls/_EN_1.0_&a=d

ERA Technology Limited ERA Report No. 2012-0230
043122753 ENTR Lot 4 Final Report v6 71 © ERA Technology Ltd
always required. As a result, new installations may not be as energy efficient as they could be. However, the recast of the IPPC directive to the IED in 2010 has resulted in changes, amongst which one aim is to ensure that the BREF guidance is more closely followed although energy efficiency will probably still not be a strict consideration for granting permits.
Currently, once a permit is granted, the length of time until it is reviewed depends on each Member State, which varies considerably. Some Member States, such as UK and Germany, do not specify the review and update period for permits in their national IPPC legislation, and so these are determined on a case by case basis. Other States specify the maximum period between reviews, and this can be short, at less than 5 yearly intervals (e.g. Poland, Hungary), or medium-length permit validity periods, such as in Spain(8 years)and Italy(5, 6 or 8 years). Some Member States have much longer review periods, e.g., Denmark (10 years), and in Belgium, 15-20 years, depending on the region. When a permit for an installation is reviewed, the permit would normally be re-approved, in theory as long as the best available technology was being used, and that the plant met the current emission targets.
The BAT, BREF and emissions limits values are specified in the BREF guidance, which is constantly under review. However, the BREF review process takes about ten years. The first BREFs were published in 2001, and draft updated versions of some of these were published in 2009 with final versions likely in 2010, nine years after the first publication. The result is that the BREFs will always be somewhat out of date, and newer, better technology may be available, subsequent to the most recent applicable published BREF. This delay, combined with the length of time that can occur between permit reviews, means that the IPPC directive cannot – in reality - enforce the continuous use of best possible energy efficiency in EU installations. The IED specifies 5 yearly permit reviews for all Member States, which should be helpful, and the Commission intends to shorten the BREF guide review process, although it could be difficult to increase the publication frequency of BREF guidance, due to the complexity of the technologies involved. The above discussion means that the best available technology recommended at any review point could technically be 5 to 14 years out of date.
Installations included within the scope of the IED that use ovens and furnaces are listed in the table below together with the inclusion criteria and these are compared with the scope of the EU Emissions Trading Scheme (ETS):
Table 16. Scope of industry sectors with BAT Guidance under the Industrial Emissions Directive and industries regulated by the EU ETS Regulation Industry sector IED inclusion criteria for installations Inclusion in EU ETS Oil refineries Included in scope, no lower limit Included in scope, no lower limit Steel production (primary and scrap)
Production rate ≥ 2.5 tonnes / hour Hot rolling mills >20 tonnes / hour Fused metal coating > 2 tonnes steel / hour
Ore roasting and sintering Production rate ≥ 2.5 tonnes / hour Ferrous metal processing where rated thermal energy input >20MW
Ferrous foundries > 20 tonnes per day As above for metal processing Non-ferrous metals All processes for obtaining crude metals from
ores Smelting processes: >20 tonnes per day except Pb & Cd > 4 tonnes per day
Aluminium refining (no limit) and aluminium recycling where rated thermal energy input >20MW Non-ferrous metal processing where rated thermal energy input >20MW
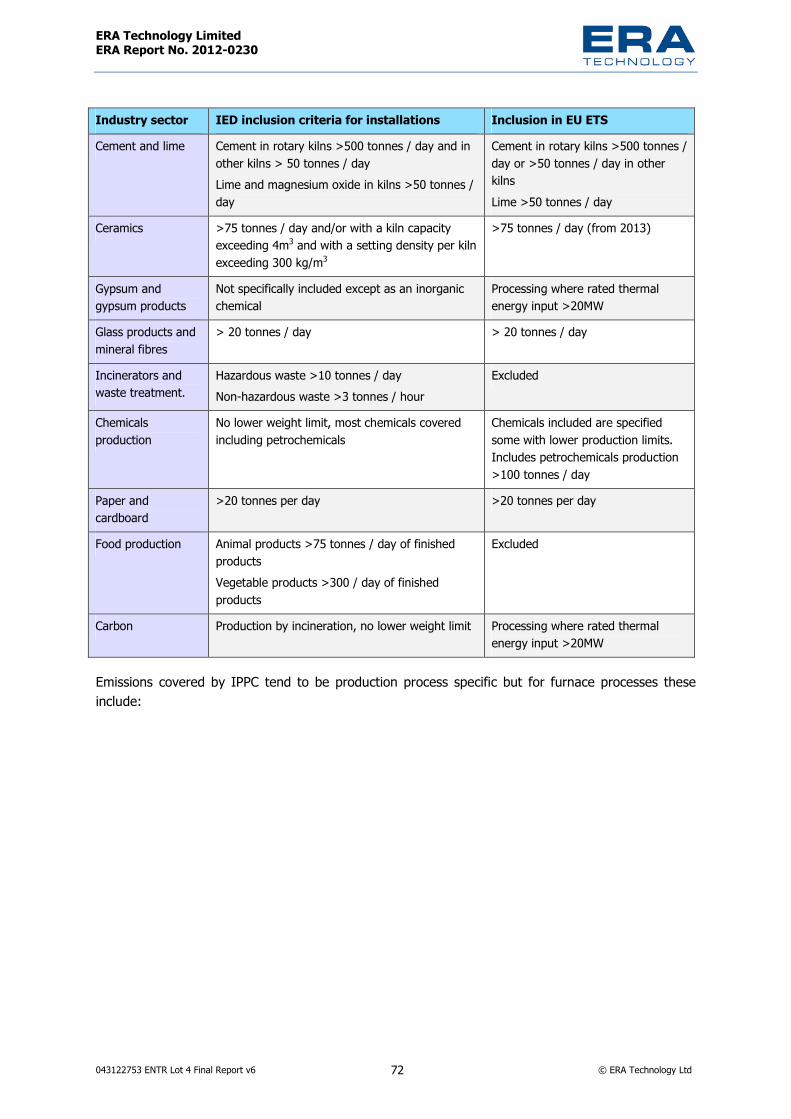
ERA Technology Limited ERA Report No. 2012-0230
043122753 ENTR Lot 4 Final Report v6 72 © ERA Technology Ltd
Industry sector IED inclusion criteria for installations Inclusion in EU ETS Cement and lime Cement in rotary kilns >500 tonnes / day and in
other kilns > 50 tonnes / day Lime and magnesium oxide in kilns >50 tonnes / day
Cement in rotary kilns >500 tonnes / day or >50 tonnes / day in other kilns Lime >50 tonnes / day
Ceramics >75 tonnes / day and/or with a kiln capacity exceeding 4m3 and with a setting density per kiln exceeding 300 kg/m3
>75 tonnes / day (from 2013)
Gypsum and gypsum products
Not specifically included except as an inorganic chemical
Processing where rated thermal energy input >20MW
Glass products and mineral fibres
> 20 tonnes / day > 20 tonnes / day
Incinerators and waste treatment.
Hazardous waste >10 tonnes / day Non-hazardous waste >3 tonnes / hour
Excluded
Chemicals production
No lower weight limit, most chemicals covered including petrochemicals
Chemicals included are specified some with lower production limits. Includes petrochemicals production >100 tonnes / day
Paper and cardboard
>20 tonnes per day >20 tonnes per day
Food production Animal products >75 tonnes / day of finished products Vegetable products >300 / day of finished products
Excluded
Carbon Production by incineration, no lower weight limit Processing where rated thermal energy input >20MW
Emissions covered by IPPC tend to be production process specific but for furnace processes these include:

ERA Technology Limited ERA Report No. 2012-0230
043122753 ENTR Lot 4 Final Report v6 73 © ERA Technology Ltd
• Nitrogen oxide • Sulphur dioxide • Carbon monoxide • Volatile organic carbon (VOCs) • Mercury • Dioxins and furans
• Greenhouse gases other than CO2
• Polycyclic aromatic hydrocarbons • Dust (e.g. SiO2)• Acid gases (e.g. HCl, Cl2, HF) • Metal compounds in waste-water
Emissions to air of these pollutants from smaller installations (outside the scope of the industrial emissions directive (IED) are not regulated in most EU Member States. Germany has TU-Luft regulations for some pollutants but overall there is no legal limit on process emissions from installations that are not regulated by IED. Note that most hazardous emissions are from processes, rather than from the operation of the furnaces or ovens themselves. As abatement of pollutants is usually carried out with equipment separate to the furnaces and ovens (such as filters and scrubbers), this is outside the scope of this study. The quantity of emissions from installations outside the scope of IED is not known as it is not monitored and so it is unclear whether this is a significant environmental problem. This could be determined only be a comprehensive measurement and monitoring program throughout the EU.
The implementation of the IPPC directive up to 2008 has been reviewed by the European Commission who found that many Member States were not fully compliant with this legislation with several failing to transpose the directive properly and some allowing installations to operate without permits. One problem is that some installations have permits that are not BAT and the reasons given for allowing this were not justified20.
Scheme for greenhouse gas emission allowance trading - 2003/87/EC The largest multi-country greenhouse gas (GHG) trading scheme (often known as the Emissions Trading Scheme, or ETS) in the world began operation in January 2005 in EU. The scope includes only the largest industrial consumers of energy, although this amounts to over 11,000 installations, including many that rely on large furnace and oven processes such as steel and cement production.
The approach used is to impose a cost on every tonne of CO2 emitted, but also to give (currently free of charge) manufacturers’ allowances to cover a proportion of their CO2 emissions. There could be a risk that this might make EU industry less competitive against its competitors, but the Commission estimates that the cost of the ETS at 0.1% GDP, is lower than from other approaches21. In the initial phase, manufacturers were given free allowances which covered at least 95% of their emissions whereas in phase 2, which ends in 2012, free allowances cover a smaller proportion (although this will be at least 90%). “Allowances” are given to manufacturers by Member State governments and can be traded on the open market. As a result the price of allowances can rise and fall depending on demand. If a manufacturer is given allowances that cover 95% of its carbon emissions it can decide to:
20 http://register.consilium.europa.eu/pdf/en/10/st15/st15510.en10.pdf 21 The EU Emissions Trading Scheme, 2009 Edition, http://ec.europa.eu/environment/climat/pdf/brochures/ets_en.pdf
ERA Technology Limited ERA Report No. 2012-0230
043122753 ENTR Lot 4 Final Report v6 74 © ERA Technology Ltd
• Reduce emissions by 5% (then there is no need to buy extra allowances); OR • Reduce emissions by more than 5%, and sell the unneeded allowances. Income from this sale
offsets the cost of reducing carbon emissions • If the cost of reducing carbon emissions is greater than the cost of buying allowances, then the
manufacturer can buy enough of these to allow it to continue operating at the same level of GHG emissions.
Since the scheme started in 2005 there have been criticisms about over-allocation of allowances that resulted in the market prices falling to almost nothing22 , which results in little incentive to cut emissions. The EU is making changes that it is hoped should resolve these problems. For example, there will be an annual decrease of 1.74% per year on the total number of allowances, giving a 21% reduction by 2020 based on 2005 emissions. Also, by 2027, all allowances will have to be bought at auction instead of the current free allocation system. The recent economic downturn has reduced GHG emissions simply due to plant producing less products, which has caused a decrease in carbon prices, thus lessening the incentive for reducing emissions. The EU is aware that higher carbon prices could put some sectors of EU industry at a competitive disadvantage with other countries that do not introduce equivalent carbon trading schemes. If manufacturing processes are relocated out of the EU to other countries that do not have an emissions scheme there would be no global decrease in carbon emissions, and this effect is referred to as “carbon leakage”. There could potentially be an increase in GHG emissions if the relocated process is less energy efficient or uses more carbon intensive electricity. If the need to buy allowances results in it being cheaper to manufacturer products in countries outside EU, EU industry would become uncompetitive and so the EU would suspend the requirement to buy allowances to prevent this situation from occurring.
One research study in Korea into the potential carbon emissions reduction from steel production shows that a reduction of 5.1% is economically viable without carbon taxes, but that a reduction of 36% may be possible with carbon taxes of 90US$/tonne carbon (by 2030)23. These carbon taxes increase overall production costs and so will be effective only if all countries world-wide adopt the same level of taxation, as otherwise manufacturers will tend to relocate their facilities.
Hazardous substance legislation Several pieces of EU legislation regulate hazardous substances that may be used in the construction of furnaces and ovens, and other substances that may be emitted from processes carried out in furnaces and ovens.
2002/95/EC RoHS(Restriction of Use of Certain Hazardous Substances) restricts lead, cadmium, mercury, hexavalent chromium and two flame retardants, polybrominated biphenyls (PBB) and polybrominated diphenyl ethers (PBDE). These restrictions apply to, inter alia, electric domestic and commercial ovens, which – it should be noted - are not in scope of this study, as they are included in the DG ENER Ecodesign Lot 22 study. The scope of RoHS has been broadened by the recast Directive 22 After Copenhagen, Oscar Reyes, 04 February 2010, , http://www.carbontradewatch.org/carbon-trading-how-it-works-and-why-it-fails.html and Carbon Trade Watch, Fact Sheet 1, http://www.carbontradewatch.org/downloads/publications/factsheet01-cap_and_trade.pdf 23 Heesung Shina, Jongchul Hong, Younggu Park “A Study on Carbon Dioxide Emission Reduction Potential in the Iron and Steel Industry in Korea”

ERA Technology Limited ERA Report No. 2012-0230
043122753 ENTR Lot 4 Final Report v6 75 © ERA Technology Ltd
2011/65/EU, which takes effect from 3 January 2013, and will include categories of equipment that would include laboratory ovens and furnaces, and medical ovens and furnaces. Some of the RoHS substances are used in these products, e.g., mainly lead in control and power electronics, and hexavalent chromium in passivation coatings to prevent corrosion. The RoHS recast Directive 2011/65/EU does not restrict additional substances, although a procedure for making further restrictions by comitology has been adopted. Directive 2011/65/EU has an "open scope" with exclusions. Among these exclusions is an exclusion for large-scale stationary industrial tools (as previously), and these are factory manufacturing processes that include large industrial furnaces that are permanently installed within the installation.
1907/2006/EC REACH has replaced the Marketing and Use directive 76/769/EC and incorporated its substance restrictions which include a restriction on asbestos. REACH also has a mechanism for controlling substances of very high concern (SVHC) which are included in a “candidate list” of substances. This list includes Aluminosilicate Refractory Ceramic Fibres and Zirconia Aluminosilicate Refractory Ceramic Fibres (RCFs, defined as CAS 142844-00-6 and by Standard EN 1094-1), both of which are used as flexible lightweight furnace insulation materials. The current obligation is to inform customers if a product contains more than 0.1% by weight of an SVHC. Candidate list substances may be proposed to require authorisation for use in the EU. When authorisation is required to use substances, this requires the applicant (who wants to use the substance) to pay a fee and to show that no suitable alternatives exist, or that the substance can be used safely and does not pose a risk, but this is a relatively costly procedure which would not be required by furnace manufacturers who are located outside the EU even if these furnaces were subsequently placed on the EU market.
2023/2006/EC Food contact materials – specifies which materials may come into contact with food so applies to ovens used to manufacture food.
Several pieces of legislation listed in Table 15 (on page 67) control emissions of hazardous substances from industrial processes including:
• 2010/75/EU IED (described above) • 2001/81/EC National emission ceilings for certain substances (originally the EU15 only but now
includes all EU27 States • 2004/107/EC Toxic air emissions • 2006/118/EC groundwater emissions • 2008/50/EC National air emission limits for certain substances. • EU legislation on air emissions regulates large furnaces and ovens that are within the scope of the
IED / IPPC directive but there are no restrictions on smaller furnaces and ovens. National legislation in some States may impose some restrictions such as the need to obtain planning permission for new facilities (UK) but existing installations are not well regulated. National legislation is described below.
Safety legislation • Industrial ovens and furnaces usually have moving parts and so are designed to comply with the
EU machinery directive standards series EN 746. Laboratory ovens and furnaces rarely have self-
ERA Technology Limited ERA Report No. 2012-0230
043122753 ENTR Lot 4 Final Report v6 76 © ERA Technology Ltd
moving parts and so standard EN61010 of the low voltage directive is used for safety legislation compliance.
1.5.2 Legislation at Member State level TA-Luft: Germany, “First General Administrative Regulation Pertaining the Federal Immission Control Act (Technical Instructions on Air Quality Control – TA Luft), July 2002. This regulates emissions of hazardous substances to air including carbon monoxide, sulphur dioxide and dust from furnaces and ovens. Nitrogen oxide emissions are also limited by TA-Luft Limits are process and capacity dependent and examples are24:
• The limit for oxygen content in flue gases is 5% in TA-Luft – set by control of gas / air ratio to burners.
• The present limit for CO in flue gases: 100 mg/m³ or 80 ppm • The present limit for NOx in flue gases: furnaces for hot rolling (e.g. slab preheating): 500 mg/m³
or 250 ppm • The limit for NOx for furnaces before and after cold rolling (heat treatment): 350 mg/m³ or 170
ppm Dioxin and furan emission limits: Germany – 17th Federal Emission Control Ordinance limits emissions of dioxins and furans. These substances could be emitted by incinerators and furnaces that burn halogenated plastics if suitable controls are not used.
UK Clean Air Act 1993: Imposes limits on the emission of smoke from all industrial furnaces, boilers and incinerators.
Maximum workplace exposure limits for refractory ceramic fibres – these materials are used as insulation materials for furnaces and ovens and air concentration limits are set by Member States for the safety of workers. Limits include:
24 Data kindly provided by Ebner

ERA Technology Limited ERA Report No. 2012-0230
043122753 ENTR Lot 4 Final Report v6 77 © ERA Technology Ltd
Table 17. National emission limits for refractory ceramic fibres in EU Member States25 Country Limit for refractory ceramic
fibres. Fibres / ml of ambient air Austria 0.5 Belgium 0.5 Denmark 1.0 France 0.1 Germany26 0.5 (no longer applied) Netherlands 1.0 Norway 2.0 Sweden 1.0 UK 1.0
For comparison, the National Institute for Occupational Safety and Health (NIOSH) in the USA has an upper limit of 0.5 fibres / ml. In 2010, the Scientific Committee on Occupational Exposure Limits (SOEL) recommended that the occupational exposure limit be reduced to 0.3 fibres / ml in the EU. Below this limit, refractory ceramic fibres (RCF) should pose no risk.
Carbon taxes in EU Member States and other countries
Several European countries have adopted some form of carbon taxation although this varies considerably: • Denmark – imposes a levy on fossil fuels with different rates for businesses and households
although businesses can gain refunds from efficiency changes • Finland – has had various forms of CO2 tax since 1990 • Ireland – introduced a CO2 emissions tax in 2010 which imposes duties on fossil fuels • Netherlands – taxation started in 1990 which changed in 1992 to a tax based on a combination
of carbon emissions and energy content and is levied on fuels. • Sweden – adopted carbon taxes on fuels in 1991 although there are many exemptions • UK – has the Climate Change Levy which is imposed on installations outside the scope of ETS. • Norway – has a carbon tax on fuels but exempts certain industry sectors to prevent them from
becoming uncompetitive • Switzerland – has a complex CO2 tax from which companies can be exempted if they participate
in a cap and trade scheme which allows them to buy and sell “permits”.
25 Table 7 of http://www.ser.nl/documents/55669.pdf 26 Germany has recently changed its workplace limits and no longer has an OEL. see http://www.baua.de/en/Topics-from-A-to-Z/Hazardous-Substances/TRGS/pdf/Announcement-910.pdf?__blob=publicationFile&v=2

ERA Technology Limited ERA Report No. 2012-0230
043122753 ENTR Lot 4 Final Report v6 78 © ERA Technology Ltd
1.5.3 Third country legislation Japan Energy Act 27 - Law Concerning the Rational Use of Energy (enforced in April 2006) (in generally, called "Energy Conservation Law"). This imposes mandatory standards on air ratio of burners, external surface temperatures of furnaces and re-use of heat energy from hot gases. Subsidies and low interest loans are provided to encourage energy efficiency improvements. Audits by energy conservation experts are provided to eligible manufacturers. Users of furnaces and ovens are obliged to measure and record the performance of heat exchangers and the performance of their furnaces and this is reported to the authorities. The standards specify:
Maximum external temperatures - are specified for furnaces rated at >500°; ambient temperature is assumed to be 20°C. Limiting the outer surface temperature limits heat losses through insulation.
Table 18. Maximum outer surface temperature as specified by Japanese Energy Act
These are maximum temperatures and actual wall temperatures will vary, because areas around doors, for example, will be hotter than other areas. The outer wall burn threshold temperature of industrial furnaces in the EU is specified by EU standard EN ISO 13732-1, which is a voluntary safety standard. Maximum outer surface temperatures are specified for surfaces that can be touched by workers; this means that much higher temperatures could be used at inaccessible locations, or those protected by barriers.
The Japan Energy Act excludes certain types of furnace from the surface temperature obligations: • Small furnaces with consumption equivalent to <20l/h crude oil • Furnaces requiring forced cooling systems such as glass melting furnaces, blast furnaces and
electric arc furnaces (forced cooling will include water cooling such as with electric arc furnaces and air cooling such as with glass melting furnaces)
• Rotary kilns such as cement clinker kilns and rotary metal melting and smelting furnaces • Furnaces for R&D and for trials.
27 http://www.asiaeec-col.eccj.or.jp/databook/2009e/index.html

ERA Technology Limited ERA Report No. 2012-0230
043122753 ENTR Lot 4 Final Report v6 79 © ERA Technology Ltd
Note 1 defines the temperatures in Table 18 as the average outer wall surface temperature excluding specific parts (we assume these are the heat bridges) during normal, steady operation at an outside temperature of 20°C.
Air ratio for burners – Upper limits for gas : air ratio are specified. Higher proportions of burner air reduce energy efficiency. In the table below, for example 1.20 is equivalent to 3.5% excess oxygen which is fairly common as good practice in the EU; 1.0 – 1.5% is generally regarded as optimum although care is needed to avoid carbon monoxide impurities. Limits apply only to specified processes which are mostly high temperature processes but include the “burner portion” of drying furnaces. The burner portion is the part of the furnace where the burner is located. In drying ovens, the drying temperature will be much lower than the temperature of combustion gases so either a heat exchanger or combustion gas dilution is needed to achieve the desired drying temperature. The Japan Energy Act therefore regulates the gas / air ratio only within the burner portion which means that any dilution air or heat exchanger air is excluded from any calculations.
Table 19. Burner air ratios (λλλλ values) by fuel and furnace type (Japanese Energy Act)
*1 = Value of liquid fuel in case of pulverised coal firing *2 = Burner portion only
There is no equivalent gas : air ratio standard or legislation in the EU for industrial furnaces.
It is important to note that Japan is an island and is able to minimise changes in the Wobbe Index of its piped natural gas unlike within the EU, where a variety of gas sources are used, so that the Wobbe Index can fluctuate without warning. Japanese users are able to use lower λ values than EU users because in the EU there is a risk of toxic CO formation if the gas composition were to change, such that more oxygen might be needed for complete combustion.
Note that there is no Japanese requirement for ceramics processes. The legislation does not explain this omission but, according to the Cerame-Unie Trade Association, this is because it is not technically possible to impose a gas / air ratio limit for ceramics furnaces, as combustion gas volume is an important characteristic and often requires additional air to achieve this.

ERA Technology Limited ERA Report No. 2012-0230
043122753 ENTR Lot 4 Final Report v6 80 © ERA Technology Ltd
Waste heat recovery is regulated by requiring that specific proportions of waste heat are recovered and by imposing minimum heat recovery values for industrial furnaces that depend on capacity and process temperature. Indicative waste gas temperatures are provided.
Table 20. Waste heat recovery requirements (Japanese Energy Act)
Capacity categoriesA = furnaces with rated capacity >84,000 MJ/hour B = furnaces with rated capacity of 21,000 – 84,000 MJ/hour C = Furnaces with rated capacity of 840 – 21,000 MJ/hour.
This type of waste heat requirement would be very effective in EU, as many new furnaces have no or very little heat recovery. The Japanese requirements are the standard waste heat recovery rates in this table. For example, a furnace operating at over 1000°C rated for >84,000 MJ/hour must recover at least 45% of the heat in the flue gases and aim to recover at least 55% of the heat. As a guide, Table 20 indicates reference temperatures of flue gases after heat recovery, although upper flue gas temperature limits (for specific excess oxygen to the gas burner) could be used as an alternative eco-design requirement. The reference temperatures in Table 20 are all 535°C or less which is consistent with combustion gas exit temperatures after heat recovery with a recuperator. The heat recovery ratio is calculated in Japan using the following equations and relationships28:
Heat recovery ratio percent = (Qa/Qg) x 100%; where
Qg = Vg x ρ x Cp x T
28 Formula and compliance details provided by Japan Industrial Furnace Manufacturers Association (JIFMA)

ERA Technology Limited ERA Report No. 2012-0230
043122753 ENTR Lot 4 Final Report v6 81 © ERA Technology Ltd
Qg is the heat content of combustion gas before heat recovery under normal load conditions
Vg is the flow rate of the combustion gas before heat recovery
ρ is the density of the combustion gas before heat recovery
Cp is the specific heat of the combustion gas
T is the temperature at the exit of the furnace chamber before heat recovery
Qa = Va x ρ x Cp x ∆T
Qa is the recovered heat
Va is the flow rate of the combustion gas after heat recovery
ρ is the density of the combustion gas after heat recovery
Cp is the specific heat of the combustion gas
∆T is the difference in temperature before heat recovery and after heat recovery (at constant %O2)
Power Factor (electrically-powered furnaces) Power Factor limits are imposed in Japan on high energy consumption electrically powered furnaces (>50KW). A mandatory minimum power factor of 0.95 is required for induction furnaces, electric arc furnaces and vacuum furnaces (voluntary target of 0.98). The Power Factor is important as this represents the difference between the real and apparent power consumption, and is related to the phase difference between the AC voltage and AC current. A power factor of 1.0 occurs where these are perfectly in phase but induction furnaces, electric motors and some other types of equipment shift the phase to draw more current than the apparent current (Power Factors < 1.0) so that electricity generators need to increase capacity to meet the real demand. Equipment is added to the circuit that changes the Power Factor closer to 1.0 which reduces the real load on the electricity supply, but adds cost to the equipment. In the EU, no Power Factor limits exist for industrial furnaces and ovens, but electricity generators use other methods to ensure users pay for the real cost of electricity.
Japanese industry was able to comply with these requirements relatively easily, and was fully compliant when the obligatory requirements entered force. Many Japanese manufacturers also comply with the voluntary target values.
A limited Carbon Trading Scheme is being adopted in Japan with participating organisations needing to reduce emissions by 6% by 201429 but a more extensive scheme is now less likely as a result of the Fukushima nuclear plant failure.
Japan imposes limits on NOx emissions from furnaces and there are yearly mandatory inspections. The limits vary with lower limits being imposed in some cities than rural areas. Osaka, for example has a limit of 100ppm (200mg/m3). 29 Guardian newspaper article http://www.guardian.co.uk/environment/2010/apr/08/tokyo-carbon-trading-scheme

ERA Technology Limited ERA Report No. 2012-0230
043122753 ENTR Lot 4 Final Report v6 82 © ERA Technology Ltd
Australia – Energy Efficiency Opportunities Act since July 2006. The Act includes industrial businesses consuming 0.5 PJ/year that are required to register and submit assessment plans every 5 years to the government which will assess and approve the plan if they meet the requirements of the Act although no energy efficiency targets are specified. Assessment plans describe opportunities for improving energy efficiency and they are also required to report results. Some success has been achieved by forcing manufacturers to look at their processes with one example of a brick manufacturer finding that energy reductions of 10 – 20% for existing kilns were achievable30.
Australia has passed legislation for mandatory carbon trading. From July 2012, Australia’s biggest emitters of CO2 (those that emit >25,000 tonnes CO2 p.a.) will pay a tax of Au$23 per tonne of carbon emission and from 2015 a market-based trading scheme with replace the fixed tax. 500 businesses will be affected of which about 60 use industrial processes such as cement manufacture and metals processing.
USA and Canada - Proposals for a limited carbon reduction scheme have been considered in the USA but since the 2010 Senate and House elections these are unlikely to make progress. Several Canadian provinces have carbon taxes, but there is no Canadian Federal tax.
China – The Energy Conservation Law regulates Chinese industry, with plans for improvements in energy efficiency by specifying reductions in energy consumption per tonne of certain products such as steel, copper, aluminium, cement and for oil refineries31. China is planning to adopt carbon trading for certain industry sectors with a pilot scheme in 2012, and a full scheme by 2015. The size of the tax will starting 20 yuan (€2.22) and rising to 50 yuan (€5.55)/tonne of CO2 by 2020, which is relatively low32 in comparison with the Australian carbon tax.
South Korea – is also planning a carbon trading scheme by 2015 that would be similar to the Australian scheme, but this has not been confirmed.
India – Mandatory audits are required for energy intensive industries such as steel, aluminium and cement. Mandatory audits are an approach also used in Taiwan and several other countries. India is considering a limited carbon trading scheme from 2014.
1.6. First screening of the volume of sales and trade, environmental impact and potential for improvement of the products
An initial assessment of industrial and laboratory furnaces and ovens is a requirement of this preparatory study and was included in the draft Task 1 – 3 report and in the interim report. These initial screening of data has since been superseded by more accurate data and so this section has been included as Appendix C.
30 http://www.worldenergy.org/documents/annex_1__wec_report.pdf 31 http://ies.lbl.gov/iespubs/50452.pdf 32 http://www.businessgreen.com/bg/news/1806070/reports-china-impose-carbon-tax-2012

ERA Technology Limited ERA Report No. 2012-0230
043122753 ENTR Lot 4 Final Report v6 83 © ERA Technology Ltd
2. Task 2 – Economic and Market Analysis This Task reviews the market for furnaces and ovens in order to produce data that will be needed in other Tasks to calculate the environmental and cost impacts of existing stocks, new sales and future sales, taking account of eco-design and other options. Data required include the number of furnaces and ovens sold annually and the energy consumed by this equipment. These data will be used to calculate the total energy consumption. The results of a technology review will determine the potential for reducing energy consumption, which will have environmental and cost benefits. Other data such as typical product life and refurbishment periods will be used to determine when energy reduction measures will have an effect. Task 4 will calculate base cases based on the four design types described in Task 1 but it is apparent that market data based on industry sectors is more readily available than on design types and so industry sector classification has been used for Task 2. This classification is used to some extent by Prodcom Eurostat. However it will be necessary to estimate the proportion of each design type sold in the EU in order to carry out Tasks 4, 6 and 7. EU Member State data is included in Appendix A, and only EU totals are included in this section.
2.1. Generic economic data The Prodcom database is useful for an initial analysis as it contains transparent and publicly-available data provided by Member States on manufacturing and production within the EU.33 Prodcom data included in this study are in the following categories:
• EU production • Extra-EU trade, including imports/exports into/from the EU • Apparent EU consumption34 The data is in physical units and by Member State for 2008 – the latest full year for which at least half of the Member States have reported. Data was extracted from each of the relevant Prodcom categories identified in sub-Task 1.1 as partly or fully matching the product definitions. In order to facilitate the data analysis, those categories have been grouped together in five major functional groups, not taking into account the differences in energy source or type of technology:
• Furnace burners • Mechanical stokers • Furnaces and ovens for the treatment of ores and metals • Bakery ovens • Industrial/laboratory furnaces and ovens
33 Preliminary estimates of 2006 EU sales and stocks of industrial and laboratory furnaces and ovens were made by the consultants EPTA for the first Ecodesign Working Plan in 2007 based on Prodcom. 34�Apparent consumption = Production + Imports – Exports.
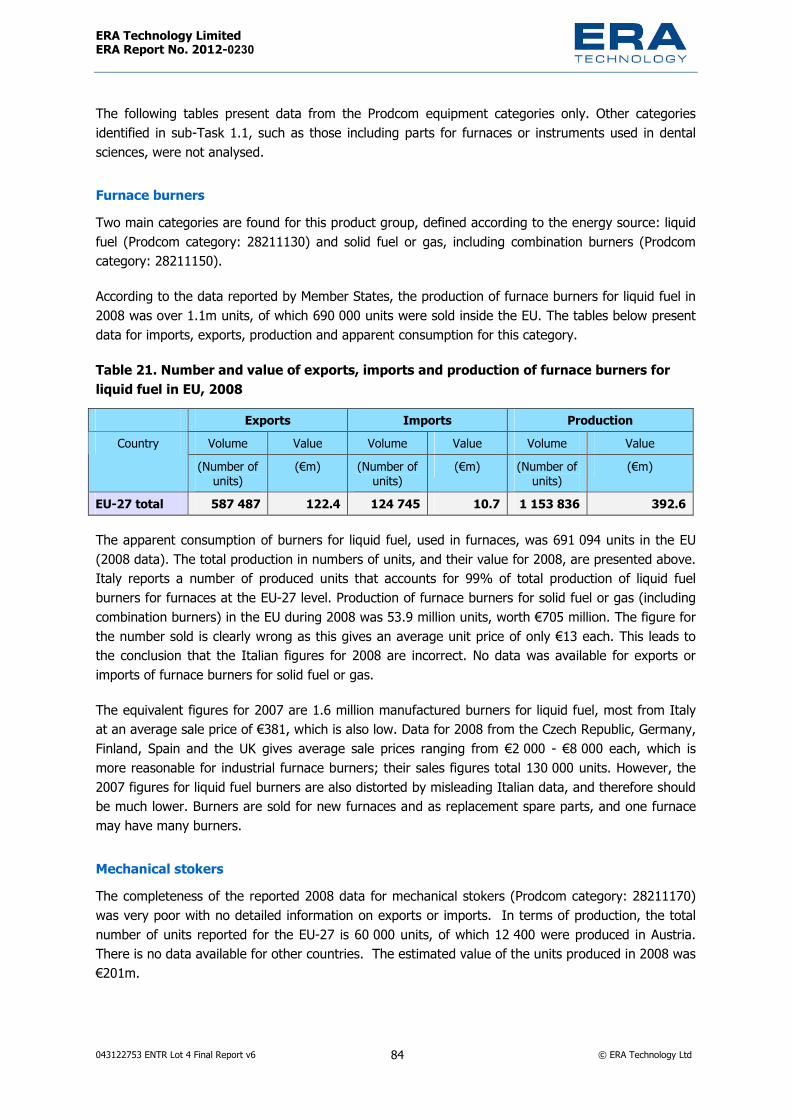
ERA Technology Limited ERA Report No. 2012-0230
043122753 ENTR Lot 4 Final Report v6 84 © ERA Technology Ltd
The following tables present data from the Prodcom equipment categories only. Other categories identified in sub-Task 1.1, such as those including parts for furnaces or instruments used in dental sciences, were not analysed.
Furnace burners Two main categories are found for this product group, defined according to the energy source: liquid fuel (Prodcom category: 28211130) and solid fuel or gas, including combination burners (Prodcom category: 28211150).
According to the data reported by Member States, the production of furnace burners for liquid fuel in 2008 was over 1.1m units, of which 690 000 units were sold inside the EU. The tables below present data for imports, exports, production and apparent consumption for this category.
Table 21. Number and value of exports, imports and production of furnace burners for liquid fuel in EU, 2008
Exports Imports Production Volume Value Volume Value Volume Value Country
(Number of units)
(€m) (Number of units)
(€m) (Number of units)
(€m)
EU-27 total 587 487 122.4 124 745 10.7 1 153 836 392.6
The apparent consumption of burners for liquid fuel, used in furnaces, was 691 094 units in the EU (2008 data). The total production in numbers of units, and their value for 2008, are presented above. Italy reports a number of produced units that accounts for 99% of total production of liquid fuel burners for furnaces at the EU-27 level. Production of furnace burners for solid fuel or gas (including combination burners) in the EU during 2008 was 53.9 million units, worth €705 million. The figure for the number sold is clearly wrong as this gives an average unit price of only €13 each. This leads to the conclusion that the Italian figures for 2008 are incorrect. No data was available for exports or imports of furnace burners for solid fuel or gas.
The equivalent figures for 2007 are 1.6 million manufactured burners for liquid fuel, most from Italy at an average sale price of €381, which is also low. Data for 2008 from the Czech Republic, Germany, Finland, Spain and the UK gives average sale prices ranging from €2 000 - €8 000 each, which is more reasonable for industrial furnace burners; their sales figures total 130 000 units. However, the 2007 figures for liquid fuel burners are also distorted by misleading Italian data, and therefore should be much lower. Burners are sold for new furnaces and as replacement spare parts, and one furnace may have many burners.
Mechanical stokers The completeness of the reported 2008 data for mechanical stokers (Prodcom category: 28211170) was very poor with no detailed information on exports or imports. In terms of production, the total number of units reported for the EU-27 is 60 000 units, of which 12 400 were produced in Austria. There is no data available for other countries. The estimated value of the units produced in 2008 was €201m.

ERA Technology Limited ERA Report No. 2012-0230
043122753 ENTR Lot 4 Final Report v6 85 © ERA Technology Ltd
Furnaces and ovens for the treatment of ores and metals Non-electric furnaces and ovens for the roasting, melting or other heat-treatment of ores, pyrites or of metals are reported in Prodcom category 28211230. Production takes place mainly in Italy (50%), Spain (12%), Germany (6%) and France (1%). The total number of units produced in 2008 was 7,300 with a value of €668m and the average price was €91 000 per furnace. The German production figure in 2008 was 484 units at an average price of €470 000 which appears to be correct. No data was available on exports or imports.
Bakery ovens Two categories are included in this group, defined according to the energy source: electric bakery and biscuit ovens (Prodcom category 28211330) and non-electric bakery and biscuit ovens (Prodcom category 28931530).
Information on production is available: more than 113 000 units were produced in the EU-27 in 2008 with a total value of €242.3m. Italy is the main producer, followed by Germany and Spain. Non-electric bakery oven production data is presented in the table below. Italy is an important centre of production with 56% of the units reported, followed by France (16%) and Spain (16%). Total production in 2008 was 28 300 units for a value of €267.3m.
Table 22. Production of electric and non-electric bakery and biscuit ovens in EU, 2008 Type of bakery and biscuit
ovens Volume (number of
units) Value (€m)
Electric 113 118 242.3 Non-electric 28 302 267.3
Industrial/laboratory furnaces and ovens There are five categories in this group that define the type of furnace/oven according to the energy source:
• non-electric industrial or laboratory furnaces and ovens (including incinerators, excluding those for the roasting, melting or other heat treatment of ores, pyrites or metals, bakery ovens, drying ovens and ovens for cracking operations – Prodcom category 28211270);
• resistance heated industrial or laboratory furnaces and ovens (excluding bakery and biscuit ovens – Prodcom category 28211351);
• electrical induction industrial or laboratory furnaces and ovens (Prodcom category 28211353); • electrical industrial/laboratory furnaces/ovens, induction/dielectric heating equipment, including
dielectric furnaces/ovens excluding infra-red radiation ovens, resistance heated furnaces/ovens (Prodcom category 28211355);
• electric infra-red radiation ovens (Prodcom category 28211357). Data is available for exports, imports and production for nearly all Member States but the unit used to report the volume of transactions is a unit of weight: kg. Products vary widely by weight and so this cannot be used to make an accurate estimation of the number of units (needed for later Tasks).
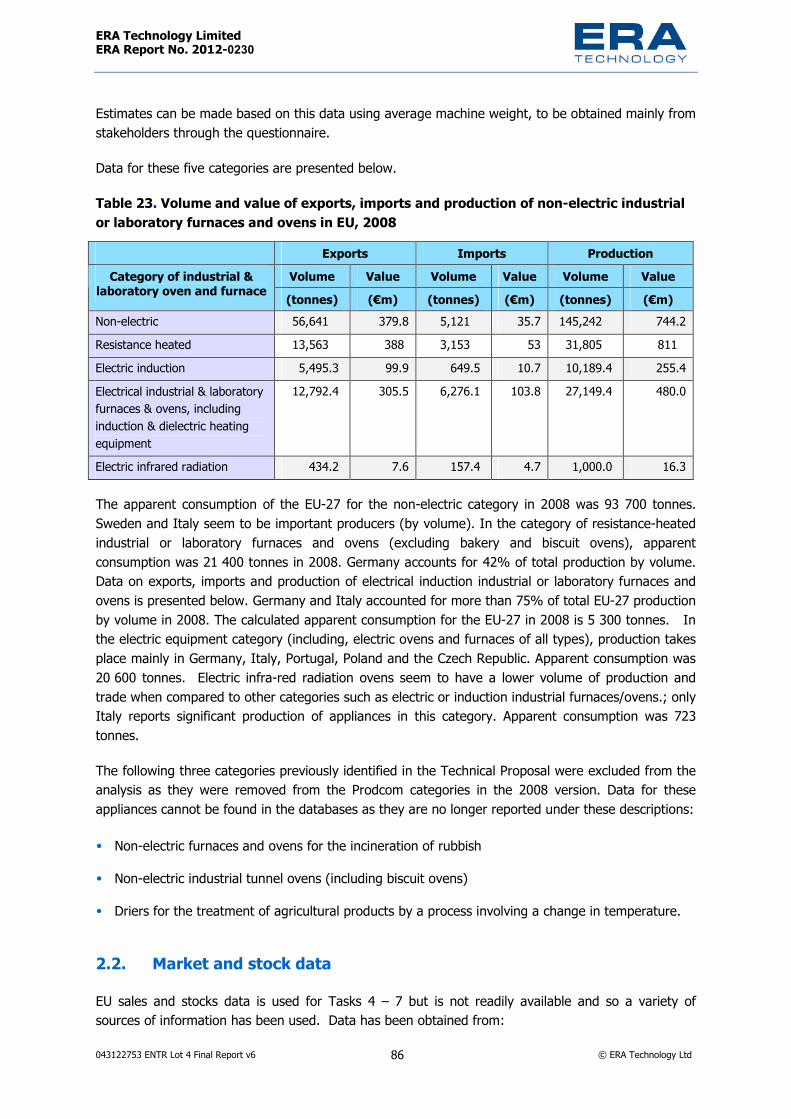
ERA Technology Limited ERA Report No. 2012-0230
043122753 ENTR Lot 4 Final Report v6 86 © ERA Technology Ltd
Estimates can be made based on this data using average machine weight, to be obtained mainly from stakeholders through the questionnaire.
Data for these five categories are presented below.
Table 23. Volume and value of exports, imports and production of non-electric industrial or laboratory furnaces and ovens in EU, 2008
Exports Imports Production Volume Value Volume Value Volume Value Category of industrial &
laboratory oven and furnace (tonnes) (€m) (tonnes) (€m) (tonnes) (€m) Non-electric 56,641 379.8 5,121 35.7 145,242 744.2 Resistance heated 13,563 388 3,153 53 31,805 811 Electric induction 5,495.3 99.9 649.5 10.7 10,189.4 255.4 Electrical industrial & laboratory furnaces & ovens, including induction & dielectric heating equipment
12,792.4 305.5 6,276.1 103.8 27,149.4 480.0
Electric infrared radiation 434.2 7.6 157.4 4.7 1,000.0 16.3
The apparent consumption of the EU-27 for the non-electric category in 2008 was 93 700 tonnes. Sweden and Italy seem to be important producers (by volume). In the category of resistance-heated industrial or laboratory furnaces and ovens (excluding bakery and biscuit ovens), apparent consumption was 21 400 tonnes in 2008. Germany accounts for 42% of total production by volume. Data on exports, imports and production of electrical induction industrial or laboratory furnaces and ovens is presented below. Germany and Italy accounted for more than 75% of total EU-27 production by volume in 2008. The calculated apparent consumption for the EU-27 in 2008 is 5 300 tonnes. In the electric equipment category (including, electric ovens and furnaces of all types), production takes place mainly in Germany, Italy, Portugal, Poland and the Czech Republic. Apparent consumption was 20 600 tonnes. Electric infra-red radiation ovens seem to have a lower volume of production and trade when compared to other categories such as electric or induction industrial furnaces/ovens.; only Italy reports significant production of appliances in this category. Apparent consumption was 723 tonnes.
The following three categories previously identified in the Technical Proposal were excluded from the analysis as they were removed from the Prodcom categories in the 2008 version. Data for these appliances cannot be found in the databases as they are no longer reported under these descriptions:
• Non-electric furnaces and ovens for the incineration of rubbish • Non-electric industrial tunnel ovens (including biscuit ovens) • Driers for the treatment of agricultural products by a process involving a change in temperature.
2.2. Market and stock data EU sales and stocks data is used for Tasks 4 – 7 but is not readily available and so a variety of sources of information has been used. Data has been obtained from:

ERA Technology Limited ERA Report No. 2012-0230
043122753 ENTR Lot 4 Final Report v6 87 © ERA Technology Ltd
• IPPC BREF Guides; • Publications where very limited stock data is available; • Estimates calculated from typical furnace productivity in tonnes/year and total EU annual
production data; • Data provided by stakeholders. The only independent published data on stocks of furnaces in EU is from IPPC BAT Reference guidance documents. This is, however, incomplete and mostly gives mostly data on the number of installations (factories), but some furnace data is also provided. Table 24 lists the available data which is applicable to “large” furnaces.
Table 24. Numbers of installations with furnaces and ovens in EU from IPPC BREF guidance Industry sector Numbers of ovens and furnaces or installations (factories) in EU based on IPPC
BAT Reference guidance Iron and steel production (2001 BREF)
47 – sinter plant 106 – coke ovens 81 – blast furnaces 95 – basic oxygen furnaces
203 – AC electric arc and 6 DC electric arc 538 – Total
Cement and lime production (2001 BREF)
377 – cement kilns (located at 238 installations in 2008) 597 – lime kilns 974 – Total
Glass (2001 BREF) 175 – installations container glass 58 – float glass furnaces 34 – glass fibre installations
>300 – domestic glass installations >100 – special glass installations
64 – mineral wool installations 6 – ceramic fibre installations
50 – glass frit installations >787 installations – total (note some will have more than one furnace)
Ceramics (2007 BREF)
>55 – refractory installations (many more are out of scope of IPPC) 5 – clay pipe installations (one has 3 kilns)
No other data for ceramics installations or furnaces provided in BREF guide Oil refineries (2003 BREF)
c.100 – refineries in EU each of which will have many furnaces. No data on number of furnaces.
Production and processing of metals (2001 BREF)
5245 – IPPC permits granted in 2008. Many installations will have more than one furnace and there are also many
small installations that are excluded

ERA Technology Limited ERA Report No. 2012-0230
043122753 ENTR Lot 4 Final Report v6 88 © ERA Technology Ltd
Industry sector Numbers of ovens and furnaces or installations (factories) in EU based on IPPC BAT Reference guidance
Foundries (2005 BREF)
575 – IPPC permits granted in 2008. Many will have more than one furnace and small installations are excluded
Note that data from published BREF guidance is included above. Some newer drafts are available and will include in some cases different numbers as some installations have closed or new furnaces are installed. The dates that data refer are specified in the BREF guidance and are very variable, even within one BREF guide. This data is used only to validate stock data from other sources except where it is used only if no other information from other sources could be located.
2.2.1 Annual sales and current stocks The trade association CECOF has provided data in terms of furnace value but CECOF does not have data on numbers of furnaces sold in the EU annually. It is clear, however, that the numbers of industrial furnaces and ovens sold are not very large. Several manufacturers report sales of less than 5 units annually, and in some sectors, less than one furnace/ oven per year is installed in the EU although a few others may be refurbished. Where sales numbers are very low it is often more useful to quote average annual sales from the past 5 or so years. This also averages out variations due to economic issues. Some manufacturers and trade associations have provided estimates of total EU sales and a few have given their own sales figures. This study only needs total EU sales which are used in later Tasks of this study and so only EU totals are included in this report, however, sales of individual manufacturers have been useful to validate these estimates.
Predictions for future sales are even more difficult to obtain due to uncertainty by manufacturers. In the laboratory sector, small percentages of growth have been predicted but - based on past years -sales in most industrial sectors will be flat or possibly decline, but this is far from certain.
Current sales and stocks and future sales predictions (where known) for the main industry sectors are in Table 25. This data is from a variety of sources.
Table 25. Estimated current and future EU sales of furnaces and ovens and current stocks by sector Type of oven or furnace
Estimated EU annual Sales c. 2008
Current estimated stocks
Expected future trends in sales
Estimated EU Sales 2020
Large Steel production Steel smelting = 0,
(c.10 refurbished/yr) 538 No new blast
furnaces but some new EAF
No change likely
Cement and lime kilns
Cement kilns = c. 2/ yr + c. 2/ yr refurbished New lime kilns = 1.2/yr Refurbished lime kilns = 1 /yr
377 cement c.600 lime
Cement kilns = c. 2/ yr + c. 2/ yr refurbished New lime kilns = 1.2/year Refurbished lime kilns = 1 / year
No change likely

ERA Technology Limited ERA Report No. 2012-0230
043122753 ENTR Lot 4 Final Report v6 89 © ERA Technology Ltd
Type of oven or furnace
Estimated EU annual Sales c. 2008
Current estimated stocks
Expected future trends in sales
Estimated EU Sales 2020
Glass production >60 large plus many more smaller furnaces 25 new container glass melting but no new flat glass
628 (of >20t/day 2005)
Total >787 (58 flat and c.300 container glass melting)
No change No change likely
Ceramic production Brick and roof tile kilns & ovens = 20 Ceramic tile and sanitary ware = c.20 Other ceramic = 4
10 000 No change or small decrease
No change likely
Non-ferrous metal production (smelting and melting)
50 750 No change or small decrease
No change likely
Large ferrous and non-ferrous metals heat treatment
60 ** 1200 No change or small decrease
No change likely
Steel reheating 50 1000 No change or small decrease
No change likely
Oil refinery furnaces
45 (replaced / yr assuming 40 year life)
1800 No data available Not known
Waste to energy incinerators
10 903 8 (2012) – 10 (2020)
10
Bakery ovens 40 1200 No change 40 Small and medium – size industrial Agricultural driers 2 000 20 000 No change 2,000 Metals heat treatment
c.1500 (500 each of induction, vacuum and thermal)
30 000 No significant changes
1500
Small / medium foundry melting furnaces
600 (40 rotary melting, c.500 small crucible, c.60 other types)
6000 No significant changes
600
Medium industrial ovens & furnaces ***
500 50 000 No significant changes
500
Hazardous waste incinerators
100 1000 Could increase as a result of higher landfill prices
Mainly small size industrial
15 000 225 000 No significant change
15 000

ERA Technology Limited ERA Report No. 2012-0230
043122753 ENTR Lot 4 Final Report v6 90 © ERA Technology Ltd
Type of oven or furnace
Estimated EU annual Sales c. 2008
Current estimated stocks
Expected future trends in sales
Estimated EU Sales 2020
Batch bakery ovens 50 000 500 000 Lot 22 study predicts increase of 1 – 1.5% p.a.
c.54 000
Printed circuit board reflow ovens
286 20 000 No significant change
286
Continuous electric furnaces for electronics, solar panels, etc.
90 10 000 Uncertain, probably no change
90
Laboratory Laboratory ovens 25 000 400 000 25 000 27 000 Laboratory furnaces 9000 140 000 9000 9,000 Laboratory incubators
15,000 225 000 16 000 19 000
Analytical instruments that include ovens or furnaces
17 000 (2007 sales) 170 000 20 000 27 000
Medical sterilizers – steam
Estimated at 7000 100 000 7000 7000
* = tableware, mineral wool, HTIW, refractories, technical ceramics etc. ** - includes continuous annealing lines (3 p.a.), batch bell type furnaces bright annealing lines for stainless steel and for copper, hardening lines for steel, pusher type furnaces for aluminium and batch furnaces for aluminium *** - One manufacturer of medium size furnaces and ovens with a moderately significant EU market share has provided data on all of their products sold since 2000. Of these, 65% were for metals heat treatment, 20% were for curing of coatings and 4.4% were for drying.
Table 25 above includes all available data and will include some duplication. For example, “mainly small size industrial” will include solder reflow and electric continuous furnaces. Sources of data are summarised below
Table 26. Sources of sales and stock data Type of oven or furnace
Sources of sales and stock data
Large Steel production One new steel production plant installed in the last 10 years in EU and no new plant
likely in EU. There are c.90 blast furnace / BOS facilities which are refurbished every 10 – 25 years so c. 9 blast furnace rebuilds per year plus other types of furnace/oven assuming numbers remain stable within the EU. Industry information is that there are c.10 refurbishment projects for steel production furnaces annually in EU.

ERA Technology Limited ERA Report No. 2012-0230
043122753 ENTR Lot 4 Final Report v6 91 © ERA Technology Ltd
Type of oven or furnace
Sources of sales and stock data
Cement and lime kilns Data from Cembureau shows that there was an increase of 14 cement installations between 2005 and 2008 in EU and all were dry kilns with pre-heaters and pre-calciners. There was a decrease of 7 installations of other types indicating that these older kiln types were replaced by new energy efficient kilns. This means that there were 7 new and 7 refurbished kilns assuming 1 kiln per installation (which will not always be correct). On average there are 1.6 kilns / installation and so actual numbers may be more than 7 + 7 over 3 years. New lime kiln data from trade association EuLA
Glass production There are 787 installations covered by IED but also there are many more of the smaller installations with medium-size and small furnaces and most installations have > 1 furnace so the actual total number is not known. However, the biggest producers and energy consumers are for container and flat glass. EU container glass production in 2007 was 22 million tonnes and a medium size container glass melting furnace would produce 87,500 tonnes / year so there are about 250 container glass melting furnaces in EU. Time between refurbishment is c.15 years so 250/15 = 17 per year. New sales data provided by stakeholders. 9.37 million tonnes flat glass produced annually in the EU. Sales and stock data supplied by a flat glass manufacturer. It was calculated that there are 3 – 4 flat glass melter rebuilds per year, assuming a stock of 58 having a life of c.15 years between rebuilds. New plant are less common. (There are also lehrs, and other furnaces used).
Ceramic production Data for bricks, tiles and sanitary ware furnaces supplied by trade association ACIMAC.
Non-ferrous metal production (smelting and melting)
Sales and stock data are estimates based on stock data from 2009 draft IPPC BREF and some data from stakeholders. BREF data: Cu 20 sites, Al 130 sites, Zn 27 sites & Lead 39 sites (c.400 furnaces in total). For copper each site will have at least one primary smelter and one fire refining furnace. Most aluminium sites are secondary furnaces and may be more than one furnace per site. Zinc each of 15 primary sites has one roaster and there are 12 secondary sites with at least one furnace. 9 primary lead smelting furnaces and about 30 sites with at least one secondary refining furnace. There will also be many more of the smaller furnaces (sales estimated from stocks assuming 15 year lifetime).
Large ferrous and non-ferrous metals heat treatment
Data provided by several stakeholders
Steel reheating Data provided by stakeholders Oil refinery furnaces From ref35 Waste to energy incinerators
Published data36
Bakery ovens Data provided by stakeholders Small and medium – size industrial Agricultural driers Data from stakeholder Metals heat treatment Data provided by several stakeholders
35 “Description and Characterisation of the Ceramic Fibres Industry of the EU”, Environmental Resource Management 1995 36 ISWA report "Energy-from-Waste Statistics - State-of-the-Art-Report" 5th Edition August 2006, data for 2005 including Norway and Switzerland. 903 line at 427 installations

ERA Technology Limited ERA Report No. 2012-0230
043122753 ENTR Lot 4 Final Report v6 92 © ERA Technology Ltd
Type of oven or furnace
Sources of sales and stock data
Small / medium foundry melting furnaces
Data provided by stakeholder
Medium industrial ovens & furnaces
Data from manufacturer of medium sized ovens and furnaces
Hazardous waste incinerators
Data from manufacturer
Mainly small size industrial
Data from manufacturer
Batch bakery ovens Data from Lot 22 Eco-design preparatory study Printed circuit board reflow ovens
Data from manufacturers
Continuous electric furnaces.
Estimates from manufacturer
Laboratory Laboratory ovens EU sales estimated by one manufacturer, confirmed by data from other manufacturers Laboratory furnaces EU sales estimated by one manufacturer, confirmed by data from other manufacturers Laboratory incubators EU sales estimated by one manufacturer, confirmed by data from other manufacturers Analytical instruments that include ovens or furnaces
Data from manufacturer
Medical sterilizers – steam
Data from several manufacturers
Total annual sales and stocks for large industrial, medium industrial and lab sectors are listed in Table 27.
Table 27. Estimated EU annual sales, stock levels and numbers refurbished of furnaces and ovens based on data from stakeholders, IPPC BREFs and other sources Sector Estimated EU annual
sales Estimated EU stock Estimated numbers
refurbished annually Large industrial c. 400 c.15 000 c.150 Small / medium size industrial
18 000 (plus 50 000 batch bakery ovens)
340 000 (plus 500 000 batch bakery ovens)
10 000
Laboratory* 50 000 800 000 Uncommon * Totals depend on whether incubators and laboratory instruments containing ovens are included.
Data for the main design classifications used by this study for large size and small/ medium size industrial furnaces and ovens have been determined using data provided by stakeholders and from published sources. This has used annual sales data with information on the ratios of batch/ continuous, electrically heated to fossil fuel, by temperature (i.e. ovens/ furnaces) and the average power ratings of small/ medium size industrial have also been calculated. This data is given in

ERA Technology Limited ERA Report No. 2012-0230
043122753 ENTR Lot 4 Final Report v6 93 © ERA Technology Ltd
Appendix B. This data is summarised here for small and medium size industrial and for large size industrial.
Small / Medium: The data for small and medium size is dominated by the large number of batch bakery ovens and so the values including and excluding these have been calculated (industrial batch bakery ovens are the same designs as commercial bakery ovens assessed in the Lot 22 eco-design preparatory study). The average power rating for gas ovens is affected very significantly by agricultural driers as sales are c.2000 of a total of 3440 medium-size gas ovens and furnaces although agricultural driers are not typical ovens, appear to be relatively energy efficient and are used for only short periods each year:
Table 28. Average characteristics of small and medium size industrial furnaces and ovens Classification All small and medium size
industrial Small and medium size
industrial excluding batch bakery ovens
Electric / gas 54% electric / 46% gas 92% electric / 8% gas Batch / continuous 98% batch / 2 % continuous 91.1% batch / 8.9% continuous Ovens (<450°C) / furnace (>450°C)
87.5% ovens / 12.5% furnaces 58% ovens / 42% furnaces
Average power rating electric 57.3 kW 66.2 kW Average power rating gas 161 kW 688 kW or 254 kW excluding
agricultural driers
For base case calculations BC2 - BC5, we have used the values for power rating that exclude batch bakery ovens because these types of oven have already been assessed in the DG Energy Lot 22 Eco-design study. Grain driers are also excluded because they have a high power rating, but are used only six weeks per year, and inclusion would give an unrepresentative high average value.
Table 29: Sales and stock of small / medium-sized industrial furnaces and ovens Configuration Type Energy Sales Stock
Batch Oven Electric 8 758 164 986Batch Oven Gas 762 14 347Continuous Oven Electric 856 16 118Continuous Oven Gas 74 1 402Batch Furnace Electric 6 342 119 472Batch Furnace Gas 551 10 389Continuous Furnace Electric 620 11 672Continuous Furnace Gas 54 1015Total 15 000 300 000
Large: Most large-size industrial furnaces and ovens use fossil fuels. The only exceptions are electric arc furnaces for melting steel, some induction melting furnaces for metals and a few glass melting furnaces in countries where cheap electricity is available such as Sweden. Many are continuous but some are batch such as: bell type heat treatment furnaces, several types of metal melting furnaces

ERA Technology Limited ERA Report No. 2012-0230
043122753 ENTR Lot 4 Final Report v6 94 © ERA Technology Ltd
some large brick drying ovens, etc. At least 80% are >450°C (furnaces). Raw data is given in Appendix B.
2.2.2 Industry financial estimates of EU oven and furnace production and consumption
CECOF has estimated EU production and used PRODCOM Eurostat data to calculate apparent consumption of furnaces for the EU15. Production and consumption since 1995 is shown below.
0
1000
2000
3000
4000
5000
6000
7000
1995 1997 1999 2001 2003 2005 2007Year
Millio
nsEu
ros
Figure 6. EU15 production (blue) and apparent consumption (pink) of furnaces between 1995 and 2008 Production has increased overall but consumption in the EU15 States has steadily been declining since 2000.
The EU Member States that manufacture the largest values of furnaces are listed below (2008 data from CECOF). Values of sales may not reflect the numbers of units sold as indicated by PRODCOM Eurostat data as this may not be very reliable. Production of furnaces and ovens in the newer EU States is relatively small.
Table 30. EU State production of furnaces and ovens 2008 EU State 2008 production (€million) Percent of EU15 production Germany 2793 42% France 1029 15.6% Italy 921 14% Austria 580 8.8% Netherlands 375 5.7% UK 307 4.7% Spain 228 3.5% Sweden 120 1.8% Belgium 65 1.0%

ERA Technology Limited ERA Report No. 2012-0230
043122753 ENTR Lot 4 Final Report v6 95 © ERA Technology Ltd
2.2.3 Installed ovens’ and furnaces’ average product life The numbers of ovens and furnaces installed in EU for some industry sectors is published, with useful data included in IPPC BREF (best available technology reference) guidance. Available data is listed below with estimates of typical life and time between refurbishment or rebuild. More lifetime data provided by stakeholders is given in section 5.3.
Table 31. Average lifetimes of examples of furnaces and ovens in the EU Industry sector Typical life Source of data Iron and steel production
Heat treatment furnaces can be up to 40 years, coke ovens up to 100 years Up to c.25 years between blast furnace refurbishing Average age of EU-15 plant 21 – 28 years BOF average = 100years EAF and coke ovens average = 67 years Others = 34 years
Communication from Corus and IPPC guidance, BREF (best available technology reference). Average lifetimes of BOF, EAF (electric arc furnace), coke oven and others from ref. 37
Cement and lime production
Cement ∼40 years, lime up to 60 years IPPC guidance, BREF (best available technology reference)
Glass Life typically 20 – 40 years depending on process and type of glass. Container glass furnaces are refurbished typically every 12 years and flat glass furnaces c.10 years
IPPC guidance, BREF (best available technology reference), draft 2009 guide
Ceramics – bricks and roof tiles
∼30 years (15 – 60 years depending on quality and use conditions)
IPPC guidance, BREF (best available technology reference) and IPPC study38 plus data from industry (brick, ceramic tile and sanitary ware furnaces)
Ceramics – wall tiles, sanitary ware
Wall tile kiln c.10 years Sanitary ware kiln c.15 years
From stakeholder. Lifetimes shorter than brick kilns due to higher operating temperature
Oil refineries > 40 years IPPC guidance, BREF (best available technology reference).
Incinerators 35 years (refurbished after 10 – 15 years) CEWEP and ESWET Production and processing of metals
>20 years Heat treatment furnaces c. 40 years
IPPC data summary39 Data on heat treatment furnaces from manufacturer
37 E. Worrell and G. Biermans, “Move over Stock turnover, retrofit and industrial energy efficiency”, Energy Policy 33 (2005), p949 -962 38 http://circa.europa.eu/Public/irc/env/ippc_rev/library?l=/gathering_amendments_1/final_report/ceramics_finaldoc/_EN_1.0_&a=d 39 http://eea.eionet.europa.eu/Public/irc/eionet-circle/reporting/library?l=/ippc/ippc_permitting/permitting_eu27xls/_EN_1.0_&a=d

ERA Technology Limited ERA Report No. 2012-0230
043122753 ENTR Lot 4 Final Report v6 96 © ERA Technology Ltd
Industry sector Typical life Source of data Electric tunnel furnace with conveyer
20 years Furnace manufacturer
Foundries 20 – 40 years (rotary melting furnace = 30 years)
Stakeholders
Laboratory ovens and furnaces
Lab ovens, furnaces and incubators c. 15 years life. Pressurised steam sterilisers life limited to 7 years
Data from manufacturers
Note that more lifetime data is given in section 5.3.
2.2.4 Energy consumption Estimates for energy consumption by sector are needed for this study and some estimated data can be calculated from IPPC BREF guidance (and other published sources) by multiplication of the average energy consumption per tonne by the number of tonnes produced in the EU and this is shown in the table below:
Table 32. Calculated energy consumption by furnaces and ovens by main industry sectors and type of energy source used Industry sector Estimated annual EU energy consumption
(assumes most is energy used by furnaces and ovens) TWh / year
Main energy sources
Iron and steel production
435 (based on IPPC BREF data –from EU annual production and energy consumed per tonne)
Blast furnaces use predominantly coal with some oil, gas and electricity. Other furnaces in steel installation use blast furnace gases and other fuels
Cement and lime production
277 for cement kilns and 30 for lime kilns (IPPC BREF – from EU annual production and energy consumed per tonne)
Coal and petroleum coke, some oil and also uses wastes. Electricity used for proves control
Glass 64 (using data from IPPC BREF Guide – from EU annual production and energy consumed per tonne)
Fuel oil and gas
Ceramics 113 (using data from IPPC BREF Guide – from EU annual production and energy consumed per tonne)
Natural gas
Oil refineries 329 – 1050 (using data from IPPC BREF Guide – however not all of this energy is used by furnaces)
Oil
WtE (waste to energy) Incinerators
Consumes 5 TWh/year but generates 76TWh/year of energy36
Electricity *
Large steel re-heating furnaces
10 (estimated using data from stakeholders and other sources)
Gas

ERA Technology Limited ERA Report No. 2012-0230
043122753 ENTR Lot 4 Final Report v6 97 © ERA Technology Ltd
Industry sector Estimated annual EU energy consumption (assumes most is energy used by furnaces and ovens) TWh / year
Main energy sources
Industrial ovens 130 (stakeholders and other sources) Electricity, gas and oil Medical and hazardous waste incinerators, etc.
0.2 – 0.5 (data from stakeholders) Electricity, diesel and natural gas
Food production 60 TWh (data from DG ENER Lot 22 study, from IPPC BREF and from stakeholders)
Electricity, gas and some oil.
Non-ferrous metals Copper = 15TWh, Al = 3 TWh (plus many other metals, Zn, Pb, etc. – IPPC BREF data)
Coal, oil, gas, electricity
*Note that waste to energy incinerators generate energy. Data from CEWEP states40 that total renewable energy produced by EU incinerators in 2006 was 38TWh (electricity and heat) from an estimated 5TWh electricity consumed41. It is assumed that 50% of the energy generated is from renewable sources and so total energy generated (electricity and heat – renewable plus fossil fuel energy) was c.76 TWh. Smaller hazardous waste incinerators use energy at start up and also to destroy toxic emissions but incineration of waste is self-sustaining. The generated heat is usually not used unless a nearby use is identified such as heating buildings.
More detailed energy consumption data has been obtained from furnace and oven manufacturers, some from users of furnaces and from publications including IPPC BREF guides and data for large industrial and small / medium industrial is given in Table 54 and Table 55.
2.3. Market channels and production structures The market channels for small-scale and large-scale equipment are different. There are also differences between industry sectors.
2.3.1 Laboratory and smaller- medium size industrial ovens and furnaces There are many oven and furnace manufacturers located within the EU as well as manufacturers located outside the EU who supply to the EU market. Sales are made both directly to users and via distributors. Most sales are to business users (B2B) with relatively small numbers sold to domestic users (B2C).
According to one of the larger EU manufacturers of small and medium size furnaces, users in general do not make purchasing decisions based on energy efficiency although some will consider the maximum energy output because of constraints to the available ventilation where the equipment is to be located. Some users of even quite large furnaces which, for example are used for heat treatment 40 Confederation of European Waste to Energy Plants (CEWEP), E. Stengler and J. Manders “Energising waste: how waste-to-energy helps to reach the EU’s renewable energy targets” 41 The principal energy source for waste to energy incinerators is the waste materials feedstock. Electricity is used to operate the equipment such as for air pumps, controllers, hygiene etc but there is a net surplus of electricity generated. Electrical energy consumed is 0.1MWh / tonne waste. c.20% of EU municipal waste = c. 50 million tonnes / year is incinerated by 903 incinerators. So 1 average incinerator consumes 55,000 tonnes waste / year at 0.1MWh/tonne = 5,500MWh/year. 50 million tonnes waste x 0.1MWh/tonne = 5TWh/yr (stock energy consumption)

ERA Technology Limited ERA Report No. 2012-0230
043122753 ENTR Lot 4 Final Report v6 98 © ERA Technology Ltd
of metals, do not consider energy efficiency as a high priority when buying new equipment, and their functions are of primary importance. It is fairly common for industrial users and some laboratory users of ovens and furnaces to purchase standard ovens and furnaces that have been modified for their specific needs. Larger ovens and furnaces are more often custom designed for each specific application although these are based on standard materials, techniques and components. Modified and custom-designs are supplied by the manufacturer to the user whereas standard laboratory ovens and furnaces are more often supplied via distributors.
One EU manufacturer has reported that about one-third of their laboratory products are sold in EU, one-third to the USA and one-third to the rest of the world whereas the majority of larger industrial products are sold in the EU. Shipping large and heavy equipment can be costly but there may be other reasons why local producers will be selected.
Most furnaces and ovens are sold to business users with a very small proportion being sold to artisans and for hobbies. No figures could be obtained but it is estimated that >99% are B2B and >99.9% of energy consumption due to B2B furnaces and ovens
The ovens and furnaces market in the EU includes a large number of manufacturers, most of which are SMEs although some of these are owned by large holding companies (e.g. Thermo Fisher Scientific with 30 000 employees worldwide). In general, each manufacturer produces a specific range of ovens and or furnaces. Frequently, a manufacturer will specialise in one or a few specific market segment such as laboratory equipment, metal heat treatment, PCB manufacture, food, etc. A selection of the larger manufacturers and their main markets are listed below.
Table 33. Laboratory furnace and oven manufacturers Name of manufacturer
Location Main target markets
Carbolite UK Laboratory and industrial furnaces Borel Switzerland Laboratory ovens and furnaces Binder Germany Laboratory ovens Memmert Germany Laboratory ovens Weiss Gallenkamp Germany Laboratory ovens Sanyo Japan Incubators, ovens and sterilisers mainly for the medical sector Thermo Scientific Global, US owned Laboratory ovens, furnaces, incubators, sterilisers Priorclave UK Laboratory autoclaves
Table 34. Small – medium size industrial furnace and oven manufacturers Name of manufacturer
Location Main target markets
Linn High Therm Germany Electrically heated mostly medium-size industrial ovens and furnaces (also a few laboratory)
Paragon USA Small pottery and jewellery kilns for hobbies, artisans and craft workers

ERA Technology Limited ERA Report No. 2012-0230
043122753 ENTR Lot 4 Final Report v6 99 © ERA Technology Ltd
Name of manufacturer
Location Main target markets
Stanton kilns UK Small furnaces used by schools, colleges etc. for pottery Hedinair Lyd / JLS Redditch Ltd
UK Medium size (range from small to large) industrial ovens and furnaces
EFD Induction AB Sweden Induction heating and furnaces Eltro GmbH Germany Plasma heat treatment Inductotherm Global Induction furnaces Ipsen Germany Vacuum furnaces (heat treatment – medium-size) Lindberg USA Heat treatment furnaces Nabertherm Germany Small to medium size industrial ovens and furnaces (plus some
laboratory) Despatch USA Laboratory and small / medium industrial ovens and furnaces,
standard and custom designs Solo Swiss Switzerland Heat treatment furnaces Cieffe Italy Medium and large heat treatment furnaces Cofi Italy Vacuum and heat treatment furnaces Safed France,
Switzerland, Germany
Heat treatment furnaces (owned by Aichelin, Austria since 2007)
MTH Group Germany Mahler - Heat treatment, brazing and sintering furnaces and IVA, BMI Fours, Schmetz (vacuum furnaces) and Riva, all making heat treatment furnaces
ECM France Low pressure and vacuum furnaces Kohnle Germany Heat treatment furnaces Nitrex Canada Heat treatment furnaces Seco-Warwick USA / Poland Medium and large heat treatment, vacuum and melting furnaces,
primarily for aluminium RDM Engineering UK Batch and continuous medium size furnaces Speedline Technologies
USA Solder reflow ovens
BTU USA Solder reflow, thick-film ovens, solar, etc. Electric furnaces and ovens Baker Perkins Group
UK Continuous bakery and biscuit production ovens (includes some very large ovens)
Stork Netherlands Continuous ovens for manufacture of dairy and meat products CFS Netherlands Large continuous food manufacture ovens Inciner8 UK Batch incinerators for medical and animal waste Tokyo Electron Japan Batch semiconductor manufacture furnaces

ERA Technology Limited ERA Report No. 2012-0230
043122753 ENTR Lot 4 Final Report v6 100 © ERA Technology Ltd
Name of manufacturer
Location Main target markets
Tatreon Technologies
UK Semiconductor diffusion furnaces
Opico UK Grain driers Over Meccanica Spa Italy Paper production machinery including driers
Medium and large furnaces are often constructed using components and materials from manufacturers that specialise in these parts.
Table 35. Suppliers of component parts of furnaces and ovens Manufacturer Location Products GoGas Germany Electric and gas heated infrared heaters for ovens and furnaces Invensys Eurotherm Global Furnace control technology ESA Italy Burners WS GmbH Germany Burners Rath Austria (HQ) Furnace refractories and insulation. Production of HTIW, insulating
fire bricks and Refractory Unifrax USA (HQ) Furnace refractories and insulation. Production of HTIW, insulating
fire bricks and Refractory
2.3.2 Large-scale furnaces and ovens Most larger-scale furnaces and ovens are designed and constructed by specialist manufacturers. Many of these manufacturers will build furnaces and ovens for many of the industry sectors described in this report and others specialise in certain types, such as metal melting furnaces, ceramic kilns, bakery and biscuit ovens, etc. Some manufacturers specialise in specific technologies such as:
• Induction heating – metal melting and heat treatment processes • Plasma heating – a wide variety of applications • Infrared heating – used in ovens for drying, baking (food) and curing coatings
Most manufacturers of large furnaces are SMEs, and many sell only very small numbers of furnaces (e.g. less than 5) per year which explains their reluctance to divulge their sales data and their lack of knowledge of total EU sales. The routes to market vary and include:
• Some manufacturers of larger-scale furnaces and ovens use distributors but those that build the largest furnaces and ovens sell directly to users.
• Some new furnaces are designed by specialists, but are installed by other organisations, including sometimes the end-user.
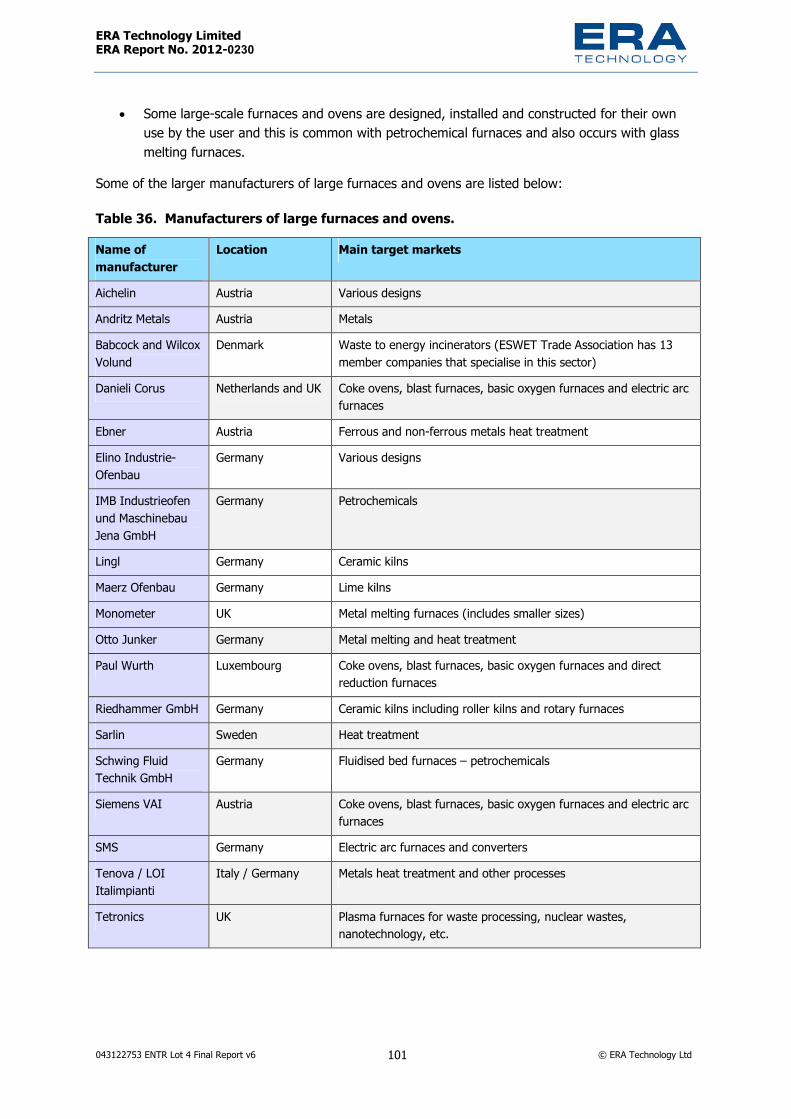
ERA Technology Limited ERA Report No. 2012-0230
043122753 ENTR Lot 4 Final Report v6 101 © ERA Technology Ltd
• Some large-scale furnaces and ovens are designed, installed and constructed for their own use by the user and this is common with petrochemical furnaces and also occurs with glass melting furnaces.
Some of the larger manufacturers of large furnaces and ovens are listed below:
Table 36. Manufacturers of large furnaces and ovens. Name of manufacturer
Location Main target markets
Aichelin Austria Various designs Andritz Metals Austria Metals Babcock and Wilcox Volund
Denmark Waste to energy incinerators (ESWET Trade Association has 13 member companies that specialise in this sector)
Danieli Corus Netherlands and UK Coke ovens, blast furnaces, basic oxygen furnaces and electric arc furnaces
Ebner Austria Ferrous and non-ferrous metals heat treatment Elino Industrie-Ofenbau
Germany Various designs
IMB Industrieofen und Maschinebau Jena GmbH
Germany Petrochemicals
Lingl Germany Ceramic kilns Maerz Ofenbau Germany Lime kilns Monometer UK Metal melting furnaces (includes smaller sizes) Otto Junker Germany Metal melting and heat treatment Paul Wurth Luxembourg Coke ovens, blast furnaces, basic oxygen furnaces and direct
reduction furnaces Riedhammer GmbH Germany Ceramic kilns including roller kilns and rotary furnaces Sarlin Sweden Heat treatment Schwing Fluid Technik GmbH
Germany Fluidised bed furnaces – petrochemicals
Siemens VAI Austria Coke ovens, blast furnaces, basic oxygen furnaces and electric arc furnaces
SMS Germany Electric arc furnaces and converters Tenova / LOI Italimpianti
Italy / Germany Metals heat treatment and other processes
Tetronics UK Plasma furnaces for waste processing, nuclear wastes, nanotechnology, etc.

ERA Technology Limited ERA Report No. 2012-0230
043122753 ENTR Lot 4 Final Report v6 102 © ERA Technology Ltd
2.4. User expenditure base data Basic user data are compiled in this section. This includes EU expenditure on machinery as well as operating costs, in particular energy costs and end-of-life costs.
Based on the categories defined in sub-Task 1.1, average prices including VAT, applicable rates for running costs (e.g. electricity and fossil fuels, repair and maintenance, disposal) and other financial parameters (e.g. taxes, interest and inflation rates) have been determined.
The total lifetime costs of an industrial or laboratory furnace or oven can be divided into five relevant categories:
• Purchase costs – the cost incurred to purchase the furnace or oven • Operating costs – the costs incurred to operate the furnace or oven throughout a typical lifetime.
These costs may include electricity and fossil fuel costs and costs of consumables (water, etc.) • Installation costs – the costs required for installing a furnace or oven • Maintenance costs – the costs incurred by the owner of the furnace or oven throughout the
lifetime of the machine to ensure its proper and effective operation • Disposal costs – the quantifiable costs borne by the owner of the machine at the end of life Some furnaces require cooling and some very large designs use large amounts of water. Waste heat may be used, for example for heating buildings, but this is relatively uncommon and requires additional expenditure though long-term savings would be achieved. Other economic parameters such as energy rates, interest and inflation rates have been collected at EU level based on Eurostat.
The data that will be identified for the products defined in sub-Task 1.1 are: • Average prices, including VAT, in Euros; • Fossil fuel rates (€/GJ); • Installation costs, in Euros; • Costs per unit produced, in Euros (if applicable); • User prices of other consumables (€/kg or €/piece); • Repair and maintenance costs (€/product life); • Disposal tariffs/taxes (€/product). • The Commission provided the following rates by EU Member State and for EU 27: • Electricity rates (€/kWh); • Interest and inflation rates (%). These data will serve primarily as cost inputs when conducting the life-cycle analysis later in the study.

ERA Technology Limited ERA Report No. 2012-0230
043122753 ENTR Lot 4 Final Report v6 103 © ERA Technology Ltd
2.4.1 Purchase costs
Furnace and oven prices All users consider price as a high priority, usually second only to the functions available. Minimising price can influence whether eco-design options are included. Prices of furnaces sold in EU range from about €500 for a standard laboratory oven to over €1.1 billion for a blast furnace installation42 with a capacity of 3.5 million tonne per year (installation costs include all ancillary equipment, including the building(s) to house the oven/ furnace, as required). Newer direct reduction furnace installations, with a smaller capacity of 1.36 million tonnes per year cost much less at €210 million (there is only one plant of this type in EU). Industrial furnace installations can be very costly not only for the furnace itself but also for equipment to prevent emissions of hazardous substances, energy recovery, etc. The table below lists furnace and oven prices plus some typical examples of prices for installations where no furnace prices are available. Installation costs include the full process including buildings, hygiene equipment (e.g. scrubbers) and safety equipment that are not part of the furnace itself but are essential for it to operate, as well as for the individual ovens and furnaces. Some of the data has been obtained from IPPC BREF guidance and the rest from manufacturers, or manufacturers’ websites. In practice, it is difficult to differentiate installation and furnace costs for very large equipment (e.g. should control rooms be included in furnace prices?).
Table 37. Selected illustrative examples of price, throughput or capacity of ovens and furnaces and for some larger installations Oven / furnace Capacity Cost of furnace / oven or
installation (full process) * Steel blast furnace 3.5 million tonnes / year €1.1 billion for installation Steel direct reduction furnace 1.36 million tonnes per year €210 million for installation Average EU cement kiln 586 000 tonnes / year43 c.€120 million (equivalent to three
years turnover) for installation Float glass installation (includes several furnaces)
Up to c.700 tonnes per day = 250,000 tonnes / year
€100 – 150 million for installation
Float glass melting furnace 180 000 tonnes per year €10 million furnace only Isa-smelt furnace for primary lead production
6500 tonnes per year €70 million for installation
All prices below are for the furnace or oven only Tunnel kiln for bricks 175 000 tonnes per year €6 million for furnace only Continuous drier oven for wet bricks
175 000 tonnes per year €3 million for oven only
Soda lime domestic glass furnace, gas fired
47 000 tonnes per year €12 million for furnace only (refurbishment of existing furnace = €4 million)
42 Draft IPPC BFREF steel processes 2009 43 Based on 256 million tonnes cement produced in 437 EU installations.

ERA Technology Limited ERA Report No. 2012-0230
043122753 ENTR Lot 4 Final Report v6 104 © ERA Technology Ltd
Oven / furnace Capacity Cost of furnace / oven or installation (full process) *
Secondary aluminium melting furnace
c.50 tonnes capacity €2.7 million for furnace
Induction furnace for steel foundry 24 000 tonnes per year €3.5 million for furnace Electrically heated pusher furnace 4000 tonnes per year €1.2 million for furnace Bakery oven for biscuits (direct gas heating)
1.6 m wide conveyor (typically 250°C €500 000 for oven
Solder reflow oven (soldering printed circuit boards, continuous electric heating)
0.5 m width conveyor (max 350°C) €130 000 for oven
Gas continuous heat treatment furnace with steel mesh conveyor (and salt bath quench tank)
0.6 m wide belt c.€100 000 for furnace
Vacuum furnace (to 1500°C) rated 260kW
800 kg batch c.€100 000 for furnace
Small rotary melting furnace with gas burner
0.5 – 1 tonne capacity c.€40,000 for furnace and cold air burner
Oven with conveyor (RDM Engineering model jup3201 from 2011 price list)
Interior volume is 99,000 litres £47 000 for oven (gas heated version)
Batch bakery ovens Deck ovens c.8 m3.Single rack ovens c.2m3.
Deck €35,000 Rack €15,000
Medium batch oven (RDM Engineering, 2011 price list 250°C)
90 000 litres internal volume £31 000 electrically heated oven £28 000 gas heated oven
Mid-size medical steam steriliser 150 litre €14 00044 High temperature laboratory furnace (Carbolite HTF 18/8/3216P1)
8 litre internal volume, 1800°C maximum
£13 923 (price from www.fisher.co.uk )
Small laboratory muffle furnace (Carbolite CWF 11/5/301)
4 litre internal volume, 1100°C maximum
£1637 (price from www.fisher.co.uk )
Small laboratory convection oven (Memmert UFB 400)
53 litre internal volume £971 (price from www.fisher.co.uk)
Note: Most of the above prices are from stakeholders and some are from websites of suppliers.
Repair and maintenance costs The most common maintenance requirement for furnaces and ovens is to replace worn refractories and insulation. The life of a refractory / insulation lining depends on the process, and on the frequency of use. It is not possible to give a single figure, as the cost for every design is different, but one stakeholder has indicated that refractory and insulation replacement typically costs about 20% of 44 http://www.priorclave.co.uk/downloads/Priorclave_Euro_Price_List_0110.pdf

ERA Technology Limited ERA Report No. 2012-0230
043122753 ENTR Lot 4 Final Report v6 105 © ERA Technology Ltd
the cost of a new furnace or oven. Other maintenance requirements include repairs to burners, cleaning heat exchangers, replacement of sensors etc. and these costs are very variable. Some examples from publications and from stakeholders are listed below.
Type of furnace / oven and process Maintenance cost Soda lime domestic glass furnace, gas fired, 47 000 tonnes per year
Refurbishment of existing furnace = €4 million (30% of cost of new furnace) every 10 - 12 years
Batch heat treatment furnaces (atmosphere furnaces with gas burners)
c.20% of cost of new furnace, can be every 5 years but depends on process
Batch bakery ovens Deck – gas = €8000, electric = €6000 p.a. Rack – gas = €5500, electric = €3650 p.a.
Very little maintenance is needed for many types of oven and furnace as the refractory and insulation will last the life of the equipment. Refractory replacement is needed for furnaces that operate at very high temperature, with aggressive materials such as glass or metal melting or subject to physical damage. The frequency of replacement is process dependent with some glass melting furnace linings needing replacement after less than 2 years and others lasting as much as 15 years. The refractory of rotary furnaces for melting metals requires replacement typically after 300 melts whereas the same process in an induction melter may require replacement after less than 90 melts. HTIW has lower thermal mass and lower thermal conductivity than low density insulating bricks but in processes close to the temperature limits of the HTIW, HTIW tend to shrink and distort so that their performance degrades and periodic replacement is needed. Long lifetimes can be achieved as long as the correct choice of insulation and refractories is made, and also is constructed and installed correctly. This is not straightforward. Low density brick insulation does not distort, and so replacement is not necessary, except at very high temperatures, or in corrosive environments
Purchasing criteria of users Manufacturers of smaller laboratory ovens and furnaces report that their customers’ main criteria are the functions of the equipment with price also being important. Manufacturers of larger industrial ovens and furnaces claim that the most important purchase criteria is suitability for one specific process and some report that product price and energy efficiency are equally important to most customers although most manufacturers report that purchase price is more important than energy efficiency. The price is directly related to the oven or furnaces design and functions but the total life-cost of ownership includes the cost of energy in use and any maintenance and repair costs. Additional features that ensure high reliability will add to the price but this might be far less than the cost of unexpected down-time should failures occur. Limitations on the availability of capital for investment has been reported by many stakeholders to limit the purchase of energy-efficient features with new furnaces and ovens and this can also affect refurbishment.
For small laboratory ovens and furnaces, energy costs are usually unknown and not considered, and thus the lowest price available for equipment having the required functions is selected. Users of very large furnaces such as blast furnaces will provide detailed specifications to potential suppliers and will base their choice of supplier on various factors including price but energy efficiency is also very important as this affects lifetime costs. Some suppliers of furnaces guarantee maximum energy consumption limits (per tonne of product) so that potential purchasers will know the maximum energy costs incurred with the furnace. Purchase decisions for medium-size furnaces are made based

ERA Technology Limited ERA Report No. 2012-0230
043122753 ENTR Lot 4 Final Report v6 106 © ERA Technology Ltd
mainly on price, with energy consumption in use being important for larger furnaces and ovens; however, suitability for use is the most important criteria.
2.4.2 Operating costs Operating costs, understood as costs generated by the use of the furnace or oven, can be split into:
• Energy costs (separate costs for electricity and fossil fuels) • Consumable costs (water, etc.) • Maintenance costs could also be considered in this category; however they have been neglected
because they are not expected to be significant for this product type. Energy costs are the most significant running cost of furnaces and ovens. Fossil fuels are used for combustion whilst electricity is used for fans and other components. The EU average electricity and fossil fuel prices for industry according to the different consumption classes will be used in LCC calculations at a later stage of the study (Task 5 and Task 7). Member State data is given in the Appendix to this report.
Electricity rate The evolution of electricity rates between 2008 and 2009 as reported by Eurostat, are presented in Table 38 and Table 39.
Table 38. The evolution of electricity rates between mid-2007 and mid-2009 for customers (500-2000 MWh) in EU-2745 (all taxes included)
Rate [€/kWh] 2008S1 2008S2 2009S1 2009S2 0.1194 0.1253 0.1305 0.1253
Table 39. Electricity rates in the first semester of 2009 according to tax breakdown in EU-2746 for average industrial consumers (500 – 2000MWh)
Rate [€/kWh] Without
taxes Without
VAT All taxes included
0.0913 0.1026 0.1253
For this study, preliminary estimates show that typical industrial facility operating ovens within the intended scope are expected to consume electricity in the IC electrical consumption band (500MWh – 2000MWh). Therefore, for this study the cost of electricity, including all taxes, will be the 2009 prices, without taxes 9.13 EUR/100kWh
45 Eurostat (2010), “Electricity - industrial consumers - half-yearly prices - New methodology from 2007 onwards”. 46 Eurostat, http://nui.epp.eurostat.ec.europa.eu/nui/submitViewTableAction.do
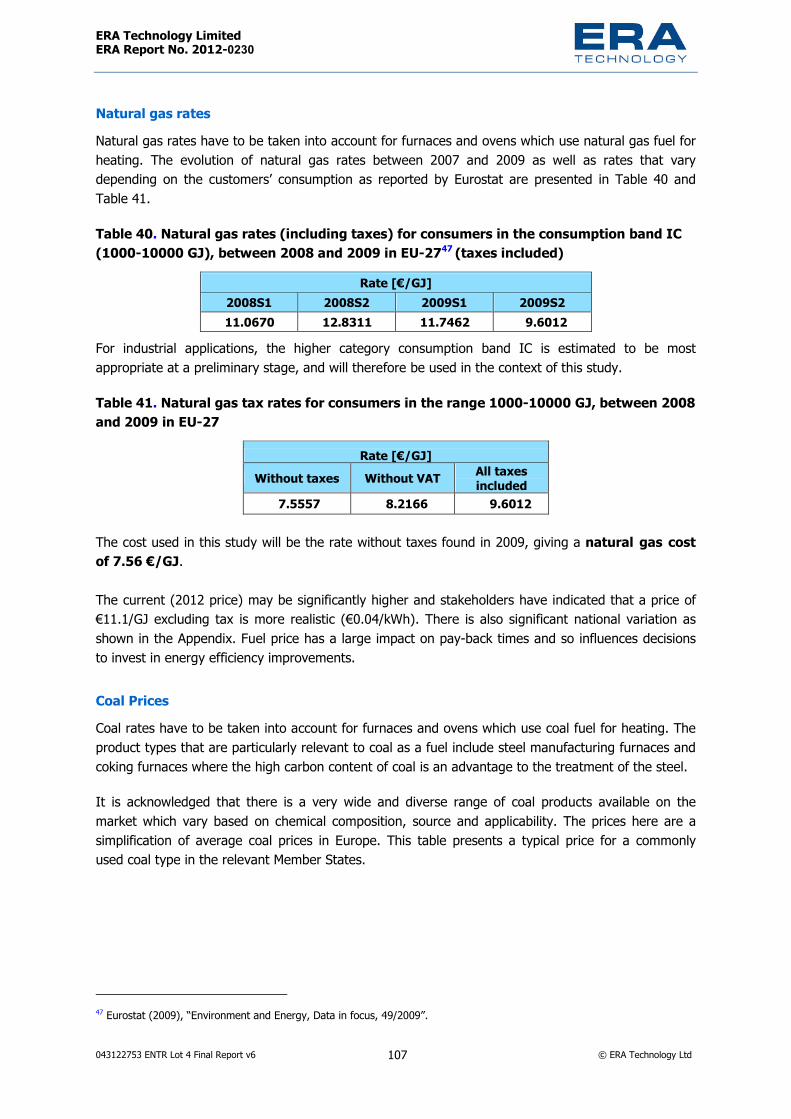
ERA Technology Limited ERA Report No. 2012-0230
043122753 ENTR Lot 4 Final Report v6 107 © ERA Technology Ltd
Natural gas rates Natural gas rates have to be taken into account for furnaces and ovens which use natural gas fuel for heating. The evolution of natural gas rates between 2007 and 2009 as well as rates that vary depending on the customers’ consumption as reported by Eurostat are presented in Table 40 and Table 41.
Table 40. Natural gas rates (including taxes) for consumers in the consumption band IC (1000-10000 GJ), between 2008 and 2009 in EU-2747 (taxes included)
Rate [€/GJ] 2008S1 2008S2 2009S1 2009S2 11.0670 12.8311 11.7462 9.6012
For industrial applications, the higher category consumption band IC is estimated to be most appropriate at a preliminary stage, and will therefore be used in the context of this study.
Table 41. Natural gas tax rates for consumers in the range 1000-10000 GJ, between 2008 and 2009 in EU-27
Rate [€/GJ] Without taxes Without VAT All taxes
included 7.5557 8.2166 9.6012
The cost used in this study will be the rate without taxes found in 2009, giving a natural gas cost of 7.56 €/GJ.
The current (2012 price) may be significantly higher and stakeholders have indicated that a price of €11.1/GJ excluding tax is more realistic (€0.04/kWh). There is also significant national variation as shown in the Appendix. Fuel price has a large impact on pay-back times and so influences decisions to invest in energy efficiency improvements.
Coal Prices Coal rates have to be taken into account for furnaces and ovens which use coal fuel for heating. The product types that are particularly relevant to coal as a fuel include steel manufacturing furnaces and coking furnaces where the high carbon content of coal is an advantage to the treatment of the steel.
It is acknowledged that there is a very wide and diverse range of coal products available on the market which vary based on chemical composition, source and applicability. The prices here are a simplification of average coal prices in Europe. This table presents a typical price for a commonly used coal type in the relevant Member States.
47 Eurostat (2009), “Environment and Energy, Data in focus, 49/2009”.

ERA Technology Limited ERA Report No. 2012-0230
043122753 ENTR Lot 4 Final Report v6 108 © ERA Technology Ltd
Table 42. Average EU Coal price without VAT based on 18 Member States, in June 200548 State Coal price (€/GJ) EU average 8.05
Oil Prices Oil rates have to be taken into account for furnaces and ovens which use fuel oil for heating. It is acknowledged that there is a very wide and diverse range of oil products available on the market and that the prices here are a simplification of average oil prices in Europe for use in industrial ovens. Typically industrial fuel oil prices differ from those for residential oil heating or for the transportation sector (both automotive diesel oils and marine ‘bunker’ oils); however the definition and distinction between different types of fuel oils can be obscure, especially on an international level. There tends to be less difference in fuel oil prices between Member States also when compared to coal, for example.
The table below presents a typical price for a commonly used oil type in the relevant Member States, estimated to be approximately equivalent to the US Fuel Oil #2, or distillate fuel oil.
Table 43. Fuel prices without VAT from 2006 to 2009 based on weekly spot price history of distillate heating oil excluding taxes (in €/GJ)49
Member State 2006 2007 2008 2009 Belgium 10.54 11.74 17.19 10.20 France 11.37 12.36 17.95 11.02 Germany 11.07 11.68 17.25 10.65 Italy 12.34 13.43 18.93 12.04 Netherlands 12.54 13.81 16.53 8.16 UK 10.56 11.06 16.06 9.27 Average 11.40 12.35 17.32 10.22
The price of distillate heating oil has been highly volatile over the years and is directly correlated with the price of crude oil. As the supply of distillate heating oil is less common for furnace applications in Europe it is much more difficult to determine average prices for each country. It is expected that prices are generally negotiated directly between delivery/ supply companies and the furnace owners, and that these supply contracts are generally confidential based on the spot price plus a premium.
For the purposes of this study, a linear extrapolation over the previous prices found, gives a fuel oil price equivalent to 13.74 €/GJ without taxes.
48 E. Alakangas et al. (2007) Biomass fuel trade in Europe, Summary Report. Eubionet II. 49 US Department of Energy, International Energy Price Information Page, http://www.eia.doe.gov/emeu/international/prices.html#Distillate
Assumptions for conversion include: - 1.00 USD = 0.751 EUR as per April 26th 2010 - 1.00 US gal = 3.785 L - Rotterdam distillate heating oil, NCV = 40.4MJ/kg (estimate)

ERA Technology Limited ERA Report No. 2012-0230
043122753 ENTR Lot 4 Final Report v6 109 © ERA Technology Ltd
To summarise, the following energy rates in Table 44 will be used:
Table 44. Summary of the rates used for energy in this study Category Rate Unit Electricity – Industrial use IC Band 9.13 (€/100 kWh) Gas – Industrial use IC Band 7.56 (€/GJ) Coal - European average 8.05 (€/GJ) Oil – Distillate #2 Fuel Oil equivalent 13.74 (€/GJ)
Consumable (water, etc.) prices The costs of consumables will be discussed in this section.

ERA Technology Limited ERA Report No. 2012-0230
043122753 ENTR Lot 4 Final Report v6 110 © ERA Technology Ltd
Water – used in large quantities for cooling The cost of water to consumers can be difficult to evaluate as it is often based on a variable rate which corresponds to consumption. Figure 7 shows the estimated water prices for major city centres and estimates for national averages for countries in Europe, from a study completed by the OECD in 2003. City data is for 1998 and national data is for 1996.
Figure 7. Water prices in Europe50 A more recent indication of water prices in France is shown in Figure 8, where a breakdown in the cost of water to consumers is given over 15 years.
50 OECD 2003 – Water Indicators
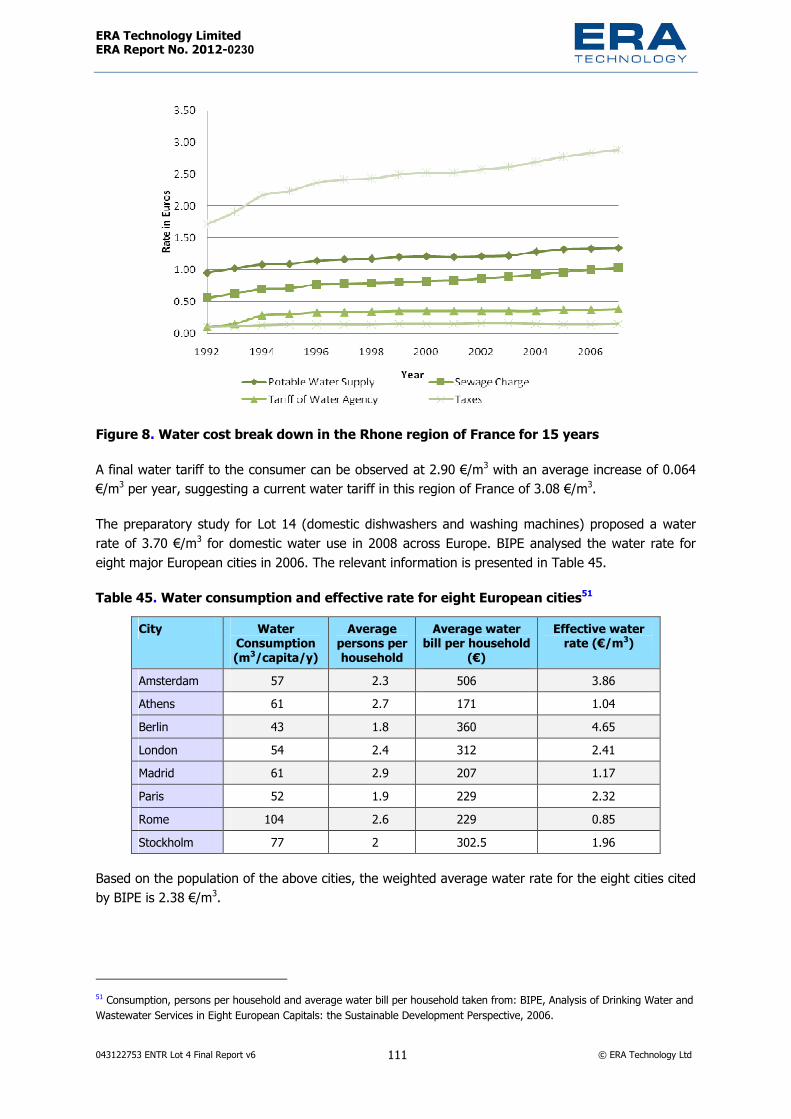
ERA Technology Limited ERA Report No. 2012-0230
043122753 ENTR Lot 4 Final Report v6 111 © ERA Technology Ltd
Figure 8. Water cost break down in the Rhone region of France for 15 years
A final water tariff to the consumer can be observed at 2.90 €/m3 with an average increase of 0.064 €/m3 per year, suggesting a current water tariff in this region of France of 3.08 €/m3.
The preparatory study for Lot 14 (domestic dishwashers and washing machines) proposed a water rate of 3.70 €/m3 for domestic water use in 2008 across Europe. BIPE analysed the water rate for eight major European cities in 2006. The relevant information is presented in Table 45.
Table 45. Water consumption and effective rate for eight European cities51
City Water Consumption (m3/capita/y)
Average persons per household
Average water bill per household
(€) Effective water
rate (€/m3)
Amsterdam 57 2.3 506 3.86 Athens 61 2.7 171 1.04 Berlin 43 1.8 360 4.65 London 54 2.4 312 2.41 Madrid 61 2.9 207 1.17 Paris 52 1.9 229 2.32 Rome 104 2.6 229 0.85 Stockholm 77 2 302.5 1.96
Based on the population of the above cities, the weighted average water rate for the eight cities cited by BIPE is 2.38 €/m3.
51 Consumption, persons per household and average water bill per household taken from: BIPE, Analysis of Drinking Water and Wastewater Services in Eight European Capitals: the Sustainable Development Perspective, 2006.

ERA Technology Limited ERA Report No. 2012-0230
043122753 ENTR Lot 4 Final Report v6 112 © ERA Technology Ltd
Based on the above sources, a water rate extrapolated from the weighted average of the eight largest cities in the EU to the year 2010 based on the evolution of water price experienced in France over 15 years gives a water price of 2.64 €/m3 for the EU-27.
This figure will be used to estimate the LCCs of furnaces in Task 4 of this study and may impact the LCCs of these appliances when considered on the scale of the entire European market.
From 2010, the Water Framework Directive 52 requires Member States to improve their water management strategy through setting pricing and policy incentives to preserve the natural water systems of Member States. It can be expected that in years to come, the price of water will become an increasingly large concern for furnace and oven manufacturers and likewise furnace and oven users, as Member States gradually increase the cost of water to reflect environmental and resource use costs more adequately, as defined in the Directive.
Interest and inflation rates The table below lists the interest rate in each Member State as well as the overall EU-27 rate, as published by Eurostat and the European Central Bank. This study assumes an interest rate of 4.5%.
Table 46. EU-27 interest rates53 State 2006 2007 2008 EU 27 4.08% 4.57% 4.55%
Annual inflation rates are shown in the Table below. This study assumes an inflation rate of 3%.
Table 47. EU-27 annual inflation rates (%)54 State 2006 2007 2008EU 27 2.30 2.40 3.70
52 Directive 2000/60/EC of the European Parliament and of the Council of 23 October 2000 establishing a framework for Community action in the field of water policy. Available at: http://europa.eu/legislation_summaries/agriculture/environment/l28002b_en.htm accessed February 1 2010. 53�Eurostat, Interest Rates, Long-term interest rates, Maastricht criterion interest rates, EMU convergence criterion series - Annual data, accessed 26 November 2009. 54�Eurostat, Prices, Harmonised indices of consumer prices (HICP), HICP (2005=100) - Annual Data (average index and rate of change), accessed 27 November 2009.

ERA Technology Limited ERA Report No. 2012-0230
043122753 ENTR Lot 4 Final Report v6 113 © ERA Technology Ltd
Summary The table below summarises the consumer expenditure data presented in the previous sections. This data will be useful in later Tasks (Task 5) for estimating life cycle cost properties of these products.
Table 48. User expenditure base data Category Cost items Units Value for Lot 4 study
Use Water rates €/m3 2.64 Use Electricity (€/100 kWh) 9.13 Use Gas (€/GJ) 7.56 Use Coal (€/GJ) 8.05 Use Oil (€/GJ) 13.74 Use Interest-inflation rate % 4.0

ERA Technology Limited ERA Report No. 2012-0230
043122753 ENTR Lot 4 Final Report v6 114 © ERA Technology Ltd
3. Task 3 – User requirements This Task investigates the technical requirements of users of furnaces and ovens. There are many different applications for furnaces and ovens and users’ requirements in each sector will be different and this is discussed here. Oven / furnace price is always a consideration for users but is not considered here in Task 3; it will be considered in Task 7. Adopting improved eco-design may have implications on price which is important because many users will have a choice of investing in new equipment in either the EU or elsewhere. Installing cheaper and less energy efficient furnaces outside the EU would be harmful to the EU not only in terms of lost jobs but also as global CO2 emissions would not be reduced.
3.1. User information There are a wide variety of users of ovens and furnaces all of which have different requirements. These include:
• Analytical and research laboratories – will use smaller ovens and furnaces, some designed for specific analytical procedures. Medical research facilities will use incubators and sterilisers
• Schools, colleges and other education establishments – Small ovens and furnaces are used for teaching science subjects, metal working and jewellery and pottery fabrication
• Domestic environments – small furnaces are used by craft-workers and artists to make jewellery and pottery, either as a hobby or for sale
• Test houses – establishments that carry out standard tests to equipment or materials may use small and medium size ovens, furnaces and environmental chambers.
• Hospitals and doctors practices – use sterilisers and incubators • Dental facilities – sterilisers and dental furnaces • Semiconductor manufacture – require purpose designed clean room furnaces • Electronics manufacture – solder reflow ovens and PCB driers. Wave soldering equipment includes
a bath of liquid solder so could be classified as an oven • Food manufacture – biscuit and bakery ovens • Drying materials – range from small laboratory ovens, vacuum ovens, large industrial ovens and
agricultural driers • Ceramic manufacture – medium and large furnaces of various designs for bricks, tiles, pottery,
industrial ceramics, etc. • Glass manufacture – window glass, containers (e.g. bottles), glass fibre, domestic products, etc. • Metal parts fabrication – metal melting furnaces and heat treatment furnaces • Curing materials (paints, adhesives) – Various size ovens including large infrared heated conveyor
ovens for curing paint coatings of cars

ERA Technology Limited ERA Report No. 2012-0230
043122753 ENTR Lot 4 Final Report v6 115 © ERA Technology Ltd
• Brazing metals – vacuum and inert gas atmosphere furnaces • Steel manufacture – blast furnace, basic oxygen furnace and arc furnace • Cement and lime manufacture – cement and lime kilns • Waste disposal – incinerators for organic wastes (animals, medical, municipal, sewage sludge,
etc.), plasma furnaces are used for inorganic wastes • Non-ferrous metals – furnaces for production of metals from ores and waste materials, purification
and alloy production • Oil refineries – include many thermal processes using some equipment referred to as furnaces.
These are purpose designed for oil refinery applications. The above list includes examples of users of ovens and furnaces but there are many more.
3.1.1 Information on products Product information required by and supplied to users varies considerably and tends to be different for smaller off-the-shelf models than for larger custom designs.
Smaller products Marketing information for smaller laboratory ovens and furnaces describes primarily the functions of the equipment. Standard information that is usually provided includes:
• Maximum operating temperature • Dimensions – internal and external • Power rating – this is not the same as energy consumption and it defines the power supply that is
needed to operate the equipment. • Products are supplied with operating instructions but these will not describe how to use the
equipment in an energy efficient manner.
Medium size industrial Stakeholders have said that information on energy consumption is not always readily available although the willingness of supplier to provide this data varies. One manufacturer of medium-size electric multi-zone continuous furnaces provides full details of energy consumption for specific processes, or for standard procedures whereas other manufacturers provide much less detail to their customers.
Large furnaces and ovens Marketing information for larger furnaces and ovens provides function information but many manufacturers also claim energy efficient features or lower energy consumption. Some provide technical papers that explain the energy-efficient design features that are utilised. Users who are large energy consumers will be aware that energy-efficiency is important and so will look for data on

ERA Technology Limited ERA Report No. 2012-0230
043122753 ENTR Lot 4 Final Report v6 116 © ERA Technology Ltd
energy consumption when deciding on the purchase of oven and furnace equipment. The choice will however be based on overall cost, not necessarily a desire to reduce emissions. If the additional cost of inclusion of energy efficiency design features are perceived to be greater than the future saving (over a few years only) in energy costs plus any carbon trading costs (if these are applicable), they are unlikely to include these in their new plant design.
When selecting new custom-designed large furnaces, users either design their own or ask the furnace manufacturer to design to their specification which may include a specification for energy consumption. However, designs often use standard components and materials such as burners, valves, insulation, etc. for which the manufacturers of these parts will provide appropriate data that is required to design a new furnace. For example, datasheets for thermal insulation will specify the external temperature for each thickness and internal temperature. Users of large furnaces will be provided by their suppliers with detailed information on maximum energy consumption, emissions from the process (needed for purchase of hygiene equipment), floor area required, services required and costs broken down in detail. Users may also consider yields that are achievable from the process, maintenance costs, when these are required and for high value products furnace downtime and reliability are important.
3.2. User behaviour in the use phase Requirements of users of ovens and furnaces vary considerably depending on the specific application. Use patterns will be needed for base case assessments and this information has been sought from stakeholders. Requirements differ for each classification:
• Large furnaces and ovens used typically in installations within scope of IED and ETS – usually in continuous use over relatively long periods with short downtimes for maintenance. Refurbishment at least once in the life of a furnace or oven is likely. Usually operate under steady state conditions, i.e. constant temperature, etc but some variation for specific products can be designed into the process.
• Medium-size industrial furnaces and ovens – Can be batch or continuous depending on the process and throughput requirements. Each furnace or oven may be used for one specific process only or for several related processes. For example, non-ferrous metal heat treatment furnaces can be used to heat treat several different alloys at a range of different temperatures, for different times and sometimes with different atmospheres.
• Small industrial – small scale batch processes used as and when needed. This can be continuously, several times a day or only very occasionally. Some designs will be used only for one specific process whereas others can be more variable. For example, a small aluminium melting furnace will be used to make a variety of different aluminium alloys from several different types of feedstock. Small industrial furnaces may be used for research and used in laboratories although are designed for manufacturing processes.
• Laboratory – may be used continuously or batch with a wide variety of use conditions. Laboratory ovens that are used for testing are usually on continuously for long periods at a specific temperature. For general laboratory use, about half of laboratory ovens are left on continuously during the working week but will not be in continuous use so they will be empty for part of the time. The other half of those used in the EU will be switched on when needed and then

ERA Technology Limited ERA Report No. 2012-0230
043122753 ENTR Lot 4 Final Report v6 117 © ERA Technology Ltd
off when this is complete. A small proportion of ovens have programmers and timers that allow them to carry out a heating cycle and then switch off automatically at the end. Currently only c.5% of laboratory ovens have programmers whereas more have timers although these are not frequently used as an energy saving feature. Users of laboratory furnaces have a perception that these use much more energy than ovens due to their higher temperature whereas because of the insulation, the energy consumption of a small laboratory furnace (c.4 litres) and a small laboratory oven (c.50 – 100litres) are in fact similar. Because of this perception, and also as furnaces are usually used only for short periods, they are nearly always switched off when not in use. Furthermore, programmers are common and are usually used, so that furnaces switch off automatically at the end of test cycles.
• Incubators are used continuously as they are needed to maintain a specific environment for long periods. Sterilisers usually have programmers that control the temperature during a sterilisation cycle and then switch off the heat at the end of the cycle.
Table 49 below shows examples of use behaviour provided by stakeholders in their answers to questions from the first questionnaire.
Table 49 User data for furnace and oven use per day and per year Type of furnace or
oven / process Mode of use Times used per year Hours in use per year
Laboratory oven – materials testing
Semi-continuous (on during week at least.
Almost continuously 5 000 – 6 000
Laboratory oven research Very variable Typically 45 weeks /year 4 000 – 5 000 Laboratory furnace Only when needed c.150 occasions 1 000 Laboratory incubator Continuous - 8 760 Laboratory steam steriliser (autoclave)
Batch 500 2 000
Glass melting (flat) Continuous Continuous 8 760 (100%) Glass laminating, toughening
Continuous 48 weeks / year 8 086
Brick and roof tile kilns Continuous 48 weeks / year 8 086
Many more examples of hours use per year are given in section 5.3.
Variables that are important to users:
Variables that are important to users of furnaces and ovens include the following:
Continuous or intermittent use Some types of furnace such as blast furnaces, cement kilns, waste to energy incinerators, etc. are used continuously for many years whereas many others are operated batch-wise. Ovens and furnaces with conveyors can be operated continuously but many are used for only part of each day, typically 8 – 10 hours for one shift during each working day. Users of large furnaces have high

ERA Technology Limited ERA Report No. 2012-0230
043122753 ENTR Lot 4 Final Report v6 118 © ERA Technology Ltd
energy costs, are therefore conscious of energy consumption, so try to minimise their energy costs and thus ensure that furnaces are switched off when not in use. However, continuous processes operating 24 hours/ day and 365 days/ year will usually be more energy efficient than batch processes because the latter lose energy when they cool down. Users of smaller ovens in particular, but also furnaces, are less concerned by energy costs, and so may leave ovens switched on continuously, even though they may only be required intermittently. Automatic power management to switch equipment into a standby mode is not a standard feature.
Continuous processes can be more energy efficient as this avoids the need to heat up the oven or furnace to its operating temperature before it can be used, and energy is not lost when the process is complete and the furnace cools down. For example, if a furnace is used for batch heating, the furnace needs to be heated up to its operating temperature, and this consumes a certain amount of energy. Some energy will be lost from the exterior of the furnace when the furnace is being used but all of it is lost after the furnace is switched off at the completion of the process. Continuous production is not always feasible however as there may not be sufficient material or parts for a continuous process. Also, the salaries for three shifts may affect the economics of the operation.
In practice, the choice between continuous or batch processing is made on the basis of many variables, which often include:
• Scale and energy efficiency – this is usually the most important. Very large scale processes such as cement and steel manufacture are more economical and energy efficient on a large scale with a continuous process. Aluminium scrap melting is more economical and more energy efficient in a large continuous tower furnace than by smaller-scale batch processes but SMEs will usually not have the resources, throughput requirements or space for this type of furnace.
• Process requirements – some processes can be carried out only by using a continuous process. This is often to ensure that high product quality is achieved, and this is the main reason that surface-mount printed circuit boards are soldered in conveyorised tunnel ovens. Some processes, such as cement and steel production, could in principal be carried out in batches, but this never occurs as the energy consumption would be far greater. Some processes can only be carried out in batches such as heat treatment of metals, especially where long heat treatment times or slow cooling are required. Metal parts need to be heated at a specific temperature for many hours and then either rapidly quenched or very slowly cooled (this depends on the alloy and heat treatment required), and this would require unreasonably long tunnel ovens for a continuous process. Some alloys are heat-treated in a vacuum or in inert gas atmospheres to prevent oxidation. This is much easier to achieve in a batch process, as the chamber can be sealed, unlike in a tunnel furnace, which must have openings at both ends. Batch/ continuous process technology is described in more detail in Task 4
• Space availability – continuous processes tend to require much larger spaces and so small-scale operators have to use batch processes.
Safety All equipment must be safe to use and this includes avoiding the risk of harm from hot external surfaces. The methods used to prevent external surfaces from becoming dangerously hot include:

ERA Technology Limited ERA Report No. 2012-0230
043122753 ENTR Lot 4 Final Report v6 119 © ERA Technology Ltd
• Thermal insulation around the chamber. This not only protects workers but also conserves energy by reducing losses to the surrounding environment. This is the preferred option. The performance of thermal insulation varies and is considered in Task 5.
• Guards around accessible hot surfaces. These are used where surfaces become unacceptably hot despite using insulation. This is applicable where furnaces operate for very long periods at high temperatures and at locations where it is not possible to use sufficient insulation.
• Water cooling of external surfaces. This is used with vacuum furnaces and some other types. The parts inside vacuum furnaces are heated by radiation as conduction and convection are ineffective in a vacuum. However, heat loss from the heated parts is minimal, as a vacuum does not allow conduction or convection heat losses. Thermal insulation is not always used between the radiant heaters and the outer walls, so that the external walls are also heated by radiant energy and thus need to be cooled. Some types of very high temperature furnace such as electric arc furnaces need water cooling to cool heat-sensitive parts that cannot be protected by insulation.
• Tube furnaces are insulated around the tube but it is sometimes difficult to provide a barrier at the tube ends. When very hot, intense infra-red radiation is emitted from the ends of the tube. Therefore, this tube end needs to be blocked, usually using a ceramic barrier.
Temperature control accuracy The temperature control performance can significantly affect energy consumption and so is important with most furnaces. Smaller laboratory ovens and furnaces usually have fairly accurate temperature control as standard with an accuracy of ±5° or better. This level of accuracy is often needed for research and development. Metals heat treatment furnaces also need accurate temperature control, as the required physical properties are achieved only by heating at specific temperature for a precise period of time. Rapid cooling is also often required. The use of electronic temperature control of larger furnaces and ovens usually has a payback time of much less than 1 year due to energy savings. Electronic controllers are also used to regulate gas and oil burners for maximum efficiency which minimises fuel consumption. Multi-zone furnaces designed to give accurate temperature profiles use insulation that allows some intentional heat loss. This is essential so that a hotter zone does not overheat adjacent neighbouring cooler zones.
Maximum temperature Users select ovens and furnaces on the basis of the maximum temperature that they require. In general, the higher the temperature, the higher the purchase price and running costs, although other features also affect these variables. Materials cost is related to temperature as different more expensive materials are required for insulation, heating elements and support structure where higher temperatures are required. In general, high temperature ovens and furnaces are less able to control low temperatures and so many laboratories will have a selection of types of oven and furnace to provide different temperature capabilities.
Size of oven or furnace The size of a specific type of oven or furnace will be roughly proportional to its price and so there is an incentive to buy equipment that is as small as possible for the user’s needs. Limited available space may also be an issue, such that large ovens or furnaces cannot be used by some SMEs. Some

ERA Technology Limited ERA Report No. 2012-0230
043122753 ENTR Lot 4 Final Report v6 120 © ERA Technology Ltd
EU manufacturers are aware of the IED, and do not want to be included in its scope, and therefore select equipment that is below the threshold where an IED permit is required. These motivations explain some tendencies towards opting for smaller-scale furnaces, which are not always the most energy efficient.
Space availability The choice of oven and furnace design is often constrained by space availability. Land prices can be high in many parts of Europe, and so users aim for as small a “footprint” as possible. This has been apparent with ceramic tunnel kilns in the last 20 years where new kilns are much shorter than kilns built in the 1990s. There is also a tendency to build small batch furnaces as these occupy less space than larger continuous furnaces despite the batch designs being less energy efficient. The reasons for this choice are complex but the cost of land is important although limitations on investment and lower labour costs are also significant factors. Using several small furnaces give greater capacity flexibility than one large, and small furnaces may not need IED permits.
An example where space limitations have affected furnace design is at a plant in Germany which had an existing large steel reheating furnace. A second furnace was installed to increase capacity but the space available was much less than was occupied by the existing furnace. As a result, throughput was approximately half of the original furnace but energy consumption per tonne of steel is approximately double that of the original furnace.
Another example is with large glass melting furnaces. Pre-heating of raw materials is very uncommon mainly due to concerns over its technical viability but space is also an issue. Glass melting furnaces exist in established installations throughout the EU. If a pre-heating unit were to be added, this would require additional space at the input to the glass melting furnaces, but at many plant this will not be available and it may be difficult to create such a space.
Climate and building heating implications The climate at the location where an oven or furnace is installed is not usually important although there may be an impact with laboratory products. The use of laboratory ovens and furnaces in buildings in cold climates can reduce or increase the need for building heating, and in hot climates they may increase the need for air-conditioning. Where oven or furnace heat is emitted into the building, this heat reduces building heating costs but if there are hazardous emissions that need to be ventilated outside of the building, the extracted air will need to be replaced and in cool climates will need to be heated, resulting in higher heating costs.
Ovens can control temperature as long the set temperature is at least 10°C above ambient. Low temperature ovens may therefore need cooling to maintain temperature accurately in hotter climates.
Large furnaces may generate excess heat that can be used for building heating, but this only applies in cool climates.
Energy source Many different energy sources are used with ovens and furnaces and the optimum choice often depends on many variables.

ERA Technology Limited ERA Report No. 2012-0230
043122753 ENTR Lot 4 Final Report v6 121 © ERA Technology Ltd
The energy cost – cost of heating will be affected by the source of energy, with electricity in general being more expensive per kWh than gas or coal.
• Gas may be used instead of electricity to minimise the electric load where electricity prices increase with higher load levels. The use of gas also avoids the need for power transmission equipment, which can be costly to install, although connection to natural gas supply networks is not available to all commercial locations, and can also be costly to connect. Pressurised propane and butane or other hydrocarbon fuels are an option, but may be more expensive than piped natural gas.
• Coal can be a relatively low-cost fuel, and so is used for the largest energy consumers, such as cement kilns. Powdered coal has recently been introduced as a more energy-efficient fuel in blast furnaces. Coal or coke may be required for processes where chemical reduction of oxides to metals is required. Coal and coke are fairly pure forms of carbon; carbon reacts with oxides of iron, copper, lead and several other metals to convert the oxides of these metals to the metals themselves, and carbon dioxide (or monoxide at high temperature). Carbon (as coke) is mixed with iron ore and limestone (as a flux), as the feedstock to blast furnaces, and coal is also used in energy-efficient designs as a combustion fuel.
2Fe2O3 + 3C = 2Fe + 3CO2 - reduction of iron ore to iron metal
2CO2 = 2CO + O2 - Carbon dioxide dissociates to carbon monoxide at high temperature. Carbon monoxide is, however, an effective reducing agent and so can be reused
Coal or coke is also used in some non-ferrous metal smelting processes. Coal cannot be used if ash is unacceptable in products. There are high equipment costs for powdered coal burners and this limits its use to only the most energy intensive processes.
• Waste materials can be used in some processes, as a source of low-cost energy and to reduce the use of fossil fuels. Large-scale waste-to-energy incinerators are designed to burn wastes and to recover the energy as heat or electricity. Cement kilns use about 10% waste materials in the fuel mix, which include waste oil, biomass, etc., and some of these waste materials are classified as renewable energy sources. The disadvantage of waste materials as fuels is that they often contain substances that can be converted into toxic and carcinogenic by-products when they burn. These can include chlorobenzodioxins from chlorinated polymers (such as PVC) and polycyclic aromatic hydrocarbons (PAHs) from halogen-free polymers such as polyethylene. It is necessary therefore to either control the process (ensure that a high temperature is reached) to destroy these substances or install dedicated hygiene equipment to remove toxic substances, in order to comply with EU and national emissions legislation. There are also environmental issues with some sources of biomass which may supplies which are too limited to be a significant energy source.
Energy costs and efficiency Users of larger ovens and furnaces are conscious of energy costs, as these can be considerable. For lime manufacture, energy costs are 40% of production costs, for ceramics the overall average energy

ERA Technology Limited ERA Report No. 2012-0230
043122753 ENTR Lot 4 Final Report v6 122 © ERA Technology Ltd
cost can be as much as c.30% of total production costs55, the figure for cement is c.25% and for the metals industry c.20%56. Therefore the energy efficiency of the oven or furnace is an important criterion for selection. This can also affect the furnace design and choice of energy as different energy sources incur different costs. This is particularly noticeable when comparing fossil fuels such as natural gas with electricity. There are advantages and disadvantage with each type of fuel source and so some furnaces are designed for use with more than one type. For example, Morgan and several other furnace manufacturers produce an aluminium melting furnace which uses gas to melt the metal and electric resistance heating to maintain temperature of the melt. Energy costs are a very much lower proportion of energy costs for many other types of product however and so less effort is made to reduce energy consumption. The proportion of cost due to energy for bread manufacture - for example - is not sufficient to encourage bakers to install heat exchangers to reduce energy consumption, even though this is technically possible.
Carbon emissions targets Users of large quantities of energy may be included in Climate Change Agreements, or in the European Emissions Trading Scheme (ETS) and this will affect most installations within the scope of the IED. This may require involvement in carbon trading schemes or taxation imposed to encourage reductions in carbon emissions. Energy efficiency is an important issue for users of larger furnaces and ovens due to the high energy cost but the ETS scheme potentially adds to this cost and so encourages both the reduction in energy consumption as well as the use of renewable energy sources in order to meet carbon emission targets. However this not only affects furnace and oven design but also feedstock type and how the equipment is used. The potential added cost of ETS could make certain energy efficiency design options more cost-effective than they would otherwise be. For example, it could encourage the use of recuperative or regenerative systems and the installation of monitoring and control equipment to minimise energy consumption. The ETS may also encourage waste heat re-use, as the CO2 emission targets are based on installations, not individual furnaces. However, the additional costs must not be so large that it is cheaper to build a less energy-efficient plant outside the EU where no carbon trading schemes exist.
Other emissions Emissions from empty furnaces and ovens in use are usually negligible, apart from combustion gases. However there may be emissions of hazardous substances from the process materials being heated. Such emissions will be process-specific and are usually the inevitable results of chemical reactions. However, in some processes the quantities can be controlled by the process parameters of the furnace, such as the temperature and air flow rate. Hazardous emissions are regulated fairly well by the IED and some hazardous substances are regulated by other directives, although these apply to EU Member States, and so the controls of individual furnace emissions, especially those outside scope of IED, is less effective (see section 1.5).
Power management Power management is the control of energy consumption by automatically switching equipment into a low power mode after a period of inactivity. With the exception of the use of timers, temperature 55 British Ceramics Confederation http://www.ofgem.gov.uk/MARKETS/WHLMKTS/DISCOVERY/Documents1/British%20Ceramic%20Confederation.pdf 56 Carbon Trust UK www.carbontrust.co.uk

ERA Technology Limited ERA Report No. 2012-0230
043122753 ENTR Lot 4 Final Report v6 123 © ERA Technology Ltd
controllers and programmers, power management features are very unusual in industrial and laboratory furnaces and ovens. Such features are not needed with furnaces and ovens that operate continuously, but may be beneficial for batch ovens and furnaces, particularly laboratory ovens and furnaces that are used only occasionally. For power management to function, there needs to be a way for the furnace or oven to determine when it is possible to switch into a low power mode and this is difficult to envisage for most applications. One patent describes the use of controllers to automatically switch ovens into “energy saving modes”57. Commercial gas-heated catering ovens can include “energy management” using sensors to determine if there is anything in the oven, and this can save at least 30% of energy according to the manufacturer’s literature58. Timers used in some laboratory ovens allow the user to pre-set an oven to be automatically switched off when the heating processes are complete. Laboratory furnaces are usually used with pre-set programs, so that they automatically switch off at the end of the cycle.
Reliability and scheduled maintenance Reliability is extremely important for furnaces and ovens, especially large-scale manufacturing equipment as any unexpected stoppages result in loss of production which can amount to many millions of Euros per day. Furthermore, failures can pose severe safety risks, and there have been incidents where failures have caused injuries and deaths59.
Some types of continuous furnace process cannot be stopped as this would cause irreparable damage to the furnace. If for example, the liquid metal in a metal melting furnace or a blast furnace were to cool and freeze, this would block valves and pipework which could not easily be repaired. The insulation of furnaces must also be reliable as this prevents heat losses and also prevents damage to the support structure. Temperature control equipment reliability and accuracy is important for good control of the process and also to minimise energy consumption.
High reliability is achieved by the correct choice of furnace and oven design and importantly also by following a schedule of preventive maintenance to check for incipient damage, and to replace parts before they fail. Operating the furnace under precisely-controlled conditions not only minimises energy consumption but it also extends the furnace life by preserving insulation, valves, etc. and avoiding early failures. The temperature must be high enough for the process but no higher. It is a general rule that a 10°C rise in temperature can double the rate of chemical reactions, including those that cause parts to deteriorate (thermal oxidation, corrosion, etc.).
The type and frequency of maintenance is affected by design but some examples of energy-efficient designs require more frequent maintenance than others, such as the use of some types of regenerative burners. It is common that refractory materials and insulation need to be regularly replaced. This is usually more frequent for higher temperature processes; for example, electric continuous furnaces operating at 1 800°C require replacement of insulation every 5 years, whereas electric furnaces at 800°C may last 20 years. The insulation in heat treatment furnaces often need to be regularly replaced, as it becomes damaged by the parts being heat-treated and suffers from physical damage. Energy consumption increases as the insulation deteriorates, but some 57 Patent WO 2008033519, D. Yoder, J. Blake and R. Nevarez, Lincoln Foodservice Products USA, 20 March 2008. 58 http://www.middleby.com/midmarsh/wow/WOWbroch_web.pdf 59 For example, smelter explosion, USA in 1961 http://www3.gendisasters.com/indiana/13126/east-chicago-in-furnace-explosion-sep-1961 blast furnace, UK in 2001 http://www.hastam.co.uk/hands/corus.html and oven, Russia in 2010 http://finance.yahoo.com/news/Mechel-Announces-Accident-at-pz-1966565063.html?x=0&.v=1

ERA Technology Limited ERA Report No. 2012-0230
043122753 ENTR Lot 4 Final Report v6 124 © ERA Technology Ltd
manufacturers delay insulation replacement due to the high cost, which can be 20% of the cost of a new furnace. It is common in some countries with heat treatment furnaces60 for the replacement insulation to be thinner than the original. This saves money on the cost of new insulation, but increases future energy costs. It does, however, increase capacity which can reduce energy costs if fewer batches are required. The insulation of glass melting furnaces degrades at a known rate, such that replacement is needed every 15 years. This is because the molten glass slowly dissolves the refractory material. This has the effect that the performance of the insulation gradually deteriorates, meaning that the external surface temperature gradually rises, and energy consumption increases by about 1% – 2% per year.
Furnace manufacturers claim that there are significant opportunities for energy savings from increasing the frequency at which maintenance is carried out. Refractories and insulation often deteriorate and cause leaks resulting in increased energy consumption. This is avoided by more frequent maintenance.
Product Quality For many processes, product quality is the most important characteristic. If quality is inadequate, then the product may need to be disposed of as waste and the process repeated. This, of course, wastes time, labour, material resources and energy, and so must be avoided. Product quality will depend on furnace and oven design. Process variables such as temperature control accuracy, the use of structures to support parts and avoid distortion, and the means of avoiding contamination may all be important, and are affected by the furnace/ oven design. Heat recovery is often needed to reduce energy consumption, but it is often not possible to use hot flue gases directly, as they will contain substances that are harmful to the product. Purification of flue gases without cooling is difficult although not necessarily impossible but heat exchangers may be used to transfer waste heat to clean incoming air; however, this can never be 100% efficient. Some products must be cooled at a controlled rate, and this means that it is not possible, or very difficult, to recover this heat for re-use.
3.2.1 Furnace and oven operational issues Capacity – Many heat losses such as those from external walls, to heat kiln furniture, etc., are independent of throughput. As a result, the energy consumed per tonne of product will depend largely on throughput and energy/ tonne of product will be lowest at maximum capacity. Where furnaces are not needed for extended periods they can be switched off, but this can cause serious problems in large furnaces. Cracks in refractories can be caused by changes in temperature which are too rapid. Also, whilst the furnace is cooling, moisture can collect, causing corrosion to steel parts, and this can also causing cracks in refractories. Operators of large furnaces therefore are therefore reluctant to start and stop furnaces any more than is necessary, to prevent damage that would cause inferior energy efficiency, due to damage to insulation. Any insulation/ refractory damage would also shorten the period between (maintenance) shutdowns. As a result, when demand for products is low, continuous furnaces continue to be operated below full capacity, as the alternative of operating at full capacity and then switching furnaces off presents too large a risk of serious furnace damage. Note that one important differentiating factor is that different refractory materials are used in batch furnaces.
60 Information provided by a furnace manufacturer

ERA Technology Limited ERA Report No. 2012-0230
043122753 ENTR Lot 4 Final Report v6 125 © ERA Technology Ltd
Maintenance – The energy consumption of furnaces and ovens can deteriorate if they are not regularly maintained (as explained above). This can also occur if the correct materials are not chosen, or if the construction and installation are not correct. For example, thermal insulation can degrade and become less effective. Maintenance is also needed to adjust settings, clean fans, blowers, and burners, etc. all of which affect energy efficiency. Leaks due to distortion of door seals and kiln cars can cause significant increases in energy consumption amounting to heat losses of 2.5% or greater.
Working patterns – Batch furnaces that are used only during day shifts will be less energy efficient than if they were operated 24 hours per day. This is because they will either need to be kept hot 24 hours per day, even when not used, to prevent damage from rapid cooling, or to ensure that they can be at the operating temperature, as soon as work begins. Large-scale continuous processes can also be optimised to save energy, particularly where heat from a furnace is used for drying the raw materials, as is common in the ceramics sector. One manufacturer has claimed that good production planning and the use of an energy management system can save up to 9% of total energy consumption.
Selection of furnace type based on energy tariffs (Metal holding furnaces) – Metal melting furnaces are designed to melt metals but are often also used to hold the liquid metal before further processes such as casting. This can waste energy if the furnace heat input control is not sufficiently flexible. Much more energy is needed to melt metals than to maintain the temperature of liquid metal. If gas burners are used, the heat control is not unlimited and so there is a risk of over-heating which will increase the oxidation rate and reduce the yield of usable metal. Some designs have several burners so that some can be turned off after melting. Another option is to use gas burners for melting, and then electric heating for holding. Another issue with metal holding is that while molten, heat is consumed and oxidation will occur and so holding time should be as short as possible. Flexibility and planning are therefore important so that the amount of metal melted is no more than will be needed.
Separate metal holding furnaces are used in several processes to either transfer liquid metal from a furnace to a separate process, such as refining or casting, or to store the liquid metal until needed. This is much better than the alternative of casting into ingots, cooling and then re-melting, but will still consume some energy.
There are circumstances where holding furnaces increase total energy consumption. One publication describes a foundry where installation of new induction melting furnaces and holding furnaces was considered. Clearly using both induction melting and electric holding furnaces will consume more energy (6%) than the use of the induction furnace to melt and hold liquid metal prior to casting. However, the production cost may not reflect energy consumption, as the price of electricity varies during the day according to demand, and is cheapest at night. It can therefore be cheaper to melt at night and hold liquid metal in holding furnaces during the day, even though more energy overall is consumed. The authors point out that in Germany, due to the larger daily price fluctuations, it is cheaper to use holding furnaces with a 6% increase in energy consumption whereas in Sweden, the price fluctuations are smaller, so that use of the holding furnace increases both the energy consumed

ERA Technology Limited ERA Report No. 2012-0230
043122753 ENTR Lot 4 Final Report v6 126 © ERA Technology Ltd
and the production cost61. This is because Sweden has a high percentage of low cost hydroelectricity which is continuously available.
3.3. End of life behaviour This sub-Task identifies actual user requirements (EU averages) regarding end-of-life aspects. This includes:
• Present fractions to recycling, re-use and disposal • Present fraction of second hand use and refurbishment. Smaller (often laboratory) furnaces and ovens can and should be collected and recycled at end-of-life as most will be within the scope of the WEEE Directive, either as an electrical tool (category 6) or a control instrument (category 9).62.
Large-scale furnaces and ovens that are built in situ at manufacturing sites would be regarded as large-scale industrial tools, and so would be excluded from the WEEE Directive. They are usually dismantled at end-of-life and at least some of the materials recycled (steel, for example). Some materials may be classified as hazardous waste as a result of contamination during the production process and these materials will need to be treated appropriately. Other materials such as used insulation may be discarded to landfill.
Large furnaces are difficult or impossible to relocate and so when they are no longer required or reach end of life, they will be dismantled on site and the materials separated for either recycling or landfill. Dismantling of furnaces can be a hazardous process for two reasons:
1. The furnace/ production process which was carried out for many years may have left residues of hazardous substances, which must be recovered for safe disposal. These substances are an inevitable result of the process, and are not created per se by the furnace or oven itself.
2. Furnaces and ovens are constructed of a wide variety of materials some of which are classified as “dangerous” by EU Regulation 1278/2008 (Classification, labelling and packaging). Many types of thermal insulation are used but high temperature insulating wools (HTIW), which include alumina-silicate refractory fibres, are is one of the most effective and their use has significantly reduced furnace energy consumption and CO2 emissions. This is discussed in more detail in Task 5. Alumina-silicate refractory fibres are classified as category 1B carcinogens (GHS classification) and so are hazardous, but this should not however pose a risk as techniques have been developed to protect workers, and to prevent fibrous material from escaping into the local environment. In practice, installing and dismantling of furnaces with most types of refractory materials and insulation could pose a risk which requires appropriate worker protection.
61 P. Thollander, et. Al., ”Optimisation as investment decision support in a Swedish medium-sized iron foundry – a move beyond traditional energy auditing”, Applied Energy 86 (2009), p433 62 EC Directive 2002/96/EC of the European Parliament and of the Council of 27 January 2003 on waste electrical and electronic equipment (WEEE).
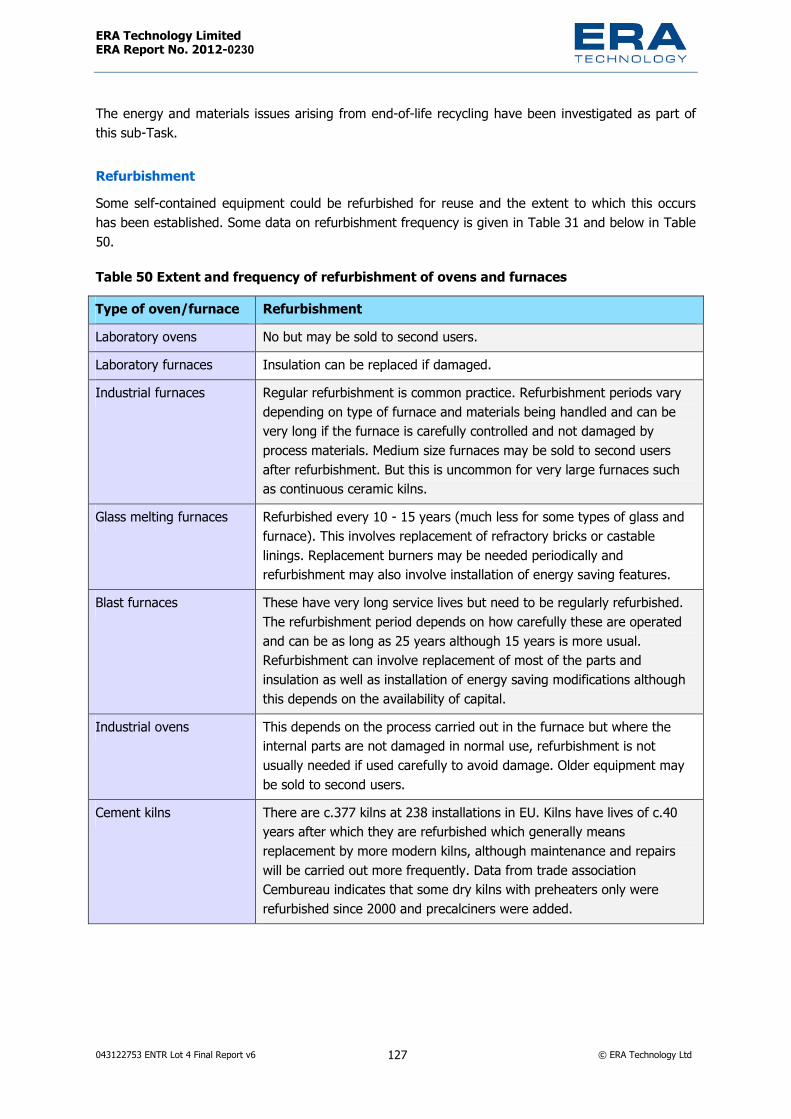
ERA Technology Limited ERA Report No. 2012-0230
043122753 ENTR Lot 4 Final Report v6 127 © ERA Technology Ltd
The energy and materials issues arising from end-of-life recycling have been investigated as part of this sub-Task.
Refurbishment Some self-contained equipment could be refurbished for reuse and the extent to which this occurs has been established. Some data on refurbishment frequency is given in Table 31 and below in Table 50.
Table 50 Extent and frequency of refurbishment of ovens and furnaces Type of oven/furnace Refurbishment Laboratory ovens No but may be sold to second users. Laboratory furnaces Insulation can be replaced if damaged. Industrial furnaces Regular refurbishment is common practice. Refurbishment periods vary
depending on type of furnace and materials being handled and can be very long if the furnace is carefully controlled and not damaged by process materials. Medium size furnaces may be sold to second users after refurbishment. But this is uncommon for very large furnaces such as continuous ceramic kilns.
Glass melting furnaces Refurbished every 10 - 15 years (much less for some types of glass and furnace). This involves replacement of refractory bricks or castable linings. Replacement burners may be needed periodically and refurbishment may also involve installation of energy saving features.
Blast furnaces These have very long service lives but need to be regularly refurbished. The refurbishment period depends on how carefully these are operated and can be as long as 25 years although 15 years is more usual. Refurbishment can involve replacement of most of the parts and insulation as well as installation of energy saving modifications although this depends on the availability of capital.
Industrial ovens This depends on the process carried out in the furnace but where the internal parts are not damaged in normal use, refurbishment is not usually needed if used carefully to avoid damage. Older equipment may be sold to second users.
Cement kilns There are c.377 kilns at 238 installations in EU. Kilns have lives of c.40 years after which they are refurbished which generally means replacement by more modern kilns, although maintenance and repairs will be carried out more frequently. Data from trade association Cembureau indicates that some dry kilns with preheaters only were refurbished since 2000 and precalciners were added.

ERA Technology Limited ERA Report No. 2012-0230
043122753 ENTR Lot 4 Final Report v6 128 © ERA Technology Ltd
4. Task 4 – Assessment of Base Cases As there are such a large variety of furnaces and ovens in the EU, it is not possible to use the standard base case assessment approach as detailed in the conventional MEEuP methodology, and so an alternative is being used. In order to collect data and assess environmental impacts, the market is divided into three segments: large-size industrial, small and medium-size industrial, and laboratory. This does not mean that eco-design requirements need to be different for these three classifications; Different classifications can be used for policy options. Data from tasks 4, 5 and 6 will need to provide the data to support policy options in Task 7.
4.1. Approach specific to ENTR Lot 4 As furnaces and ovens are very diverse and many are custom designs, it is not possible to use the standard EuP EcoReport approach for base case assessment of all types of furnace and oven and so a different approach will be used to obtain the data needed for calculation of improvement potential. Three size ranges have been selected and a different approach will be used for each. These are:
Table 51. Size classifications used for base case assessment Size range Products included Base case approach Laboratory Ovens <750 litres
Furnaces <120 litres Standard MEEUP EcoReport tool for a representative oven
Small and medium-size industrial
Larger than laboratory and: Batch <10 tonnes capacity Continuous <20 tonnes / day
Consist of standard and custom designs. As custom designs are unsuitable for base case assessment, MEEuP has been used for standard designs but with estimated energy consumption
Large and very large industrial
Batch >10 tonnes capacity Continuous >20 tonnes / day
These are too complex for the standard approach so two examples have been used to determine the most significant impacts, using real BOM but weighted average energy consumption
The EU IED and ETS use capacity in tonnes per day, and power capacity, respectively, to define which installations are in scope, but these are not equivalent. Therefore, the IED minimum values that are used for several process types have also been used in Table 51 to differentiate medium and large industrial sizes of furnaces and ovens.
Classification by size can be misleading because it depends on the mass of product heated in the furnace or oven. A good illustrative example is a continuous wire heat treatment furnace. One size of furnace can treat 800kg/h of semi-conductor sawing wire (19t/day so “medium”) or up to 4 tonnes per hour of steel rope (48 t/day, so “large”). To overcome this issue, throughput should be the maximum possible throughput irrespective of the amount of material that is heated.

ERA Technology Limited ERA Report No. 2012-0230
043122753 ENTR Lot 4 Final Report v6 129 © ERA Technology Ltd
Industrial and laboratory furnaces and ovens are being considered as the three size classifications in Table 51. The approaches used for each of these three size classifications are described here and the main component parts, materials and “consumables” (e.g. energy) that are applicable to the base cases are discussed below for the production, distribution, use and end of life phases. Task 4 identifies the main environmental impacts although it was expected that energy consumption in the use phase will be the most significant. Due to the extremely broad variety of furnaces and ovens on the EU market, determining total consumption will be very difficult and so the following approaches will be used:
• Large furnaces and ovens - some data is available in IPPC BREF guidance which will give an indication of current consumption;
• By sector – IPPC BREF guides give typical energy consumption per tonne of products and the quantity of many of these products made in the EU is also published and so sectoral energy consumption can be calculated;
• Data from manufacturers – a few manufacturers have provided typical or average energy consumption data for several types of large furnace and ovens. EU totals can be calculated where the numbers of these types in stock are also known;
• Small and medium industrial – this is the most difficult classification as most of these are outside scope of the IPPC BREF guidance and the energy consumption of individual furnaces and ovens varies enormously depending on: - Power capacity - Process being carried out - How frequently it is used - Type of furnace / oven;
• Estimated total energy consumption will be calculated from average power capacity, numbers in stock and sales, average power utilisation factor (average energy consumption when in use) and use factor (hours / day in use). This will give a result that can be compared with estimates made from base case calculations. Adjustment will be made as necessary to the average EU energy consumption indicated as input into Ecotool for the base case calculations;
• Base case calculations for small and medium industrial – by selecting representative designs and use of the stock and sales levels provided by stakeholders, an EU27 total energy consumption will be calculated;
• Base case calculations for large industrial – due to the huge variation in energy consumption, it was necessary to calculate the average EU energy consumption of large furnaces and large ovens to input into Ecotool. This inevitably gives an energy consumption result that is comparable with the total obtained from other sources of data;
• Laboratory – stakeholders have provided useful data on sales, stocks and the power capacity of the most commonly sold laboratory ovens and furnaces. The energy consumption in use was estimated based on input from stakeholders so that an EU total could be calculated in base case 1.

ERA Technology Limited ERA Report No. 2012-0230
043122753 ENTR Lot 4 Final Report v6 130 © ERA Technology Ltd
4.1.1 Base Case 1: Laboratory Ovens and Furnaces While there are many different laboratory-scale ovens and furnaces the majority are near-square or rectangular shape heated cavities. They are mostly standard designs intended for research and testing and so the standard methodology of selecting a product representative of the product group is applicable. Laboratory ovens have been selected as a base case because these have the largest improvement potential as shown below:
Table 52. Stocks, sales, average energy consumption, estimated improvement potential of laboratory equipment Type Stock 2008
Sales Typical use (hours/day &days/year)
Average annual energy consumption
Estimated improvement potential %
Improvement potential TWh/yr (assumes all stock replaced)
Lab Oven 400,000 25,000 5000 h/yr 0.9 KW x 3 x 5000 = 13.5 MWh
10 – 20% 1.3 – 2.6
Lab Furnace 140,000 9,000 1000 h/yr 1.2 KW x 3 x 1000 = 3.6 MWh
10 – 20% 0.05 – 0.1
Incubator 225,000 15,000 Continuous = 8760 h/yr
0.07 KW x 2 x 8760 = 1.2 MWh
5% 0.014
Analytical instruments
170,000 (10 times 2007 sales)
17,000 (2007 sales)
2000 h/yr 3.6 MWh 5% 0.03
Lab sterilizer Total estimated at 100,000 Lab steam sterilizers = 10,000
Total estimated at 7000 Lab steam sterilizers = 580
Lab = 2000 h/yr
Lab = 2.52 MWh (from manufacturer)
5% 0.01
The actual energy consumption of laboratory ovens and furnaces is not known and so has been estimated as follows: First multiply the energy consumption to maintain the maximum temperature when empty of the most popular size by 1.2 because the average size is slightly larger than the most popular size (which is one of the smallest sizes, e.g. empty oven consumes 0.75kW x 1.2. = 0.9). The average annual energy consumption is calculated by multiplying the energy consumption of the average empty oven by 3 to calculate actual energy consumption to include the energy needed to heat up the oven / furnace and its contents. The multiple of 3x is an estimate as there is almost no real data of actual energy consumption available. However, this multiple assumes that in addition to the energy needed to maintain the temperature of the empty oven (0.9kWh/h), there is additional energy to raise the temperature from ambient to the operating temperature of the oven itself and the materials that are being processed.
The mass of materials processed in laboratory ovens will vary considerable, although the mass of materials heated is usually not very large and tends to be of a similar order of the mass of the oven’s insulation and internal parts. A small laboratory oven contains about 3kg of steel plus insulation which are heated. A typical load could be a glass or ceramic containers with wet material to be dried and
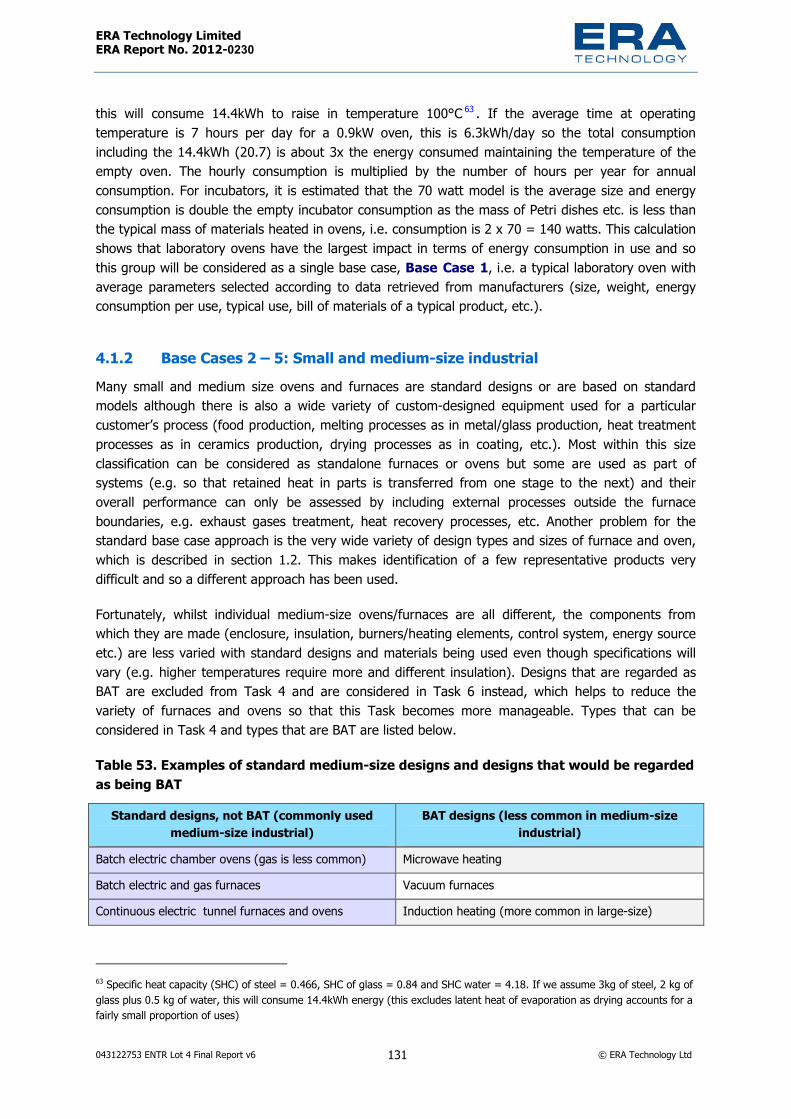
ERA Technology Limited ERA Report No. 2012-0230
043122753 ENTR Lot 4 Final Report v6 131 © ERA Technology Ltd
this will consume 14.4kWh to raise in temperature 100°C 63 . If the average time at operating temperature is 7 hours per day for a 0.9kW oven, this is 6.3kWh/day so the total consumption including the 14.4kWh (20.7) is about 3x the energy consumed maintaining the temperature of the empty oven. The hourly consumption is multiplied by the number of hours per year for annual consumption. For incubators, it is estimated that the 70 watt model is the average size and energy consumption is double the empty incubator consumption as the mass of Petri dishes etc. is less than the typical mass of materials heated in ovens, i.e. consumption is 2 x 70 = 140 watts. This calculation shows that laboratory ovens have the largest impact in terms of energy consumption in use and so this group will be considered as a single base case, Base Case 1, i.e. a typical laboratory oven with average parameters selected according to data retrieved from manufacturers (size, weight, energy consumption per use, typical use, bill of materials of a typical product, etc.).
4.1.2 Base Cases 2 – 5: Small and medium-size industrial Many small and medium size ovens and furnaces are standard designs or are based on standard models although there is also a wide variety of custom-designed equipment used for a particular customer’s process (food production, melting processes as in metal/glass production, heat treatment processes as in ceramics production, drying processes as in coating, etc.). Most within this size classification can be considered as standalone furnaces or ovens but some are used as part of systems (e.g. so that retained heat in parts is transferred from one stage to the next) and their overall performance can only be assessed by including external processes outside the furnace boundaries, e.g. exhaust gases treatment, heat recovery processes, etc. Another problem for the standard base case approach is the very wide variety of design types and sizes of furnace and oven, which is described in section 1.2. This makes identification of a few representative products very difficult and so a different approach has been used.
Fortunately, whilst individual medium-size ovens/furnaces are all different, the components from which they are made (enclosure, insulation, burners/heating elements, control system, energy source etc.) are less varied with standard designs and materials being used even though specifications will vary (e.g. higher temperatures require more and different insulation). Designs that are regarded as BAT are excluded from Task 4 and are considered in Task 6 instead, which helps to reduce the variety of furnaces and ovens so that this Task becomes more manageable. Types that can be considered in Task 4 and types that are BAT are listed below.
Table 53. Examples of standard medium-size designs and designs that would be regarded as being BAT
Standard designs, not BAT (commonly used medium-size industrial)
BAT designs (less common in medium-size industrial)
Batch electric chamber ovens (gas is less common) Microwave heating Batch electric and gas furnaces Vacuum furnaces Continuous electric tunnel furnaces and ovens Induction heating (more common in large-size)
63 Specific heat capacity (SHC) of steel = 0.466, SHC of glass = 0.84 and SHC water = 4.18. If we assume 3kg of steel, 2 kg of glass plus 0.5 kg of water, this will consume 14.4kWh energy (this excludes latent heat of evaporation as drying accounts for a fairly small proportion of uses)

ERA Technology Limited ERA Report No. 2012-0230
043122753 ENTR Lot 4 Final Report v6 132 © ERA Technology Ltd
Standard designs, not BAT (commonly used medium-size industrial)
BAT designs (less common in medium-size industrial)
Continuous gas tunnel furnaces Regenerative and recuperative burners (uncommon in medium-size but common in large)
Batch gas and electric furnaces and ovens with bogey hearths (movable floor on wheels)
Heat exchangers to recover heat (very uncommon in medium-size but more common in large)
Retort furnaces (parts inserted into heating chamber inside the retort)
Infrared heating (used in all sizes)
Electric resistance heating (nichrome, Kanthal, etc.) Plasma heating (used only for large throughput processes)
Cold and warm (<200°C) air gas burners Microporous thermal insulation (used in all sizes of furnace)
Base cases for small and medium size industrial furnaces and ovens have been calculated using the method shown below. Base case furnaces and ovens were selected which use the most common heat sources (electric and gas) and common types of insulation. Heat recovery was considered but is seldom used in smaller furnaces and ovens. Continuous furnaces and ovens will have conveyers of some sort.
Heat sources – The most common types used in this size classification are electric resistance heating and gas burners without recuperators or regenerators.
Insulation – The most commonly used type or types of insulation should be considered for base cases although a variety of materials are used. Note that none of these insulation materials are included as “material icons” in the standard MEEUP EcoReport. Data for the selected materials could to be added to the EcoReport to calculate environmental impacts but this has not been done for the calculations given below. Insulation itself consumes energy in the use phase and the type and material chosen would have an impact on the energy consumed by the heat source (i.e. better insulation reduces energy consumption) as well as having an impact in the production phase. The quantity of structural steelwork required depends on the weight of insulation plus the weight of materials being processed and this is very variable.
Heat recovery – Representative small and medium-size furnaces and ovens have been selected as base cases, but do not use heat recovery, as this is very uncommon with this size range. Many methods of heat recovery are used with large furnaces, but heat recovery is much less common in medium-size furnaces. Heat recovery would influence energy consumption in the use phase by the heat source but representative medium-size furnaces and ovens rarely utilize heat recovery. The only exception is metal melting furnaces where recuperative burners may be used, but these were not selected as base cases.
Movement – Only used by continuous processes and will influence energy consumed in the use phase because continuous processes tend to consume less energy per tonne product than equivalent batch processes.
Energy consumption – Estimating energy consumption for small and medium size industrial furnaces and ovens is extremely difficult because it is process dependent (as explained above). Even if standard designs of furnace and oven are chosen for base cases, the annual energy consumption

ERA Technology Limited ERA Report No. 2012-0230
043122753 ENTR Lot 4 Final Report v6 133 © ERA Technology Ltd
depends on how often they are used, and this can vary from very infrequent with small loads to continuous use with very large loads. The possible energy consumption range for each design is very large and there are also many different designs. The energy consumption values used for base cases were based on the power ratings of the most common types of furnace and oven, assuming typical usage patterns and this is described below.
Selection of representative base cases BC 2 – 5 has required the following assumptions:
Assumptions for small / medium industrial base cases
Furnaces and ovens will be produced as standard designs only if they are sold in significant numbers. The average size will be the middle of the range of standard model sizes although this may not be the most common size sold. As far as possible, base case calculations will take the most common size sold into account, in order to give a representative image of the market The most common types of ovens and furnaces are “box” types that are used for a wide variety of processes such as metals heat treatment, drying and curing coatings, etc. The sizes and designs of furnaces and ovens that were chosen for base cases were based on designs in manufacturers’ catalogues, especially from manufacturers with a significant market share in the EU of small and medium industrial furnaces and ovens(both gas and electric heating) such as Nabertherm and Linn High Therm although designs from several other manufacturers were considered. Power ratings used were average values of all small and medium-size industrial furnaces and ovens described in Table 28 (batch bakery ovens excluded).
Representative medium-size batch oven – the following size, design and performance characteristics were chosen based on typical designs in manufacturers catalogues
Maximum temperature 450°C (oven) Capacity 4000 litres Inner dimensions (mm) 2200 x 1500 x 1200 Outer dimensions (mm) 3080 x 2410 x 1800 Power rating 66KW Other information Mineral wool insulation and internally 314 Stainless steel sheet
Representative batch chamber furnace – the following size, design and performance characteristics were chosen based on typical designs in manufacturers catalogues
Maximum temperature 1280°C (furnace) Capacity 5000 litres Inner dimensions (mm) 1000 x 3600 x 1400 Outer dimensions (mm) 1670 x 4400 x 2520 Power rating 253 KW Other information Insulation: inner lightweight refractory bricks, outer layer microporous silica

ERA Technology Limited ERA Report No. 2012-0230
043122753 ENTR Lot 4 Final Report v6 134 © ERA Technology Ltd
Representative continuous oven – the following size, design and performance characteristics were chosen based on typical designs in manufacturers catalogues
Maximum temperature 450°C (oven) Capacity 10,000 litres Power rating 66 KW Other information HTIW insulation
Representative continuous “belt” furnace – the following size, design and performance characteristics were chosen based on typical designs in manufacturers catalogues
Maximum temperature 1200 (furnace) Capacity 150 litres Power rating 253 KW Other information Use HTIW and microporous plate insulation
In conclusion therefore, representative sizes are:
• Medium batch oven - c.4,000 l capacity • Medium batch furnace - c. 4,000 l capacity • Medium continuous ovens - c. 10,000 l internal volume • Medium continuous furnace - c. 150 l internal volume. The types of insulation used for the base cases comprised the following:
Ovens – mineral wool ceramic fibre + 314 stainless steel sheet. Mineral wool thickness typically 30 – 60 mm. Lowest quality ovens use fibre-board
Furnaces – outer mild steel (painted), various refractory and insulation materials used including castable cement types. Some have more than one layer, e.g. castable cement + HTIW or HTIW plus lightweight refractory bricks, etc.
Examples of furnaces and ovens represented by BC2 – 5 can be viewed on websites of manufacturers such as Nabertherm, Linn High Therm 64 , Solo Swiss 65 and many others. These base cases are believed to representative of at least 80% of small and medium-size industrial furnaces and ovens in terms of the materials used for construction, which are predominantly steel, and also various types of thermal insulation. Exceptions where very different proportions and types of materials are used include vacuum furnaces, spray driers and other more unusual designs. As can be seen from manufacturers’ websites, there is a large amount of variation in designs. As a result, also regarding 64 http://www.linn-high-therm.de/industrial-furnaces.html 65 http://www.soloswiss.com/products/index.html
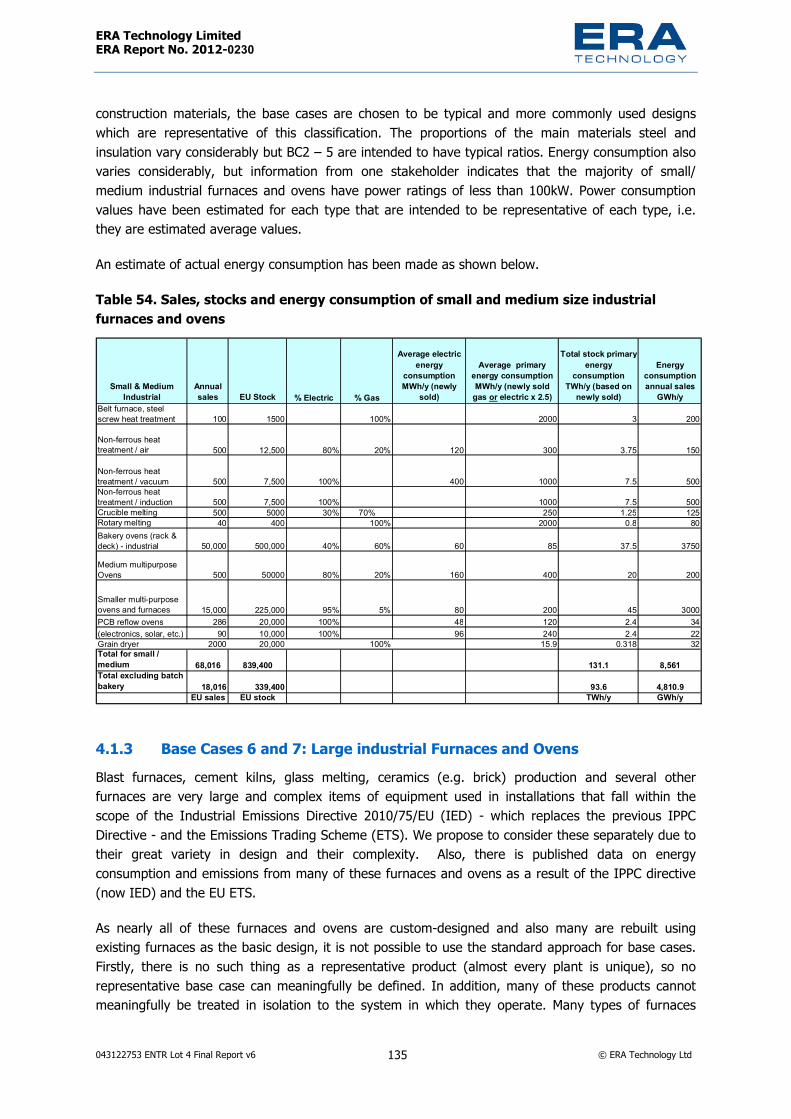
ERA Technology Limited ERA Report No. 2012-0230
043122753 ENTR Lot 4 Final Report v6 135 © ERA Technology Ltd
construction materials, the base cases are chosen to be typical and more commonly used designs which are representative of this classification. The proportions of the main materials steel and insulation vary considerably but BC2 – 5 are intended to have typical ratios. Energy consumption also varies considerably, but information from one stakeholder indicates that the majority of small/ medium industrial furnaces and ovens have power ratings of less than 100kW. Power consumption values have been estimated for each type that are intended to be representative of each type, i.e. they are estimated average values.
An estimate of actual energy consumption has been made as shown below.
Table 54. Sales, stocks and energy consumption of small and medium size industrial furnaces and ovens
Small & Medium Industrial
Annual sales EU Stock % Electric % Gas
Average electric energy
consumption MWh/y (newly
sold)
Average primary energy consumption MWh/y (newly sold
gas or electric x 2.5)
Total stock primary energy
consumption TWh/y (based on
newly sold)
Energy consumption annual sales
GWh/yBelt furnace, steel screw heat treatment 100 1500 100% 2000 3 200
Non-ferrous heat treatment / air 500 12,500 80% 20% 120 300 3.75 150
Non-ferrous heat treatment / vacuum 500 7,500 100% 400 1000 7.5 500Non-ferrous heat treatment / induction 500 7,500 100% 1000 7.5 500Crucible melting 500 5000 30% 70% 250 1.25 125Rotary melting 40 400 100% 2000 0.8 80Bakery ovens (rack & deck) - industrial 50,000 500,000 40% 60% 60 85 37.5 3750Medium multipurpose Ovens 500 50000 80% 20% 160 400 20 200
Smaller multi-purpose ovens and furnaces 15,000 225,000 95% 5% 80 200 45 3000PCB reflow ovens 286 20,000 100% 48 120 2.4 34(electronics, solar, etc.) 90 10,000 100% 96 240 2.4 22Grain dryer 2000 20,000 100% 15.9 0.318 32Total for small / medium 68,016 839,400 131.1 8,561Total excluding batch bakery 18,016 339,400 93.6 4,810.9
EU sales EU stock TWh/y GWh/y
4.1.3 Base Cases 6 and 7: Large industrial Furnaces and Ovens Blast furnaces, cement kilns, glass melting, ceramics (e.g. brick) production and several other furnaces are very large and complex items of equipment used in installations that fall within the scope of the Industrial Emissions Directive 2010/75/EU (IED) - which replaces the previous IPPC Directive - and the Emissions Trading Scheme (ETS). We propose to consider these separately due to their great variety in design and their complexity. Also, there is published data on energy consumption and emissions from many of these furnaces and ovens as a result of the IPPC directive (now IED) and the EU ETS.
As nearly all of these furnaces and ovens are custom-designed and also many are rebuilt using existing furnaces as the basic design, it is not possible to use the standard approach for base cases. Firstly, there is no such thing as a representative product (almost every plant is unique), so no representative base case can meaningfully be defined. In addition, many of these products cannot meaningfully be treated in isolation to the system in which they operate. Many types of furnaces

ERA Technology Limited ERA Report No. 2012-0230
043122753 ENTR Lot 4 Final Report v6 136 © ERA Technology Ltd
including blast furnaces and cement kilns may appear to be relatively inefficient when considered in isolation but this neglects the fact that much of the energy that is apparently “lost” is actually used in other parts of the production process such that overall the system efficiency can be very high.
The potential for improvement was initially estimated in Task 1 to be significant: perhaps 100 TWh/y by 2050 (although this could be an over-estimate). However, it is anticipated that relatively few new products will be sold in the EU between now and 2020 as furnace and oven lives are very long (some are over 100 years old) although many will be refurbished or rebuilt, and this will result in more energy efficient processes.
Since relatively few new ovens/furnaces in this category are expected to be built, for ecodesign measures to have any impact such measures must include full refurbishment, i.e. changing insulation, burners, controls etc., and exclude simple repairs such as relining of furnaces. Refurbishment costs can be, to take the example of steel production furnaces, from a few tens to several hundreds of millions of Euros. The amount spent, and the extent of refurbishment, will vary from plant to plant, each of which is different. In addition, the boundaries of what should be considered a refurbishment (replacement/maintenance of one or more components; changes in the furnace capacity/performance greater than 10%/20%/50% of a baseline, etc.) are difficult to establish and would probably need to be considered on a case-by-case basis.
Therefore the approach that will be used for these products is to carry out in Tasks 4 and 5 a technical analysis to compare standard furnace and oven design technology with the best available techniques. This is carried out by examination of the main sectors as the energy efficiency and improvement potential of the sectors that use large furnaces will vary.
Rather than consider how much energy is consumed, it is possible to investigate the main sources of heat loss as a means of determining the scope for environmental improvement. By targeting the main sources of heat losses, this will provide options for eco-design measures based on regulating the designs that affect heat loss, such as the temperature of undiluted vented combustion gas, external wall temperature, etc. This approach will determine whether furnaces currently being built and rebuilt could be more energy efficient, and if so at what cost. Also, this Task will also provide the critical data on the best refurbishment practices and barriers to their implementation.
Base case assessment of large and very large furnaces and ovens is required as part of this study. However due to the very large variety and complexity, this is not possible with any accuracy except to determine whether the energy consumption in the use phase is the most significant environmental impact and so this has been carried out with one example of a furnace and one example of an oven, but using weighted average energy consumption values for ovens and furnaces, rather than the actual values of the two examples selected for their Bills of Materials (BOMs). This is necessary because of the difficulty with selecting representative examples. In fact, preliminary calculations using the very high energy consumption values of these two example furnaces and ovens lead to total EU energy consumption values which are unrealistically high. Further investigation will follow in later Tasks to assess the main performance parameters that relate to energy losses. The output from base case assessment of large furnaces will be:
• An estimate of energy consumption, energy efficiency and main heat losses for the main types of new or newly rebuilt furnaces and ovens in the industry sectors that have high total energy consumption, i.e. steel, cement and lime, glass, ceramics, etc.
ERA Technology Limited ERA Report No. 2012-0230
043122753 ENTR Lot 4 Final Report v6 137 © ERA Technology Ltd
• An estimate of any other environmental impacts from large furnaces due to the furnaces themselves but excluding intentional and unavoidable process-specific emissions (since these are already regulated by IPPC / IED)
Manufacturers claim that all new large-size furnaces built in the EU are "BAT" (Best Available Technology(ies)) as defined by IPPC/ IED, and so, by definition, must take costs into account. However, BAT for eco-design studies is defined irrespective of cost (costs are incorporated at a discrete, later stage, to examine the feasibility of regulatory, etc options), and hence its basis differs fundamentally. Due to financial constraints, new furnaces and ovens are not always as energy efficient as possible. Note that financial issues are considered in later Tasks, within this report. The designs of large furnaces and ovens that are currently being installed in the EU is described in Task 4, and this will include some designs which are BAT, as defined by IPPC/ IED. Task 4 will examine the overall design and the design of components such as burners, insulation, etc. Tasks 5 and 6 will determine the improvement potential for each design option, and for each main type of furnace in each main sector. Each eco-design option will be subsequently quantitatively assessed to determine the impact on EU energy consumption, but it will also be necessary to determine how these improvements can be achieved by policy options. This will be explored in Task 7; however, a few preliminary ideas have been considered, which are briefly outlined below:
• For example, imposing limits based on the characteristics of large furnaces may be appropriate as is already used in Japan.
• Defining a maximum energy consumption per tonne of product would be another option to consider, but this would probably be too complicated for an eco-design measure, as there are many thousands of different processes;. Some processes use more than one type of furnace, because the optimum energy consumption depends on variables such as throughput of materials. Another policy option is to use these results to feed into other instruments such as revisions of IPPC/ IED BREFs. These and other policy options will be studied in detail, in Task 7.
Representative energy consumption values given below are calculated using data in IPPC BREF guides, together with data provided by stakeholders, and a few of our own estimates where none was available.

ERA Technology Limited ERA Report No. 2012-0230
043122753 ENTR Lot 4 Final Report v6 138 © ERA Technology Ltd
Table 55. Data used for calculation of average large furnace and oven energy consumption
SectorAnnual Sales EU Stock
Proportion Electric
Proportion fossil fuel
Average primary energy consumption MWh/y (newly sold gas or electric x 2.5)
Total stock energy consumption TWh/y (based on newly sold)
Energy consumption annual sales GWh/y
Cement 2 377 100% 735,000 277 1,470Lime 1.2 600 100% 50,000 30 60Steel production except electric arc 0 329 100% 389Electric arc (steel) 1 209 100% 215,311 45 215Container glass melting 25 300 100% 53,333 16 1,333Flat glass melting 0 58 100% 220,690 12.8 0Glass wool & domestic 25 270 100% 29,630 8 741Other glass 15 200 100% 135000 27 2,025Brick & roof tile 10 750 100% 35,378 27 354Ceramic tiles & sanitary ware, 10 900 100% 28,889 26 289Other ceramic 4 400 100% 25,000 10Oil refinery 45 1800 100% 50,000 90 2,250Large heat treatment 80 1500 100% 20,000 30 1,600Steel re-heating 100 2000 100% 50000 100 5,000WtE incinerators 10 903 n/a n/a 5,500 5 55Metal smelting and melting 10 400 5% 95% 17,500 7 175Other large furnaces (estimated) 10 200 10000 2 100Furnace totals 348 11,196 1,101 15,667
Brick & roof tile 10 750 100% 17,687 13 177Ceramic tiles & sanitary ware, 10 900 100% 14,444 13 144Bakery - bread 30 700 100% 17,000 11.9 510Bakery biscuits 6 500 100% 14,000 7 84Others (estimated) 10 200 10000 2 100Oven totals 66 3050 73,131 47 1,015Total consumption 414 14,246 1,148 16,682
TWh/y GWh/y
Primary energy consumption
Furnaces (>450°°°°C)
Ovens
Most of the stock energy consumption figures in this table are calculated from published annual EU production quantities and typical energy consumption per tonne from IPPC BREFs. Average energy consumption of each type of furnace or oven is either calculated from this figure and the number in stock or has been provided by stakeholders. Some further explanation of the sources of data is also given in Table 26 and in the Appendix C. As energy consumption data in BREF guides and from stakeholders tends to be for furnaces that are BAT (as defined by IPPC), they under-estimate actual energy consumption of the stock of furnaces and ovens in the EU, as there are many older furnaces and ovens that have not been replaced or refurbished. Therefore, an estimate of the actual EU energy consumption assuming that EU furnaces and ovens have an average date of installation of c.1996 (i.e. 16 years ago) and so on average will consume c. 10% – 20% more energy. Based on the data in the above table, the average energy consumption of a new basecase furnaces and ovens are:
• Furnace = c.98,340 MWh/y, of which there are 348 sales per year and EU stock of 11,196. Note that is relatively high because a small number of very large furnaces including cement kilns and blast furnaces are included in the calculation of this average value. Many “large-size” furnaces will consume less energy per year.
• Ovens = 15,410 MWh/y of which there are 66 sales per year and EU stock of 3050.
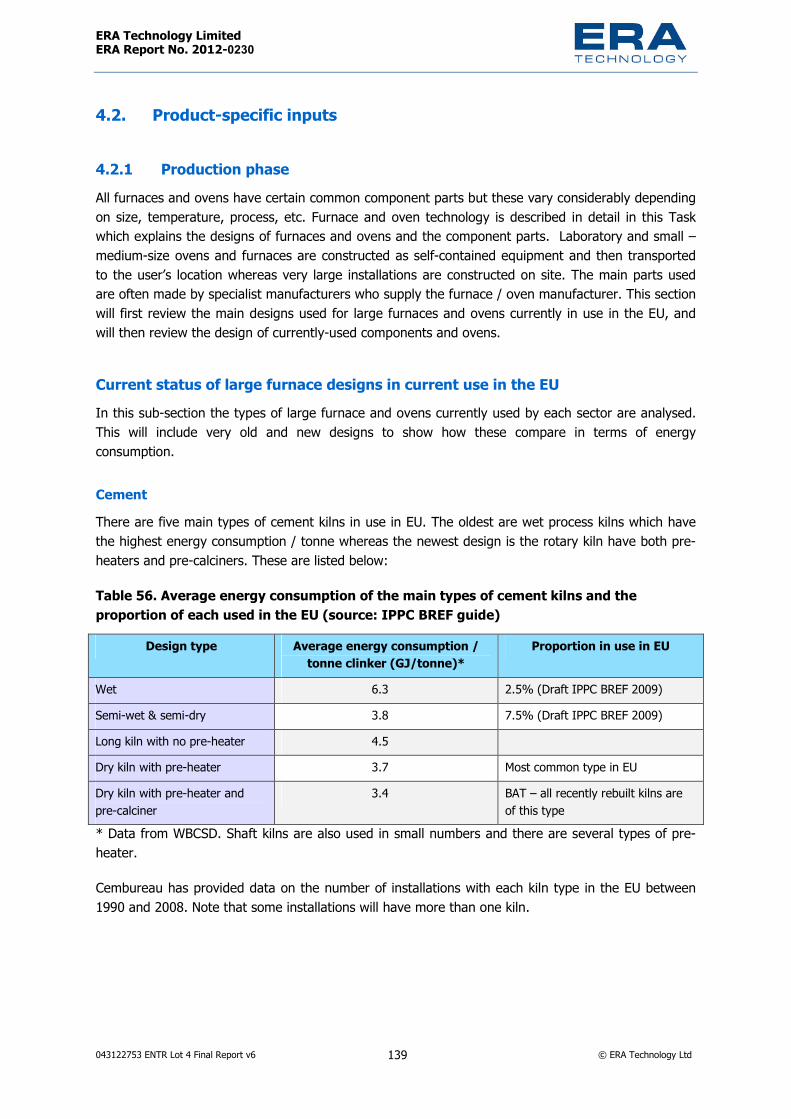
ERA Technology Limited ERA Report No. 2012-0230
043122753 ENTR Lot 4 Final Report v6 139 © ERA Technology Ltd
4.2. Product-specific inputs
4.2.1 Production phase All furnaces and ovens have certain common component parts but these vary considerably depending on size, temperature, process, etc. Furnace and oven technology is described in detail in this Task which explains the designs of furnaces and ovens and the component parts. Laboratory and small – medium-size ovens and furnaces are constructed as self-contained equipment and then transported to the user’s location whereas very large installations are constructed on site. The main parts used are often made by specialist manufacturers who supply the furnace / oven manufacturer. This section will first review the main designs used for large furnaces and ovens currently in use in the EU, and will then review the design of currently-used components and ovens.
Current status of large furnace designs in current use in the EU In this sub-section the types of large furnace and ovens currently used by each sector are analysed. This will include very old and new designs to show how these compare in terms of energy consumption.
Cement There are five main types of cement kilns in use in EU. The oldest are wet process kilns which have the highest energy consumption / tonne whereas the newest design is the rotary kiln have both pre-heaters and pre-calciners. These are listed below:
Table 56. Average energy consumption of the main types of cement kilns and the proportion of each used in the EU (source: IPPC BREF guide)
Design type Average energy consumption / tonne clinker (GJ/tonne)*
Proportion in use in EU
Wet 6.3 2.5% (Draft IPPC BREF 2009) Semi-wet & semi-dry 3.8 7.5% (Draft IPPC BREF 2009) Long kiln with no pre-heater 4.5 Dry kiln with pre-heater 3.7 Most common type in EU Dry kiln with pre-heater and pre-calciner
3.4 BAT – all recently rebuilt kilns are of this type
* Data from WBCSD. Shaft kilns are also used in small numbers and there are several types of pre-heater.
Cembureau has provided data on the number of installations with each kiln type in the EU between 1990 and 2008. Note that some installations will have more than one kiln.
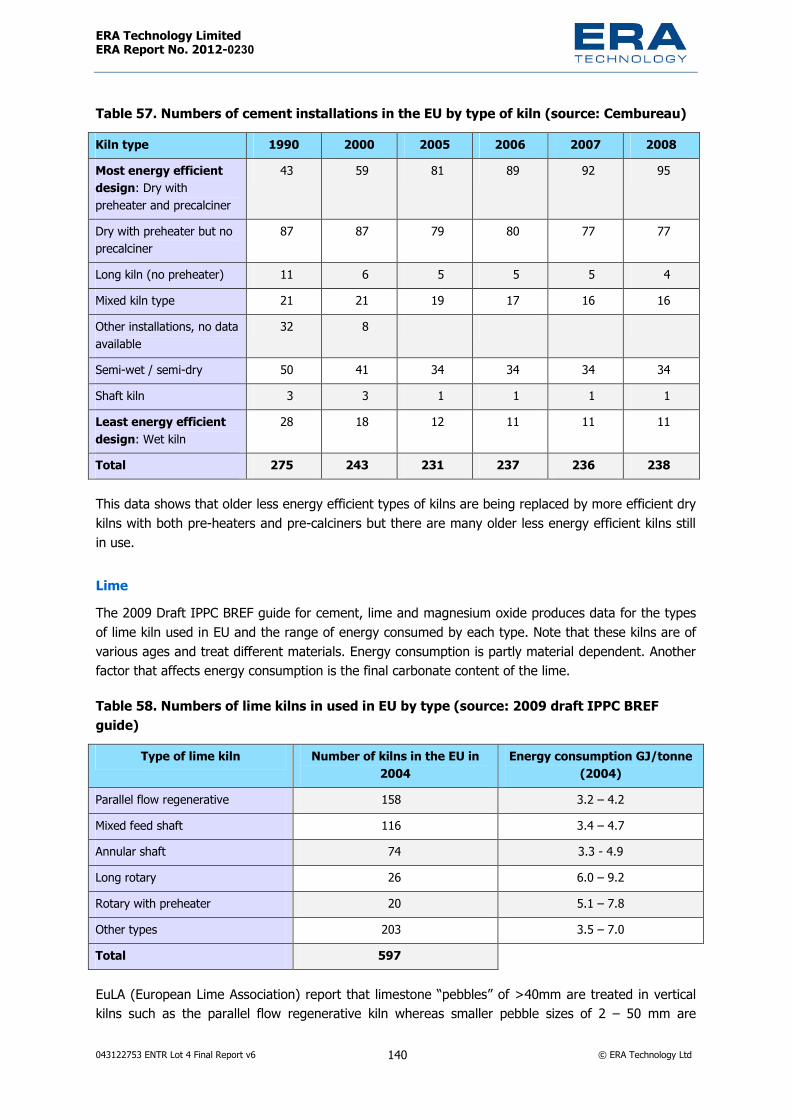
ERA Technology Limited ERA Report No. 2012-0230
043122753 ENTR Lot 4 Final Report v6 140 © ERA Technology Ltd
Table 57. Numbers of cement installations in the EU by type of kiln (source: Cembureau) Kiln type 1990 2000 2005 2006 2007 2008 Most energy efficient design: Dry with preheater and precalciner
43 59 81 89 92 95
Dry with preheater but no precalciner
87 87 79 80 77 77
Long kiln (no preheater) 11 6 5 5 5 4Mixed kiln type 21 21 19 17 16 16 Other installations, no data available
32 8
Semi-wet / semi-dry 50 41 34 34 34 34 Shaft kiln 3 3 1 1 1 1Least energy efficient design: Wet kiln
28 18 12 11 11 11
Total 275 243 231 237 236 238
This data shows that older less energy efficient types of kilns are being replaced by more efficient dry kilns with both pre-heaters and pre-calciners but there are many older less energy efficient kilns still in use.
Lime The 2009 Draft IPPC BREF guide for cement, lime and magnesium oxide produces data for the types of lime kiln used in EU and the range of energy consumed by each type. Note that these kilns are of various ages and treat different materials. Energy consumption is partly material dependent. Another factor that affects energy consumption is the final carbonate content of the lime.
Table 58. Numbers of lime kilns in used in EU by type (source: 2009 draft IPPC BREF guide)
Type of lime kiln Number of kilns in the EU in 2004
Energy consumption GJ/tonne (2004)
Parallel flow regenerative 158 3.2 – 4.2 Mixed feed shaft 116 3.4 – 4.7 Annular shaft 74 3.3 - 4.9 Long rotary 26 6.0 – 9.2 Rotary with preheater 20 5.1 – 7.8 Other types 203 3.5 – 7.0 Total 597
EuLA (European Lime Association) report that limestone “pebbles” of >40mm are treated in vertical kilns such as the parallel flow regenerative kiln whereas smaller pebble sizes of 2 – 50 mm are

ERA Technology Limited ERA Report No. 2012-0230
043122753 ENTR Lot 4 Final Report v6 141 © ERA Technology Ltd
treated in horizontal kilns which are similar in design to cement kilns but for lime production consume on average more energy per tonne than vertical lime kilns. Average energy consumption for the best performing 10% of horizontal and vertical kilns in the EU are:
Parallel flow regenerative 3.47 GJ/tonne
Horizontal kilns 5.37 GJ/tonne
All new lime kilns installed in EU are parallel flow regenerative because these are the most energy efficient although they cannot be used if only small “pebble” size limestone is available as is the case in some parts of Europe. Some existing horizontal kilns have been refurbished in the EU, but they cannot achieve the same energy efficiency as a new vertical kiln. Very old kilns are more likely to be replaced by a new parallel flow regenerative kiln, where the cost of a new installation is justified by the energy saving66.
Glass There are five main types of furnace used in EU for melting glass. These are difficult to compare as each type is used predominantly for different types of glass product and different amounts of scrap (cullet) are used (scrap requires less energy to melt than virgin raw materials). These types of furnace are summarised below:
Table 59. Numbers and types of glass melting furnaces of >20 tonnes per day (all types of glass). (Source: draft IPPC BREF 2009) Glass melting furnace type
No. in EU in 2005 of >20 tonnes/day
(average tonnes/day)
Comments
End fired regenerative
225 (196) Medium to large scale continuous glass melting, >100 tonnes/day.
Cross-fired regenerative
145 (384) Largest scale continuous melting, always used in >500 tonnes/day.
Recuperative 120 (75) Medium size continuous melting. Oxy-fuel fired 35 (125) Smaller-scale continuous production, usually <100
tonnes/day. Electrically heated
43 (51) Smaller-scale continuous production. Process started with fossil fuels the electric resistance heaters used in molten glass.
Others 60 (41) Includes small scale batch melting for special glass compositions and small scale production such as for tableware, etc. Recuperative burners can be used.
The main criteria used to select the furnace are throughput, type of product, amount of cullet and properties of glass but the energy consumption of each design is different. Furthermore, scrap glass melting requires much less energy than making glass from its raw materials which requires a higher temperature and much more energy for chemical reactions to occur. Flat glass is mostly made in 66 http://www.agg-net.com/news/tarmac-cutcarbon-with-lime-kiln-investment
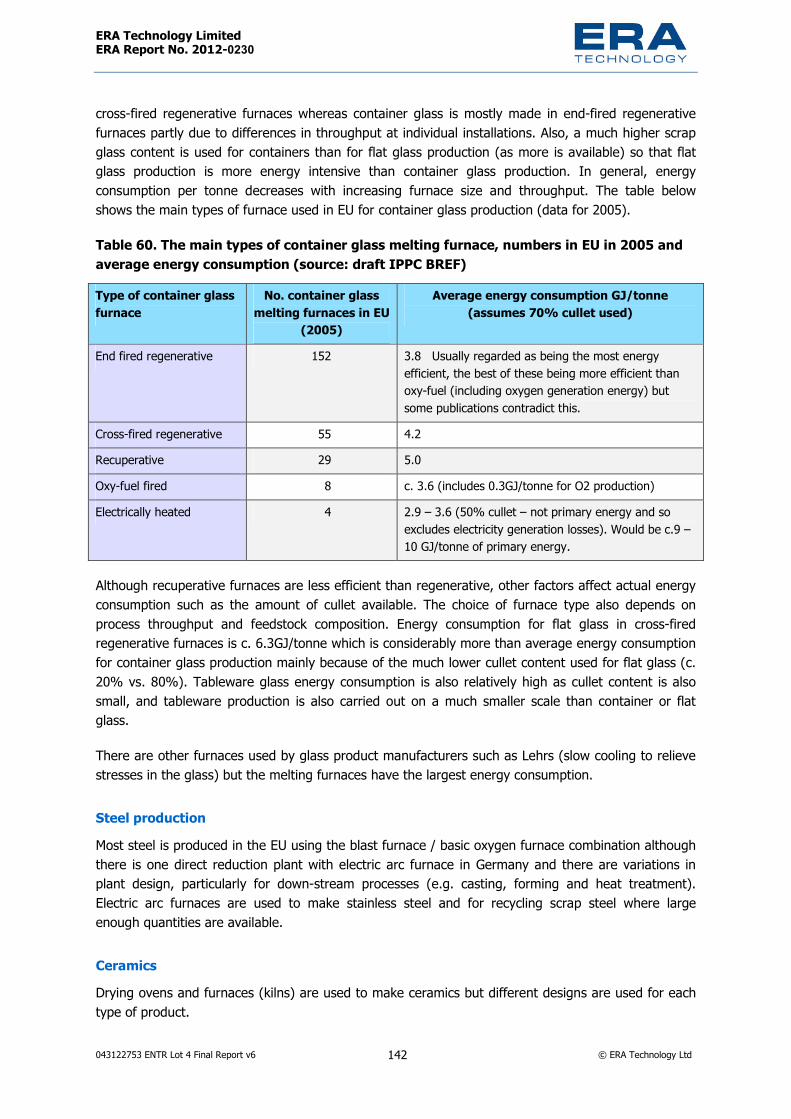
ERA Technology Limited ERA Report No. 2012-0230
043122753 ENTR Lot 4 Final Report v6 142 © ERA Technology Ltd
cross-fired regenerative furnaces whereas container glass is mostly made in end-fired regenerative furnaces partly due to differences in throughput at individual installations. Also, a much higher scrap glass content is used for containers than for flat glass production (as more is available) so that flat glass production is more energy intensive than container glass production. In general, energy consumption per tonne decreases with increasing furnace size and throughput. The table below shows the main types of furnace used in EU for container glass production (data for 2005).
Table 60. The main types of container glass melting furnace, numbers in EU in 2005 and average energy consumption (source: draft IPPC BREF) Type of container glass furnace
No. container glass melting furnaces in EU
(2005)
Average energy consumption GJ/tonne (assumes 70% cullet used)
End fired regenerative 152 3.8 Usually regarded as being the most energy efficient, the best of these being more efficient than oxy-fuel (including oxygen generation energy) but some publications contradict this.
Cross-fired regenerative 55 4.2 Recuperative 29 5.0 Oxy-fuel fired 8 c. 3.6 (includes 0.3GJ/tonne for O2 production) Electrically heated 4 2.9 – 3.6 (50% cullet – not primary energy and so
excludes electricity generation losses). Would be c.9 – 10 GJ/tonne of primary energy.
Although recuperative furnaces are less efficient than regenerative, other factors affect actual energy consumption such as the amount of cullet available. The choice of furnace type also depends on process throughput and feedstock composition. Energy consumption for flat glass in cross-fired regenerative furnaces is c. 6.3GJ/tonne which is considerably more than average energy consumption for container glass production mainly because of the much lower cullet content used for flat glass (c. 20% vs. 80%). Tableware glass energy consumption is also relatively high as cullet content is also small, and tableware production is also carried out on a much smaller scale than container or flat glass.
There are other furnaces used by glass product manufacturers such as Lehrs (slow cooling to relieve stresses in the glass) but the melting furnaces have the largest energy consumption.
Steel production Most steel is produced in the EU using the blast furnace / basic oxygen furnace combination although there is one direct reduction plant with electric arc furnace in Germany and there are variations in plant design, particularly for down-stream processes (e.g. casting, forming and heat treatment). Electric arc furnaces are used to make stainless steel and for recycling scrap steel where large enough quantities are available.
Ceramics Drying ovens and furnaces (kilns) are used to make ceramics but different designs are used for each type of product.

ERA Technology Limited ERA Report No. 2012-0230
043122753 ENTR Lot 4 Final Report v6 143 © ERA Technology Ltd
Table 61. Main types of kiln used in EU for ceramics manufacture (data from IPPC BREF and from stakeholders) Ceramic product Type of oven / kiln
Batch or continuous driers (depends on water content) then tunnel kiln. 81% of kilns in UK and most new kilns in the EU are tunnel kilns. Most brick and roof tile kilns in Germany are tunnel kilns.
Brick and roof tile
“Hoffman” kilns and “clamp” kilns. Older designs of kiln; 19% of kilns in the UK. Wall and floor tile Continuous roller hearth kilns. New tile kilns are almost always of this type. Tableware Chamber or tunnel driers heated with kiln waste heat and gas / oil burners. Infrared
and microwave driers also used. Continuous tunnel or roller kiln and batch shuttle kilns are used depending on throughput. Kilns are mainly gas but some electric kilns used.
Refractories Chamber or tunnel driers then firing mainly in batch shuttle or continuous tunnel kilns. Type used depends on throughput, brick size and composition.
Sanitary ware Tunnel or chamber driers (tunnel microwave driers) Continuous tunnel or roller hearth kilns depending on the size and shape or shuttle kilns for smaller throughput.
Special clay products Batch shuttle kilns for products made in relatively small quantities. Technical ceramics Shuttle kilns, small tunnel kilns and many electric kilns are used.
In general, continuous kilns require lower energy consumption than batch kilns but some ceramic products are produced on a scale that is too small for a tunnel or roller kiln to be economic or energy efficient. The energy consumption required for drying and firing ceramics varies considerably depending on the chemical composition, water content of raw materials, firing temperature as well as the type of kiln used and its efficiency.
Metal melting
The design of furnace used to melt metals depends on many variables including the properties of the metal, scale of process, purity (e.g. of scrap). The table below shows the more commonly used examples of aluminium melting furnaces and their energy efficiency. All of these types are used in the EU but no data on the numbers or proportion are available. However, shaft furnaces are relatively large and so are few in number whereas SMEs can use crucible melting furnaces and so these are more numerous. A similar but different range of furnace types will be used for melting other metals.
Both electric and gas melting is used. Electric may appear to be very efficient but when generating losses are included, these cannot be better than 30% efficient although there is potential for lower GHG emissions where electricity is generated from renewable sources or nuclear. Of the smaller-size melters, rotary furnaces with oxy-fuel burners are more energy efficient than other types and can be used for many types of feedstock.
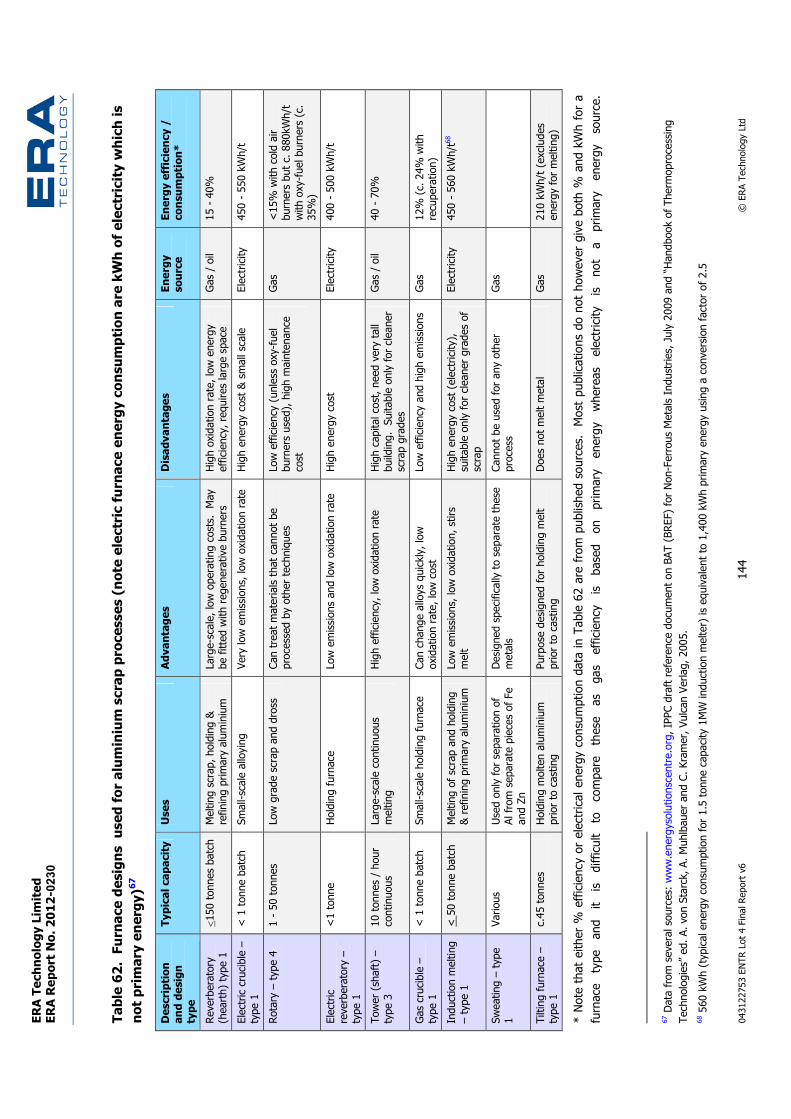
ERAT
echn
ology
Limite
dER
ARep
ortN
o.20
12-02
30
0431
2275
3ENT
RLot
4Fina
lRep
ortv6
144
©ER
ATech
nolog
yLtd
Table
62.F
urna
cede
signs
used
foralu
miniu
msc
rapp
roce
sses
(not
eelec
tricf
urna
ceen
ergy
cons
umpt
ionar
ekW
hofe
lectri
cityw
hichi
sno
tprim
arye
nerg
y)67
Desc
riptio
nan
ddes
igntyp
eTy
pical
capa
city
Uses
Adva
ntag
esDi
sadv
anta
ges
Ener
gyso
urce
Ener
gyeff
icien
cy/
cons
umpt
ion*
Reve
rberat
ory(he
arth)
type1
<150
tonne
sbatc
hMe
ltings
crap,
holdin
g&ref
iningp
rimary
alumi
nium
Large
-scale
,low
opera
tingc
osts.
May
befitt
edwit
hreg
enera
tiveb
urners
Higho
xidati
onrat
e,low
energ
yeff
icienc
y,req
uires
large
space
Gas/
oil15
-40%
Electr
iccru
cible
–typ
e1<
1ton
neba
tchSm
all-sca
leallo
ying
Very
lowem
ission
s,low
oxida
tionr
ateHig
hene
rgycos
t&sm
allsca
leEle
ctricit
y45
0-55
0kWh
/t
Rotar
y–typ
e41-
50ton
nes
Low
grade
scrap
andd
ross
Cant
reatm
ateria
lstha
tcan
notb
epro
cessed
byoth
ertec
hniqu
esLo
weff
icienc
y(un
lesso
xy-fue
lbu
rners
used),
highm
ainten
ance
cost
Gas
<15%
withc
oldair
burne
rsbu
tc.8
80kW
h/twit
hoxy-
fuelb
urners
(c.35
%)Ele
ctric
reverb
erator
y–typ
e1<1
tonne
Holdin
gfurn
aceLo
wem
ission
sand
lowox
idatio
nrate
Highe
nergy
cost
Electr
icity
400-
500k
Wh/t
Towe
r(sha
ft)–
type3
10ton
nes/
hour
conti
nuou
sLa
rge-sc
alecon
tinuo
usme
lting
Highe
fficien
cy,low
oxida
tionr
ateHig
hcap
italco
st,ne
edve
rytal
lbu
ilding
.Suit
able
only
forcle
aner
scrap
grade
sGa
s/oil
40-7
0%
Gasc
rucible
–typ
e1<
1ton
neba
tchSm
all-sca
leho
ldingf
urnace
Canc
hang
ealloy
squic
kly,lo
wox
idatio
nrate
,low
cost
Low
efficie
ncya
ndhig
hemi
ssion
sGa
s12
%(c.
24%
with
recup
eratio
n)Ind
uctio
nmelt
ing–t
ype1
<50
tonne
batch
Meltin
gofs
crapa
ndho
lding
&refi
ningp
rimary
alumi
nium
Low
emiss
ions,
lowox
idatio
n,stir
sme
ltHig
hene
rgycos
t(ele
ctricit
y),sui
table
only
forcle
aner
grade
sof
scrap
Electr
icity
450-
560k
Wh/t68
Swea
ting–
type
1Va
rious
Used
only
forsep
aratio
nof
Alfro
msep
arate
pieces
ofFe
andZ
nDe
signe
dspe
cifical
lyto
separa
tethe
seme
tals
Cann
otbe
usedf
oran
yothe
rpro
cess
Gas
Tiltin
gfurn
ace–
type1
c.45t
onne
sHo
ldingm
olten
alumi
nium
prior
tocas
ting
Purpo
sede
signe
dfor
holdin
gmelt
prior
tocas
ting
Does
notm
eltme
talGa
s21
0kWh
/t(ex
clude
sen
ergyf
orme
lting)
*Note
thate
ither
%eff
icienc
yore
lectric
alen
ergyc
onsum
ption
data
inTa
ble62
arefro
mpu
blishe
dsou
rces.
Most
publi
cation
sdon
otho
weve
rgive
both
%an
dkWh
fora
furna
cetyp
ean
dit
isdif
ficult
toco
mpare
these
asga
seff
icienc
yis
based
onpri
mary
energ
ywh
ereas
electr
icity
isno
ta
prima
ryen
ergy
source
.
67Da
tafro
msev
eralso
urces:
www.
energ
ysolut
ionsce
ntre.o
rg,IPP
Cdraf
trefer
ence
docu
ment
onBA
T(BR
EF)f
orNo
n-Ferr
ousM
etalsI
ndust
ries,
July2
009a
nd“H
andb
ooko
fThe
rmop
rocess
ingTe
chno
logies
”ed.
A.vo
nStar
ck,A.
Muhlb
auer
andC
.Kram
er,Vu
lcanV
erlag
,200
5.68
560k
Wh(ty
pical
energ
ycon
sumpti
onfor
1.5ton
necap
acity
1MW
induc
tionm
elter)
isequ
ivalen
tto1,4
00kW
hprim
aryen
ergyu
singa
conve
rsion
factor
of2.5

ERA Technology Limited ERA Report No. 2012-0230
043122753 ENTR Lot 4 Final Report v6 145 © ERA Technology Ltd
Drying ovens There are many different designs of heated chamber that are used to dry materials. For example spray driers remove water from aqueous solutions or from water with suspended solids to produce fine free flowing powders and is used in the food (dried egg and instant coffee) and ceramic industries. Parts and materials are dried in freeze driers, vacuum driers, belt driers and in batch and continuous drying ovens. The choice of drier design depends on throughput, the materials properties such as heat sensitivity and the properties of the end product. Although most driers are heated chambers and so would be classified as ovens, the designs vary considerably and some are completely different to traditional ovens.
The aim of driers is to evaporate water and remove the vapour from the solid. This requires air flow (except with vacuum driers) and so damp warm air is produced as a by-product (except with freeze and vacuum driers). The theoretical energy consumption for drying is 2.5MJ/kg water or 0.69 kWh/kg water but 2.6 MJ/kg is probably the lowest energy consumption possible with oven driers. Most wet brick driers use 1.19 kWh/kg (4.3MJ/kg) water and in the food industry, dehydration of solids consumes 0.556 – 1.08 kWh/kg water (from IPPC BREF) but this is cannot be achieved using an oven.
The heat used in driers can be recovered from other processes and this is fairly common in the ceramics industry. Warm wet air however contains heat in the form of water vapour and this is released when water vapour condenses and this is utilised in mechanical and thermal vapour recompression. As the same heat is repeatedly re-used, much lower heat consumption is achievable where these processes can be used and 10 kWh/kg water is possible (IPPC food BREF). This energy efficient techniques is however suitable only where liquids are to be dried. For solids, there are several new energy efficient drying processes in use69. Infrared drying has been described earlier and desiccant drying, the use of heat exchangers to re-use hot drying air (increases efficiency from 34 to 56%) and low pressure drying (reduces energy use by 50 – 80%) are all drying techniques that use less energy than traditional drying ovens. Commercial desiccant driers are uncommon but are used for drying plastics. Essentially, the warm wet air passes through the desiccant which removes water so that the warm dry air can be fed back into the oven. Heat is consumed to rg3enerate the desiccant but overall there is an energy saving. A new type of desiccant drier is the wheel or carousel type. The desiccant is on the surface of a large rotating wheel and as it turns, desiccant passes through three stages. In the first, wet air is dried, then the desiccant is heated to regenerate and in the last stage it cools. This design consumes less energy than processes with desiccant canisters.
Data provided by one manufacturer of small and medium size furnaces and ovens showed that only 5% of their sales were drying ovens.
4.2.2 Design of furnace and oven components Furnace and oven design is the most important variable that affects energy efficiency and can also affect the amounts of hazardous emissions. This is discussed here first considering components of furnaces and ovens and then the overall design.
69 Energy Efficiency in Plastics Processing, technical update 3, polymer drying, Carbon Trust UK.
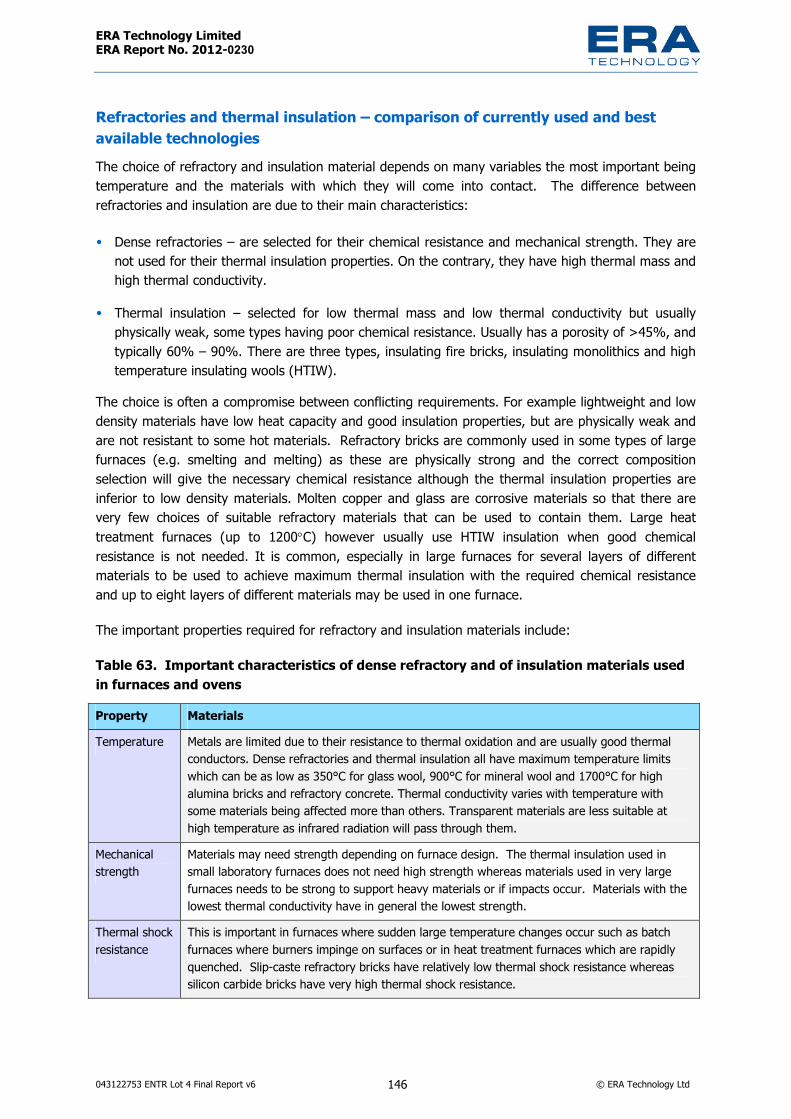
ERA Technology Limited ERA Report No. 2012-0230
043122753 ENTR Lot 4 Final Report v6 146 © ERA Technology Ltd
Refractories and thermal insulation – comparison of currently used and best available technologies The choice of refractory and insulation material depends on many variables the most important being temperature and the materials with which they will come into contact. The difference between refractories and insulation are due to their main characteristics:
• Dense refractories – are selected for their chemical resistance and mechanical strength. They are not used for their thermal insulation properties. On the contrary, they have high thermal mass and high thermal conductivity.
• Thermal insulation – selected for low thermal mass and low thermal conductivity but usually physically weak, some types having poor chemical resistance. Usually has a porosity of >45%, and typically 60% – 90%. There are three types, insulating fire bricks, insulating monolithics and high temperature insulating wools (HTIW).
The choice is often a compromise between conflicting requirements. For example lightweight and low density materials have low heat capacity and good insulation properties, but are physically weak and are not resistant to some hot materials. Refractory bricks are commonly used in some types of large furnaces (e.g. smelting and melting) as these are physically strong and the correct composition selection will give the necessary chemical resistance although the thermal insulation properties are inferior to low density materials. Molten copper and glass are corrosive materials so that there are very few choices of suitable refractory materials that can be used to contain them. Large heat treatment furnaces (up to 1200°C) however usually use HTIW insulation when good chemical resistance is not needed. It is common, especially in large furnaces for several layers of different materials to be used to achieve maximum thermal insulation with the required chemical resistance and up to eight layers of different materials may be used in one furnace.
The important properties required for refractory and insulation materials include:
Table 63. Important characteristics of dense refractory and of insulation materials used in furnaces and ovens Property Materials Temperature Metals are limited due to their resistance to thermal oxidation and are usually good thermal
conductors. Dense refractories and thermal insulation all have maximum temperature limits which can be as low as 350°C for glass wool, 900°C for mineral wool and 1700°C for high alumina bricks and refractory concrete. Thermal conductivity varies with temperature with some materials being affected more than others. Transparent materials are less suitable at high temperature as infrared radiation will pass through them.
Mechanical strength
Materials may need strength depending on furnace design. The thermal insulation used in small laboratory furnaces does not need high strength whereas materials used in very large furnaces needs to be strong to support heavy materials or if impacts occur. Materials with the lowest thermal conductivity have in general the lowest strength.
Thermal shock resistance
This is important in furnaces where sudden large temperature changes occur such as batch furnaces where burners impinge on surfaces or in heat treatment furnaces which are rapidly quenched. Slip-caste refractory bricks have relatively low thermal shock resistance whereas silicon carbide bricks have very high thermal shock resistance.

ERA Technology Limited ERA Report No. 2012-0230
043122753 ENTR Lot 4 Final Report v6 147 © ERA Technology Ltd
Property Materials Chemical resistance
Many processes carried out in furnaces involve corrosive materials being held within the furnace by the refractory lining. Float glass furnaces are lined with special bricks that are resistant to liquid glass and metal smelting furnaces need to be resistant to liquid metals, corrosive fluxes and liquid slags. Resistance to corrosive gases and fuels is also important. Where liquid flow occurs, finding suitable chemical resistant materials is particularly difficult as erosion of the material can occur.
Tightness Most furnaces have an outer steel shell and an inner insulation lining. The steel shell is necessary for the structure of the furnace but has poor chemical and thermal resistance so that the insulation material needs to prevent the contents of the furnace escaping. Many types of thermal insulation are porous to gases as well as via cracks although there is considerable variation. Refractories such as corundum and mullite bricks have very low porosity whereas light weight insulating bricks have relatively large porosity.
Thermal conductivity
This property is most important for energy efficiency but the best materials may not be suitable for various reasons. Thermal conductivity is dependent on the composition of the material, its porosity, the pore size and structure and the atmosphere in the furnace. Micro-porous materials which have closed pores so do not allow gas diffusion and is one of the best insulators but have other limitations. Glass and mineral wools also have low conductivity whereas magnesium oxide refractory bricks which have good chemical resistance, gas tightness and strength and silicon carbide bricks (excellent thermal shock resistance) are relatively good thermal conductors. Thermal conductivity is temperature dependent and some materials may be good at low temperature but have poor performance at high temperature.
Heat capacity This is a function of bulk density and composition. Materials with high porosity have low density and so low heat capacity and so are good choices for batch furnaces as they adsorb less thermal energy than higher density materials.
Bulk density As the thermal insulation absorbs heat from the furnace, improved energy efficiency can be achieved by using low density materials which also tend to be superior thermal insulators. Micro-porous and fibrous materials are superior to refractory concrete and refractory bricks.
Workability and toxicity
It is necessary to produce the thermal insulation in the required shape and this is easier with some materials than others. One concern is the toxicity of some types of HTIW and refractory materials. The dangers of asbestos (not used in the EU for many years) are well known but crystalline silica is classified as a carcinogen by IARC and alumina-silicate fibres are also hazardous materials and can change their physical form during service life (e.g. fibres can break up under heat and vibration).
Cost This depends on the cost of the material itself as well as the cost of fabrication (cutting, etc.) construction, support structures (more is needed for heavier materials), etc.
Refractory and insulation materials are available in several different forms. The main types are:
• Bricks (refractory and insulating fire-brick): usually hard and physically strong so withstand impact damage and can support heavy weights. However their bulk density is higher than HTIWs and they have higher thermal capacity. Ideal for construction of floor (hearth), walls and roof but these are sometimes used only where they are needed for their strength with lower heat capacity insulation elsewhere inside the furnace. These types of material are often the only choice where chemical resistance is needed. Lightweight bricks are used as insulation with intermediate insulation performance between denser materials and HTIW (see below) but are physically stronger than HTIW and do not shrink in use.

ERA Technology Limited ERA Report No. 2012-0230
043122753 ENTR Lot 4 Final Report v6 148 © ERA Technology Ltd
• Castable monolithic materials: Refractory and insulation inside furnaces can be installed from materials that are produced by mixing cement-like materials with water that cure or set in place. Often used in the past for tunnel kilns in the ceramic industry but their heat insulating performance is inferior to HTIWs which may be used if suitable for the process. The advantage of castables is that they can be applied where needed and for complex shapes. Repairs are also easy to carry out.
• Fibrous insulation: Includes several types of insulating wools with very low thermal mass. These include glass, mineral and rock wools which are used for lower temperature applications such as ovens and HTIWs which have high classification temperatures of above 1000°C. The use of HTIWs has been one of the main reasons why energy consumption of furnaces has decreased over the last 20 years. There are three main types of HTIW: i) Polycrystalline wools which contain >63% alumina. These have the highest temperature
capability (usually used at >1300°C) of the HTIWs and have good chemical resistance ii) Alumino-silicates and zirconium alumino-silicates are known as refractory ceramic fibre
(RCF) and are typically used at >900°C. They are classified in the EU as category 1B carcinogens although the furnace insulation industry disputes this classification which they say is based on defective research and has asked for the available research to be re-evaluated.
iii) Alkaline Earth Silicate (AES) is a “body-soluble” HTIW consisting of CaO, MgO, SiO2 and ZrO2 which is less bio-persistent type of HTIW. This can be used at up to 1150°C but this has a lower maximum temperature than RCF and is unstable in wet or acidic conditions. AES is mostly used at c.< 900°C.
• ceramic coating: applied as a fluid to surfaces then dried and fired. Not often used for furnaces or ovens.
There are many different types of insulation material available which have advantages and disadvantages. One of the more important properties is thermal conductivity which varies considerably. Examples are listed below.
Table 64. Thermal conductivity and advantages and disadvantages of a selection of thermally insulating materials (data from various sources) Type of refractory and insulation
Advantages / disadvantages Thermal conductivity (W/mK) – typical values
Dense refractory bricks Physically strong but has high thermal capacity so a high energy consumption in batch processes. Thermal conductivity can also be relatively high.
Varies depending on composition. Chromite-magnesia is: 2.6 (<500°C)
Lightweight refractory bricks Less physically strong than standard density refractory bricks but lower energy consumption due to lower thermal capacity.
Varies depending on composition
Refractory insulating silica bricks
Chemically inert, thermal shock resistant. 1.16 (250°C) 1.44 (750°C)

ERA Technology Limited ERA Report No. 2012-0230
043122753 ENTR Lot 4 Final Report v6 149 © ERA Technology Ltd
Type of refractory and insulation
Advantages / disadvantages Thermal conductivity (W/mK) – typical values
Refractory fireclay bricks Physically robust but fairly poor thermal conductivity.
0.58 (<500°C) 0.87 (<1000°C)
Alumina-silicate wool (data from Unifrax)
Has very good insulation properties but is classified as a category 1B (GHS) carcinogen.
c. 0.3 (1000°C)
Rigid aluminosilicate board (data from Zircar ceramics)
Contains fibres, suitable at up to 1600°C. 0.1 (400°C) 0.22 (1100°C)
AES fibre (data from Zircar ceramics)
Less bio-persistent than alumina-silicate fibres as dissolves in body fluids but becomes very brittle at high temperature which limits its use. Cannot be used in wet or acidic conditions.
0.11 (400°C) 0.17 (800°C) 0.26 (1100°C)
Calcium silicate insulation Used for pipe insulation and also available as sheet for furnace insulation. Maximum temperature 1000°C.
0.05 (25°C) 0.06 (200°C) 0.12 (1000°C)
Alumina (data from Zircar ceramics)
Chemically inert, tough and suitable for use at up to 1800°C. Relatively expensive material.
0.2 (400°C) 0.31 (800°C) 0.39 (1400°C)
Fibre insulating board Fibres of various compositions, used mainly for ovens and some furnaces.
0.048 (25°C)
Glass wool insulation Maximum 540°C, used in ovens only as high temperature performance is limited.
0.04 (25°C) 0.14 (300°C)
Mineral wool insulation Higher temperature limit than glass wool, also used in ovens but less efficient at higher temperatures.
0.04 (25°C) 0.1 (350°C)
Rockwool Similar properties to mineral wool. 0.045 (25°C) Graphite Suitable for high temperature only in absence of
oxygen so used in vacuum furnaces. Also used in blast furnaces.
0.1 (25°C) 0.35 (1000°C) 0.65 – 1.0 (2000°C)
Microtherm insulation (amorphous silica, alumina, calcium silicate, etc.)
Maximum 1200°C, low density (320 – 450 kg/m3), low thermal conductivity at up to 1000°C. Relatively brittle material.
0.02 – 0.025 (100°C) 0.03 (700°C)
Aspen Pyrogel Very low density and thermal conductivity but transparent to infrared so less effective at high temperature. Available as flexible material
0.02 (25°C) 0.09 (900°C)
The heat capacity of different furnace linings has been compared to show that material density has a very significant effect on the amount of energy adsorbed by the insulation which correlates with the cost of energy and CO2 emissions. This is especially significant in batch furnaces which heat up then cool down. Data is shown in the table below70 for a batch furnace operating at 1300°C.
70 T. Tonnesem and R Telle “Comparison of the Energy Efficiency of the production of shaped refractory products”.

ERA Technology Limited ERA Report No. 2012-0230
043122753 ENTR Lot 4 Final Report v6 150 © ERA Technology Ltd
Table 65. Specific heat capacity of three types of furnace refractory and insulation Type of insulation Specific heat capacity (MJ/m2)Refractory bricks 817 Lightweight insulating bricks 330 High temperature insulating wool 45
The choice of refractories and insulation depends on the process conditions. Furnaces that contain heavy materials that abrade the insulation surface require tough and dense insulation (at the internal surface at least. If no physical contact with the insulation occurs, much lower density and mechanically weaker materials can be used. Chemical resistance is also a limitation. Furnaces which contain reducing atmospheres cannot use reducible oxide insulation. Insulation that is in contact with acidic gases cannot contain basic oxides as these will react and degrade. Melts and slags can be particularly corrosive and liquid glass requires specially formulated materials to achieve an acceptable life.
The chemical composition of insulation that is used will depend on the conditions inside the oven or furnace as shown in the following table.
Table 66. Furnace materials based on chemical composition71
Type of insulation
Examples Uses and characteristics
Silica Silica does not soften under high loads until temperatures approaching its melting point unlike many other refractories. Silica is resistant to many types of flux and slag, it has good volume stability and high spalling resistance.
Acidic oxide types which may react with bases
Alumina-silicate
The inertness of high alumina refractories increases with increase in alumina percentage. The uses of high alumina refractories include the hearth and shaft of blast furnaces, electric arc furnaces, cement kilns, glass melting tanks and crucibles for melting a wide range of metals.
Magnesium oxide
Properties of magnesia depend on the concentration of silicate and the operating temperature. It resists oxidizing and reducing environments. High slag resistance, particularly to lime and iron-rich slags.
Basic types, mainly metal oxides, resistant to bases but may react with acids
Chrome- magnesia
Used for building the critical parts of high temperatures furnaces as it withstands corrosive slags and gases. Bricks have a relatively low thermal conductivity and a high bulk density and chemical resistance. Good wear resistance so can be used in rotary kilns.
71 Information from many sources including from JRC IPTS
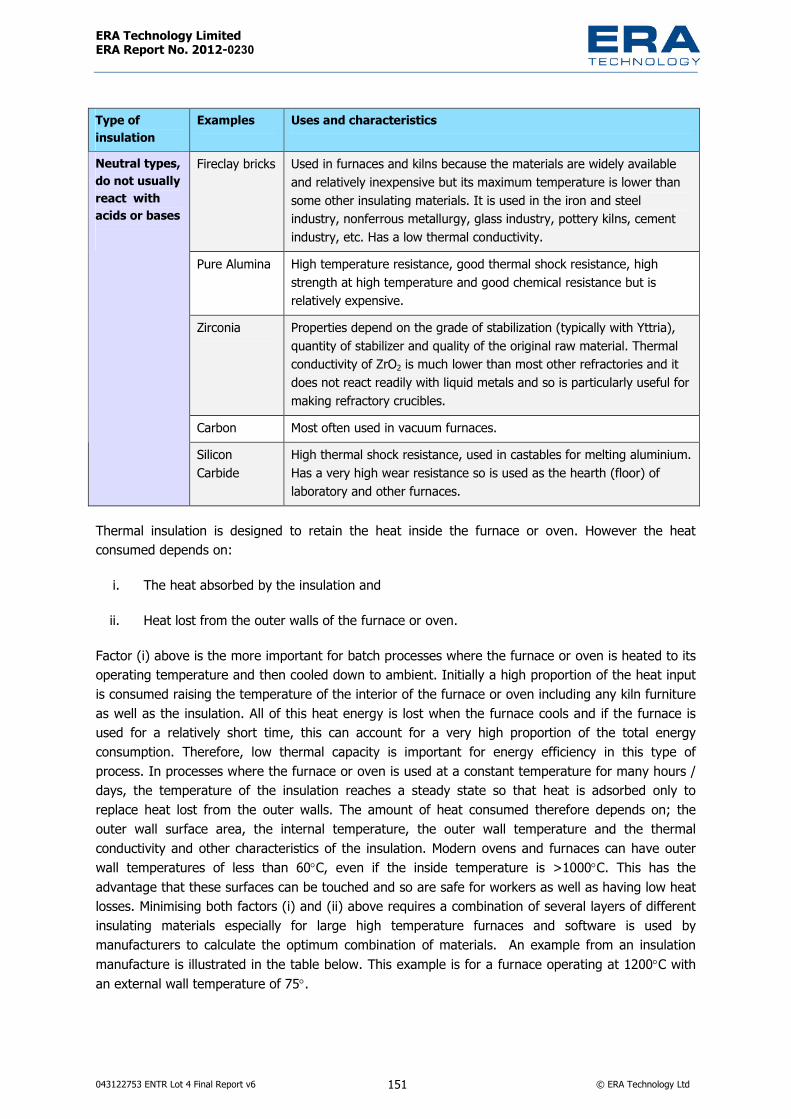
ERA Technology Limited ERA Report No. 2012-0230
043122753 ENTR Lot 4 Final Report v6 151 © ERA Technology Ltd
Type of insulation
Examples Uses and characteristics
Fireclay bricks Used in furnaces and kilns because the materials are widely available and relatively inexpensive but its maximum temperature is lower than some other insulating materials. It is used in the iron and steel industry, nonferrous metallurgy, glass industry, pottery kilns, cement industry, etc. Has a low thermal conductivity.
Pure Alumina High temperature resistance, good thermal shock resistance, high strength at high temperature and good chemical resistance but is relatively expensive.
Zirconia Properties depend on the grade of stabilization (typically with Yttria), quantity of stabilizer and quality of the original raw material. Thermal conductivity of ZrO2 is much lower than most other refractories and it does not react readily with liquid metals and so is particularly useful for making refractory crucibles.
Carbon Most often used in vacuum furnaces.
Neutral types, do not usually react with acids or bases
Silicon Carbide
High thermal shock resistance, used in castables for melting aluminium. Has a very high wear resistance so is used as the hearth (floor) of laboratory and other furnaces.
Thermal insulation is designed to retain the heat inside the furnace or oven. However the heat consumed depends on:
i. The heat absorbed by the insulation and
ii. Heat lost from the outer walls of the furnace or oven.
Factor (i) above is the more important for batch processes where the furnace or oven is heated to its operating temperature and then cooled down to ambient. Initially a high proportion of the heat input is consumed raising the temperature of the interior of the furnace or oven including any kiln furniture as well as the insulation. All of this heat energy is lost when the furnace cools and if the furnace is used for a relatively short time, this can account for a very high proportion of the total energy consumption. Therefore, low thermal capacity is important for energy efficiency in this type of process. In processes where the furnace or oven is used at a constant temperature for many hours / days, the temperature of the insulation reaches a steady state so that heat is adsorbed only to replace heat lost from the outer walls. The amount of heat consumed therefore depends on; the outer wall surface area, the internal temperature, the outer wall temperature and the thermal conductivity and other characteristics of the insulation. Modern ovens and furnaces can have outer wall temperatures of less than 60°C, even if the inside temperature is >1000°C. This has the advantage that these surfaces can be touched and so are safe for workers as well as having low heat losses. Minimising both factors (i) and (ii) above requires a combination of several layers of different insulating materials especially for large high temperature furnaces and software is used by manufacturers to calculate the optimum combination of materials. An example from an insulation manufacture is illustrated in the table below. This example is for a furnace operating at 1200°C with an external wall temperature of 75°.
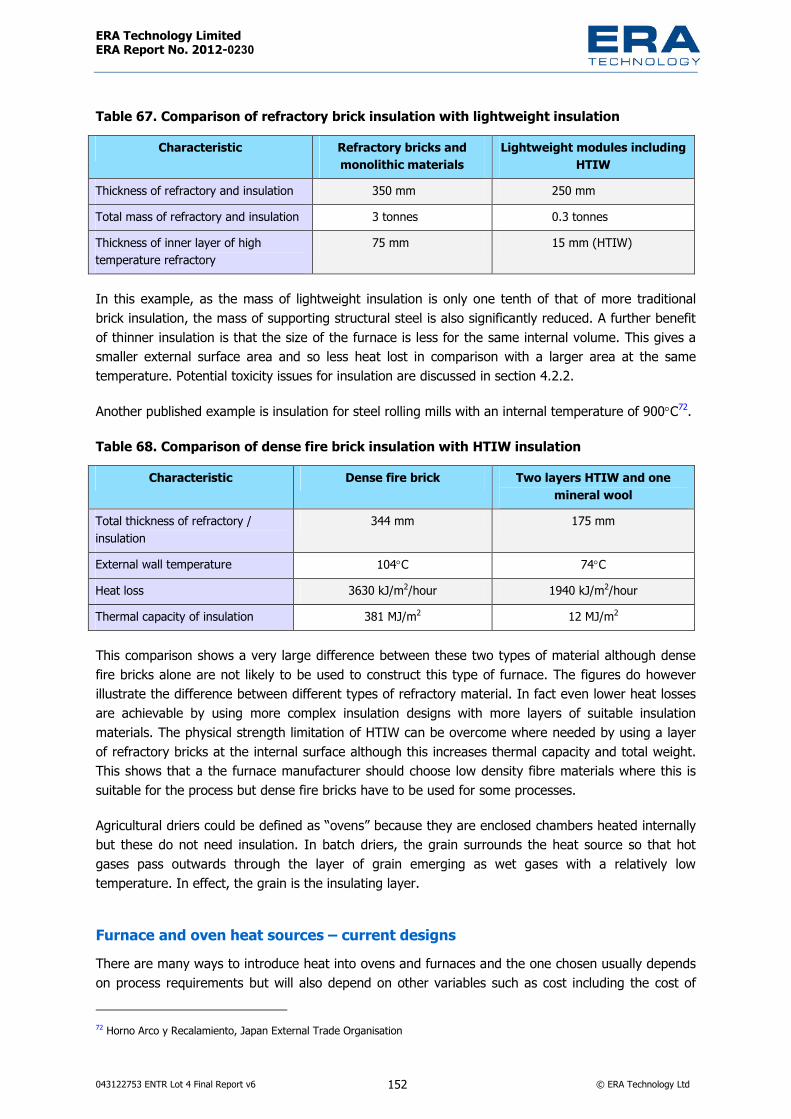
ERA Technology Limited ERA Report No. 2012-0230
043122753 ENTR Lot 4 Final Report v6 152 © ERA Technology Ltd
Table 67. Comparison of refractory brick insulation with lightweight insulation Characteristic Refractory bricks and
monolithic materials Lightweight modules including
HTIW Thickness of refractory and insulation 350 mm 250 mm Total mass of refractory and insulation 3 tonnes 0.3 tonnes Thickness of inner layer of high temperature refractory
75 mm 15 mm (HTIW)
In this example, as the mass of lightweight insulation is only one tenth of that of more traditional brick insulation, the mass of supporting structural steel is also significantly reduced. A further benefit of thinner insulation is that the size of the furnace is less for the same internal volume. This gives a smaller external surface area and so less heat lost in comparison with a larger area at the same temperature. Potential toxicity issues for insulation are discussed in section 4.2.2.
Another published example is insulation for steel rolling mills with an internal temperature of 900°C72.
Table 68. Comparison of dense fire brick insulation with HTIW insulation Characteristic Dense fire brick Two layers HTIW and one
mineral wool Total thickness of refractory / insulation
344 mm 175 mm
External wall temperature 104°C 74°CHeat loss 3630 kJ/m2/hour 1940 kJ/m2/hour Thermal capacity of insulation 381 MJ/m2 12 MJ/m2
This comparison shows a very large difference between these two types of material although dense fire bricks alone are not likely to be used to construct this type of furnace. The figures do however illustrate the difference between different types of refractory material. In fact even lower heat losses are achievable by using more complex insulation designs with more layers of suitable insulation materials. The physical strength limitation of HTIW can be overcome where needed by using a layer of refractory bricks at the internal surface although this increases thermal capacity and total weight. This shows that a the furnace manufacturer should choose low density fibre materials where this is suitable for the process but dense fire bricks have to be used for some processes.
Agricultural driers could be defined as “ovens” because they are enclosed chambers heated internally but these do not need insulation. In batch driers, the grain surrounds the heat source so that hot gases pass outwards through the layer of grain emerging as wet gases with a relatively low temperature. In effect, the grain is the insulating layer.
Furnace and oven heat sources – current designs There are many ways to introduce heat into ovens and furnaces and the one chosen usually depends on process requirements but will also depend on other variables such as cost including the cost of 72 Horno Arco y Recalamiento, Japan External Trade Organisation

ERA Technology Limited ERA Report No. 2012-0230
043122753 ENTR Lot 4 Final Report v6 153 © ERA Technology Ltd
energy (energy from gas is cheaper than electricity), throughput, etc. The best available technology BAT will vary for each type of process. Some examples are:
• Large-scale heating of ceramics, metals, glass – regenerative gas burners which re-use heat from exhaust gases to pre-heat burner air and gas.
• Surface heat treatment of metals – inductive heating as this heats only the surface and so utilises much less energy than gas-fired or electric resistance heating.
• Drying materials and cooking food – microwave or infrared heating. • Inductive melting of metals – depends on furnace design but as much as 95% of input electrical
energy can be utilised for raising the temperature and melting the metal. • From chemical reactions – many processes that are carried out in furnaces involve chemical
reactions that are exothermic. The heat generated may be sufficient for the process so that no additional heat energy need be supplied except at start up (such as the Outokompo flash smelting process for copper). Chemical reaction heat is often supplementary to the main heat input such as firing some types of clays that contain organic materials or melting metal swarf that contains mineral oils. In some processes, much more heat is generated than is needed and so needs to be removed to avoid damage to the furnace (such as the blast furnace).
• Electric arc melting – High intensity heating which can have a high electrical energy efficiency. • Plasma – high intensity heating requiring only short process duration with little time for heat to be
lost – so relatively energy efficient. • Superconducting magnetic heating – a very new technology currently used only for heating billets
but could potentially be used for other processes with metals. The selection of heat source in a new furnace or oven is made when it is designed taking into account many variables such as:
• Process requirements • Safety regulations • Availability of fuels • Laws of physics • Standards and legislation • Economics. There are important differences between the main fuels / heat sources used which are compared here.

ERA Technology Limited ERA Report No. 2012-0230
043122753 ENTR Lot 4 Final Report v6 154 © ERA Technology Ltd
Table 69. Main heat sources and fuels used in furnaces and ovens Heat source Advantages Disadvantages Gas (natural, etc) Versatile and very efficient heat source.
Less CO2 and SO2 but potentially more NOx than coal and oil
Natural gas is not available at all locations in EU. Liquid gas can be used but is more expensive. Good burner control needed
Liquid fuels (oil, kerosene)
More widely available than gas in the EU More expensive than gas and less versatile
Coal One of the cheapest fuels, very efficient in blast furnaces and cement kilns where high energy efficiency can be achieved. Coal flames have much higher emissivity than methane flames, and a higher heat flux (KW/m2) within 20m of the flame
Installation is very expensive as coal needs grinding and fluidised. Ash produced is incompatible with some processes. The quantity of CO2 produced / MJ is considerably higher than from hydrocarbon fuels (gas and oil). Toxic by-products may be produced such as SO2
Waste materials Usually low cost materials that need to be disposed of. Commonly used in cement kilns with other fuels
Energy content variable and some materials are hazardous or can produce hazardous emissions without suitable control technology. Some wastes such as plastics are fossil fuel derived
Biomass Not fossil fuels so CO2 emissions excluded from EU ETS
Many biomass sources are unsustainable and fossil fuels are consumed in their production. Will not reach high temperatures needed for some processes. See additional comments below in section 4.2.2 on page 166
Electric resistance heating
Clean, simple low cost design, no contamination of product, no risk of harmful emissions or explosion
Electricity generation is only c. 30% efficient and so this may not be the most carbon efficient option where fossil fuels are used for electricity generation. Heat from electricity is more expensive than heat from fossil fuels
Electric induction heating
Heats parts directly so high electrical energy efficiency. Is an energy efficient option for surface heat treatment of metals
Electricity generation is only c. 30% efficient. Energy losses from generation of high frequency and from water cooling
Electric arc and plasma
Very high temperature so excellent heat transfer and high electrical energy efficiency possible
Electricity generation is only c. 30% efficient. Usually suitable only for certain large-scale processes
Microwave heating Very efficient heat transfer for susceptible materials
More efficient heat transfer than convection heating but electricity generation is only c. 30% efficient. Microwave generation can be as high as 70% efficient but primary energy efficiency is only 30% x 70% = 20%. Not suitable for all materials
DC Superconducting magnet
No energy losses in magnet coil and low losses in power supply. Very electrical energy efficient heating technique suitable for metals
Relatively new process used only for billet heating but should be suitable for other processes. Unsuitable for non-metals
High frequency RF Dielectric
Heats parts directly so high electrical energy efficiency, can achieve higher power than microwave.
Not suitable for all materials
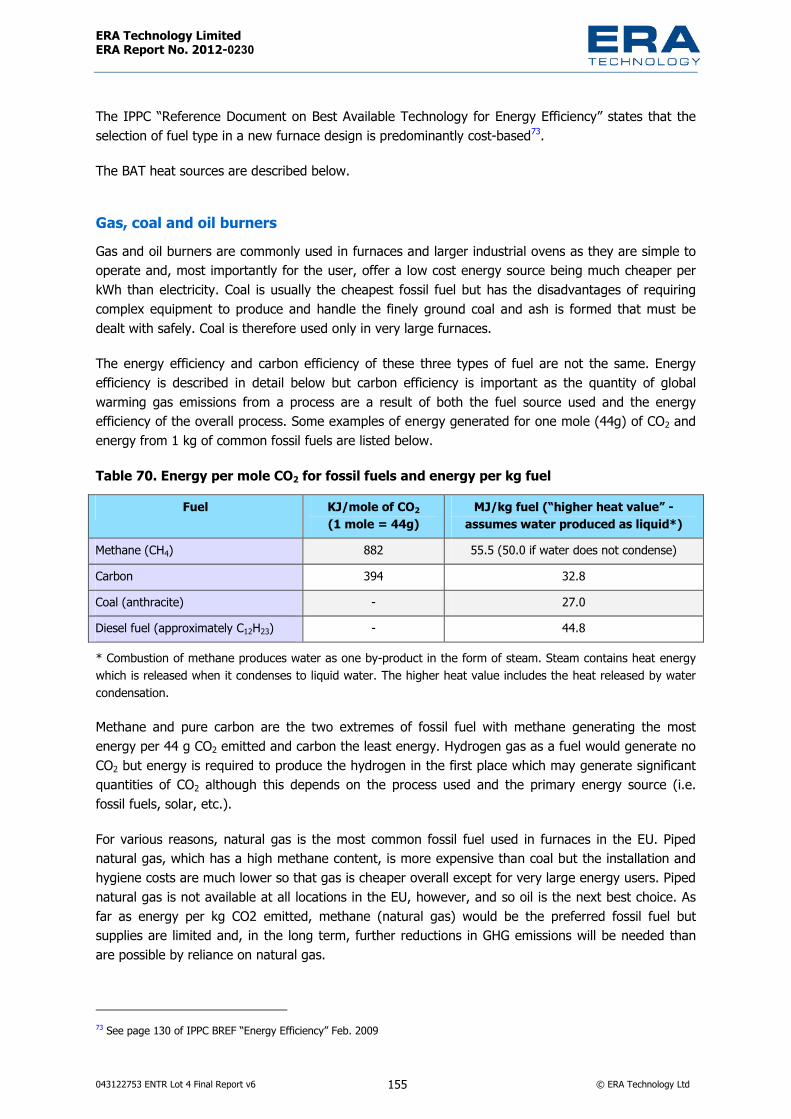
ERA Technology Limited ERA Report No. 2012-0230
043122753 ENTR Lot 4 Final Report v6 155 © ERA Technology Ltd
The IPPC “Reference Document on Best Available Technology for Energy Efficiency” states that the selection of fuel type in a new furnace design is predominantly cost-based73.
The BAT heat sources are described below.
Gas, coal and oil burners Gas and oil burners are commonly used in furnaces and larger industrial ovens as they are simple to operate and, most importantly for the user, offer a low cost energy source being much cheaper per kWh than electricity. Coal is usually the cheapest fossil fuel but has the disadvantages of requiring complex equipment to produce and handle the finely ground coal and ash is formed that must be dealt with safely. Coal is therefore used only in very large furnaces.
The energy efficiency and carbon efficiency of these three types of fuel are not the same. Energy efficiency is described in detail below but carbon efficiency is important as the quantity of global warming gas emissions from a process are a result of both the fuel source used and the energy efficiency of the overall process. Some examples of energy generated for one mole (44g) of CO2 and energy from 1 kg of common fossil fuels are listed below.
Table 70. Energy per mole CO2 for fossil fuels and energy per kg fuel Fuel KJ/mole of CO2
(1 mole = 44g) MJ/kg fuel (“higher heat value” -
assumes water produced as liquid*) Methane (CH4) 882 55.5 (50.0 if water does not condense) Carbon 394 32.8 Coal (anthracite) - 27.0 Diesel fuel (approximately C12H23) - 44.8
* Combustion of methane produces water as one by-product in the form of steam. Steam contains heat energy which is released when it condenses to liquid water. The higher heat value includes the heat released by water condensation.
Methane and pure carbon are the two extremes of fossil fuel with methane generating the most energy per 44 g CO2 emitted and carbon the least energy. Hydrogen gas as a fuel would generate no CO2 but energy is required to produce the hydrogen in the first place which may generate significant quantities of CO2 although this depends on the process used and the primary energy source (i.e. fossil fuels, solar, etc.).
For various reasons, natural gas is the most common fossil fuel used in furnaces in the EU. Piped natural gas, which has a high methane content, is more expensive than coal but the installation and hygiene costs are much lower so that gas is cheaper overall except for very large energy users. Piped natural gas is not available at all locations in the EU, however, and so oil is the next best choice. As far as energy per kg CO2 emitted, methane (natural gas) would be the preferred fossil fuel but supplies are limited and, in the long term, further reductions in GHG emissions will be needed than are possible by reliance on natural gas.
73 See page 130 of IPPC BREF “Energy Efficiency” Feb. 2009
ERA Technology Limited ERA Report No. 2012-0230
043122753 ENTR Lot 4 Final Report v6 156 © ERA Technology Ltd
The energy efficiency of furnaces which have gas burners that use cold air and cold natural gas can be poor because only a small proportion of the heat is utilised in the process and a large proportion of heat is lost in hot exhaust gases. In some smaller furnaces the energy efficiency can be as low as 20% which means that 80% of the heat energy is wasted. Several more efficient gas burner designs have been developed which give much better furnace energy efficiency.
Heat transfer from burners The technology to transfer heat from combustion to the materials being processed inside the furnace is not straightforward and depends on many design variables. Heat is transferred in any process by a combination of conduction, convection and radiation where convection and radiation are the most important when using gas, oil and coal burners. The energy from the combustion process depends on the fuel (gas, oil or coal) to air ratio; with insufficient oxygen, carbon monoxide is formed instead of carbon dioxide. Carbon monoxide is toxic and a reducing gas so is sometimes desirable for certain processes but the reaction between carbon and oxygen to produce carbon monoxide generates less heat than the reaction between carbon and oxygen to carbon dioxide:
2C + O2 = 2CO 221kJ/mole
C + O2 = CO2 394kJ/mole
Therefore excess air is needed to avoid carbon monoxide formation unless reducing conditions are required inside the furnace. However if excess air is used, some of the heat energy generated is used to heat the unused oxygen and more nitrogen. Therefore there is an optimum gas/air ratio needed for optimum energy efficiency. This ratio depends to some extent on the burner and furnace design but typically about 15% excess air is used. Excess air can be minimized by designing the burner and furnace to have air recirculation around the flame as this can eliminate carbon monoxide with as low as >0.05% excess air whereas at least 2 -4% is needed without recirculation.
Heat generated by combustion of course needs to be transferred to the materials inside the furnace and this depends on burner and furnace design. Heat transfer from burners is by a combination of convection and radiation.
Convection relies on movement of gases or heated air inside the furnace or oven so that heat can reach the surfaces of the process material. The main way to control air movement is by fans and several may be used for efficient convection. Burner design can also affect gas flow as these can be designed to give high velocity gas flow. Oxy-fuel burners (see below) have a disadvantage because the total volume of hot gas is less (as there is no nitrogen) and so a lower gas velocity is produced for the same heat output as a gas/air burner.
Radiation relies on infrared radiation interacting with materials to cause heating. The efficiency at which infrared radiation heats materials depends on their infrared absorptive properties which varies considerably. Water, some organic materials and very dark surfaces readily absorb infrared radiation but bright reflective surfaces are very poor. Infrared radiation is generated by high temperature surfaces and it can also be emitted by flames. Some furnaces have gas burners that have flames that are directed onto the furnace walls or roof to heat the insulation to a high enough temperature for it to radiate heat. This is common in oil refinery furnaces. Natural gas/air flames (with excess oxygen) have a relatively low infrared emissivity whereas fossil fuels with a high carbon content have a much higher emissivity. In general flames from coal which is mostly carbon have the highest emissivity and

ERA Technology Limited ERA Report No. 2012-0230
043122753 ENTR Lot 4 Final Report v6 157 © ERA Technology Ltd
oil which has a higher percentage of carbon than methane is more efficient than methane but is less efficient than coal.
Table 71. Dependence on fuel carbon content of flame emissivity.
Fuel C-H weight ratio Emissivity of flame (black body = 1.0) Pitch creosote 14 1.0 “Gas oil” 6 0.6 Coke oven gas (CO + H2) 4 0.25
The effect of fuel source on heat flux and heat transfer is more complex however as the heat flux from each fuel type varies with distance from the burner. Heat flux from coal burners is highest closer to the burner (<20m). Fuel oil has a high heat flux close to the burner and up to 50m from the burner whereas gas flames have a heat flux that is much greater than oil burners at c. 40m from the burner but a much lower heat flex at < 20 m . None of these issues mean that gas, oil or coal is the “best” fuel, rather that different furnace designs are needed for each fuel source.
Gas burners There are many different burner designs available. Each burner design is suitable for specific applications and all have advantages and disadvantages. There are many types of gas burners including baffle burners, high thermal release burners and air staged burners. Gas burners are fed with gas and air which can be cold or pre-heated giving improved energy efficiency. Some of the more common burner designs are:
• Premixed gas burners – In standard gas burners, gas and air are premixed before combustion. The flame is deficient in air but the remaining hydrocarbons burn in the surrounding secondary air. Various mixing devices are used to obtain various effects. For example, some designs twist the air to obtain rapid combustion whereas others give radial gas and air flow so that combustion is slower.
• Radiant wall and roof burners – a common burner in petrochemical furnaces which heats the walls or roof which then radiate heat into the chamber. Gas flames usually have poor radiative heat transfer whereas a red hot glowing ceramic wall or roof is an effective radiative heat source.
• Turbulent jet diffusion burners – a common gas burner design in which gas and primary air are burned and then secondary air from inside the furnace mixes with the gas flame as a result of turbulence caused by the high gas jet velocity.
• Precessing jet diffusion burners – designed for high temperature processes and reported to use up to 8% less gas, produce 50% less NOx and increase production rates by up to 10%.
Flame temperature affects the release of polluting gases. Low temperatures (and air deficiency) can produce toxic carbon monoxide whereas very high temperatures produce NOx from reaction of nitrogen and oxygen in the air. Maintaining a temperature sufficient to avoid carbon monoxide is not difficult but special burner designs may be needed to minimise NOx emissions. Reducing flame temperature to below 1500°C and shortening the time at high temperature both reduce NOx. Flame temperature can be reduced by recirculating flue gases into the flame, using staged combustion or flameless combustion. Energy efficiency can be significantly improved by novel burner designs and

ERA Technology Limited ERA Report No. 2012-0230
043122753 ENTR Lot 4 Final Report v6 158 © ERA Technology Ltd
some of the more common types are described below. However gas burners using cold air are common for medium-size furnaces and are also used in some larger furnaces and ovens. Some designs of burners can be fed with hot air from heat exchangers or from air cooling of hot parts. This is used with modern brick kilns where cold air is blown onto the hot bricks to rapidly cool and this creates air at up to 600°C. This hot air could be used to feed the gas burner and significantly reduce gas consumption but at this temperature, investment in special valves, pipe-work and thermal insulation are needed, which increase investment cost. A furnace manufacturer has provided a calculation of the value of the energy saved and the investment cost from using hot air for gas burners over a range of air temperatures:
Table 72. Impact of use of hot burner air on gas consumption and size of investment for a furnace operating at c. 1100°°°°C
Burner air temperature (°C)
Saving in gas consumption (%)
Additional investment cost for a typical furnace (€)
Payback period (years)
20 0 0 0 100 2.9 100,000 1.41 200 6.5 110,000 0.71 300 10.1 150,000 0.62 400 13.7 300,000 0.92 500 17.2 350,000 0.85
These results indicate that air at the maximum temperature of 500°C should always be used as the payback period is less than one year. However, in reality, EU industry has usually opted during the past few years for air at only c. 200°C although some are now considering 300°C air. Clearly, the payback period plays an important role, but may not be the dominant investment decision criteria and other factors are involved. This will be discussed further in Task 7.
Novel gas burner designs can improve yields and so save energy. Where furnace capacity is limited but yields are low, any improvements in yield result in an increased quantity of usable product from the same amount of energy. Process or design changes that do not affect energy consumption but improve yields can give an energy benefit as the amount of energy consumed per tonne of product is reduced so that there is an overall reduction in energy use. An example is with aluminium melting processes. This always creates some waste due to oxidation of the liquid metal to form “dross”. Some novel furnace designs reduce the quantity of dross formed and so increase the yield and reduce the energy consumption per tonne of product. One novel furnace design with “TriOx” burners (gas burners using 5% excess air) reduced surface oxidation of the aluminium melt by minimising the supply of hot oxygen at the melt surface so that the amount of dross formed decreased from standard designs with 1 - 2% dross loss of metal to 0.4% dross loss with the alternative design74.
Oxy-fuel burners Combustion of gases with oxygen or with air generates the same quantity of energy but when oxygen is used there is no heat loss from unnecessarily heating nitrogen which accounts for c. 79% of air. As a result the combustion gases are at a higher temperature (e.g. 2700°C with oxy-gas as compared
74 TriOx Combustion System – J. Blinz, J. Feese and F. Lisin, Hauck Manufacturing Co., USA, Feb 2009

ERA Technology Limited ERA Report No. 2012-0230
043122753 ENTR Lot 4 Final Report v6 159 © ERA Technology Ltd
with 1900°C for air gas burners75) which increases the amount of radiated energy and gives improved heat transfer to the materials in the furnace so that these are heated more quickly. As a result, the energy efficiency of thermal processes is improved. The size of the energy reduction depends on many variables but one publication claims that fuel consumption can be reduced by more than half in an example of an aluminium melting process76. There is a third advantage in that high temperature combustion in air can generate nitrogen oxides from the reaction of oxygen and nitrogen. Nitrogen oxides contain mainly nitrous oxide which is a potent global warming gases with a global warming potential of 310 (so is 310 times more effective than CO2)77. Another potential benefit is where carbon capture and storage (CCS) is a requirement. CCS is far more efficient (>85%) with pure CO2 that would be generated by oxy-fuel burners that the CO2/N2 mixture produced by air/gas burners (c. 60%).
The main disadvantage of oxy-fuel burners is that a source of oxygen is required and providing this consumes energy and requires additional equipment. Oxygen can be generated on site or bought in. On-site oxygen generation plant has a high investment cost but the cost per tonne of oxygen can be lower than having it delivered. It is estimated that 160 – 200 kWh/tonne of oxygen is required for oxygen generation78 . The draft IPPC BREF for glass states that oxygen production consumes 0.3GJ / tonne of glass produced.
There is another potential disadvantage. The volume of hot combustion gases from oxy-fuel burners is less than from gas/air burners and gas velocity is important for efficient heat transfer. This problem is overcome however by improving recirculation of hot flue gases within the furnace so that all of the interior is efficiently heated.
The main uses of oxy-fuel burners are for glass melting and metals melting and refining. Information provided by one stakeholder with several of their aluminium melting furnaces shows an example of the effect of oxy-fuel burners on energy efficiency.
Table 73. Furnace energy consumption per tonne of aluminium melted using different types of gas burner (data from stakeholder)
Description of process Energy consumption per tonne aluminium melted
Batch aluminium melting with ox-fuel burner 620 kWh / tonne Batch aluminium melting with cold air burners 1000 kWh / tonne Batch aluminium melting with pre-heated air burners 750 kWh / tonne
Although these furnaces may be of different ages, and so there will be other furnace design differences, they show the benefits of oxy-fuel burners for melting aluminium. Note however that
75 Oxy-fuel combustion in a rotary hearth heating furnace, 14 Jan 2004, http://www.linde-gas.com/en/images/OvakoRotaryHearth17-10855.pdf 76 Advantages of oxy-fuel burner systems for aluminium recycling, Ludger Gluns and Siegfried Schemberg, Air Products, 14 Feb 2005, http://www.airproducts.com/NR/rdonlyres/23E39E65-861D-467B-BD62-64978D3A0125/0/advantagesofoxyfuel.pdf 77 Nitrous oxide, US EPA website, Dec 2010, http://www.epa.gov/nitrousoxide/scientific.html 78 Oxyfuel Combustion R&D Activities, Doosan Babcock Energy, APGTF Workshop on Carbon Abatement Technologies - Development and Implementation of Future UK Strategy London, 11-12 Feb 2009, http://www.apgtf-uk.com/files/documents/9thWorkshop2009/11OxyfuelCombustionGerryHesselmann.pdf
ERA Technology Limited ERA Report No. 2012-0230
043122753 ENTR Lot 4 Final Report v6 160 © ERA Technology Ltd
these figures exclude energy consumed for oxygen production although oxy-fuel will still be the most efficient of the three overall.
One type of burner that uses gas or oil, air and oxygen is the “PyreTron” burner that is often used in metal melting furnaces. This first creates a hot oxygen-deficient oxy-fuel flame with high luminosity that continues to burn with the surrounding air to complete combustion. This design combines the benefits of high temperature efficiency of oxy-fuel with high luminosity that provides good heat transfer. The manufacturer claims that this type of burner uses almost 50% less fuel than conventional cold air burners. Other claimed benefits are improved convective and radiative heat transfer, low NOx formation and the ability to turn down the heat output by a factor of ten which is greater than is achievable for most types of gas burner79.
Flameless combustion burners A relatively recent innovation is a type of oxy-fuel burner which is designed to give a flame that is spread over a larger volume to give more uniform heating and improved energy efficiency. In reality it is not “flameless” but the flame is not readily visible to the human eye but the larger flame volume results in improved radiation heat transfer to the parts or materials being heated. Standard burner flames can give uneven heating so that there are hot spots at temperatures higher than necessary and other regions which are cool. To heat the cool spots to the required temperature requires more heat than needed for the hot spots and so the more even heating of flameless burners can reduce energy consumption by 10% when compared to standard oxy-fuel burners80.
Flameless burners consist of multiple, high velocity fuel nozzles to generate a very large flame volume. The fuel and oxygen streams mix with hot combustion gases within the furnace before they combine and burn so that the “flame”, which is the exothermic reaction of fuel and oxygen, is diluted by combustion gases giving a large but less luminous flame. Much of the heat is re-radiated from the furnace walls as infrared radiation giving more uniform heating. Flameless combustion burners are used for glass melting and metal melting and can be used for batch and continuous processes.
Flameless combustion with “Hi-Tac” regenerative burners has been developed and provides the advantage that the flame temperature is much more uniform than for standard gas flames. A typical gas/air flame has a range of temperatures of 950 - 1450°C whereas a Hi-Tac diffuse flame ranges from 1000 to 1150°C. As the peak temperature is lower, much less NOx is produced.
One publication provides an example of a steel re-heating furnace in Sweden where air/fuel burners were replaced by flameless oxy-fuel burners which reduced the heating time from 6 hours to just over 2 hours with a fuel consumption reduction of >30% 81.
Recuperative and regenerative burners Furnaces heated by combustion of hydrocarbon fuels (gas, oil, coal) can lose up to 70% of their heat in the flue gases82. Much of this heat can be recovered, however, and re-used either to pre-heat 79 PyreTron Burner, American Combustion website, Dec 2010, http://www.americancombustion.com/en/tools/pyretron.html 80 “Flameless” Oxy-Fuel Combustion for Metals Heating and Melting, Jin Cao, Air Products and Chemicals Inc., Pub. No. 334-08-019-US, 21 Jan 2009, http://www.airproducts.com/NR/rdonlyres/9FCB4705-EF1B-4593-B489-6FC4F02F9C89/0/Flameless_OxyFuel_Combustion_33408019US.pdf 81 A. Scherello, et. al. “State of the art oxy-fuel solutions for reheating and annealing furnaces in steel industry”, 2008.
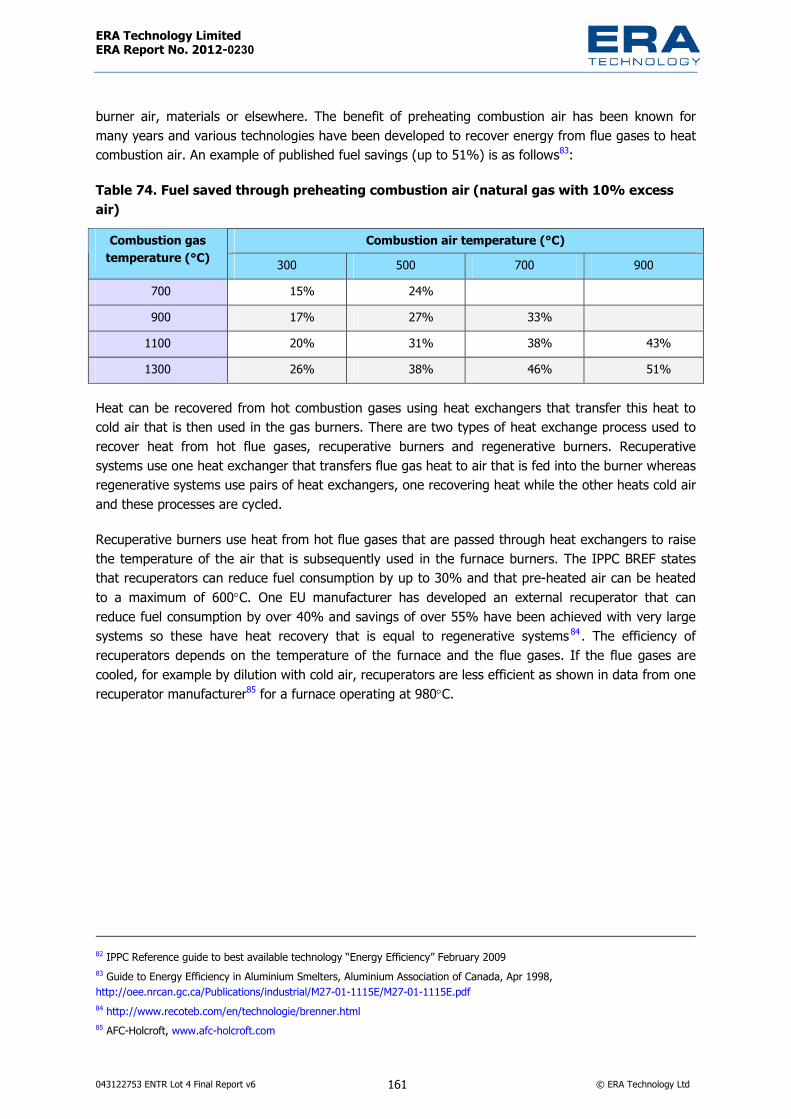
ERA Technology Limited ERA Report No. 2012-0230
043122753 ENTR Lot 4 Final Report v6 161 © ERA Technology Ltd
burner air, materials or elsewhere. The benefit of preheating combustion air has been known for many years and various technologies have been developed to recover energy from flue gases to heat combustion air. An example of published fuel savings (up to 51%) is as follows83:
Table 74. Fuel saved through preheating combustion air (natural gas with 10% excess air)
Combustion air temperature (°C) Combustion gas temperature (°C) 300 500 700 900
700 15% 24% 900 17% 27% 33%
1100 20% 31% 38% 43% 1300 26% 38% 46% 51%
Heat can be recovered from hot combustion gases using heat exchangers that transfer this heat to cold air that is then used in the gas burners. There are two types of heat exchange process used to recover heat from hot flue gases, recuperative burners and regenerative burners. Recuperative systems use one heat exchanger that transfers flue gas heat to air that is fed into the burner whereas regenerative systems use pairs of heat exchangers, one recovering heat while the other heats cold air and these processes are cycled.
Recuperative burners use heat from hot flue gases that are passed through heat exchangers to raise the temperature of the air that is subsequently used in the furnace burners. The IPPC BREF states that recuperators can reduce fuel consumption by up to 30% and that pre-heated air can be heated to a maximum of 600°C. One EU manufacturer has developed an external recuperator that can reduce fuel consumption by over 40% and savings of over 55% have been achieved with very large systems so these have heat recovery that is equal to regenerative systems84. The efficiency of recuperators depends on the temperature of the furnace and the flue gases. If the flue gases are cooled, for example by dilution with cold air, recuperators are less efficient as shown in data from one recuperator manufacturer85 for a furnace operating at 980°C.
82 IPPC Reference guide to best available technology “Energy Efficiency” February 2009 83 Guide to Energy Efficiency in Aluminium Smelters, Aluminium Association of Canada, Apr 1998, http://oee.nrcan.gc.ca/Publications/industrial/M27-01-1115E/M27-01-1115E.pdf 84 http://www.recoteb.com/en/technologie/brenner.html 85 AFC-Holcroft, www.afc-holcroft.com

ERA Technology Limited ERA Report No. 2012-0230
043122753 ENTR Lot 4 Final Report v6 162 © ERA Technology Ltd
10
12
14
16
18
20
22
24
26
28
300 350 400 450 500 550Exhaust gas C
Perc
ente
nerg
ysav
ing
Figure 9. Relationship between temperature of flue gas and percent energy saving for recuperative burners in a furnace at 980°°°°C
Recuperator heat exchangers transfer flue gas heat to burner air can be separate from the burner or integral (self-recuperative burners). One publication states that up to 70% of the heat from flue gases can be recovered in counter-current recuperative heat exchangers but only c. 40% with co-current heat exchangers86. Counter-current regenerative burners can recover up to 90% of flue gas heat if their surface area is sufficiently large. The efficiency of recuperative heat exchangers is size dependent and can be improved by installing a larger recuperator. This is possible only with recuperators that are separate to the burners and are used to pre-heat the burner air. Self-recuperative burners are also produced and are ideally suited to radiant tube systems.
Regenerative burners are more complex in design than recuperative types. These consist of pairs of heat exchangers each with a burner although compact regenerative burners having pairs of integral heat exchangers are available in the EU. Large furnaces use pairs of regenerators with pairs of burners and, when one burner is operating, the hot flue gases pass through the heat exchanger in the other. The heat exchangers usually consist of a bed of ceramic pieces (or a honeycomb structure) that very efficiently absorb and store most of the heat from the flue gases. When this ceramic bed nears the flue gas temperature, the operation is reversed so that burner air passes through the hot regenerator bed to be pre-heated before combustion by the second burner and hot flue gases pass through the other regenerator heat exchanger. The IPPC BREF (energy efficiency) states that up to 90% of the energy in flue gases can be recovered and re-used so that incoming combustion air can be only 100°C cooler than the furnace operating temperature. Fuel savings of up to 60% are achievable. There are a variety of designs of regenerative burners. For example, Nippon Furnaces developed the High-cycle Regenerative System (HRS) with either high velocity flame or their HiTAC flameless combustion system in the 1990’s HRS uses a large surface area honeycomb structure heat exchanger which is more efficient than ceramic balls although it requires cleaner flue gases to avoid blocking of pores. The IPPC BREF guide states that maintenance costs for regenerative burners can be higher but Nippon Furnaces claim that no maintenance is needed for one of their regenerative 86 J. Wuenning, “Small capacity regenerative burners” AFRC – JFRC International Symposium Oct 2006, Hawaii, USA
ERA Technology Limited ERA Report No. 2012-0230
043122753 ENTR Lot 4 Final Report v6 163 © ERA Technology Ltd
burner designs (HRB). Smaller compact regenerative burners have been developed for smaller furnaces which comprise single burners with pairs of integral heat. Control valves resistant to the high flue gas temperatures are used to switch the flow of flue gases and burner air between the two integral heat exchangers. Compact regenerators rely on efficient high surface area heat exchangers. One publication states that a honeycomb structure heat exchanger can have a surface area of 1307 m2/m3 compared to 186m2/m3 for 20mm ceramic ball types87.
NOx emissions - Nitrogen oxide (NOx) emission can be a problem with regenerative burners because the use of regenerative burners can result in higher combustion temperatures for longer periods. Where air is used for combustion, the nitrogen content can react with oxygen to produce NOx which are powerful global warming gases. The concentration of NOx emissions from large installations is limited by EU legislation and so the design of regenerative burner needs to avoid high NOx concentrations. NOx formation is proportional to the flame temperature and time at high temperature. Unfortunately reducing NOx emissions can conflict with optimising heat transfer as higher flame temperature gives more radiated heat and reducing flame temperature is normally only possible by dilution with additional cold air. Research has however developed burner designs that have low NOx emissions and can be avoided by using flameless combustion burners such as HiTac and FLOXTM.
Operation of recuperative and regenerative burners requires good process control as the process conditions affect energy efficiency. There are also many designs of regenerative burner which also affects energy efficiency. Regenerative burners can have standard flames or be flameless (e.g. HiTac burners88). Self-recuperative radiant tube burners are more efficient than standard recuperators with external heat exchangers. Self-recuperators recover up to 60% of heat energy from flue gases by passing hot flue gases counter-current to air-flow within the burner itself. Self-recuperative radiant tube burners can be metal which is slightly more energy efficient than ceramic but each is used under different process conditions89. Regenerative radiant tube burners were developed in the UK by British Gas and are also used in the EU.
The energy efficiency of recuperative and regenerative burners depend on furnace temperature and air pre-heat temperature with hotter furnaces and higher pre-heat temperatures achieving the highest efficiencies 90 . The air pre-heat temperature in glass melting furnaces with recuperative burners reaches only 400 - 750°C. These types of burner are uncommon in the EU whereas regenerative burners can produce and use pre-heated air of up to 1250°C91 and so are more energy efficient and are standard for large-scale glass melting furnaces in EU (flat glass and container glass).
Solids in combustion gases: There are several factors that can limit the efficiency of recuperative and regenerative burners. Where flue gases from furnaces contain particulate material, either dust or in some processes this can be a product or by-product, these materials can collect inside the heat exchangers causing blockages which would be unacceptable. Therefore solid materials must first be removed before heat can be recovered. The choice of dust removal affects overall energy efficiency. 87 http://www.icsco.eu/index.php?option=com_content&view=article&id=38&Itemid=118 88 High Temperature Air Combustion (HiTAC) for Industrial Applications Asia-Pacific Partnership Steel Task Force, P. Hughes and A. Sebestyen 89 “Radiant tube technology for strip annealing furnaces”, A. Milani and J. G. Wunning. 90 W. Trinks, et. al., “Industrial Furnaces” 6th Edition, John Wiley & Sons Inc., 2004 91 R. G. C. Beerkens “Energy efficiency benchmarking of glass furnaces”, Glass Science and Technology 77, no. 2, 2004 p47 - 57

ERA Technology Limited ERA Report No. 2012-0230
043122753 ENTR Lot 4 Final Report v6 164 © ERA Technology Ltd
The most common method is to use “bag-houses” which pass the gas through polymeric cloth filters. As the polymers would be damaged by high temperature, the flue gas must first be cooled before filtration and this significantly reduces the energy efficiency as the maximum temperature of pre-heated burner air will inevitably be greatly reduced. Therefore for maximum efficiency, alternative techniques using dust removal from undiluted hot gases should be used. Examples of methods available include cyclones, electrostatic precipitators and ceramic filters.
Materials versus cost issues: Another factor that limits energy efficiency is the choice of materials (tubing, control valves, etc.) used to carry the high temperature flue gases from the furnace to the regenerator or recuperator. Various grades of steel are normally used but each type has an upper temperature limit. If steels become too hot, they oxidise and also soften so that they can sag and fail. Highly alloyed stainless steels are generally used but are inferior in their temperature resistance to nickel alloys (e.g. Inconels). Furnaces used, for example, to fire bricks and tiles have very hot flue gases which are too hot for standard stainless steels and so there are two choices: the higher cost option is to use a more expensive grade alloy, the lower investment cost but less energy efficient option is to cool the flue gases. The choice is determined by economics and so the most energy efficient design is not always used. Figure 10 below shows the relationship between investment in energy saving equipment and the value of energy saved.
Investment cost / saving
Temperature of combustion air at burner inlet
Investment cost
value of energy saving
Ambient
Optimum financial option
Investment cost / saving
Temperature of combustion air at burner inlet
Investment cost
value of energy saving
Ambient
Optimum financial option
Figure 10. Relationship between cost of capital investment and value of energy saved to determine optimum financial situation
This investment cost / energy saving model is not only true for investment in burners but applies to any investment aimed at reducing energy costs. A further complication is that investors also consider the size of investments which results in debts and they sometimes use payback periods to limit investment decisions so that the best available technology (BAT) may not be used if the investment is large or the payback time is longer than company or investor policy allows. This Reasons why users do not always invest in BAT will be considered in more detail in Task 7.
The cost of recuperative and regenerative systems depends on many variables, in particular the size of furnace and number of burners. One publication quotes the following costs and payback periods (compared with standard cold air/gas burners) .

ERA Technology Limited ERA Report No. 2012-0230
043122753 ENTR Lot 4 Final Report v6 165 © ERA Technology Ltd
Table 75. Cost and payback periods for recuperative and regenerative burners Investment option Typical cost (US$
million) Payback period based on value
of energy saved Installation of recuperative system 3.8 2.5 years Installation of regenerative system 5.5 1.5 years Replacement of recuperative system with a regenerative system
3.7 3.0 years
Table 75 shows that the shortest payback time is for regenerative burners as this gives the largest savings in energy costs. However regenerative burner systems are large due to the ceramic heat exchanger bed and so are suitable only for large furnaces whereas recuperative burners can be used in much small furnaces. One example of a small commercial furnace is a range of aluminium melting furnaces designed to be used with either a standard gas burner or a recuperative gas burner. The version for melting 600 – 1100 kg batches with the standard burner consumes 38 kWh/h whereas the recuperative burner version consumes 30 kWh/h (20% less energy)92.
Radiant tube burners Radiant tube burners have been used in the EU as an efficient heat source for industrial furnaces in the EU for many years. They consist of tubes having a variety of shapes with gas or oil burners inserted at one end and flue gases emerging from the other. The external surface of the tubes becomes very hot and radiate heat into the furnace. The advantage of this type of burner is that no flue gases enter the furnace itself and so they have the same heating effect as electric resistance heating but using cheaper gas. Radiant tubes are produced in a variety of shapes including W, U, P, double-P and straight tubes. Double P are the most recently developed and with internal recuperators or regenerators are the most energy efficient. The outer tube is made of a high-temperature resistance steel alloy with a high chromium content, nickel and other metals. Molybdenum and ceramics such as silicon carbide are used at the highest temperatures. Radiant tubes with integral recuperators and regenerators have been developed and are much more energy efficient than cold air burners. Overall, ceramic radiant tubes can have higher heat flux than metal and the best energy efficiency can be achieved by regenerator designs of radiant tube (W and double – P type). External recuperators and regenerators to the burners give better efficiency than cold air burners but integral recuperators or regenerators in radiant tubes can give better energy efficiency as there are less heat losses in pipe work, etc. However the most efficient systems use both external and internal regenerators or recuperators.
The flame temperature inside the radiant tube can be very high so there is a risk of NOx emissions and one option to avoid this is by flameless combustion (described above). Another option is to use air-stage radiant tube burners. In these burners, the combustion air can be mixed with combustion gases to give better flame temperature uniformity and a lower maximum temperature or air is added in stages to the flame to minimise the oxygen concentration
92 Morgan Metal Melting Systems recuperative gas fired bale out furnace MK V “R”, Morgan Molten Metal Systems, Dec 2010, www.morganmms.com and in particular http://www.morganmms.com/default.aspx?p=recup

ERA Technology Limited ERA Report No. 2012-0230
043122753 ENTR Lot 4 Final Report v6 166 © ERA Technology Ltd
ESA Pyronics datasheet states that recuperative radiant tube burners have an energy efficiency of 68 – 74% (depending on furnace temperature)93.
Oil and coal Piped natural gas is not available at all locations in EU and so other fossil fuels may be used.
• Liquid hydrocarbon gases such as propane and butane are alternatives but are more expensive than piped natural gas.
• Oil has the advantage that it is easy to transport and store and has a high energy content. It does require however special oil burners in which the liquid fuel is atomised to obtain a readily combustible mist. This limits the ability to control the energy output as reducing the pressure to lower the fuel input has a detrimental effect on atomisation. Gas burners can more easily be switched on and off and gas/air flow rates adjusted to control furnace temperature, but re-igniting oil burners is less straightforward. Oil is superior to gas in that the flame has a higher luminosity and so heat transfer can be better.
• Coal gives flame with the highest luminosity but is the most difficult fossil fuel to use although it is also the cheapest. Coal burners require powdered coal and so considerable investment in converting and transporting coal to a fine powder is required. As a result, this is economic only for very large energy users such as steel, cement and lime production. Coal usually contains substances other than carbon that leave a residue (ash) when burned. This is unacceptable in some products.
Biomass There are many types of biomass and bio-fuels but the environmental benefits are very variable. Some types are relatively benign such as:
• Waste cooking oil – no longer suitable for cooking, it can be converted into bio-diesel however quantities available will always be very small.
• Sewage sludge – needs to be dried but available in reasonable quantities (although it can otherwise be used as fertiliser if no hazardous substances are present).
• Parts of crops that cannot be eaten – high calorific value when dry and does not reduce food production.
• Charcoal – obtained from trees so requires large areas of woodland but this can be sustainable as long as ancient woodland, rain forests and other wildlife-rich habitats are not destroyed and agricultural land is not used. Charcoal is a possible fuel for steel production but the availability of sustainable charcoal is unlikely to be in large enough quantities to have a significant impact. It has
93 Radiant Tube Burners-RT series, Bulletin E3900 rev05 31/01/2000, Pyronics, http://www.amgas.se/pyronics/PYRONICS%20Br%C3%A4nnare%20RT.pdf
ERA Technology Limited ERA Report No. 2012-0230
043122753 ENTR Lot 4 Final Report v6 167 © ERA Technology Ltd
been reported that large quantities of charcoal that are imported into the EU are from unsustainable sources94.
Other types of biomass have limitations – some severe. Plants grown on agricultural land such as sugar cane can cause many serious environmental problems:
• Land for growing crops is limited and is insufficient in many countries. If land is used to grow biomass, less is available for food unless virgin rainforest or savannah is destroyed to replace it95.The World Bank has also said that recent world food price rises can be attributed to bio-fuel production96.
• Biomass crops consume large amounts of water which is in very limited supply in many parts of the world.
• Fossil fuel energy is used to produce bio-fuels such as for separation of ethanol from fermented crops, fuels for transportation and for farm vehicles and to produce fertilisers. There are fossil CO2 emissions from bio-fuels production and the benefits can be over-stated97.
• Some new types of biomass are being developed such as from algae. Energy is consumed to produce and transport the bio-fuels and it is not yet known whether fossil fuel use would be significantly reduced98. A life cycle analysis of preliminary process designs indicates that algae appear to have a worse impact than traditional bio-fuels99.
• The total area of agricultural land suitable for biomass crops is far too small to replace fossil fuels. It is estimated that if 72% of all available agricultural land in the EU15 countries were used to produce biofuel, this would produce enough only for 10% of the EU15’s transport fuel needs.
94 “Charcoal versus LPG grilling: A carbon-footprint comparison”, Eric Johnson, Environmental Impact Assessment Review 29 (2009) 370–378. 95 Forests paying the price for bio-fuels; Fred Pearce; New Scientist; Issue 2526; 22 Nov 2005; http://www.newscientist.com/article/mg18825265.400 Bio-fuel plantations fuel strife in Uganda; Fred Pearce; New Scientist, Issue, 19 April 2007; http://www.newscientist.com/article/dn11671-bio-fuel-plantations-fuel-strife-in-uganda.html Broken bio-fuel policies still driving rainforest destruction; Greenpeace; 10 Jun 2010; http://www.greenpeace.org/eu-unit/press-centre/press-releases2/broken-bio-fuel-policies-still 96 Rising global interest in farmland; can it yield sustainable and equitable benefits?; The World Bank; 7 Sep 2010; http://siteresources.worldbank.org/INTARD/Resources/ESW_Sept7_final_final.pdf 97 Life cycle assessment; University of Strathclyde website; Dec 2010, http://www.esru.strath.ac.uk/EandE/Web_sites/02-03/bio-fuels/why_lca.htm A Life Cycle Assessment of Energy Products: Environmental Impact Assessment of Bio-fuels; Rainer Zah; Heinz Böni; Marcel Gauch; Roland Hischier; Martin Lehmann; Patrick Wäger; Empa; 23 Sep 2007, http://www.theoildrum.com/node/2976 98 Biodiesel from algae may not be as green as it seems; Helen Knight; New Scientist; Issue 2770; 27 Jul 2010; http://www.newscientist.com/article/mg20727704.700-biodiesel-from-algae-may-not-be-as-green-as-it-seems.html?DCMP=OTC-rss&nsref=environment 99 Some thoughts on recent Algae Bio-fuels Lifecycle Analysis; Cai Steger; NRDC; 28 Jan 2010 http://switchboard.nrdc.org/blogs/csteger/comments_on_algae_lifecycle_st.html Environmental Life Cycle Comparison of Algae to Other Bioenergy Feedstocks; Andres F. Clarens, Eleazer P. Resurreccion, Mark A. White and Lisa M. Colosi; Environ. Sci. Technol., 2010, 44 (5), pp 1813–1819; 19 Jan 2010; http://pubs.acs.org/doi/abs/10.1021/es902838n Life-Cycle Assessment of Biodiesel Production from Microalgae; Laurent Lardon, Arnaud Hlias, Bruno Sialve, Jean-Philippe Steyer and Olivier Bernard; Environ. Sci. Technol., 2009, 43 (17), pp 6475–6481; 27 Jul 2009; http://pubs.acs.org/doi/abs/10.1021/es900705j

ERA Technology Limited ERA Report No. 2012-0230
043122753 ENTR Lot 4 Final Report v6 168 © ERA Technology Ltd
Similarly, 9% of available agricultural land worldwide would produce only 10% of the worlds transport fuel needs100. Loss of these amounts of food growing land would cause severe food shortages and make little difference to GHG emissions from furnaces and ovens.
• Growing bio-fuel crops can emit nitrous oxide which is a potent greenhouse gas. • Some land unsuitable for crops can be used to grow some types of biomass. This land is usually
desert or semi-desert and so growing crops is possible only by irrigation, but in areas where this type of land is available water supplies are extremely limited. Although this type of land may have no financial value to man, it will sustain a wide variety of wildlife that would be affected if used to grow biomass.
Clearly, biomass is one option for reducing carbon dioxide emissions from fossil fuels but the availability of sustainable biomass is far too small to have a very significant impact.
Electric heating technologies Electricity is the main choice of energy source for laboratory ovens and furnaces. There are no energy losses from hot combustion gases when electric resistance heaters are used and electric power sockets are usually available whereas gas supplies usually need to be installed and this will incur a cost. Also, the higher cost of electricity over gas per kWh of energy is less important with laboratory equipment. However electricity is also widely used in industrial furnaces and ovens as connection to the mains supply is can be easier and cheaper than connecting gas supplies. There are safety risks with both electric and fossil fuel energy sources. There is a risk of electrocution from electricity and fossil fuels are flammable and can explode. Therefore there is extensive safety legislation for equipment that uses both energy sources.
Electric heating can provide technical advantages and there are also technologies where the efficiency of converting electricity into heat energy is very high. Electric heating can also be focussed to heat selectively (e.g. microwave heating) and this can result in much lower heat consumption than other heating methods. Electricity however needs to be generated and in most EU States fossil fuels are the main source and the generation efficiency is relatively poor so that about 30% of the primary energy is converted into useful electricity at the users premises. Therefore, while electric heating may appear to be “clean” and efficient, its use emits a quantity of CO2 that depends on the mix of fuel sources used within the EU Member State that the installation is located. The main types of electric heating technologies available are:
Electric resistance – This is used for most laboratory and small – medium size industrial ovens and furnaces. Conversion of electricity by resistance heating to heat energy is very efficient although the heat is transmitted in all directions by conduction, convection and at higher temperatures by radiation. Transfer to the parts or materials being heated can be slow and during this time, heat is also absorbed by the thermal insulation, support structures inside the oven/furnace and is lost via leaks, from warm external surfaces and vents. In practice, higher power electric resistance heating can be more energy efficient as the process temperature is reached more quickly and so the heating time is shorter resulting in less heat absorption by the oven or furnace materials and there is less time for losses to occur. High power electric resistance heated ovens and furnaces are however not standard and manufacturers tend to use as low a power rating as is practical, for example to avoid 100 Fuels Gold; F. Pearce; New Scientist; Issue 2570; 23 Sep 2006; pp.36-41

ERA Technology Limited ERA Report No. 2012-0230
043122753 ENTR Lot 4 Final Report v6 169 © ERA Technology Ltd
the need for 3 – phase power supplies. High power furnaces are made in small numbers for special applications101 although furnace design also affects the rate of heating102.
The composition of electric resistance materials depends on the maximum temperature required:
• Nichrome up to 1200°C • Silicon carbide up to 1600°C • Molybdenum disilicide up to 1800°C • Tantalum up to 2500°C • Graphite up to 3000°C.
Electric arc An electric arc is generated when a high electric current passes between two electrically conducting materials. An electric arc can be generated by both AC and DC between two “electrodes”. A very high voltage is needed to start an arc unless the distance between the electrodes is very small but, once started, the very high temperature attained creates a plasma which contains hot ionised gas molecules that can easily carry an electric current between electrodes and so the electrode gap can be increased without extinguishing the arc. The temperature within the plasma generated by arcing can be over 6000°C and this is used as the heat source for a variety of furnace processes. The most common arc furnace process is for melting and refining metals and arc furnaces can be very large, especially for steel production which is their main use.
Electric arc furnaces are used for melting scrap (usually steel), purification of steel and melting porous iron that is produced from direct reduction furnaces. Electric arc furnaces have been used for many years and there have been many technology changes made which have improved their energy efficiency. The theoretical minimum energy consumption to melt steel is 300KWh/tonne assuming no losses. Modern arc furnaces are far more efficient than when they were first used in the 1960s. By using pre-heated scrap (from reused waste heat), oxy-fuel burners, high power DC arcs, bottom stirring and many other innovations, an electrical energy consumption approaching 300KWh/tonne can sometimes be achieved (with additional chemical energy input) with process times as short as 30 minutes103 although higher energy consumption and longer process times are more common and depend on scrap composition and the amount of refining that is required.
Quoting energy consumption in terms of kWh electricity per tonne is misleading as the electricity needs to be generated and there are high associated losses. Generation from fossil fuels is only 30% efficient and so the actual minimum primary energy consumption is at least 900KWh of primary energy/tonne. The IEA (International Energy Agency) quote the primary energy consumption of modern electric arc furnaces as 4GJ to 6GJ primary energy per tonne of steel (which corresponds to a furnace electricity consumption of 1.6GJ/tonne).
101 For example MHI “Zapper” heats up at 50°C/s; MHI website; Dec 2010; http://www.mhi-inc.com/PG4/zapper-furnace.html 102 1100°C & 1200°C Rapid heating laboratory chamber furnaces (RWF); Carbolite website; Dec 2010; http://www.carbolite.com/products.asp?id=2&doc=22 103 Energy efficiency of Electric Arc Furnace; A. Opfermann; International Arab Iron and Steel Conference; March 2008

ERA Technology Limited ERA Report No. 2012-0230
043122753 ENTR Lot 4 Final Report v6 170 © ERA Technology Ltd
An efficient modern arc furnace can typically produce more than 80 tonnes of liquid steel in 1 hour or less from cold scrap steel and the largest can melt 120 tonnes every 30 minutes.
Originally, arc furnaces operated using AC current and the arc was struck between pairs of electrodes. It is possible however to use DC current which passes between one electrode and the charge (the material to be heated) which sits on the bottom electrode. DC arc furnaces are larger than AC types and can melt up to 200 tonnes per batch whereas 120 tonnes capacity is standard for AC arc furnaces. DC arc furnaces provide better heat distribution and this reduces power consumption. One publication indicates that DC arc furnaces save 0.32GJ electricity /tonne of steel electricity which in USA reduces CO2 emissions by 14.4kg/tonne steel. The most effective design and process techniques for maximising energy efficiency are104:
• DC arc • Scrap pre-heating (e.g. using recovered waste heat from other processes) • Oxy-fuel burners (to heat cold spots, see below) • Foamy slags (these reduce heat radiation losses from the surface of melts) • Process control, more efficient transformers and bottom stirring also give benefits. Electric arc furnaces tend to suffer from cool regions between electrodes which delay full melting and the longer process time consumes more electrical energy. The process time and energy consumption are reduced by additional heating with gas burners (often oxy-fuel burners) of cool regions and also by injecting coal and oxygen.
Arc furnaces can be very electrical energy efficient (although not primary energy efficient). 95% of the electricity is converted into heat which is used to melt the metal. Additional heat input is from gas burners, carbon electrode consumption and chemical reactions that occur during metal refining. Heat is lost however: by radiation from the melt surface, water cooling of the high current supply and the furnace itself (needed to freeze slag on the surface otherwise it damages the insulation), as hot slag and in exhaust gases. Heat from the slag and hot metal can be utilised so that the largest heat loss is from the exhaust gases unless heat recovery is utilised. A typical heat balance would be:
Table 76. Heat balance for typical electric arc furnace. Heat source Energy per tonne of steel produced
Heat inputs Electricity for the arc 486.5 kWh/tonne (69% of energy input) Chemical reactions 152.2 kWh/tonne Electrode oxidation 30.1 kWh/tonne Other inputs (gas burners, etc) 35.5 kWh/tonne Heat outputs Heat in liquid steel 397.2 kWh/tonne (56% of heat output)
104 E. Worrel, N. Martin and L. Price “Energy Efficiency and Carbon Dioxide Emissions Reduction Opportunities in the U.S. Iron and Steel Sector” July 1999, report LBNL-41724

ERA Technology Limited ERA Report No. 2012-0230
043122753 ENTR Lot 4 Final Report v6 171 © ERA Technology Ltd
Heat source Energy per tonne of steel produced Exhaust gas heat loss 152.3 kWh/tonne (21.6% of heat output) Water cooling 100.2 kWh/tonne (14.2% of heat output) Surface heat loss 9.0 kWh/tonne Heat in slag 45.6 kWh/tonne
Overall, electric arc furnaces are an efficient melting and refining process for steel as long as heat contained within the liquid steel, slag, heated cooling water and exhaust gases are recovered and re-used. The CO2 emissions depend primarily on the fuels used to generate the electricity although a small proportion arises from the gas burners and carbon electrode oxidation. Electricity at steel production plant is usually generated within the plant from waste heat recovery. Blast furnace and direct reduction plant in the EU use coal (coke, petcoke) as the primary fuel and so the electricity is generated from high carbon-content fossil fuel. Where an arc furnace is not part of a larger steel plant and is used to recycle scrap, then the electricity may be derived from the grid in which case, the kgCO2/kWh generated depends on the mix of fuels used and this varies significantly between EU Member States.
Plasma Plasma is a super-heated gas that is so hot that the atoms have lost some electrons and so have become electrically charged (ionised). Plasma is generated by an electric arc in arc furnaces but plasma can be generated by specially designed equipment for a variety of furnace processes. The advantage of using plasma as a heat source is that it is extremely hot and so heat transfer is very efficient. Materials are heated very quickly which greatly reduce process times. As heat is lost throughout furnace processes (through walls, water cooling, etc.), heat losses are reduced by shortening the process time.
Infrared Infrared radiation is a type of electromagnetic radiation that can be used to very efficiently heat materials. Materials absorb infrared radiation to a varying extent depending on their emissivity. In practice, dark materials absorb infrared better than light coloured or metallic reflective surfaces. Infrared heating of bright metal surfaces is not effective whereas dark oxidised metals can readily be heated. Infrared energy adsorption also depends on the wavelength of the radiation and the material composition. Infrared is often used for drying materials and is also used for cooking food. Water readily adsorbs infrared radiation with wavelength of about 3µm.
Infrared radiation travels through gases such as air and vacuum in straight lines so the source of infrared can radiate heat directly to the parts that need to be heated with minimal heating of the air. It reflects off bright metal surfaces and so heating of ovens walls, etc. can be minimised and the energy efficiency of infrared heating can be high. Infrared light is generated by several methods. The wavelength of radiation emitted from metals depends on the temperature. As the surface temperature increases more infrared radiation is emitted but at very high temperatures, the surface glows white with visible light as well as infrared. The lowest cost source of infrared is to use gas burners (prices for gas kWh are usually lower than electricity kWh) where the gas flames heat specially designed infrared radiators including a metal mesh that glows red hot and radiates infrared radiation in a similar way to a gas grill used for domestic cooking. Electric infrared lamps and heaters

ERA Technology Limited ERA Report No. 2012-0230
043122753 ENTR Lot 4 Final Report v6 172 © ERA Technology Ltd
are also available. When an electric current is passed through a resistance wire it is heated to bright red heat and most of the energy emitted is infrared.
A case study published by the US Department of Energy showed that the replacement of gas burners in a continuous powder curing oven with natural gas catalytic infrared heaters which are flameless energy efficient directional heaters was able to reduce the plant’s gas consumption by 25% as well as increase productivity105.
Induction “Induction” heating is used to heat metal for heat treatment, pre-heating for subsequent processes such as extrusion or for melting. Induction melting is used to recover metals from scrap and in foundries to melt metal prior to casting. Induction heating does not always need to be within an enclosed and insulated chamber if no melting occurs and these processes are not regarded as types of furnaces. Induction furnaces can be of various designs including heated crucibles in which the steel crucible is heated by induction and in vacuum furnaces to heat oxidisable metals such as for steel heat treatment. Induction heating in vacuum furnaces is energy efficient as only the metal parts inside the coil are heated.
Induction heating is possible only for metals (as a current must be induced in the material) and is most efficient for magnetic metals. The process involves passing a high frequency alternating current (AC) through a copper coil that surrounds the metal part to be heated. The AC current in the coil creates an alternating magnetic field that induces eddy currents within the metal by “Joule heating”. Low resistivity metals such as aluminium and copper are less efficiently heated than metals with higher resistivity. Most of the heat is generated within the surface of the metal and this is rapidly conducted internally. However induction heating is ideal for heating only the surfaces of metals such as for carburizing metals where induction heating is used for surface hardening. In this process, only the outer 10% of the metal is heated and so uses only 10% of the energy that would be consumed by a thermal carburizing furnace106. Induction furnaces use frequency converters that convert mains AC to higher frequencies at over 90% efficiency whereas old stock in the EU may have equipment of only c. 50% efficiency. There are energy losses from induction heating, however, as the coils become very hot and need to be cooled. Induction coils are usually hollow copper pipes and cooling fluids (e.g. water) are pumped through the tubes to remove heat.
Superconducting magnetic Induction furnaces use high frequency magnetic fields to heat metals. A recent innovation is to use superconducting direct current (DC) magnets to create the magnetic field to induce heating of metals. The advantage of this technique over traditional induction heating is that the superconductor coil consumes no energy as its electrical resistance is zero. Some electricity is used to generate the AC and for cooling the superconductor but this is much less than is used by induction heating. Also, no water cooling is needed. DC magnets induce currents in moving metal parts such as in DC motors. To generate heat within the DC field, the parts need to be rotated in order to heat them. So far, only one application has been developed commercially for this technique which is for heating aluminium billets prior to extrusion but many other metals could be heated by this technique. The manufacturer 105 Progressive Powder Coating: New Infrared Curing Oven at Metal Finishing Plant Increases Production by 50%; US DoE, 18 Jun 2003; http://www.p2pays.org/ref/32/31228.pdf 106 Information provided by stakeholder

ERA Technology Limited ERA Report No. 2012-0230
043122753 ENTR Lot 4 Final Report v6 173 © ERA Technology Ltd
(Zenergy Power) claims that heating aluminium billets with superconducting magnetic heating consumes 140KWh/tonne whereas induction heating consumes 230 kWh/tonne and gas heating consumes 370 kWh/tonne although gas is a primary energy source unlike electricity which has generating losses. Zenergy Power believes that this heating process could be used for metal melting but more research will be needed.
RF Dielectric heating RF Dielectric heating is similar to microwave heating except that lower frequencies tend to be used e.g. 13.56 and 27.12MHz, whereas a domestic microwave oven uses 2.45 GHz. The RF field is generated electronically instead of by magnetrons that are used for microwave heating. The material to be heated (dried) is placed between two plates (like the electrodes of a capacitor) and the imposition of the RF field causes water molecules to become hot and boil. RF heating is mainly used for drying materials such as food and wood glue107. As RF heating uses lower frequencies than microwave, higher power levels are achievable. Induction heating of metals also uses RF fields but these tend to be of lower frequencies.
Microwave heating Microwave ovens are very familiar for cooking food and microwave heating is used for a variety of laboratory and industrial processes. Commercial microwave heating uses a higher frequency than RF dielectric heating and the RF energy is generated by a magnetron. Laboratory microwave assist dental furnaces for manufacture of zirconia implants are sold in the EU108 and are claimed to save up to 90% of energy compared to standard electric furnaces as well as giving considerably shorter heating times and improved product quality (stronger and more dense dental implants). Industrial microwave oven are also used because of the very significant energy savings and shorter process times and uses include109:
• Ceramic parts sintering, alumina, cemented carbides, silicon carbide, lithium-ion battery cathodes (faster process and energy saving >50%)
• Calcining ceramic powders such as capacitor dielectric barium titanate, phosphors, etc. • Sintering metal powders such as titanium to make parts • Cooking food • Drying, sterilizing and curing materials. Research in Japan indicates that microwave heating can be used for steel production and a patent application states that microwave melting of copper consumes less energy; conventional electric heating = 48% efficient whereas microwave heating = 60% efficient110. These figures are electricity heating efficiency, not primary energy efficiency.
107 www.strayfield.co.uk 108 For example www.sinteringovens.com 109 “Ceramic Processing Using Microwave Assist Technology”, H. Shulman, M. Fall and P. Strickland, American Ceramic Society Bulletin Vol 87 (3), p.34. and www.greenprogress.com/green_building_article.php?id=1503 110 “Microwave metal melting furnace” US 2010/0032429 A1

ERA Technology Limited ERA Report No. 2012-0230
043122753 ENTR Lot 4 Final Report v6 174 © ERA Technology Ltd
Microwave heating is used in laboratory ovens mainly for technical reasons although these processes can consume less energy than the equivalent processes in traditional ovens and furnaces. One technique is to dissolve materials in strong acid or alkali. This is used for ceramics, metals, minerals, etc. and requires a high temperature. Where the material dissolves only very slowly, the acid or alkali will normally boil away before the process is complete and so more must be repeatedly added. This is avoided and the reaction temperature increased which accelerates dissolution by carrying out the reaction inside a sealed pressurised container known as a “bomb”. These are heated in laboratory microwave ovens and are made typically of fluorinated polymers such as PTFE which is not affected by microwave radiation whereas the acid or alkali inside the bomb heats up to a high temperature and rapidly dissolves the material with no losses of solvent by evaporation of by-products as vapours. The main advantage of microwave heating is that the microwave energy is adsorbed mainly by the parts being heated, not the furnace itself. However, compared to gas heating, microwave heating may not be so efficient because electricity generation is only c. 30% efficient and microwave generation is up to 70% efficient and so is only 20% primary energy efficient. However, when much less heat is lost heating the walls of the furnace, this option can give energy savings. Recent research with large continuous ceramics kilns showed that gas was more energy efficient than microwave heating and that microwave could be used only for simple shapes without sharp edges111.
Heat recovery equipment and processes The energy efficiency of many thermal manufacturing processes, especially with older installations, is poor due to heat losses but this can be significantly improved by recovery and reuse of heat that would otherwise be lost. There are many different ways that this is carried out. Some examples are:
• Recuperative and regenerative burners (see page 157); • Heat exchangers – to recover heat from combustion gases to produce hot air that can be used for
drying, etc.; • Hot air from cooling hot product can be used for drying materials; • Hot combustion gases can be used to preheat raw materials; • Hot air can be used for burners; • Excess heat can be used to generate electricity or produce steam; • Excess heat can be used elsewhere such as for building heating or in different processes. Examples from production processes include:
• The use of hot air from cooling hot cement clinker is used for drying and pre-heating the raw materials (hot combustion gases are also used for pre-heating);
• The hot combustion gases flow in the opposite direction to the movement of ceramics (e.g. bricks) in tunnel kilns to pre-heat the ceramic parts and utilise the heat in the combustion gases;
• The benefit of using hot combustion gases for preheating is clearly demonstrated by comparison of batch shuttle and continuous tunnel kilns for tableware manufacture, The flue gas temperature
111 Information provided by Cerame Unie

ERA Technology Limited ERA Report No. 2012-0230
043122753 ENTR Lot 4 Final Report v6 175 © ERA Technology Ltd
from shuttle kilns is typically 800°C whereas the flue gas temperature from tunnel kilns which use the hot flue gas to pre-heat cold unfired tableware is 120 - 170°C112.
• Steel production can have a high overall energy efficiency due to re-use of recovered heat. Heat is recovered, for example, from: - Hot gases from the blast furnace; - Hot gases from the basic oxygen furnace; - Hot steel is used immediately for further processing (e.g. rolling, forming into shapes, etc)
avoiding cooling then the need to re-heat cooled slabs; - Energy is generated from combustion of carbon monoxide produced in the blast furnace; - The recovered heat is used to pre-heat and dry raw materials, generate electricity, etc. but is
not used directly within the furnace that it is generated. Another way to utilise heat from hot products is with heat transfer chambers. These are insulated chambers with no external heat source. A load that has been heated in a furnace or oven is removed while still hot and placed in the heat transfer chamber which also contains a cold un-heated charge. As the hot parts cool this pre-heats the cold parts before they are placed inside the oven or furnace113.
Furnace and oven process control Energy can be wasted if furnace process control is poor. For example:
• If the process temperature is higher than necessary; • If the heating time is longer than necessary – for example for heat treatment of alloys; • If the temperature control is imprecise causing overshoot and fluctuations in temperature; • If heating time is too short or the temperature is too low so that the process must be repeated. To avoid all of these issues requires accurate temperature measurement inside the oven or furnace as well as good control of the heat input. Laboratory ovens and furnaces usually have only one temperature sensor but industrial furnaces may have many sensors including sensors that measure the temperature of the material being processed as wall as the wall or atmosphere temperature. Thermocouples are widely used but have limited maximum temperatures. Higher temperatures are more difficult to measure accurately and infrared sensors are one option. Furnace and oven control is often by PID (Proportional Integral Derivative) controllers that are often used with laboratory ovens and furnaces, PLC (Programmable Logic Controller) or for larger installations by DCS (Distributed Control System) or by sophisticated computerised control systems that monitor and adjust all aspects of the furnace or oven.
Furnace temperature control – The temperature of all furnaces need to be controlled as processes have optimum temperatures but some types need a wider range of temperature control 112 IPPC BREF guide to ceramics 113 Nabertherm sales brochure.

ERA Technology Limited ERA Report No. 2012-0230
043122753 ENTR Lot 4 Final Report v6 176 © ERA Technology Ltd
because the furnace is used for a variety of different processes. For example, heat treatment of metals requires specific temperatures for each alloy and treatment process. The temperature of electrically heated furnaces is easily controlled by adjusting current but control of gas furnaces is less straightforward. Adjustment of heat input can be controlled in a variety of ways but some are more energy efficient than others. Controlling heat input by switching gas on and off can be efficient but if the furnace is at <750°C electrical igniters are needed to re-ignite the gas to comply with EN746. Some burner designs can be “turned-down” to some extent to reduce heat input. Both gas and air flow should be reduced to maintain the gas/air ratio (and avoid dangerous gas/air ratios) but this also reduces the volume of combustion gases so that less heat convection occurs which can reduce heat transfer, temperature uniformity within the furnace and could affect product quality. As a result some operators simply increase the air flow into the furnace and this cold air cools the gases inside the furnace but this option wastes heat energy. Similarly decreasing the gas to burners but not the air flow reduces efficiency and can create an explosive gas/air ratio.
Fuel/air ratio control. Unless a reducing atmosphere is needed, then a small excess of oxygen is required to ensure that all of the fuel is fully burned with maximum energy output. With insufficient oxygen, some fuel may be unburned, toxic carbon monoxide is produced and less energy is generated and so it is standard practice to use a small excess of oxygen or air. Excess cold air however absorbs heat and thus cools the combustion gases which makes heat transfer less efficient. The impact of increasing excess air can have a large effect on energy efficiency so the gas/air ratio should be carefully controlled. Fuel/air ratio has a large enough impact on energy consumption for it to be regulated in Japan. The Japan Energy Act regulates the maximum air ratio in larger Japanese furnaces (see section 1.5.3). Typically, about 15% excess air is used (ratio of actual fuel:air mix and stoichiometric mix = 1.15). Air contains 21% oxygen so a fuel:air mix with 15% excess air will contain an excess c. 2.5% oxygen. Higher excess air ratios are needed if fuel/air mixing is not good and the optimum ratio also depends on burner design and fuel type. The fuel:air ratio is controlled by a variety of methods. The best technology is to measure the oxygen content of the flue gases using oxygen sensors in the flue but this is straightforward only if there is a single burner or if the design can guarantee that all burners have identical fuel/air ratios but this is difficult to achieve. This gives a real-time accurate measure that can be used to adjust the ratio if needed. This is not used universally however and simpler less accurate methods are common. In many installations, including some with large furnaces, the ratio is adjusted manually by controlling the gas and air flow rates using flow regulators. This is less accurate and flow rates can vary due to temperature and pressure changes. In continuous processes operating under well-controlled steady state conditions, this is a reasonable approach as no adjustments to flow rates would be expected and so daily monitoring of fuel consumption will give an indication of non-ideal fuel:air ratios which require adjustment.
Other burner control techniques include:
• Burner modulation control - Many gas burners use a single firing rate which is controlled by a thermostat in the furnace. When the set temperature is reached, the gas and air are switched off and when the temperature drops below a set point, they are re-ignited. This is fairly common and simple to operate and can give reasonable temperature control although with a certain amount of temperature variation around the set point. Modulating burners have variable gas and air flow inputs so that the heat input to the furnace can be reduced as the set point is approached. This gives more precise temperature control and, as over-heating is avoided, reduces energy consumption;

ERA Technology Limited ERA Report No. 2012-0230
043122753 ENTR Lot 4 Final Report v6 177 © ERA Technology Ltd
• Cross-limiting (air:fuel ratio) – Too much excess air wastes energy and so the gas:air ratio needs to be controlled for optimum energy efficiency. Control of the flow of gas and air is complex because it is the ratio of the masses of air and gas that are important and these vary at a fixed volume flow rate when the pressure and temperature change114 . There are several ways of controlling gas:air ratio such as separate control of gas flow rates (parallel flow) but cross-limiting control is more accurate. Both the gas and air flow are controlled and adjusted to match each other and provide the required heat input. Flow rates are also controlled within safe limits. Oxygen and carbon monoxide sensors in flue gases are also used to ensure safe and optimum burner control. Most controllers measure volume flow of gas and air and so are affected by pressure and temperature changes. Mass-flow controllers are more expensive and can be used although some cross-limiting controllers are able to also measure temperature and pressure and compensate volume flow accordingly;
• Oxygen trim controllers – These use oxygen analysers to measure the oxygen concentration in flue gases to control the air:gas or air:oil ratio. Oxygen analysers are moderately expensive and require regular maintenance and calibration so are not used in all large furnaces and are uncommon in medium size furnaces. Carbon monoxide sensors may also be used to ensure that maximum efficiency is being achieved;
• Close coupled control – This is used for metals heat treatment where a temperature sensor is inserted into the metal being heat treated. The furnace burners are controlled so that the temperature profile experienced by the metal is optimised so that it is not over-heated, which wastes energy or under-heated meaning that the heat treatment will be incorrect and need to be repeated115.
Internal pressure control – Furnaces and ovens can operate under positive or negative pressure depending on their design. If there are exhaust fans in the flue, these suck gases out of the furnace which can create a low pressure inside the furnace. Fans blowing air into the oven or furnace can conversely create a high pressure. Low pressure results in cold air from outside being sucked in. This requires heat energy to maintain the internal temperature and so is a source of wasted energy. High pressure can be hazardous if the interior contains toxic gases such as carbon monoxide but also wastes heat energy. It is therefore normal to carefully control the internal pressure inside furnace and oven chambers to minimise leaks in or out via door seals, etc.
Other components of furnaces and ovens Furnaces and ovens use electric motors for conveyors, opening doors, fans, pumps, blowers, etc. and these can consume a considerable amount of energy. Electric motors have already been studied by DG TREN Eco-design preparatory study Lot 11 which resulted in Regulation 640/2009. This Regulation, however, excludes many motors used in ovens and furnaces but further regulations are proposed for fans and further studies will be carried out on electric motors not covered by 640/2009 and also compressors and pumps. Therefore these will not be considered as part of this study although they do offer a potential for energy savings. For example, a manufacturer has calculated that the use of frequency converters (variable speed drives) for electric motors in a ceramics furnace could save over 3% of the energy consumed by drying oven fans with a payback time of less than 114 http://www.energysolutionscenter.org/boilerburner/Resources/Primer/Primer_Chap4.pdf 115 Modulating Burner Combustion Control for Heat Treatment Furnaces; Eurotherm website; Dec 2010; http://www.eurotherm-heattreatment.com/products/solutions/metals/modulating-burner-combustion-control/

ERA Technology Limited ERA Report No. 2012-0230
043122753 ENTR Lot 4 Final Report v6 178 © ERA Technology Ltd
1 year. However, this is not further considered as an eco-design option because it is viable only for some designs, and the benefit will be very variable. Furthermore, variable speed drives are also covered by Eco-design studies of motors, and it is assumed that motors will be compliant with present and future ecodesign requirements, except where specific exceptions may be granted in the associated motors ecodesign Implementing Measures, regarding suitability, practicality, etc of the application.
4.2.3 Furnace and oven design – impact on energy consumption Design is the most important variable that affects energy efficiency and can also affect the amounts of hazardous emissions.
Batch versus continuous processes The choice between batch and continuous furnaces depends on many variables and it can affect the energy consumption per unit weight of material being processed. Throughput is one of the main considerations but there are many other reasons why one of these options is used. Batch processing is often the only viable option for some processes as the throughput would be too small for a continuous process. Although relatively small continuous ovens and furnaces are available, these are viable only if there is sufficient throughput to allow them to operate continuously. If for example a continuous furnace such as a tunnel kiln is operated with only 10% of its capacity, it would consume far more energy than a batch kiln that was full. Switching complex high temperature kilns off when not needed is not straightforward as they can be damaged if cooled too quickly or even if they are operated empty. Shut down requires very slow cooling and furnace can consume a lot of energy when switched off to cool down for maintenance. Some industry sectors use both batch and continuous processes depending on the materials throughput. New industrial furnaces for the manufacture of bricks and roof tiles are all tunnel kilns. New furnaces for the manufacture of ceramic tiles, sanitary ware and some other ceramic products are roller kilns, which are a different design of continuous furnace. These tunnel and roller kilns can be the most energy efficient designs for these products and also have lower labour costs than batch processes but this depends on production volumes and process requirements. Artisans and educational establishments however usually fire ceramics in small batch furnaces due to small volume production. The energy consumption per tonne of product can be much larger for batch processes than for continuous processes, for example.
• Batch biscuit firing porcelain in chamber kiln Energy consumption 2.3 kWh/kg; • Continuous biscuit firing porcelain in tunnel kiln Energy consumption 1.04 kWh/kg. In practice, the energy consumption depends on other factors, especially kiln furniture which is discussed below but the data above correspond to processes where the weight ratio of porcelain to kiln furniture are both 1:1. The very large difference in energy consumption per kg product is due to the heat lost by the furnace itself when the fired porcelain is cooled inside the furnace before it is removed. In the continuous process, cooling air is passed counter-current over the emerging fired and hot porcelain so that the porcelain gradually cools and the cooling air temperature rises until it is sufficiently hot to be used to preheat and/or dry the cold unfired porcelain so that the energy is not lost. Also, the insulation inside a continuous furnace remains hot whereas the heat adsorbed by the insulation inside a batch furnace is lost when the furnace cools. Figure 11 shows a batch furnace being unloaded. Heat is lost from the interior of the kiln via the open door when the load is removed.
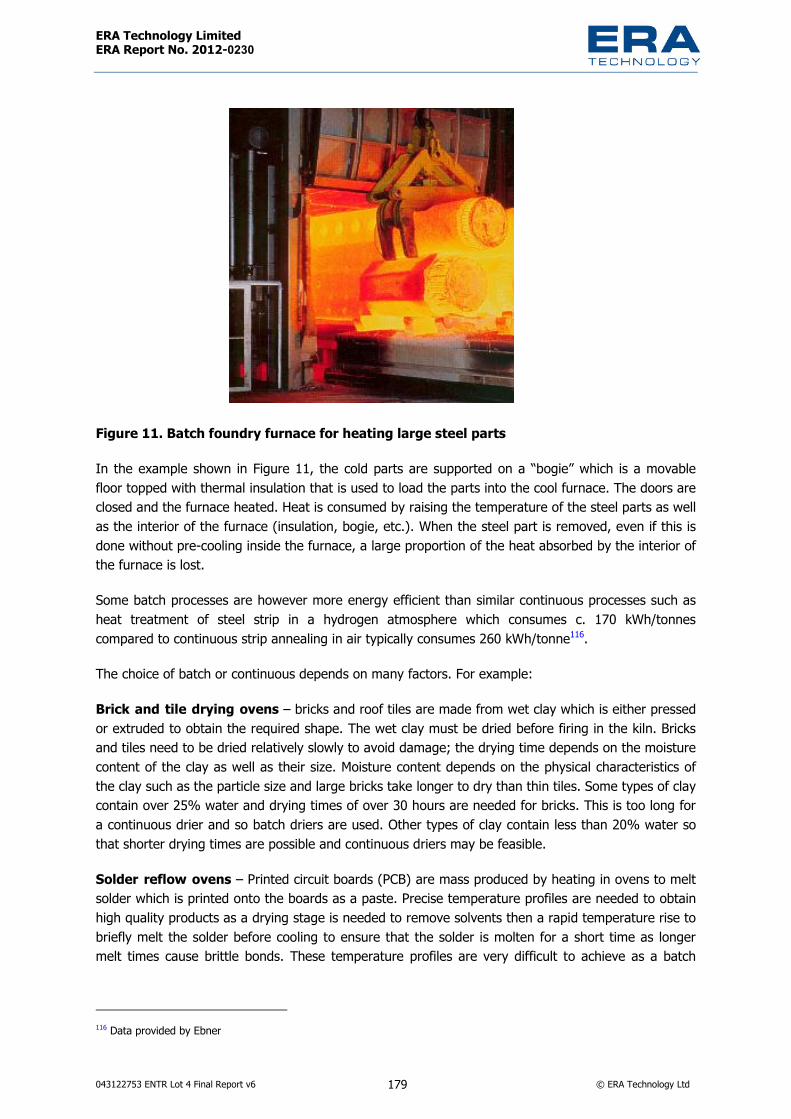
ERA Technology Limited ERA Report No. 2012-0230
043122753 ENTR Lot 4 Final Report v6 179 © ERA Technology Ltd
Figure 11. Batch foundry furnace for heating large steel parts
In the example shown in Figure 11, the cold parts are supported on a “bogie” which is a movable floor topped with thermal insulation that is used to load the parts into the cool furnace. The doors are closed and the furnace heated. Heat is consumed by raising the temperature of the steel parts as well as the interior of the furnace (insulation, bogie, etc.). When the steel part is removed, even if this is done without pre-cooling inside the furnace, a large proportion of the heat absorbed by the interior of the furnace is lost.
Some batch processes are however more energy efficient than similar continuous processes such as heat treatment of steel strip in a hydrogen atmosphere which consumes c. 170 kWh/tonnes compared to continuous strip annealing in air typically consumes 260 kWh/tonne116.
The choice of batch or continuous depends on many factors. For example:
Brick and tile drying ovens – bricks and roof tiles are made from wet clay which is either pressed or extruded to obtain the required shape. The wet clay must be dried before firing in the kiln. Bricks and tiles need to be dried relatively slowly to avoid damage; the drying time depends on the moisture content of the clay as well as their size. Moisture content depends on the physical characteristics of the clay such as the particle size and large bricks take longer to dry than thin tiles. Some types of clay contain over 25% water and drying times of over 30 hours are needed for bricks. This is too long for a continuous drier and so batch driers are used. Other types of clay contain less than 20% water so that shorter drying times are possible and continuous driers may be feasible.
Solder reflow ovens – Printed circuit boards (PCB) are mass produced by heating in ovens to melt solder which is printed onto the boards as a paste. Precise temperature profiles are needed to obtain high quality products as a drying stage is needed to remove solvents then a rapid temperature rise to briefly melt the solder before cooling to ensure that the solder is molten for a short time as longer melt times cause brittle bonds. These temperature profiles are very difficult to achieve as a batch
116 Data provided by Ebner

ERA Technology Limited ERA Report No. 2012-0230
043122753 ENTR Lot 4 Final Report v6 180 © ERA Technology Ltd
process so continuous processes are nearly always used for manufacturing, even for relatively small numbers of PCBs.
Vacuum heating – The need for a vacuum makes batch processing the only option as obtaining a vacuum within a continuous process is very difficult.
Metals heat treatment – Information from a manufacturer of medium size heat treatment furnaces is that three methods are used. Induction heating, usually batch, vacuum heat treatment which is a batch process whereas heat treatment in air is either batch or continuous (50% of each) and most are electrically powered in EU.
Industrial custom designed ovens – A stakeholder has reported that the proportion of continuous industrial ovens sold in EU has declined over recent years from 20% ten years ago to only 5% today. The main reasons given by this stakeholder are the high cost of floor space (batch ovens are smaller) and a decrease in labour cost in the original EU15 States due to cheaper labour from the newer EU States (batch processes can be more labour intensive). Another possible reason is that large-scale production that would use continuous processes is often relocated to Asia whereas smaller-scale production remains in EU.
Indirect and direct heating of ovens Gas heating for ovens and furnaces can be direct or indirect. Direct heating uses burners inside the oven (or furnace) to directly heat the air inside the oven. Combustion gases mix with air to obtain the required temperature. Indirect heating avoids combustion gases from coming into contact with the materials inside the oven (or furnace). The hot combustion gases pass over a heat exchanger which heats air that flows into the oven. Direct heating consumes less fuel than indirect because there are less sources of heat loss:
• Direct – combustion gases • Indirect – combustion gases and excess heated air These two options are used in ovens for a variety of processes but are particularly important for baking food. Both options are used in continuous tunnel ovens for bread, biscuits and other types of food whereas indirect is predominantly used in batch bakery ovens. Batch bakery ovens often also inject steam into the cooking chamber so that indirect is the only viable option. The Carbon Trust has investigated with SKM Enviros the difference between direct and indirect bakery ovens 117 . This showed that less than 20% of the input energy of an indirect oven is transferred to the food whereas with a direct oven, nearly 40% is transferred to the food. Manufacturers of tunnel bakery ovens have reported that most new tunnel ovens sold in the EU are direct ovens but one manufacturer has recently sold less efficient indirect ovens because their customers believed (incorrectly) that this was necessary for cooking oil-rich food. Heat exchangers to recover waste heat from combustion gases or from hot damp air is uncommon with tunnel ovens although these are available from a few Danish suppliers118 although these are intended for indirect ovens. They could however also be used to reduce the fuel consumption of direct tunnel ovens but this is very uncommon.
117 “Industrial Energy Efficiency Accelerator. Guide to the Bakery Sector” Monday 20th September 2010, Al-Karim Govindji, Carbon Trust, Pat Horne, SKM Enviros. 118 http://www.haas.com/en/products/meincke/biscuit-plants/short-dough-biscuits/biscuits.html

ERA Technology Limited ERA Report No. 2012-0230
043122753 ENTR Lot 4 Final Report v6 181 © ERA Technology Ltd
Ventilation Ventilation may be required for several reasons and is an important variable in all sizes of oven and furnaces. Where fuels such as coal, oil and gas are burned the combustion products need to be removed. In some processes such as metals smelting, cement production and waste incineration, hazardous substances are produced as gases and as dust and so controlled air flow through the furnace is needed to carry these substances to the scrubbers which collect these substances for safe disposal.
Ovens are often used to dry parts or materials in which case air is needed to flow through the chamber to carry water or solvent vapour away. Curing some types of coatings produces organic substance by-products which need to be removed. Drying materials can also be carried out in a vacuum oven which avoids the need for ventilation but there is additional energy consumption by the vacuum pump and heat transfer to the material can be slow as convection will not occur.
Drying ovens are designed to exchange the internal air in a controlled way to remove water or solvent vapour. All of the air entering the oven must be heated to the operating temperature and so this should be with a minimum number of air changes per hour to minimise energy losses from this heated air. From a review of technical data-sheets for laboratory ovens available in EU, it is apparent that the number of air changes varies considerably although the actual number is set by the user although this will often be the maximum. This will shorten drying times but use the most energy. Typical examples are:
Table 77. Examples of laboratory oven ventilation data Oven brand and model Internal volume Air changes per hour Thermo Scientific Blue M Deluxe with forced air convection
71 litres 61 times
Version without fan 57 litres 8 times Thermo Heraeus hot air steriliser Version with fan 64 litres 50 times
Carbolite oven with internal fan AX 30 28 65 times AX60 66 28 times AX120 128 14 times Carbolite PF 30 28 Internal fan only 50 times
With external exhaust fan 360 times Carbolite PF800 910 15 times
In general there are fewer air changes per hour with large ovens than with small ovens but there is considerable variation even within the range of one manufacturer. A large number of air changes per hour has the advantage of faster drying but energy costs would be higher. The use of an internal fan gives better temperature control within the oven but it also appears to increase the frequency of air changes. Some electric ovens have vents (manually operated) that can be closed if no drying is required and this clearly reduces running costs. Users need to consider all of these variables and their own specific requirements when selecting the most appropriate oven but users of smaller ovens will aim for the fastest drying time with fully open vents and will not consider energy consumption which will be considerably higher with open vents than if these are closed.

ERA Technology Limited ERA Report No. 2012-0230
043122753 ENTR Lot 4 Final Report v6 182 © ERA Technology Ltd
Design with kiln cars and other kiln furniture Figure 11 shows how equipment used to support parts inside the furnace is a source of lost heat. Kiln cars and other types of supports absorb energy inside the furnace during the heating cycle which is then lost when the parts are removed. Heat loses occur in both batch and continuous furnaces and so manufacturers aim to minimise the use of kiln furniture and if possible avoid using it altogether. There are several designs of continuous ceramic production furnaces with tunnel kilns and roller kilns being the most commonly used for new furnaces. Materials pass through tunnel kilns on kiln cars whereas material passes through roller kilns on the rollers. Therefore, if no other supports are needed, roller kilns consume less energy as no kiln cars are required. Large and heavy ceramic items such as bricks and roof tiles cannot be heated in roller kilns for several reasons:
The firing temperature is >1000°C and for some clays >1100°C. This is too hot for mild steel and stainless steel without water cooling and this would cause large heat losses. High nickel alloys are not used because at these high temperatures, they are relatively soft and will distort under the load (typically 1 kiln car with bricks weighs 16 tonnes). Ceramic rollers do not need water cooling and are suitable at these temperatures but the length of rollers is limited to 4.5 m which is too short for brick and roof tile kilns which need to be wider. If these were used, the kiln would need to be far longer and space is often not available for very long kilns. Also, ceramic rollers cannot be used for very heavy weights as they would break. Brick and roof tile manufacturers therefore have no other choice and always use tunnel kilns with kiln cars. Roof tiles also need to be supported in “cassettes” which can weigh more than the tiles. It is a general rule that the best quality tiles require the highest mass support cassettes. Ceramic cassettes absorb heat and although some is recovered by reuse of heated cooling air, residual heat in cassettes that emerge from the kiln is lost.
Lighter ceramics such as ceramic wall and floor tiles are made in roller hearth furnaces with no kiln furniture. Small ceramic items such as some types of tableware need to be supported inside the furnace to prevent damage and distortion and also so that they can be stacked to fill the kiln.
The use of kiln furniture to support the ceramic parts can make a big difference to energy consumption per kg of ceramic as illustrated in the example below.
Table 78. Impact of kiln furniture on energy consumption of ceramic kiln used for porcelain production
Process Kiln furniture mass Energy consumption Roller hearth continuous furnace for biscuit porcelain
None 0.83 kWh/kg
Tunnel continuous kiln with stacked biscuit porcelain
Mass is equal to mass of porcelain 1.04 kWh/kg
The choice of material used for kiln furniture has a significant impact on energy consumption and ideally low density lightweight ceramic materials are used such as HTIW in the form of solid boards and blocks. A range of special, low thermal mass materials have been developed for the construction of cassettes and other support structures. This has also been shown to be important for bread ovens where the materials used for the tins can make a large difference to energy consumption. This showed that by changing tin materials, it is possible to reduce gas consumption by least 5%.

ERA Technology Limited ERA Report No. 2012-0230
043122753 ENTR Lot 4 Final Report v6 183 © ERA Technology Ltd
Minimising water cooling The three most significant sources of heat loss by furnaces are in flue gases, through furnace walls and from water cooling. The main reason for water cooling is to protect parts of the furnace from damage due to high temperatures. Most metals expand more than ceramics and so, without cooling, metal parts that are supported within ceramics would expand and could damage the ceramics. The combination of metals inside ceramics is used for bearings and rollers and so these may need to be cooled. Another reason is to protect parts which cannot be adequately insulated from the very high temperatures that are utilised such as in plasma and electric arc furnaces. The metal base and wheels of kiln cars used for bricks in tunnel kilns are air cooled and the hot air produced is used elsewhere in the process but air cooling is not suitable if very high heat flow rates are needed. The temperature attained close to the plasma in an arc furnace is so high that there are no known materials which can withstand these temperatures and so effective water cooling is essential. Ion beam furnaces are used to melt refractory metals which when molten would attack all types of ceramic and metal and so water cooled copper hearths are used to freeze a layer of the metal that is being melted so that it is in contact only with itself and so no contamination occurs.
Induction heating. Induction furnaces use coils made of copper tube to create the radio frequency (RF) that induces heating of the material to be heated. A large current is passed through the copper coil and cooling with water or other fluids is needed to prevent it from melting.
Electric arc furnaces. Water cooling of the walls of electric arc furnaces is essential because the refractories would be rapidly destroyed by the molten slag (which is corrosive to refractories) and steel if this becomes too hot. In furnaces with gas burners, the heat input can be reduced when the operating temperature is reached so that, at equilibrium, the heat input is equal to the losses and the insulation does not become too hot. An electric arc cannot however be turned down as reducing the electric current would cause it to stop. As the heat input cannot be reduced, this would exceed losses through the walls of the furnace so that they would over-heat without cooling. The amount of heat lost in electric arc furnaces as a result of water cooling has been reduced so that in modern designs, typically only 4.5% of heat is lost as water cooling and some of this hot water can be used elsewhere.
Vacuum furnaces. A variety of thermal processes are carried out in vacuum to prevent oxidation of metal surfaces. These include heat treatment and brazing. There is no convection or conduction heat transfer through a vacuum and so only radiation heat transfer is possible. Electric heating located within the furnace around the parts radiate in all directions. Reflectors minimise some losses but inevitably, the sides, roof and floor will be heated. Thick insulation can be used to prevent the external surface becoming dangerously hot but this is a problem when heating is complete and the parts need to be quenched as the insulation retains heat and thus slows the rate of cooling. Many heat treatment processes require specific high rates of cooling which is difficult to achieve with very thick insulation. The alternative is to water cool the exterior of the furnace by passing water through a double skin of stainless steel with less insulation being used (usually graphite) inside the furnace. This not only ensures that the exterior is at a safe temperature but also aids cooling after the heating cycle is complete. A lot of heat energy is however lost as it is difficult to recover or reuse heat energy from water below 100°C although this is possible and is utilised by many manufacturers although usually in other processes or for building heating.
Continuous steel heat treatment furnaces. Furnace design can limit heat losses due to water cooling, the following are examples of continuous steel heat treatment furnaces.
• Pusher furnaces – Requires water cooled skids

ERA Technology Limited ERA Report No. 2012-0230
043122753 ENTR Lot 4 Final Report v6 184 © ERA Technology Ltd
• Walking beam – have water cooled steel beams topped with refractories to move the steel parts through the furnace. Suitable for heating very large slabs of metal
• Walking hearth – use moving refractory hearths and much smaller water cooling heat losses than walking beam. Heated from above only so not suitable for very thick sections
• Rotary hearth – no water cooled skids used but furnaces can be more expensive than other designs although is one of the most energy efficient. These are suitable mainly for relatively small parts as 25 tonne steel slabs are too large and have to be heated in walking beam or pusher furnaces
• Roller hearth – water cooled rollers to prevent distortion of the ceramic coated metal rollers. Relatively expensive design but is used for heat treating very long parts.
It is important to note that each of these furnace designs have advantages and disadvantages and so the design chosen will depend on many variables, especially the size of parts being heat treated. Tenovia estimate that water cooling of skids in walking beam furnaces looses 5% of heat energy input. Cold water cooling produces hot water but evaporative cooling which produces steam is preferable as energy recovery from steam is more efficient as it can recover 25% of the available heat from the steam. This however will cost about 20% more than cold water cooling with a payback period of 2 – 3 years.
Heat resistant rollers Continuous furnaces can use rollers to support the parts that are being heated. These are used in metal heat treatment and for firing ceramics, and water cooling of the rollers may be needed to prevent distortion of metal and ceramic rollers at high temperature. The upper temperature limit for carbon steel is c. 300°C, for stainless steel rollers is c. 900 °C and for Inconel 601 it is 1170°C although some types of ceramic roller can withstand 2000°C. Alloy heat treatment temperatures can be at up to 1000°C and occasionally higher for some stainless steels whereas ceramics manufacturer (tiles, bricks, etc.) requires temperatures of up to c.c. 1500°C .
Very long rollers can be made of metal although high density ceramics rollers with a high alumina content, silicon carbide or amorphous silica which can withstand higher temperatures but their maximum width is limited (maximum 4.5m). Steel is rigid at ambient but at high furnace operating temperatures it softens and so could sag. This is not acceptable in ceramic kilns or steel heat treatment furnaces. Some roller designs use water-cooled steel cores with an external layer of ceramic as any distortion is unacceptable.
For processes at up to c. 1100°C, an alternative to water-cooled carbon steel is rollers made from alloys with high nickel content. These can be used without water cooling and so, although the alloy is much more expensive than carbon steel, there is an overall cost saving. Literature from one manufacturer that produces rollers of alloy 62CA (Ni + 25%Cr, 10%Fe with other minor additives) claims that rollers made of this alloy have a long life with no distortion and they give an example of the savings for a typical furnace. The figures quoted are119:
• Water consumption = 3m3/h • Energy loss per roller = 25 KW/h (at €0.05 per kWh)
119 BUTTING HeRo®

ERA Technology Limited ERA Report No. 2012-0230
043122753 ENTR Lot 4 Final Report v6 185 © ERA Technology Ltd
• Operation 300 days per year, 24 hours per day • Total energy saving by not using water cooling = 300 x 24 x 25 x 0.05 = €9000 per roller per
year • Cost per roller €15,000. Payback time is less than two years as the additional cost is the difference between the 62CA rollers and the use of standard rollers plus there is no need for water cooling equipment and the manufacturer claims maintenance costs are lower.
Large furnaces have many rollers and so the energy saving is significant. Ceramic rollers are used in roller kilns for ceramics such as wall tiles, do not need water cooling and are much cheaper than high nickel-content alloys but they have disadvantages. Long ceramic rollers will sag at high temperature, cannot be made longer than 4.5m and if any encrustations form these can be difficult to remove unlike from metal rollers.
Design to avoid heat losses from openings (doors, leaks, etc.) A significant cause of heat losses is from leaks of hot gases out or cold air in through openings in the furnace or oven. Gaps in insulation occur if it is badly designed and this can be a problem with low priced ovens but may also occur after some years in service due to distortion, especially if the furnace is not used under the conditions for which it was designed. However, the most common sources of leaks are intentional openings – doors and lids. Doors of furnaces have seals but as these need to be flexible they can easily be damaged and leak. “Positive clamping” is used to ensure doors and other openings are sealed as well as possible. One manufacture claims that tightly sealed lids on metal melting furnaces save as much as 50% energy compared to furnaces without lids120.
To minimise leaks, it is important to install effective internal pressure control. Pressures can build up inside well insulated furnaces as the gases inside expand and the rate of loss of hot gases is proportional to the pressure. More often, however, hot gases exhaust out of the furnace through a vent and this gives a negative pressure so that cold air leaks into the furnace. This cold air needs to be heated and so energy consumption increases. Where toxic gases are present inside furnaces, it is normal to maintain a negative pressure so that leaks out of the furnace do not occur.
Loss of heat can occur when doors are opened to load or unload a furnace and this is clearly illustrated by Figure 11. With batch furnaces, this may be unavoidable but heat losses can be minimised from large continuous furnaces by the use of pairs of doors at the entry and exit which act as air/radiation-locks. At the entrance, the outer door opens to allow the load to move inside the furnace up to the second door. The first outer door is first closed and then the inner is opened to allow the load to pass through the continuous furnace. This rather complex arrangement is not used for furnaces and ovens which can be designed with small entrances and exists. These may be partly closed by some sort of flexible barrier to minimise air movement but the main method of preventing heat losses is by controlling the air flow within the chamber by fans and baffles and these are also used in batch ovens and furnaces to ensure that the temperature variation within the chamber is
120 http://www.nabertherm.com/produkte/details/en/giesserei_schmelzundwarmhalteoefen see “pneumatic lid opener for bale-out furnaces”.

ERA Technology Limited ERA Report No. 2012-0230
043122753 ENTR Lot 4 Final Report v6 186 © ERA Technology Ltd
minimised. A kiln manufacturer has stated that leaks from kiln cars that have distorted with use can increase energy consumption by up to 2%.
4.2.4 Distribution phase As mentioned above, laboratory and medium-size equipment is manufactured off-site and then transported to the user whereas very large installations such as steel production, cement kilns, brick kilns and glass melting furnaces are constructed from component parts on-site. Transportability depends on the size and weight of the furnace and oven. Some examples are listed below.
Furnace or oven Size / mass Typical small laboratory oven (example from Carbolite) 440 x 590 x 465mm, 24kg Large laboratory oven (example from Carbolite) 1 800 x 862 x 850mm, 285kg Continuous oven for soldering printed circuit boards (example from Heller Industries)
5 – 6m length, 1.8 tonnes
Nabertherm aluminium melting crucible furnace capacity 1 tonne metal model KB400/12
2 650 x 2 080 x 2 080, 3.3 tonnes
Nabertherm bogie hearth furnace (electrically heated, batch), 10 000 litre capacity, model W 10000
1 670 x 7 900 x 2 520, 11 tonnes
Small industrial roller hearth furnace (as used for firing ceramic tiles, example from Carbolite)
9m length, 420 tonnes
Tunnel kiln (continuous, gas) e.g. bricks at 100 tonnes/day 100m length Steel blast furnace (Port Talbot No. 5, UK) Capacity 2 560 m3, hearth diameter 10.8m
4.2.5 Use phase The principal consumable in the use phase of industrial and laboratory furnaces and ovens is energy but water is also used in some very large and a few medium-size and small furnaces for water cooling. There will also be maintenance and refurbishment requirements during the life of a furnace or oven which varies considerably depending mainly on the process being carried out. For example, a glass melting furnace requires regular replacement of the insulation that is degraded by the molten glass. The insulation of other types of furnace and oven where no contact with corrosive materials occurs can last a very long time as long as it is not physically damaged or abused, e.g. too rapid cooling, allowed to become wet when furnace not used, etc. Energy consumed may be more than one type as in the following examples.
Example oven / furnace Energy supplies Laboratory drying oven or muffle furnace
Electricity only for heating and sometimes also for fans and temperature controllers
Small (<1 tonne capacity) gas melting pot furnace
May require gas only unless electric temperature controllers are used
Gas-fired continuous kiln for ceramics Gas for burners, electricity for process controllers, motors, fans, pumps and blowers

ERA Technology Limited ERA Report No. 2012-0230
043122753 ENTR Lot 4 Final Report v6 187 © ERA Technology Ltd
Example oven / furnace Energy supplies Cement kiln Coal, oil and wastes as fuel, electricity for controls, fans, motors, etc.
although this may be generated from recovered heat
The energy consumed by a furnace or oven is not solely dependent on the design as they can in principal be used at a variety of temperatures, with a range of material throughput and for different periods of time and these affect energy consumption. The amount of energy consumed, particularly for industrial processes, depends on the process requirements. Energy is consumed as a result of:
• Raising the temperature of materials being processed • Raising the temperature of the furnace/oven and kiln furniture • Losses (from external walls, ventilation, flue gases, water-cooling, etc.) • Energy required for endothermic reactions • Energy for electrical equipment such as fans, motors, etc. However some of the input energy may be recovered so that the total heat input includes re-used energy. The approach commonly used to assess the energy consumption of an industrial process is by measurement of the energy per unit mass of product, e.g. MJ/tonne or kWh/kg. As described elsewhere in this report, these values are process-dependent with some processes requiring far more energy than others. This is not helpful with base case assessment and so an alternative approach will need to be used.
Laboratory furnaces and ovens – these tend to be used for fairly long periods even though the processes carried out inside them are batch. The energy required to maintain an empty oven or furnace at its maximum rated temperature is measured by some manufacturers but is not the same as the actual energy consumption as energy for heat-up from ambient and to heat materials also needs to be included. Typical real energy consumption values are therefore required to account for this as well as the number of hours in use but very little data of this type is available.
The energy consumption in the use phase for laboratory ovens and furnaces depends on how these are used, i.e. intermittently for a few hours per day or on continuously, but the design will also affect energy consumption. The main design parameters are the insulation and the control of ventilation. As no industry standard measurement method exists, manufacturers do not routinely measure the performance of their products although some measure the energy consumed to maintain the maximum rated temperature of an empty oven or furnace.
Data for the electrical energy consumption of ovens is shown below which plots oven temperature against electrical energy consumption per litre (cavity volume). These are standard ovens which are rated at either 250° or 300°C.

ERA Technology Limited ERA Report No. 2012-0230
043122753 ENTR Lot 4 Final Report v6 188 © ERA Technology Ltd
0
2
4
6
8
10
12
14
16
240 250 260 270 280 290 300 310Temperature (°C)
Elec
tricit
ycon
sump
tion(
Wh/l
)
Figure 12. Energy consumption per litre volume of cavity for maintaining maximum temperature of empty laboratory ovens
These results appear to show large differences in performance whereas it appears that the larger size ovens consume less energy per litre than the smaller ovens. This may be due to higher ventilation rates (and resultant heat losses) of small ovens rather than inferior insulation although some manufacturers carry out these tests with vents closed. A similar plot has been produced (below) for laboratory furnaces.
0
100
200
300
400
500
600
700
800
900
900 1000 1100 1200 1300 1400 1500 1600 1700 1800Temperature (°C)
Elec
tricit
ycon
sump
tion(
Wh/l
)
Figure 13. Energy consumption per unit volume (litres) of empty laboratory furnaces at maximum rated temperature
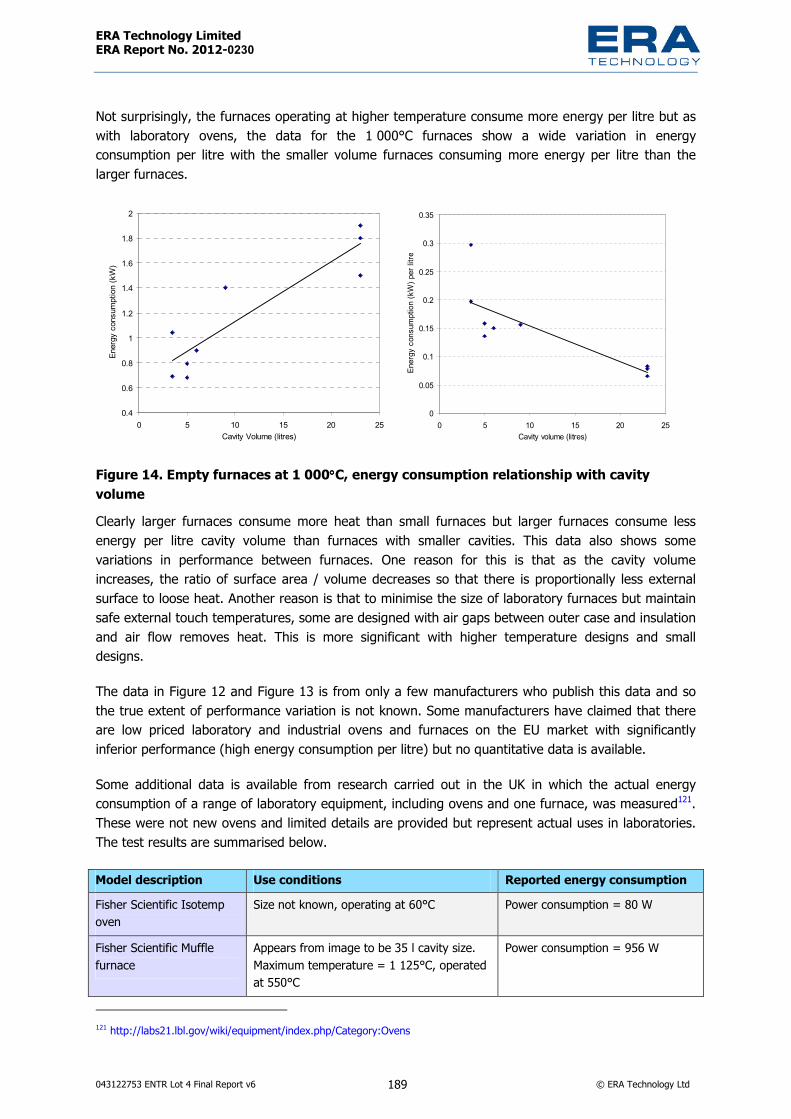
ERA Technology Limited ERA Report No. 2012-0230
043122753 ENTR Lot 4 Final Report v6 189 © ERA Technology Ltd
Not surprisingly, the furnaces operating at higher temperature consume more energy per litre but as with laboratory ovens, the data for the 1 000°C furnaces show a wide variation in energy consumption per litre with the smaller volume furnaces consuming more energy per litre than the larger furnaces.
0.4
0.6
0.8
1
1.2
1.4
1.6
1.8
2
0 5 10 15 20 25Cavity Volume (litres)
Energ
ycon
sump
tion(
kW)
0
0.05
0.1
0.15
0.2
0.25
0.3
0.35
0 5 10 15 20 25Cavity volume (litres)
Energ
ycon
sump
tion(
kW)p
erlitr
e
Figure 14. Empty furnaces at 1 000°°°°C, energy consumption relationship with cavity volume Clearly larger furnaces consume more heat than small furnaces but larger furnaces consume less energy per litre cavity volume than furnaces with smaller cavities. This data also shows some variations in performance between furnaces. One reason for this is that as the cavity volume increases, the ratio of surface area / volume decreases so that there is proportionally less external surface to loose heat. Another reason is that to minimise the size of laboratory furnaces but maintain safe external touch temperatures, some are designed with air gaps between outer case and insulation and air flow removes heat. This is more significant with higher temperature designs and small designs.
The data in Figure 12 and Figure 13 is from only a few manufacturers who publish this data and so the true extent of performance variation is not known. Some manufacturers have claimed that there are low priced laboratory and industrial ovens and furnaces on the EU market with significantly inferior performance (high energy consumption per litre) but no quantitative data is available.
Some additional data is available from research carried out in the UK in which the actual energy consumption of a range of laboratory equipment, including ovens and one furnace, was measured121.These were not new ovens and limited details are provided but represent actual uses in laboratories. The test results are summarised below.
Model description Use conditions Reported energy consumption Fisher Scientific Isotemp oven
Size not known, operating at 60°C Power consumption = 80 W
Fisher Scientific Muffle furnace
Appears from image to be 35 l cavity size. Maximum temperature = 1 125°C, operated at 550°C
Power consumption = 956 W
121 http://labs21.lbl.gov/wiki/equipment/index.php/Category:Ovens

ERA Technology Limited ERA Report No. 2012-0230
043122753 ENTR Lot 4 Final Report v6 190 © ERA Technology Ltd
Model description Use conditions Reported energy consumption Lab Line Imperial IV oven 102 litre cavity, rated at 15.8A / 120VAC Power consumption = 1 900 W
Used 24 hours per week Consumption 28.84 kWh / week
NAPCO oven model 630 (built in 1981)
No other details available Power consumption 1 095 W (40W with fan only)
Precision 18 oven (built in 1969)
Operating at 150°C Power consumption 229 W
Precision 51221126 oven (built in 2004)
Rated at 1 300 W, appears from image to be c.50 litre capacity, operated at 110°C
Power consumption = 482 W
These results show a large variation in power consumption of ovens (only one furnace included) being used in laboratories. The variation is due to differing use patterns, cavity size, operating temperature, design quality and the way that they were used (i.e. type of materials heated in ovens or furnace). Only one oven has reported weekly energy consumption and this is for 24 hours use per week (<5 hours per working day). For ovens used 12 hours per day, 5 days per week, this would be equivalent to c. 18 MWh/year.
Small - medium-size industrial furnaces and ovens Clearly these can be used for less than one hour per day or continuously 24 hours per day but the gas consumption for a representative heating process will be needed for the base case. The results of the base case assessment can then be compared in Task 6 with a BAT burner that would have a lower gas consumption based on the known gas savings that are typically achieved. Electric heating consumption depends on many factors and will vary considerably and so for Task 4, it will be necessary to choose a representative oven or furnace to obtain the representative energy consumption. Medium-size industrial batch and continuous ovens and furnace may be operated on a single shift basis (5 days / week and 8 hours per day), continuously or somewhere between these two extremes. However gas or electricity are not necessarily consumed continuously to maintain a set temperature and the electric power used will usually be less than the rated value once the process is at its equilibrium temperature.
The energy consumption in use depends not only on the design but also the process for which these are used and so this will vary considerably. Estimating energy consumption for this classification is very difficult because of the very large variation in designs, usage patterns and processes. An EU27 energy consumption estimate is made from base cases BC2 – 5 in section 4.4. This will be compared and cross-checked with results obtained from an analysis based on typical power capacities, standard power utilisation factors and usage patterns as described above in section 4.1.2
In general older stock will consume more energy than equivalent new equipment. There will inevitably be variation in performance of new furnaces and ovens although very little data is available although it is possible to estimate the improvement potential from the various design technologies that are discussed in Task 4 and this is summarised in Table 129.
Large industrial furnaces and ovens – Energy consumption depends on both design and process and inevitably varies considerably. There is published data on many furnace designs for specific processes in technical publications and in IPPC BREFs. This data is often quoted as energy consumed per tonne of product and so the value for any particular process can be compared with the process having the best performance. This however assumes operation at maximum capacity as processes are often less efficient when operated below capacity as the heat losses are not reduced to the same

ERA Technology Limited ERA Report No. 2012-0230
043122753 ENTR Lot 4 Final Report v6 191 © ERA Technology Ltd
proportion as the quantity of product. Some more detailed data is available as “Sankey diagrams” which give the size of all heat inputs and outputs including heat losses. From these it is possible to calculate the energy efficiency of the process. Examples of the estimated energy consumption data for some of the best designs of new large-scale furnace processes are listed below in Table 79.
Table 79. Examples of the best energy efficiencies currently achieved by new large furnaces Process Energy efficiency Comments Parallel flow regenerative lime kilns
80 – 90% Further improvements seem unlikely (data from EuLA)
Rotary cement kilns with pre-heaters and precalciners
68%122 The largest heat loss is from flue gases. Note that waste heat may be used elsewhere at the cement installation for other processes.
Cross fired regenerative glass melting
49%123 From publication in 2004. Note that heat losses occur during time needed for chemical reactions between ingredients
Brick kiln 67.9% Based on Sankey diagram from 2006124 (assumes all of hot air for drying is used). Efficiency = 100% - % losses from leaks, through insulation, in hot product and in exhaust gases
Steel electric arc furnace
70%125 (electrical energy efficiency)
Most heat losses are from hot flue gases
Steel re-heating 75%126 This is an example of one of the best performing furnaces. As with most processes, efficiency depends on size of furnace
The energy efficiency values above are primary energy efficiency except for the electric arc furnace which is the efficiency of utilising delivered electricity.
The best efficiency values currently achievable clearly vary depending on the process being carried out and so it is not possible to compare the best lime kiln at up to 90% efficiency with the best glass melting furnace with an efficiency approaching only 50%. There is however variation within each sector although this depends on the type of product produced in the furnace, its quality and throughput as well as oven and furnace design.
Total energy consumption of the large-size classification has been made in Table 55 at 1053 TWh/year but the actual energy consumption for individual furnaces and ovens varies enormously and ranges from less than 10 000 MWh/y to 735 000 MWh/y for new furnaces and ovens. The total consumption of 1053 TWh/y assumes that all furnaces and ovens have energy consumption as described in IPPC BREFs whereas old stock is less efficient and have higher energy consumption as described in section 5.1.1. Although IPPC BREFs include energy consumption ranges, this is not
122 C. Koroneos et. at. “Energy Analysis of Cement Production”, Int. J. Energy vol2, no. 1 2005, page 55. 123 “Glass melting technology, a technical and economic assessment”, C. P. Ross and G. L. Tincher, October 2004 Glass Manufacturing Industry Council 124 Proceedings of 52nd International Brick Plant Operation Forum, October 2006 125 Calculated from data provided in Technology update from Tevovia steel “Tenova’s approach to the future energy scenario” 126 www.sankey-diagrams.com/tag/furnace

ERA Technology Limited ERA Report No. 2012-0230
043122753 ENTR Lot 4 Final Report v6 192 © ERA Technology Ltd
strongly enforced as reasonable cost is taken into account and changes are made only when major rebuilds occur which can be very infrequent.
4.2.6 End of life phase Furnaces and ovens can have very long lives but eventually become obsolete and so are disposed of. In general, metals are recovered and recycled with high yields whereas insulation is disposed of to landfill. These two types of material constitute the majority of ovens and furnaces. Some are refurbished then re-sold to second users but this is not always possible with very large furnaces. Section 4.5 details the results of the streamlined Life Cycle Impact Assessments undertaken using the EcoReport Tool, discussing for each base case the relative contribution from the manufacturing phase, use phase and end-of-life management, with representative routes per materials regarding recycling, energy recovery or landfilling options.
4.3. Hazardous substances Section 4.2 describes the design issues that influence mainly energy consumption and associated carbon dioxide emissions although process emissions are also discussed. This sub-section considers the hazardous materials that are used in the constriction of ovens and furnaces. Furnaces and ovens do not contain unusually large quantities of very hazardous substances but some of the processes carried out in them emit large quantities but these are process specific and in many cases inevitable and necessary. In this case, the use, production and disposal of hazardous substances should not be a concern if these are controlled effectively so that they pose no risk to health and the environment. This assessment of best available technology of furnaces and ovens will consider only the furnaces and ovens themselves and will consider the risk from any materials used generated or requiring disposal at end of life. Process emissions are outside the scope of this study unless they are affected by furnace and oven design.
4.3.1 Production phase Furnaces and ovens are constructed from a wide variety of materials some of which are classified as hazardous although they may not pose a significant risk. The risk from the use of hazardous substances in EU is already effectively regulated in the EU by the REACH regulation 1907/2006 and other legislation such as RoHS 2002/95/EC. Substances classified as hazardous that are used in significant quantities are summarised below:
Silica – both amorphous and crystalline silica is used for some types of refractories and insulation. Amorphous silica is not a carcinogen but the crystalline form is classified as a human carcinogen by IARC and it is known to cause silicosis. Crystalline silica is present in most types of refractory bricks and monolithic castables and dust can be created when these are used (e.g. cutting bricks)
Alumino-silicate refractory ceramic fibres (RCF, CAS 142844-00-6) – these are one type of HTIW and is classified in the EU as a category 1B (GHS) carcinogen although this is disputed by manufacturers of these materials who claim that this is based on flawed animal tests127. It has been 127 http://www.echa.europa.eu/doc/about/organisation/msc/msc_rcoms2009/rcom_aluminosilicate_rcf/annex_xv_dossier_rcom_final_200912.pdf

ERA Technology Limited ERA Report No. 2012-0230
043122753 ENTR Lot 4 Final Report v6 193 © ERA Technology Ltd
included in the REACH Candidate List of Substance of Very High Concern (SVHC) by the European Chemicals Agency (ECHA) together with zirconia alumino-silicate. Dossiers of their toxicity of both the above groups of substances have been published128. There has been quite a lot of research into the toxicity of RCF including two studies of workers who produce and handle RCF; however, neither study found no evidence that RCF caused cancer129.
Alumino-silicate RCF products, better described as alumino-silicate wools, are one of the most energy efficient insulation materials available with, in many applications, no alternatives that have the same performance. AES HTIW cannot be used in some types of furnace and polycrystalline HTIW is so much more expensive that its use would cause the user’s business to be uncompetitive with non-EU competitors who would not need to comply with REACH authorisation obligations. If alumino-silicate wool (ASW/RCF) could not be used, EU energy consumption would increase very significantly. The toxicity classification of RCF is outside the scope of this study but as its classification could directly impact on the energy consumed by EU furnaces it is recommended that the available toxicity evidence is re-evaluated.
4.3.2 Use phase Furnaces and ovens do not emit many different hazardous substances in use, but the processes carried out in furnaces and ovens will produce many such substances, in very large quantities. Process emissions are beyond the scope of this study, which will consider emissions from the furnace and oven equipment only. The only substances emitted in use directly attributable to the furnaces per se are from the combustion of fuels: i.e., carbon dioxide, carbon monoxide (CO, where there is a deficiency of oxygen), sulphur dioxide (SO2 from coal and oil, which both contain sulphur) and nitrogen oxides (NOx from reaction of nitrogen with oxygen at high temperature). The best methods to minimise these emissions are:
CO2 – improved energy efficiency, and use of low-carbon and carbon-free fuels
CO – ensure adequate oxygen supply mixing of oxygen into flames. Some processes require reducing atmospheres and so carbon monoxide formation can be inevitable
SO2 – avoid/ reduce, by using fuels with low sulphur content. SO2 is sometimes an inevitable process emission (e.g. smelting sulphide ores) and so in these situations, SO2 from fuels is less important.
NOx – minimise by use of burners designed to generate lower levels of NOx. These are described elsewhere in this report.
4.3.3 End of life Apart from residues from processes, the hazardous substances present in end of life furnaces and ovens are the same as those used in their construction. Risks to workers may however be increased as refractories and insulation often becomes more friable and dusty and so additional safety precautions are needed to avoid inhalation.
128 http://echa.europa.eu/chem_data/authorisation_process/candidate_list_table_en.asp 129 http://echa.europa.eu/doc/consultations/svhc/svhc_axvrep_germany_cmr_AlSi_ref_ceramic_fibres_20090831.pdf (see page 12)

ERA Technology Limited ERA Report No. 2012-0230
043122753 ENTR Lot 4 Final Report v6 194 © ERA Technology Ltd
4.4. Definition of Base Cases
4.4.1 Laboratory ovens Table 52 illustrates the energy consumption in use of each of the main types of laboratory furnace / oven. Of the laboratory products, ovens have the largest impact in terms of energy consumption and the biggest improvement potential because of the way they are used, their energy consumption and the numbers sold in the EU. Therefore a representative laboratory oven will be used as Base Case 1.
The most representative model of laboratory oven for the purposes of these calculations is considered to have a capacity of 60 l and a power of 1.5 kW.
Inputs in the production phase The BOM of such a laboratory oven is presented in Table 80.
Table 80. Composition of a laboratory oven, by category of material Bulk Plastics
Technical plastics Ferrous Non-
ferrous Coating Electronics Misc. Total weight
Weight (g) 200 500 39,860 490 0 80 3,800 44,930 Proportion 0% 1% 89% 1% 0% 0% 8%
Sheet metal scrap is estimated to be 30%.
Inputs in the distribution phase The EcoReport calculations related to the distribution phase are based on the volume of the packaged product. For a typical laboratory oven, it is estimated to be 0.25 m3.
EcoReport also applies different calculation models to the distribution phase if the product is an ICT or consumer electronics product of less than 15 kg, which is not the case for laboratory ovens. Whether it is installed (such as boilers) or not has also an influence on this calculation. A laboratory oven was not considered to be installed.
Inputs in the use phase The energy consumption during the use phase is expected to be a major contributor to the environmental impacts of a laboratory oven. The annual energy consumption is required as an input in EcoReport, as well as the product lifetime and the number of kilometres travelled over the product life for maintenance and repair. These inputs will also be used to calculate the LCC of the base cases.
• Product life: 15 years • Energy consumption per hour: 0.42 kWh • Number of hours per year: 5 000 (57% rate of use, compared to continuous use) • Number of kilometres travelled for maintenance and repair: 500 km.
ERA Technology Limited ERA Report No. 2012-0230
043122753 ENTR Lot 4 Final Report v6 195 © ERA Technology Ltd
Inputs in the end-of-life phase It is assumed that a significant share of the laboratory ovens’ material is recycled and reused. The percentage of weight that is not recovered during the end-of-life phase was estimated to be 5%. In principle, almost all materials in electric and gas ovens’ composition are recovered and treated in one of the following ways:
• Metals are 95% recycled130;• Paper, cardboard and plastics are 100% incinerated or thermally recycled (benefits of energy
recovery); • Hazardous waste consists only of electronic components, which are considered easy to
disassemble and are of limited quantity (around 1% of the total weight).
Economic inputs In order to assess the environmental and economic impacts of laboratory ovens at the EU level, economic inputs are necessary. Sales, stock and average price data are required, as well as the electricity price and discount rate.
An overall improvement ratio, characterising the energy efficiency improvement of an oven currently available on the market compared to an average oven currently in the stock (which can be assumed to be an oven sold 7.5 years earlier), comes into the calculation of impacts at EU level. Sales and stock levels in 2008 were chosen as the most recent year for which reliable data are available.
• Sales for the year 2008: 25 000 • Stock for the year 2008: 400 000 • Average price for the year 2010: €1 500 • Overall improvement ratio131: 1
4.4.2 Small and medium-size industrial Due to the diversity in small - medium-size industrial ovens and furnaces, an average product (in the standard sense of the MEEuP methodology) cannot be defined. Two possible ways to categorise these are by energy source and according to whether the oven/furnace is a batch or continuous type. Ovens with maximum operating temperature of >450°C and less than 750°C are relatively uncommon and so have not been used as base cases.
130 This recycling rate is based on the EcoReport tool which uses 95% and this cannot be changed. The recycling rate of metals and Misc. materials is a fixed value (95%) in the EcoReport tool. 131 The overall improvement ratio is the factor used to indicate the energy efficiency of products currently sold compared to the energy efficiency of products constituting the current stock, which includes older designs.

ERA Technology Limited ERA Report No. 2012-0230
043122753 ENTR Lot 4 Final Report v6 196 © ERA Technology Ltd
Table 81. Base cases for modelling small to medium-size industrial ovens and furnaces
Electric oven (<450°C)
Gas furnace (>750°C)
Batch Base case 2 Base case 3
Continuous Base case 4 Base case 5
Batch and continuous ovens are designed to meet different needs. The reduction of their environmental impacts throughout their life cycle is subject to specific constraints; thus, base cases were defined to take these into account. For each Base case, two sub-Base cases will be defined: one electric resistance heated, one with gas burners. The Base cases for medium-sized industrial furnaces and ovens will therefore be:
• BC2a: MIBOe (Medium-sized Industrial Batch Oven – electric) • BC2b: MIBOg (Medium-sized Industrial Batch Oven – gas) • BC3a: MICOe (Medium-sized Industrial Continuous Oven – electric) • BC3b: MICOg (Medium-sized Industrial Continuous Oven – gas) • BC4a: MIBFe (Medium-sized Industrial Batch Furnace – electric) • BC4b: MIBFg (Medium-sized Industrial Batch Furnace – gas) • BC5a: MICFe (Medium-sized Industrial Continuous Furnace – electric) • BC5b: MICFg (Medium-sized Industrial Continuous Furnace – gas)
For these base cases, the same energy consumption values were used for the gas and electric versions. In practice, gas versions are used where much high energy input is required but using different energy inputs for gas and electric versions would double the number of base cases which is impractical and will not change the main conclusion that energy consumption in the use phase is the most significant.
Furnaces and ovens often also have fans, blowers and pumps but these have not been separately included as base case components in this study as the mass of materials is assumed to be a negligible proportion of the total and their energy consumption is included in the total consumption.
The following inputs parameters were estimated by the project team to model representative medium-sized ovens and furnaces. The type of materials and their respective share were obtained from discussions with two medium-size furnace and oven manufacturers. The absolute values were estimated according to the assumptions explained in section 4.1.2, based on information available in manufacturers’ catalogues and from manufacturers themselves. The main characteristics of the medium-sized industrial Base cases are presented in Table 82.

ERA Technology Limited ERA Report No. 2012-0230
043122753 ENTR Lot 4 Final Report v6 197 © ERA Technology Ltd
Table 82: Main characteristics of medium-sized industrial Base cases BC2 - MIBO BC3 - MICO BC4 - MIBF BC5 - MICF
Inner dimensions (mm)
2 200 x 1 500 x 1 200 1 000 x 1000 x 10 000 1 000 x 3 600 x 1 400 650 x 3 600 x 500
Outer dimensions (mm)
3 080 x 2,410 x 1 800 1 750 x 1 100 x 23 000 1 670 x 4 400 x 2 250 1 150 x 4 000 x 1 150
Weight (tons)
2.7 10.5 7.5 2.8
Average power values used are about two-thirds of the maximum power ratings of these base case furnaces and ovens. This was chosen as in use, full power is used for heating up and then about one third to maintain temperature. In general gas is used where higher energy input is needed for ovens and furnaces.
Inputs in the production phase The BOMs of BC2 – BC5 are presented in Table 83.
Table 83. Composition of the Medium-sized Industrial Base cases, by category of material � BC2 - MIBO BC3 - MICO BC4 - MIBF BC5 - MICF
Weight (g) % Weight (g) % Weight (g) % Weight (g) %
Bulk Plastics 12,000 0.5% 20,000 0.2% 7,500 0.1% 7,500 0.3%Technical plastics 0 0.0% 0 0.0% 0 0.0% 0 0.0%Ferrous 2,391,000 89.8% 8,660,000 82.5% 6,628,500 89.0% 2,599,000 94.2%Non-ferrous 26,400 1.0% 170,000 1.6% 10,500 0.1% 25,500 0.9%Coating 0 0.0% 0 0.0% 0 0.0% 0 0.0%Electronics 4,800 0.2% 10,000 0.1% 2,500 0.0% 2,500 0.1%Misc. 228,000 8.6% 1,640,000 15.6% 802,000 10.8% 125,000 4.5%Total 2,662,200 100.0% 10,500,000 100.0% 7,451,000 100.0% 2,759,500 100.0%
In the above table, the same compositions are used for electric and gas versions although in reality, there will be some differences. However there is uncertainty arising from the BoMs primarily for two main reasons;
• Very limited composition data was available from stakeholders and • There is a vast variety of furnaces and ovens (shapes/sizes/ processes) covered by each of these
base case (BC2 – 5) and the uncertainty resulting from considering an average BoM for each base case is much higher compared with the uncertainty resulting from not considering separate BoM’s for their gas and electricity versions.
For all Base cases, sheet metal scrap was estimated to be 30%.

ERA Technology Limited ERA Report No. 2012-0230
043122753 ENTR Lot 4 Final Report v6 198 © ERA Technology Ltd
Most insulation materials are not available in EcoReport. Mineral wool insulation was assumed to be used in Base cases 2 and 3 and was modelled with 54-Glass for lamps, which was considered as the material with the closest impacts. For Base cases 4 and 5, refractory insulation was used but this is not a material included in the database of the EcoReport; therefore, 24-Ferrite was used as this is a mixed oxide ceramic material, and thus has similarities to ceramic insulation materials.
Electric heating and gas burners are not separately included in BC2 – 5. These are made of metals mainly, and as a percentage of total metal used for BC2 - 5, these will be relatively small proportions.
Inputs in the distribution phase The EcoReport calculations related to the distribution phase are based on the volume of the packaged product.
Table 84. Package volume of Medium-sized Industrial Base cases
Parameter BC2 - MIBO
BC3 - MICO
BC4 - MIBF
BC5 - MICF
Package volume (m3) 15 35 20 6
EcoReport also applies different calculation models to the distribution phase if the product is an ICT or consumer electronics product of less than 15 kg, which is not the case for these Base cases. Whether it is an installed (e.g. a boiler) or not has also an influence on this calculation. All Base cases were considered to be installed.
Inputs in the use phase The energy consumption during the use phase is expected to be a major contributor to the environmental impacts. The annual energy consumption is required as an input in EcoReport, as well as the product lifetime. These inputs will also be used to calculate the LCC.
Table 85: Inputs for the use phase of Medium-sized industrial Base cases BC2 - MIBO BC3 - MICO BC4 - MIBF BC5 - MICF Parameter Unit
BC2a BC2b BC3a BC3b BC4a BC4b BC5a BC5b Lifetime years 25 25 25 25 25 25 25 25 Electric version:Electricity consumption
kWh/h 40 40 40 40
Gas version:Heat output* kWh/h 152 152 152 152
Gas version:Combustion efficiency %
86.0% 86.0% 86.0% 86.0%
Running time per year hours
5,000 5,000 5,760 5,760 5,000 5,000 5,760 5,760
* Please note: The calculation of average heat output for medium gas-fired ovens/furnace base cases does not include grain driers. This is because grain driers have high power ratings but are used for only 6 weeks per year which significantly distort the average power rating of these ovens and furnaces. Energy consumption values (kWh/h) used are 60% of power rating values (kW) of furnaces and ovens.
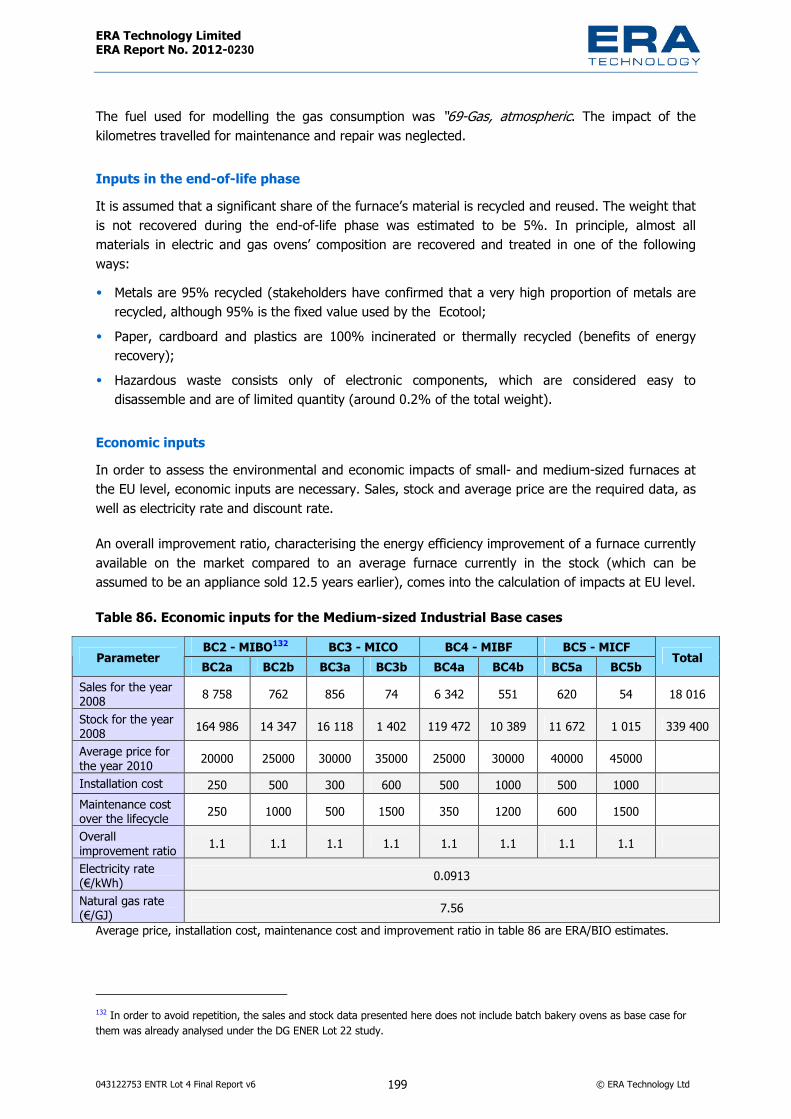
ERA Technology Limited ERA Report No. 2012-0230
043122753 ENTR Lot 4 Final Report v6 199 © ERA Technology Ltd
The fuel used for modelling the gas consumption was “69-Gas, atmospheric. The impact of the kilometres travelled for maintenance and repair was neglected.
Inputs in the end-of-life phase It is assumed that a significant share of the furnace’s material is recycled and reused. The weight that is not recovered during the end-of-life phase was estimated to be 5%. In principle, almost all materials in electric and gas ovens’ composition are recovered and treated in one of the following ways: • Metals are 95% recycled (stakeholders have confirmed that a very high proportion of metals are
recycled, although 95% is the fixed value used by the Ecotool; • Paper, cardboard and plastics are 100% incinerated or thermally recycled (benefits of energy
recovery); • Hazardous waste consists only of electronic components, which are considered easy to
disassemble and are of limited quantity (around 0.2% of the total weight).
Economic inputs In order to assess the environmental and economic impacts of small- and medium-sized furnaces at the EU level, economic inputs are necessary. Sales, stock and average price are the required data, as well as electricity rate and discount rate.
An overall improvement ratio, characterising the energy efficiency improvement of a furnace currently available on the market compared to an average furnace currently in the stock (which can be assumed to be an appliance sold 12.5 years earlier), comes into the calculation of impacts at EU level.
Table 86. Economic inputs for the Medium-sized Industrial Base cases BC2 - MIBO132 BC3 - MICO BC4 - MIBF BC5 - MICF Parameter BC2a BC2b BC3a BC3b BC4a BC4b BC5a BC5b Total
Sales for the year 2008 8 758 762 856 74 6 342 551 620 54 18 016 Stock for the year 2008 164 986 14 347 16 118 1 402 119 472 10 389 11 672 1 015 339 400 Average price for the year 2010 20000 25000 30000 35000 25000 30000 40000 45000 Installation cost 250 500 300 600 500 1000 500 1000 Maintenance cost over the lifecycle 250 1000 500 1500 350 1200 600 1500 Overall improvement ratio 1.1 1.1 1.1 1.1 1.1 1.1 1.1 1.1 Electricity rate (€/kWh) 0.0913 Natural gas rate (€/GJ) 7.56
Average price, installation cost, maintenance cost and improvement ratio in table 86 are ERA/BIO estimates.
132 In order to avoid repetition, the sales and stock data presented here does not include batch bakery ovens as base case for them was already analysed under the DG ENER Lot 22 study.

ERA Technology Limited ERA Report No. 2012-0230
043122753 ENTR Lot 4 Final Report v6 200 © ERA Technology Ltd
4.4.3 Large industrial furnaces and ovens Large industrial furnaces and ovens are very complex and may consist of thousands of individual component parts. They are very often custom designed so there is no “representative product” and it would be very difficult to define an average design as there is so much variation, as described elsewhere in this report. Furthermore, few new large furnaces and ovens are installed in EU although rather more are refurbished or rebuilt to some extent. However the definition of refurbishment needs considering. Some industries carry out a refit or refurbishment of old installations such as a steel production plant or a cement manufacturing facility, when they are no longer economically competitive due to poor energy efficiency or because they are worn out and parts need to be replaced. A refurbishment or refit may be anything from adding control electronics and repairing insulation to complete replacement of furnaces within the installation.
Therefore a different approach will be used for these furnaces and ovens. New large-scale furnaces and ovens tend to be built using designs that are regarded by the IPPC BREF Guides as the “best available technology” (that is within a reasonable cost) but these may not be the “best eco-design” that can be achieved irrespective of cost. Furnaces and ovens are designed to meet IPPC (changing to IED) permit requirements which include maximum emission limits, but do not require emissions to be as low as possible. Energy efficiency is encouraged, but no mandatory targets exist. "BAT" as far as the Eco-design Directive is concerned is not the same as the concept of "BAT" in the IPPC/ IED. In the context of the Ecodesign Directive, BAT means the best design that is technically possible, irrespective of cost. Thus, it is usually possible to improve the eco-design of modern new furnaces and ovens to some extent. Whether it is feasible to do so, from a cost perspective, is examined as a discreet, subsequent issue (via Least Life Cycle Cost, LLCC, analyses).
A large furnace and oven that are considered by be representative of large industrial furnaces and ovens are used for the environmental calculation based on a Bill of Materials supplied by a stakeholder. However the energy consumption in the use phase has been calculated from data on all large furnaces and ovens in the EU (see Table 55) to produce representative values of annual energy consumption. Estimates have also been made for typical capacities and use patterns. These calculations will allow us to determine whether energy consumption in the use phase is the most significant impact, and to quantify the total energy consumption of large industrial furnaces and ovens in the EU. As there are many different types of furnace and oven used in the EU and so simple base cases have been chosen where heat is input to the material being processed but no melting or smelting occurs. The most significant materials used to construct large furnaces and ovens are structural steel and refractory insulation.
First, a large furnace and oven that are assumed to be representative of those that are large or very large have been considered for very simple base case calculations in order to demonstrate that energy consumption in the use phase is the most significant impact, as has already been found for medium size and laboratory furnaces and ovens. There are many different types of large furnace and oven designs and so simple base cases have been chosen where heat is input to the material being processed but no melting or smelting occurs. The following base cases for large industrial furnaces and ovens have been selected:
• BC6: Large industrial furnace (large continuous brick kiln) • BC7: Large industrial oven (large continuous drying oven for wet clay bricks and roof tiles)

ERA Technology Limited ERA Report No. 2012-0230
043122753 ENTR Lot 4 Final Report v6 201 © ERA Technology Ltd
Production quantities of installed plants vary widely. A representative value for the purposes of base case calculations is a capacity of 250 tonnes per day. The capacity of industrial furnaces varies considerably from c. 50 to well over 250 tonnes per day, therefore 250 tonnes per day is representative of throughput but it may not consume the average energy consumption.
The most commonly used component parts will be used for the base case assessment of large industrial furnaces and ovens. All large ovens and furnaces have heat sources, thermal insulation and some sort of control technology. The most significant materials used to construct large furnaces and ovens are structural steel and refractory insulation.
Furnaces and ovens often also have fans, blowers and pumps. Their use phase impacts are not assessed separately, as their energy consumption is included within the total energy consumption of the furnace or oven.
The following input parameters were estimated by the project team in order to model representative large ovens and furnaces. The type of materials and their respective shares are based on discussions with two manufacturers of large furnaces and ovens. The main characteristics of the large industrial base cases are presented in Table 87.
Table 87: Main characteristics of large industrial base cases BC6 BC7
Dimensions (mm) 140,000 x 6,800 x 2,550 80,000 x 12,000 x 5,800 Energy consumption (MWh/y) 98 340 15 410 Weight (tonnes) 3 302 2 446
Inputs in the production phase The BOMs of the furnace and oven provided by a stakeholder are presented in Table 88
Table 88. Composition of the large industrial furnace and oven base cases, by category of material � BC6 – brick kiln BC7 – drying oven
Weight (g) % Weight (g) %Bulk Plastics Negligible NegligibleTechnical plastics Negligible NegligibleFerrous 409,000,000 12.4% 184,000,000 7.5%Non-ferrous Negligible NegligibleCoating Negligible NegligibleElectronics Negligible NegligibleMisc. 2,893,000,000 87.6% 2,262,000,000 95.5%Total 3,302,000,000 100.0% 2,446,000,000 100.0%
For all Base cases, sheet metal scrap was estimated to be 30%.

ERA Technology Limited ERA Report No. 2012-0230
043122753 ENTR Lot 4 Final Report v6 202 © ERA Technology Ltd
Most insulation materials are not available in EcoReport. BC6 and BC7 contain refractory insulation but it is not included in the EcoReport so 24-Ferrite was selected instead as this is a mixed oxide ceramic material with similarities to ceramic insulation materials.
Inputs in the distribution phase It should be noted that most large furnaces and ovens are custom built at the premises of the end user. The packaged volumes presented in Table 89 were used in the EcoReport for the purposes of base case calculations related to the distribution phase.
Table 89. Packaged volume of large industrial base cases Parameter BC6 BC7
Packaged volume (m3) 2,430 5,570
EcoReport also applies different calculation models to the distribution phase according to whether the product is an ICT or consumer electronics product of less than 15 kg, which is not the case for these base cases. Whether it is installed (e.g. a boiler) or not also has an influence on this calculation. All base cases were considered to be installed.
Inputs in the use phase Energy consumption during the use phase is expected to be a major contributor to environmental impacts. Annual energy consumption is required as an input in EcoReport, as well as the product lifetime. These inputs will also be used to calculate the LCC.
Table 90: Inputs for the use phase of large industrial base cases Parameter Unit BC6 BC7 Lifetime years 35 35Energy consumption (gas) MWh/y 98 340 15 410Gas version:Combustion efficiency % 86.0% 86.0%
Running time per year hours 7 200 7 200The impact of the kilometres travelled for maintenance and repair was ignored.
Inputs in the end-of-life phase It is assumed that a significant share of the furnace’s material is recycled and reused. The percentage of weight that is not recovered during the end-of-life phase was estimated to be 5%133. In principle, almost all materials in large furnaces and ovens are recovered and treated in one of the following ways:
133 The EcoReport does not offer possibilities to create new material streams (such as mixed oxide ceramic which would be appropriate choice of material for insulation of furnaces and ovens) so it is necessary to choose from the material types from limited general options already fixed in the Ecoreport. For insulation, materials of the Misc. materials types are therefore used in this study for the classification of insulation materials. The EcoReport uses a fixed value (95%) for the recycling rate of these Misc. materials. This limitation of EcoReport results in considering 87%-96% of furnace materials (metals, refractories and insulation) as being 95% recycled however in reality a higher proportion of insulation material is landfilled.

ERA Technology Limited ERA Report No. 2012-0230
043122753 ENTR Lot 4 Final Report v6 203 © ERA Technology Ltd
• Metals are 95% recycled130 • Hazardous waste consists only of electronic components, which are considered easy to
disassemble and are of negligible quantity
Economic inputs In order to assess the environmental and economic impacts of large industrial furnaces and ovens at the EU level, economic inputs are necessary. Sales, stock and average price are the required data, as well as electricity rate and discount rate.
The EcoReport tool uses “improvement ratio” which is the ratio of the energy efficiency of a furnace or oven currently available on the market compared to an average one currently in the stock which can be assumed to have been sold 17.5 years ago. Therefore if a new furnace is 10% more efficient than an equivalent 17.5 year old furnace, the improvement ratio is 1.1 (this has been assumed for BC6 and 7). This ratio affects the calculation of impacts at EU level. In the table below, the furnaces and ovens data has been estimated by ERA (from table 21 and other sources).
Table 91. Economic inputs for the large industrial furnaces and ovens base cases
Parameter BC6 BC7 Total Sales for the year 2008 348 66 414Stock for the year 2008 11 196 3 050 14 246Average price for the year 2010 4000000 2000000Installation cost 100000 7000Maintenance cost over the lifecycle 10000 5000Overall improvement ratio 1.1 1.1
One option for large custom designed furnaces and ovens is to consider the main heat losses from each type. These losses can in many cases be reduced by adoption of BAT and the improvement potential can be calculated. Policy options can also be based on the furnace characteristics that are associated with the main sources of energy loss referred to here as “performance parameters”, and are described in section 5.2.
4.5. Base case environmental impact assessment The aim of this subtask is to assess the environmental impacts of each base case following the MEEuP (EcoReport Unit Indicators) methodology for each life-cycle stage:
• Raw materials use and manufacturing (production phase); • Distribution; • Use; • End-of-life. The base case environmental impact assessment will lead to an identification of basic technological

ERA Technology Limited ERA Report No. 2012-0230
043122753 ENTR Lot 4 Final Report v6 204 © ERA Technology Ltd
design parameters of outstanding environmental relevance134. These parameters will be listed as they will serve as an important input to the identification of ecodesign options.
The assessment results are tracked back to the main contributing components, materials and features of the power and distribution transformers.
4.5.1 Base case 1: Laboratory oven The following table shows the environmental impacts of a common laboratory oven over its whole life-cycle.
Table 92. Life-cycle analysis of Base case 1 using the EcoReport tool Life Cycle phases > PRODUCTION USE END-OF-LIFE* TOTAL Resource use and emissions
Units Material Manuf. Total DISTRIBUTION Disposa
lRecycl
e. Total
Other resources and waste
debit credit
Total energy (GER) MJ 1943 764 2707 391 331981 15 75 122 335200 of which, electricity (in primary MJ)
MJ 296 433 729 1 330757 15 0 0 331487
Water (process) L 1104 6 1110 0 22061 15 0 0 23171 Water (cooling) L 280 177 457 0 882005 15 1 -1 882460 Waste, non-haz./ landfill
g 64671 4072 68744 215 384173 15 1 2762 455894
Waste, hazardous/ incinerated
g 70 1 71 4 7622 15 0 630 8327
Emissions (air) Greenhouse gases in GWP100
kg CO2eq. 168 44 212 25 14529 15
5 9 14775
Ozone depletion, emissions
mg R-11 eq.
negligible
Acidification, emissions g SO2eq. 1072 191 1263 74 85274 29 7 22 86633
Volatile Organic Compounds (VOC)
g 6 1 7 5 144 1 0 1 157
Persistent Organic Pollutants (POP)
ng i-Teq 802 127 928 1 2177 19 0 19 3126
Heavy metals mg Ni eq. 2050 297 2347 11 5958 57 0 57 8372
PAHs mg Ni eq. 23 0 23 14 912 0 0 0 948
Particulate Matter (PM, dust)
g 183 29 212 855 6231 256 0 256 7554
Emissions (Water) Heavy Metals mg
Hg/20 1272 0 1272 0 2145 16 0 16 3434
Eutrophication g PO4 35 0 36 0 11 1 0 1 47 Persistent Organic Pollutants (POP)
ng i-Teq
negligible
134��������������� ��� ���������������������������������������������������

ERA Technology Limited ERA Report No. 2012-0230
043122753 ENTR Lot 4 Final Report v6 205 © ERA Technology Ltd
Figure 15 below shows the contribution of each life-cycle phase to each environmental impact. Several observations can be made based on this analysis:
����
��
���
���
���
���
������������ ����������� !�����"����� #�� ��������
Figure 15. Distribution of a laboratory oven’s environmental impacts by life-cycle phase • The use phase is clearly the predominant one, with the majority of all 14 impacts occurring
during this stage of a laboratory oven’s life cycle: • Total energy (GER): 99.1% • Electricity consumption: 99.8% • Water (process): 95.2% • Waste, non-hazardous / landfill: 84.3% • Waste, hazardous / incinerated: 91.5% • Greenhouse gas emissions: 98.3% • Acidification: 98.4% • Volatile organic compounds: 91.8% • Persistent Organic Pollutants: 69.7% • Heavy metals to air: 71.2% • PAHs: 96.2% • Particulate matter (PM, dust): 82.5% • Heavy metals to water: 62.5%
• The material acquisition phase is the second most important one, mainly due to the stainless steel production. It contributes to:
• Persistent Organic Pollutants (POP): 25.6% • Heavy metals into air: 24.5% • Heavy metals into water: 37.0% • Eutrophication: 75.1%
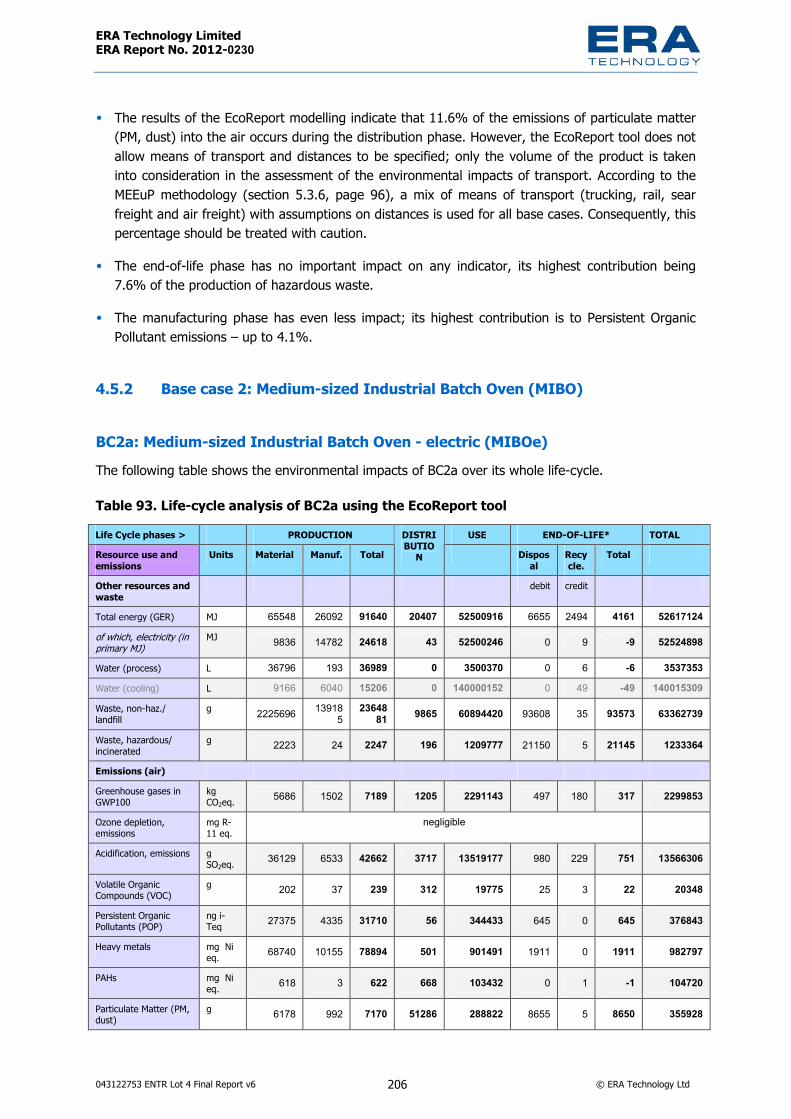
ERA Technology Limited ERA Report No. 2012-0230
043122753 ENTR Lot 4 Final Report v6 206 © ERA Technology Ltd
• The results of the EcoReport modelling indicate that 11.6% of the emissions of particulate matter (PM, dust) into the air occurs during the distribution phase. However, the EcoReport tool does not allow means of transport and distances to be specified; only the volume of the product is taken into consideration in the assessment of the environmental impacts of transport. According to the MEEuP methodology (section 5.3.6, page 96), a mix of means of transport (trucking, rail, sear freight and air freight) with assumptions on distances is used for all base cases. Consequently, this percentage should be treated with caution.
• The end-of-life phase has no important impact on any indicator, its highest contribution being 7.6% of the production of hazardous waste.
• The manufacturing phase has even less impact; its highest contribution is to Persistent Organic Pollutant emissions – up to 4.1%.
4.5.2 Base case 2: Medium-sized Industrial Batch Oven (MIBO)
BC2a: Medium-sized Industrial Batch Oven - electric (MIBOe) The following table shows the environmental impacts of BC2a over its whole life-cycle.
Table 93. Life-cycle analysis of BC2a using the EcoReport tool Life Cycle phases > PRODUCTION USE END-OF-LIFE* TOTAL Resource use and emissions
Units Material Manuf. Total DISTRIBUTIO
N Disposal
Recycle.
Total
Other resources and waste
debit credit
Total energy (GER) MJ 65548 26092 91640 20407 52500916 6655 2494 4161 52617124 of which, electricity (in primary MJ)
MJ 9836 14782 24618 43 52500246 0 9 -9 52524898
Water (process) L 36796 193 36989 0 3500370 0 6 -6 3537353 Water (cooling) L 9166 6040 15206 0 140000152 0 49 -49 140015309 Waste, non-haz./ landfill
g 2225696 139185
2364881 9865 60894420 93608 35 93573 63362739
Waste, hazardous/ incinerated
g 2223 24 2247 196 1209777 21150 5 21145 1233364
Emissions (air) Greenhouse gases in GWP100
kg CO2eq. 5686 1502 7189 1205 2291143 497 180 317 2299853
Ozone depletion, emissions
mg R-11 eq.
negligible
Acidification, emissions gSO2eq. 36129 6533 42662 3717 13519177 980 229 751 13566306
Volatile Organic Compounds (VOC)
g 202 37 239 312 19775 25 3 22 20348
Persistent Organic Pollutants (POP)
ng i-Teq 27375 4335 31710 56 344433 645 0 645 376843
Heavy metals mg Ni eq. 68740 10155 78894 501 901491 1911 0 1911 982797
PAHs mg Ni eq. 618 3 622 668 103432 0 1 -1 104720
Particulate Matter (PM, dust)
g 6178 992 7170 51286 288822 8655 5 8650 355928

ERA Technology Limited ERA Report No. 2012-0230
043122753 ENTR Lot 4 Final Report v6 207 © ERA Technology Ltd
Life Cycle phases > PRODUCTION USE END-OF-LIFE* TOTAL Resource use and emissions
Units Material Manuf. Total DISTRIBUTIO
N Disposal
Recycle.
Total
Emissions (Water) Heavy Metals mg
Hg/20 42628 5 42634 16 338931 554 0 554 382134
Eutrophication g PO4 1179 9 1188 0 1626 32 0 31 2846 Persistent Organic Pollutants (POP)
ng i-Teq
negligible
Figure 16 below shows the contribution of each life-cycle phase to each environmental impact.
����
��
���
���
���
���
������������ ����������� !�����"����� #�� ��������
Figure 16. Distribution of BC2a’s environmental impacts by life-cycle phases Several observations can be made based on this analysis:
• The use phase is clearly the predominant one, with the majority of the impacts measured by all the indicators occurring during this stage of a medium-sized electric industrial batch oven’s life cycle:
• Total energy (GER): 99.8% • Electricity consumption: 100% • Water (process): 99.0% • Waste, non-hazardous / landfill: 96.1% • Waste, hazardous / incinerated: 98.1% • Greenhouse gas emissions: 99.6% • Acidification: 99.7% • Volatile organic compounds: 97.2%
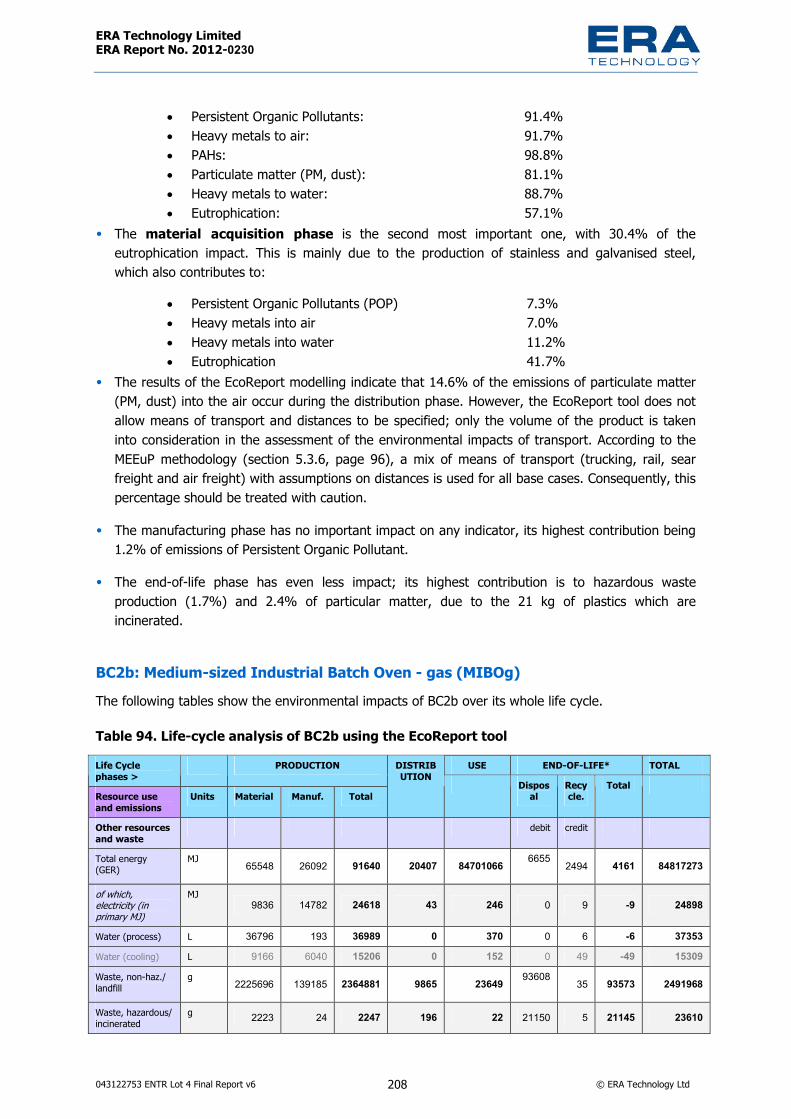
ERA Technology Limited ERA Report No. 2012-0230
043122753 ENTR Lot 4 Final Report v6 208 © ERA Technology Ltd
• Persistent Organic Pollutants: 91.4% • Heavy metals to air: 91.7% • PAHs: 98.8% • Particulate matter (PM, dust): 81.1% • Heavy metals to water: 88.7% • Eutrophication: 57.1%
• The material acquisition phase is the second most important one, with 30.4% of the eutrophication impact. This is mainly due to the production of stainless and galvanised steel, which also contributes to:
• Persistent Organic Pollutants (POP) 7.3% • Heavy metals into air 7.0% • Heavy metals into water 11.2% • Eutrophication 41.7%
• The results of the EcoReport modelling indicate that 14.6% of the emissions of particulate matter (PM, dust) into the air occur during the distribution phase. However, the EcoReport tool does not allow means of transport and distances to be specified; only the volume of the product is taken into consideration in the assessment of the environmental impacts of transport. According to the MEEuP methodology (section 5.3.6, page 96), a mix of means of transport (trucking, rail, sear freight and air freight) with assumptions on distances is used for all base cases. Consequently, this percentage should be treated with caution.
• The manufacturing phase has no important impact on any indicator, its highest contribution being 1.2% of emissions of Persistent Organic Pollutant.
• The end-of-life phase has even less impact; its highest contribution is to hazardous waste production (1.7%) and 2.4% of particular matter, due to the 21 kg of plastics which are incinerated.
BC2b: Medium-sized Industrial Batch Oven - gas (MIBOg) The following tables show the environmental impacts of BC2b over its whole life cycle.
Table 94. Life-cycle analysis of BC2b using the EcoReport tool USE END-OF-LIFE* TOTAL Life Cycle
phases > PRODUCTION
Resource use and emissions
Units Material Manuf. Total
DISTRIBUTION Dispos
al Recycle.
Total
Other resources and waste
debit credit
Total energy (GER)
MJ 65548 26092 91640 20407 84701066 6655 2494 4161 84817273
of which, electricity (in primary MJ)
MJ 9836 14782 24618 43 246 0 9 -9 24898
Water (process) L 36796 193 36989 0 370 0 6 -6 37353 Water (cooling) L 9166 6040 15206 0 152 0 49 -49 15309 Waste, non-haz./ landfill
g 2225696 139185 2364881 9865 23649 93608 35 93573 2491968
Waste, hazardous/ incinerated
g 2223 24 2247 196 22 21150 5 21145 23610
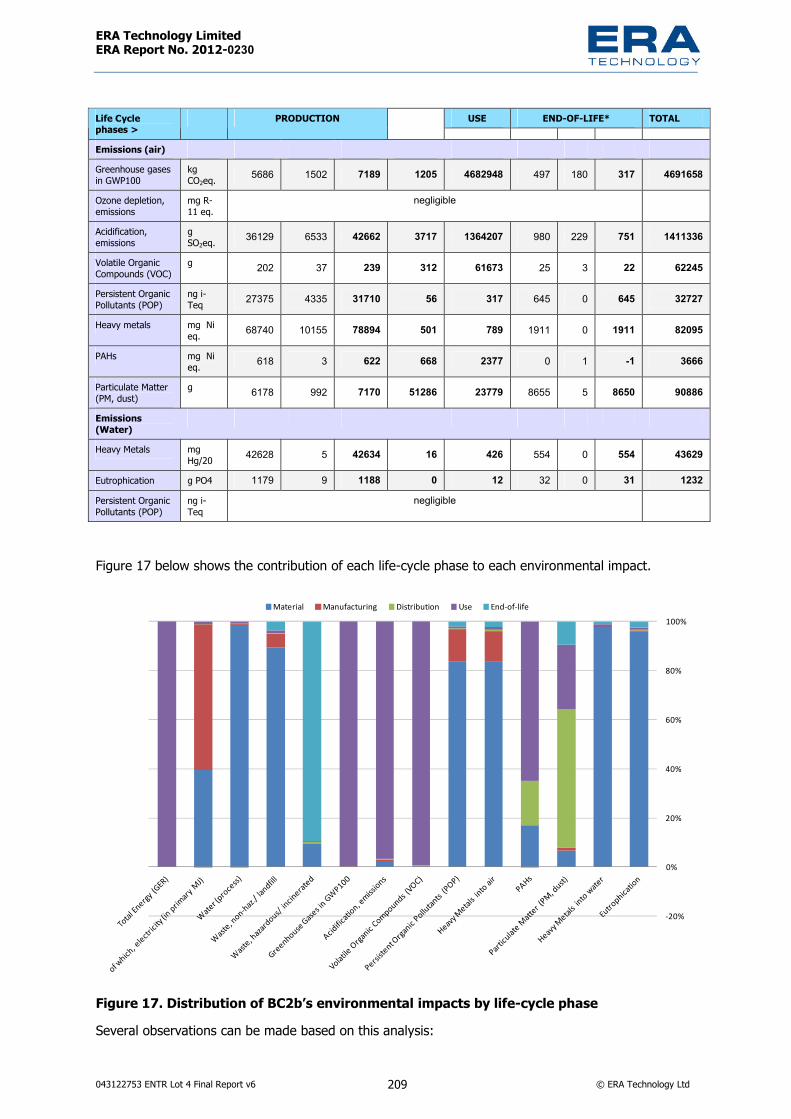
ERA Technology Limited ERA Report No. 2012-0230
043122753 ENTR Lot 4 Final Report v6 209 © ERA Technology Ltd
USE END-OF-LIFE* TOTAL Life Cycle phases >
PRODUCTION
Emissions (air) Greenhouse gases in GWP100
kg CO2eq. 5686 1502 7189 1205 4682948 497 180 317 4691658
Ozone depletion, emissions
mg R-11 eq.
negligible
Acidification, emissions
gSO2eq. 36129 6533 42662 3717 1364207 980 229 751 1411336
Volatile Organic Compounds (VOC)
g 202 37 239 312 61673 25 3 22 62245
Persistent Organic Pollutants (POP)
ng i-Teq 27375 4335 31710 56 317 645 0 645 32727
Heavy metals mg Ni eq. 68740 10155 78894 501 789 1911 0 1911 82095
PAHs mg Ni eq. 618 3 622 668 2377 0 1 -1 3666
Particulate Matter (PM, dust)
g 6178 992 7170 51286 23779 8655 5 8650 90886
Emissions (Water) Heavy Metals mg
Hg/20 42628 5 42634 16 426 554 0 554 43629
Eutrophication g PO4 1179 9 1188 0 12 32 0 31 1232 Persistent Organic Pollutants (POP)
ng i-Teq
negligible
Figure 17 below shows the contribution of each life-cycle phase to each environmental impact.
����
��
���
���
���
���
������������ ����������� !�����"����� #�� ��������
Figure 17. Distribution of BC2b’s environmental impacts by life-cycle phase Several observations can be made based on this analysis:

ERA Technology Limited ERA Report No. 2012-0230
043122753 ENTR Lot 4 Final Report v6 210 © ERA Technology Ltd
The use phase and material acquisition phase are clearly the predominant ones, with the majority of the impacts measured by all the indicators occurring during these stages of a medium-sized gas industrial batch oven’s life cycle.
• The use phase is predominant for the following indicators: • Total energy (GER) 99.9% • Greenhouse gas emissions 99.8% • Acidification 96.7% • Volatile Organic Compounds 99.1% • PAHs 64.8%
The use phase is also responsible for 27.8% of particulate matter (PM, dust) emissions.
• The material acquisition phase is predominant for the following indicators: • Waste, non-hazardous / landfill 89.3% • Persistent Organic Pollutants 83.6%
� Mainly due to the production of galvanised steel used for casing • Heavy metals to air 83.7%
� Mainly due to the production of stainless steel • Heavy metals to water: 97.7%
� Mainly due to the production of stainless steel • Eutrophication: 95.8%
� Mainly due to the production of stainless steel The indicators which are also influenced by the material acquisition phase are:
• Electricity consumption 39.5% � Mainly due to the production of stainless steel
• PAHs 16.9% � Mainly due to the door seals
• Waste, hazardous/ incinerated 9.4% • Particulate matter (PM, dust): 6.8%
� Mainly due to the production of galvanised steel used for casing • The results of the EcoReport modelling indicate that 56.4% of the emissions of particulate matter
(PM, dust) into the air and 18.2% of the PAHs emissions occur during the distribution phase. • The end-of-life phase is responsible for 89.6% of the production of hazardous or incinerated
waste. It is due to the 21 kg of plastics which are incinerated. • The manufacturing phase is responsible for 59.4% of the electricity consumed during the life-
cycle. However, the total energy consumed during this phase represents less than 0.1% of the overall energy consumption.
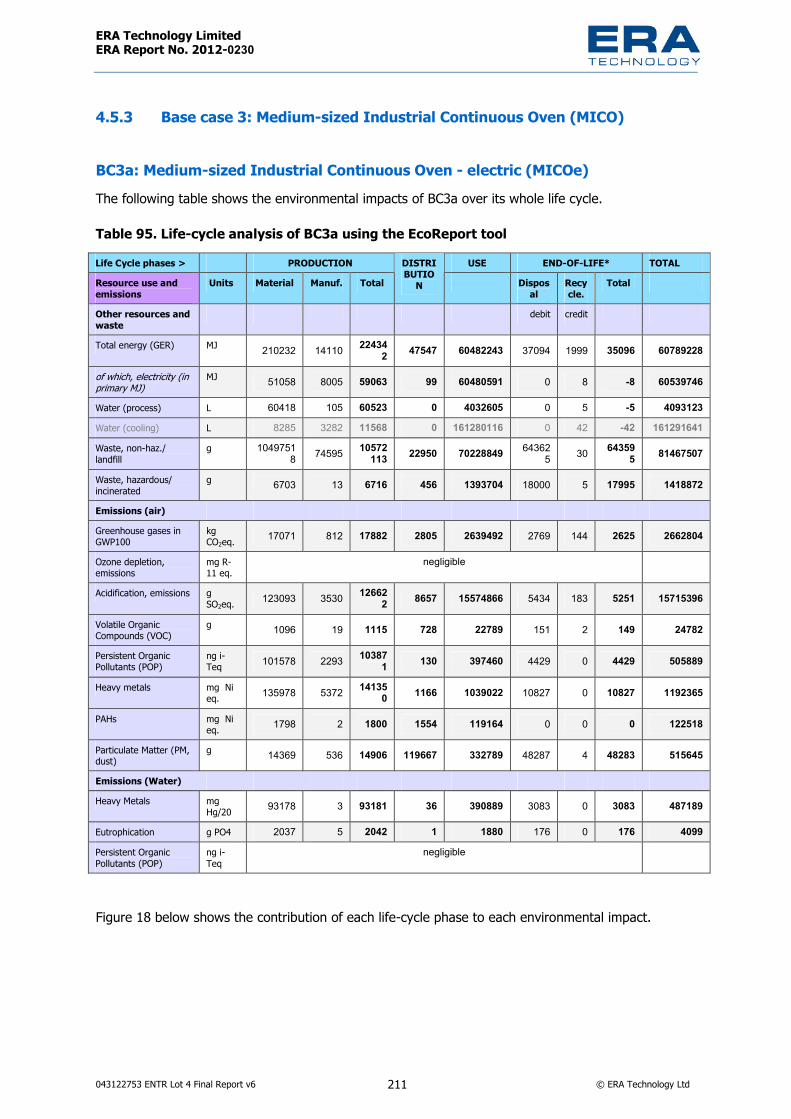
ERA Technology Limited ERA Report No. 2012-0230
043122753 ENTR Lot 4 Final Report v6 211 © ERA Technology Ltd
4.5.3 Base case 3: Medium-sized Industrial Continuous Oven (MICO)
BC3a: Medium-sized Industrial Continuous Oven - electric (MICOe) The following table shows the environmental impacts of BC3a over its whole life cycle.
Table 95. Life-cycle analysis of BC3a using the EcoReport tool Life Cycle phases > PRODUCTION USE END-OF-LIFE* TOTAL Resource use and emissions
Units Material Manuf. Total DISTRIBUTIO
N Disposal
Recycle.
Total
Other resources and waste
debit credit
Total energy (GER) MJ 210232 14110 224342 47547 60482243 37094 1999 35096 60789228
of which, electricity (in primary MJ)
MJ 51058 8005 59063 99 60480591 0 8 -8 60539746
Water (process) L 60418 105 60523 0 4032605 0 5 -5 4093123 Water (cooling) L 8285 3282 11568 0 161280116 0 42 -42 161291641 Waste, non-haz./ landfill
g 10497518 74595 10572
113 22950 70228849 643625 30 64359
5 81467507
Waste, hazardous/ incinerated
g 6703 13 6716 456 1393704 18000 5 17995 1418872
Emissions (air) Greenhouse gases in GWP100
kg CO2eq. 17071 812 17882 2805 2639492 2769 144 2625 2662804
Ozone depletion, emissions
mg R-11 eq.
negligible
Acidification, emissions gSO2eq. 123093 3530 12662
2 8657 15574866 5434 183 5251 15715396
Volatile Organic Compounds (VOC)
g 1096 19 1115 728 22789 151 2 149 24782
Persistent Organic Pollutants (POP)
ng i-Teq 101578 2293 10387
1 130 397460 4429 0 4429 505889
Heavy metals mg Ni eq. 135978 5372 14135
0 1166 1039022 10827 0 10827 1192365
PAHs mg Ni eq. 1798 2 1800 1554 119164 0 0 0 122518
Particulate Matter (PM, dust)
g 14369 536 14906 119667 332789 48287 4 48283 515645
Emissions (Water) Heavy Metals mg
Hg/20 93178 3 93181 36 390889 3083 0 3083 487189
Eutrophication g PO4 2037 5 2042 1 1880 176 0 176 4099 Persistent Organic Pollutants (POP)
ng i-Teq
negligible
Figure 18 below shows the contribution of each life-cycle phase to each environmental impact.
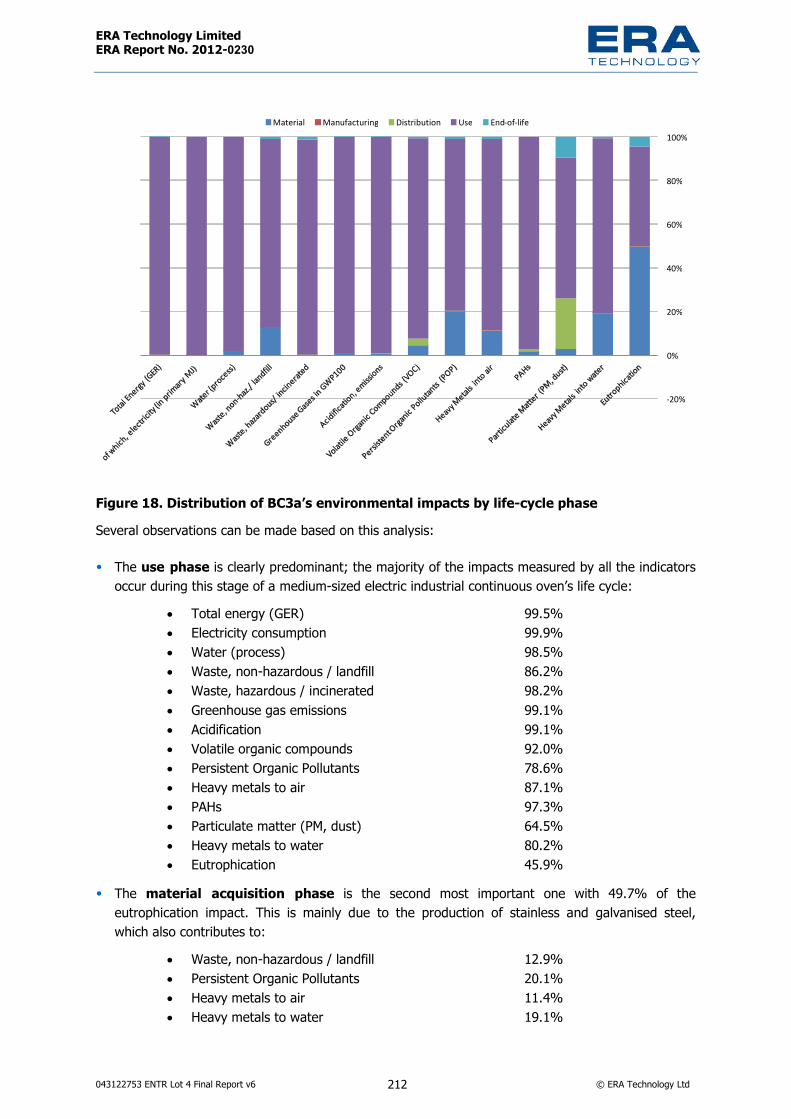
ERA Technology Limited ERA Report No. 2012-0230
043122753 ENTR Lot 4 Final Report v6 212 © ERA Technology Ltd
Figure 18. Distribution of BC3a’s environmental impacts by life-cycle phase Several observations can be made based on this analysis:
• The use phase is clearly predominant; the majority of the impacts measured by all the indicators occur during this stage of a medium-sized electric industrial continuous oven’s life cycle:
• Total energy (GER) 99.5% • Electricity consumption 99.9% • Water (process) 98.5% • Waste, non-hazardous / landfill 86.2% • Waste, hazardous / incinerated 98.2% • Greenhouse gas emissions 99.1% • Acidification 99.1% • Volatile organic compounds 92.0% • Persistent Organic Pollutants 78.6% • Heavy metals to air 87.1% • PAHs 97.3% • Particulate matter (PM, dust) 64.5% • Heavy metals to water 80.2% • Eutrophication 45.9%
• The material acquisition phase is the second most important one with 49.7% of the eutrophication impact. This is mainly due to the production of stainless and galvanised steel, which also contributes to:
• Waste, non-hazardous / landfill 12.9% • Persistent Organic Pollutants 20.1% • Heavy metals to air 11.4% • Heavy metals to water 19.1%
����
��
���
���
���
���
������������ ����������� !�����"����� #�� ��������

ERA Technology Limited ERA Report No. 2012-0230
043122753 ENTR Lot 4 Final Report v6 213 © ERA Technology Ltd
• The results of the EcoReport modelling indicate that 23.2% of the emissions of particulate matter (PM, dust) into the air occurs during the distribution phase.
• The end-of-life phase has no important impact on any indicator, its highest contribution being 9.4% of the emissions of particulate matter and 4.3% persistent organic pollutants (POP).
• The manufacturing phase has even less impact; its highest contribution is to Persistent Organic Pollutant emissions – up to 0.5%.
BC3b: Medium-sized Industrial Continuous Oven - gas (MIBOg) The following table shows the environmental impacts of BC3b over its whole life cycle.
Table 96. Life-cycle analysis of BC3b using the EcoReport tool USE END-OF-LIFE* TOTAL Life Cycle
phases > PRODUCTION
Resource use and emissions
Units Material Manuf. Total
DISTRIBUTION Dispos
alRecycle.
Total
Other resources and waste
debit credit
Total energy (GER)
MJ 210232 14110 224342 47547 97576816 37094 1999 35096 97883800
of which, electricity (in primary MJ)
MJ 51058 8005 59063 99 591 0 8 -8 59746
Water (process) L 60418 105 60523 0 605 0 5 -5 61123 Water (cooling) L 8285 3282 11568 0 116 0 42 -42 11641 Waste, non-haz./ landfill
g 10497518 74595 1057211
3 22950 105721 643625 30 643595 11344379
Waste, hazardous/ incinerated
g 6703 13 6716 456 67 18000 5 17995 25235
Emissions (air) Greenhouse gases in GWP100
kg CO2eq. 17071 812 17882 2805 5394852 2769 144 2625 5418164
Ozone depletion, emissions
mg R-11 eq.
negligible
Acidification, emissions
gSO2eq. 123093 3530 126622 8657 1572341 5434 183 5251 1712871
Volatile Organic Compounds (VOC)
g 1096 19 1115 728 71055 151 2 149 73047
Persistent Organic Pollutants (POP)
ng i-Teq 101578 2293 103871 130 1039 4429 0 4429 109468
Heavy metals mg Ni eq. 135978 5372 141350 1166 1414 10827 0 10827 154756
PAHs mg Ni eq. 1798 2 1800 1554 2749 0 0 0 6103
Particulate Matter (PM, dust)
g 14369 536 14906 119667 27460 48287 4 48283 210316
Emissions (Water) Heavy Metals mg
Hg/20 93178 3 93181 36 932 3083 0 3083 97232
Eutrophication g PO4 2037 5 2042 1 20 176 0 176 2239 Persistent Organic Pollutants (POP)
ng i-Teq
negligible

ERA Technology Limited ERA Report No. 2012-0230
043122753 ENTR Lot 4 Final Report v6 214 © ERA Technology Ltd
Figure 19 below shows the contribution of each life-cycle phase to each environmental impact.
����
��
���
���
���
���
������������ ����������� !�����"����� #�� ��������
Figure 19. Distribution of BC3b’s environmental impacts by life-cycle phase Several observations can be made based on this analysis:
The use phase and material acquisition phase are clearly the predominant ones, with the majority of the impacts measured by all the indicators occurring during these stages of a medium-sized gas industrial continuous oven’s life cycle.
• The use phase is predominant for the following indicators: • Total energy (GER) 99.7% • Greenhouse gas emissions 99.6% • Acidification 91.8% • Volatile organic compounds 97.3% • PAHs 45.0%
The use phase is also responsible for 15.9% of Particulate Matter (PM, dust) emissions.
• The material acquisition phase is predominant for the following indicators: • Electricity consumption 85.5%
� Mainly due to the production of stainless steel • Waste, non-hazardous / landfill 92.5% • Persistent Organic Pollutants 92.8%
� Mainly due to the production of galvanised steel used for casing • Heavy metals to air 87.9%
� Mainly due to the production of stainless steel • Heavy metals to water 95.8%

ERA Technology Limited ERA Report No. 2012-0230
043122753 ENTR Lot 4 Final Report v6 215 © ERA Technology Ltd
� Mainly due to the production of stainless steel • Eutrophication 91.0%
� Mainly due to the production of stainless steel The indicators which are also influenced by the material phase are:
• Waste, hazardous / incinerated 26.6% � Mainly due to the production of electronics
• PAHs 29.5% � Mainly due to the production of copper and electronics
• The results of the EcoReport modelling indicate that 56.9% of the emissions of particulate matter (PM, dust) into the air and 25.5% of the PAHs emissions occur during the distribution phase.
• The end-of-life phase is responsible for 71.3% of the production of hazardous or incinerated waste. It is due to the 18 kg of plastics which are incinerated.
• The manufacturing phase is responsible for 28.2% of the electricity consumed during the life-cycle. However, the total energy consumed during this phase represents only 0.01% of the overall energy consumption.
4.5.4 Base case 4: Medium-sized Industrial Batch Furnace (MIBF)
BC4a: Medium-sized Industrial Batch Furnace – electric (MIBFe) The following table shows the environmental impacts of BC4a over its whole life cycle.
Table 97. Life-cycle analysis of BC4a using the EcoReport tool Life Cycle phases > PRODUCTION USE END-OF-LIFE* TOTAL Resource use and emissions
Units Material Manuf. Total DISTRIBUTI
ON Disposal Recycle.
Total
Other resources and waste
debit credit
Total energy (GER) MJ 287999 109089 397088 22264 52503971 25913 5471 20442 52943765 of which, electricity (in primary MJ)
MJ 32557 62819 95376 57 52500954 0 3 -3 52596384
Water (process) L 139163 853 140016 0 3501400 0 2 -2 3641415 Water (cooling) L 12538 26756 39294 0 140000393 0 16 -16 140039671 Waste, non-haz./ landfill g 11543583 518898 12062481 9126 60991396 456726 11 45671
5 73519718
Waste, hazardous/ incinerated
g 1671 75 1746 181 1209772 6750 2 6748 1218447
Emissions (air) Greenhouse gases in GWP100
kg CO2eq. 25306 6221 31528 1310 2291386 1934 406 1528 2325752
Ozone depletion, emissions
mg R-11 eq.
Negligible
Acidification, emissions gSO2eq. 125673 26995 152667 4012 13520277 3795 510 3284 13680241
Volatile Organic Compounds (VOC)
g 1060 115 1175 413 19785 106 7 99 21472
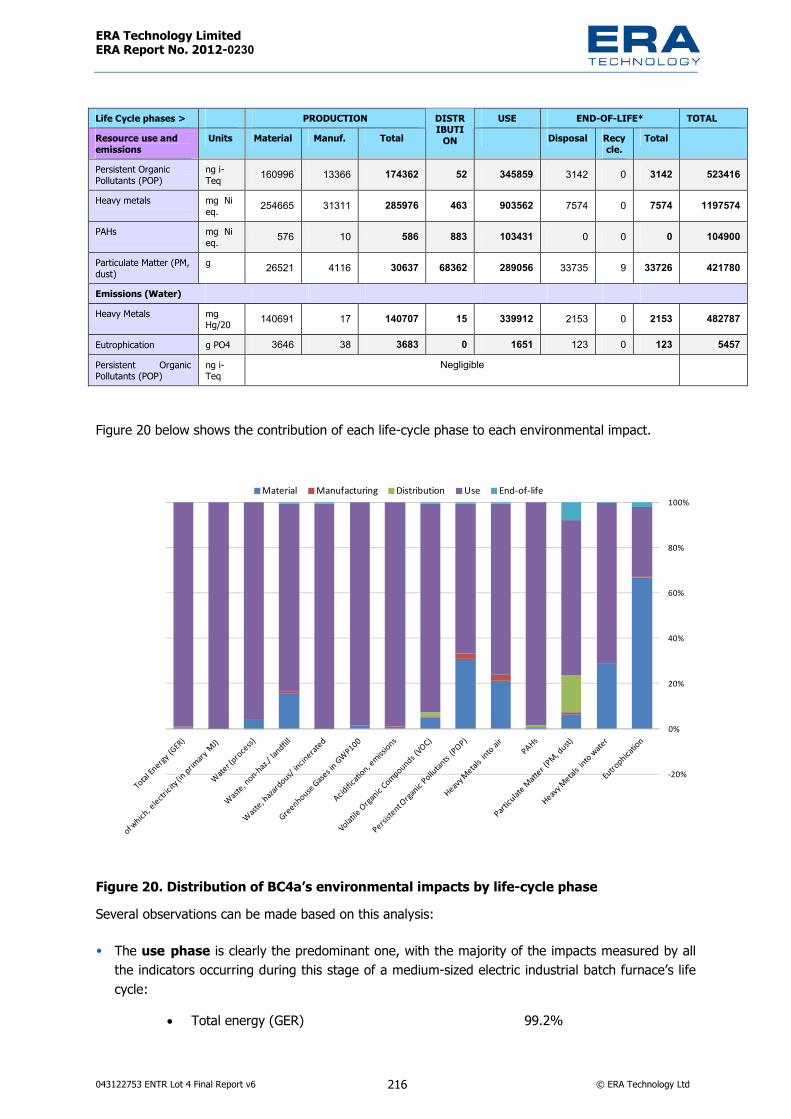
ERA Technology Limited ERA Report No. 2012-0230
043122753 ENTR Lot 4 Final Report v6 216 © ERA Technology Ltd
Life Cycle phases > PRODUCTION USE END-OF-LIFE* TOTAL Resource use and emissions
Units Material Manuf. Total DISTRIBUTI
ON Disposal Recycle.
Total
Persistent Organic Pollutants (POP)
ng i-Teq 160996 13366 174362 52 345859 3142 0 3142 523416
Heavy metals mg Ni eq. 254665 31311 285976 463 903562 7574 0 7574 1197574
PAHs mg Ni eq. 576 10 586 883 103431 0 0 0 104900
Particulate Matter (PM, dust)
g 26521 4116 30637 68362 289056 33735 9 33726 421780
Emissions (Water) Heavy Metals mg
Hg/20 140691 17 140707 15 339912 2153 0 2153 482787
Eutrophication g PO4 3646 38 3683 0 1651 123 0 123 5457 Persistent Organic Pollutants (POP)
ng i-Teq
Negligible
Figure 20 below shows the contribution of each life-cycle phase to each environmental impact.
����
��
���
���
���
���
������������ ����������� !�����"����� #�� ��������
Figure 20. Distribution of BC4a’s environmental impacts by life-cycle phase Several observations can be made based on this analysis:
• The use phase is clearly the predominant one, with the majority of the impacts measured by all the indicators occurring during this stage of a medium-sized electric industrial batch furnace’s life cycle:
• Total energy (GER) 99.2%

ERA Technology Limited ERA Report No. 2012-0230
043122753 ENTR Lot 4 Final Report v6 217 © ERA Technology Ltd
• Electricity consumption 99.8% • Water (process) 96.2% • Waste, non-hazardous / landfill 83.0% • Waste, hazardous / incinerated 99.3% • Greenhouse gas emissions 98.5% • Acidification 98.8% • Volatile organic compounds 92.1% • Persistent Organic Pollutants 66.1% • Heavy metals to air 75.4% • PAHs 98.6% • Particulate matter (PM, dust) 68.5% • Heavy metals to water 70.4% • Eutrophication 30.3%
• The material acquisition phase is the second most important one, with 66.8% of the eutrophication impact. This is mainly due to the production of stainless and galvanised steel, which also contributes to 30.3% of Persistent Organic Pollutants emissions.
• The manufacturing, distribution and end-of-life phases have no important impact on any indicator, their highest contribution being respectively 2.6% (POP emissions), 16.2% (PM emissions) and 8.0% (PM emissions).
BC4b: Medium-sized Industrial Batch Furnace – gas (MIBFg) The following table shows the environmental impacts of BC4b over its whole life cycle.
Table 98. Life-cycle analysis of BC4b using the EcoReport tool USE END-OF-LIFE* TOTAL Life Cycle
phases > PRODUCTION
Resource use and emissions
Units Material Manuf. Total
DISTRIBUTION Disposal Recy
cle. Total
Other resources and waste
debit credit
Total energy (GER)
MJ 287999 109089 397088 22264 84704120 25913 5471 20442 85143914
of which, electricity (in primary MJ)
MJ 32557 62819 95376 57 954 0 3 -3 96384
Water (process) L 139163 853 140016 0 1400 0 2 -2 141415 Water (cooling) L 12538 26756 39294 0 393 0 16 -16 39671 Waste, non-haz./ landfill
g 11543583 518898 12062481 9126 120625 456726 11 456715 12648948
Waste, hazardous/ incinerated
g 1671 75 1746 181 17 6750 2 6748 8693
Emissions (air) Greenhouse gases in GWP100
kg CO2eq. 25306 6221 31528 1310 4683191 1934 406 1528 4717557
Ozone depletion, emissions
mg R-11 eq.
negligible
Acidification, emissions
gSO2eq. 125673 26995 152667 4012 1365307 3795 510 3284 1525271

ERA Technology Limited ERA Report No. 2012-0230
043122753 ENTR Lot 4 Final Report v6 218 © ERA Technology Ltd
USE END-OF-LIFE* TOTAL Life Cycle phases >
PRODUCTION
Volatile Organic Compounds (VOC)
g 1060 115 1175 413 61682 106 7 99 63370
Persistent Organic Pollutants (POP)
ng i-Teq 160996 13366 174362 52 1744 3142 0 3142 179300
Heavy metals mg Ni eq. 254665 31311 285976 463 2860 7574 0 7574 296872
PAHs mg Ni eq. 576 10 586 883 2377 0 0 0 3845
Particulate Matter (PM, dust)
g 26521 4116 30637 68362 24014 33735 9 33726 156738
Emissions (Water) Heavy Metals mg
Hg/20 140691 17 140707 15 1407 2153 0 2153 144282
Eutrophication g PO4 3646 38 3683 0 37 123 0 123 3843 Persistent Organic Pollutants (POP)
ng i-Teq
negligible
Figure 21 below shows the contribution of each life-cycle phase to each environmental impact.
����
��
���
���
���
���
������������ ����������� !�����"����� #�� ��������
Figure 21. Distribution of BC4b’s environmental impacts by life-cycle phase Several observations can be made based on this analysis:
The use phase and material acquisition phase are clearly the predominant ones, with the majority of the impacts measured by all the indicators occurring during these stages of a medium-sized gas industrial batch furnace’s life cycle.

ERA Technology Limited ERA Report No. 2012-0230
043122753 ENTR Lot 4 Final Report v6 219 © ERA Technology Ltd
• The use phase is predominant for the following indicators: • Total energy (GER) 99.5% • Greenhouse gas emissions 99.3% • Acidification 89.5% • Volatile organic compounds 97.3% • PAHs 61.8%
The use phase is also responsible for 18.4% of particulate matter (PM, dust) emissions. • The material acquisition phase is predominant for the following indicators:
• Waste, non-hazardous / landfill 91.3% • Persistent Organic Pollutants 89.8%
� Mainly due to the production of galvanised steel used for casing • Heavy metals to air 85.8%
� Mainly due to the production of stainless steel • Heavy metals to water 97.5%
� Mainly due to the production of stainless steel • Eutrophication 94.9%
� Mainly due to the production of stainless steel The indicators which are also influenced by the material acquisition phase are:
• Electricity consumption 33.8% � Mainly due to the production of stainless steel
• Waste, hazardous / incinerated 19.2% � Mainly due to the production of electronics
• Particulate matter (PM, dust) 16.9% � Mainly due to the production of galvanised steel used for casing
• The results of the EcoReport modelling indicate that 43.6% of the emissions of particulate matter (PM, dust) into the air and 23.0% of the PAHs emissions occur during the distribution phase.
• The end-of-life phase is responsible for 77.6% of the production of hazardous or incinerated waste. It is due to the 6.75 kg of plastics which are incinerated.
• The manufacturing phase is responsible for 65.2% of the electricity consumed during the life-cycle. However, the total energy consumed during this phase represents only 0.1% of the overall energy consumption.

ERA Technology Limited ERA Report No. 2012-0230
043122753 ENTR Lot 4 Final Report v6 220 © ERA Technology Ltd
4.5.5 Base case 5: Medium-sized Industrial Continuous Furnace (MICF)
BC5a: Medium-sized Industrial Continuous Furnace - electric (MICFe) The following table shows the environmental impacts of BC5a over its whole life cycle.
Table 99. Life-cycle analysis of BC5a using the EcoReport tool Life Cycle phases > PRODUCTION USE END-OF-LIFE* TOTAL Resource use and emissions
Units Material Manuf. Total DISTRIBUTIO
N Disposal
Recycle.
Total
Other resources and waste
debit credit
Total energy (GER) MJ 91794 28466 120261 8194 60481203 9893 1687 8206 60617863 of which, electricity (in primary MJ)
MJ 13957 16101 30058 17 60480301 0 3 -3 60510373
Water (process) L 40904 209 41113 0 4032411 0 2 -2 4073523 Water (cooling) L 4398 6551 10949 0 161280109 0 16 -16 161291043 Waste, non-haz./ landfill g 3793482 153472 3946954 3977 70162598 169274 11 16926
3 74282791
Waste, hazardous/ incinerated
g 1673 27 1701 79 1393654 6750 2 6748 1402182
Emissions (air) Greenhouse gases in GWP100
kg CO2eq. 7920 1641 9561 485 2639409 738 124 615 2650069
Ozone depletion, emissions
mg R-11 eq.
negligible
Acidification, emissions gSO2eq. 44336 7136 51472 1494 15574115 1450 156 1293 15628374
Volatile Organic Compounds (VOC)
g 376 41 417 125 22782 40 2 38 23362
Persistent Organic Pollutants (POP)
ng i-Teq 48216 4852 53068 22 396952 1165 0 1165 451207
Heavy metals mg Ni eq. 78125 11365 89491 202 1038504 2884 0 2884 1131080
PAHs mg Ni eq. 476 4 480 269 119151 0 0 0 119900
Particulate Matter (PM, dust)
g 7941 1083 9024 20515 332730 12877 3 12874 375143
Emissions (Water) Heavy Metals mg
Hg/20 45804 6 45810 6 390415 822 0 822 437053
Eutrophication g PO4 1148 9 1158 0 1871 47 0 47 3076 Persistent Organic Pollutants (POP)
ng i-Teq
negligible
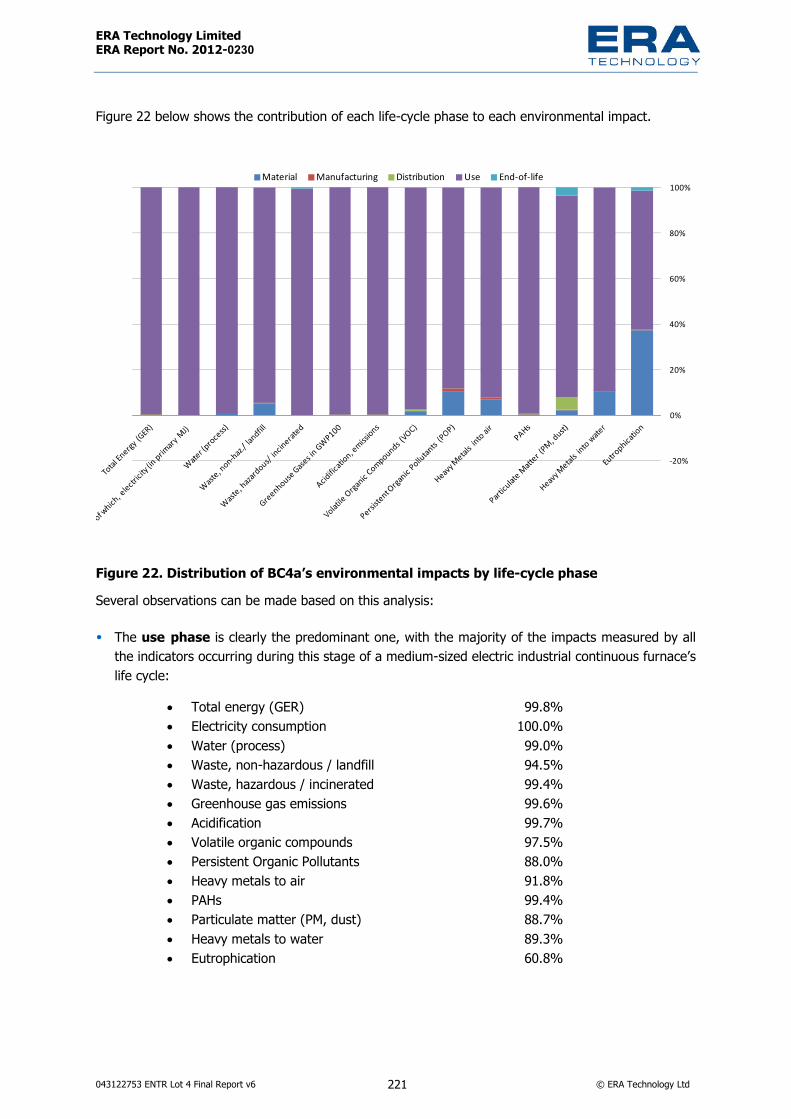
ERA Technology Limited ERA Report No. 2012-0230
043122753 ENTR Lot 4 Final Report v6 221 © ERA Technology Ltd
Figure 22 below shows the contribution of each life-cycle phase to each environmental impact.
����
��
���
���
���
���
������������ ����������� !�����"����� #�� ��������
Figure 22. Distribution of BC4a’s environmental impacts by life-cycle phase Several observations can be made based on this analysis:
• The use phase is clearly the predominant one, with the majority of the impacts measured by all the indicators occurring during this stage of a medium-sized electric industrial continuous furnace’s life cycle:
• Total energy (GER) 99.8% • Electricity consumption 100.0% • Water (process) 99.0% • Waste, non-hazardous / landfill 94.5% • Waste, hazardous / incinerated 99.4% • Greenhouse gas emissions 99.6% • Acidification 99.7% • Volatile organic compounds 97.5% • Persistent Organic Pollutants 88.0% • Heavy metals to air 91.8% • PAHs 99.4% • Particulate matter (PM, dust) 88.7% • Heavy metals to water 89.3% • Eutrophication 60.8%

ERA Technology Limited ERA Report No. 2012-0230
043122753 ENTR Lot 4 Final Report v6 222 © ERA Technology Ltd
• The material acquisition phase is the second most important one, with 37.3% of the eutrophication impact. This is mainly due to the production of stainless and galvanised steel, which also contributes to 10.5% of Persistent Organic Pollutants emissions.
• The manufacturing, distribution and end-of-life phases have no important impact on any indicator, their highest contribution being respectively 1.1% (POP emissions), 5.5% (PM emissions) and 3.4% (PM emissions).
BC5b: Medium-sized Industrial Continuous Furnace - gas (MICFg) The following table shows the environmental impacts of BC5b over its whole life cycle.
Table 100. Life-cycle analysis of BC5b using the EcoReport tool USE END-OF-LIFE* TOTAL Life Cycle
phases > PRODUCTION
Resource use and emissions
Units Material Manuf. Total
DISTRIBUTION Disposal Recy
cle. Total
Other resources and waste
debit credit
Total energy (GER)
MJ 91794 28466 120261 8194 97575775 9893 1687 659 97704888
of which, electricity (in primary MJ)
MJ 13957 16101 30058 17 301 0 3 -3 30373
Water (process) L 40904 209 41113 0 411 0 2 -2 41523 Water (cooling) L 4398 6551 10949 0 109 0 16 -16 11043 Waste, non-haz./ landfill
g 3793482 153472 3946954 3977 39470 169274 11 169263 4159663
Waste, hazardous/ incinerated
g 1673 27 1701 79 17 6750 2 6748 8545
Emissions (air) Greenhouse gases in GWP100
kg CO2eq. 7920 1641 9561 485 5394769 738 124 615 5405428
Ozone depletion, emissions
mg R-11 eq.
negligible
Acidification, emissions
gSO2eq. 44336 7136 51472 1494 1571589 1450 156 1293 1625849
Volatile Organic Compounds (VOC)
g 376 41 417 125 71048 40 2 38 71628
Persistent Organic Pollutants (POP)
ng i-Teq 48216 4852 53068 22 531 1165 0 1165 54786
Heavy metals mg Ni eq. 78125 11365 89491 202 895 2884 0 2884 93472
PAHs mg Ni eq. 476 4 480 269 2736 0 0 0 3484
Particulate Matter (PM, dust)
g 7941 1083 9024 20515 27401 12877 3 12874 69814
Emissions (Water) Heavy Metals mg
Hg/20 45804 6 45810 6 458 822 0 822 47096
Eutrophication g PO4 1148 9 1158 0 12 47 0 47 1216 Persistent Organic Pollutants (POP)
ng i-Teq
negligible

ERA Technology Limited ERA Report No. 2012-0230
043122753 ENTR Lot 4 Final Report v6 223 © ERA Technology Ltd
Figure 23 below shows the contribution of each life-cycle phase to each environmental impact.
����
��
���
���
���
���
������������ ����������� !�����"����� #�� ��������
Figure 23. Distribution of BC5b’s environmental impacts by life-cycle phase Several observations can be made based on this analysis:
The use phase and material acquisition phase are clearly the predominant ones, with the majority of the impacts measured by all the indicators occurring during these stages of a medium-sized gas industrial continuous furnace’s life cycle.
• The use phase is predominant for the following indicators: • Total energy (GER) 99.9% • Greenhouse gas emissions 99.8% • Acidification 96.7% • Volatile organic compounds 99.2% • PAHs 78.5% • Particulate Matter (PM, dust) 39.2%
• The material acquisition phase is predominant for the following indicators: • Waste, non-hazardous / landfill 91.2% • Persistent Organic Pollutants 88.0%
� Mainly due to the production of galvanised steel used for casing • Heavy metals to air 83.6%
� Mainly due to the production of stainless steel • Heavy metals to water 97.3%
� Mainly due to the production of stainless steel • Eutrophication 94.4%
� Mainly due to the production of stainless steel

ERA Technology Limited ERA Report No. 2012-0230
043122753 ENTR Lot 4 Final Report v6 224 © ERA Technology Ltd
The indicators which are also influenced by the material phase are:
• Electricity consumption 46.0% • Waste, hazardous / incinerated 19.6%
� Mainly due to the production of electronics • PAHs 13.7%
� Mainly due to the production of electronics • Particulate matter (PM, dust): 11.4%
� Mainly due to the production of galvanised steel used for casing • The results of the EcoReport modelling indicate that 29.4% of the emissions of particulate matter
(PM, dust) into the air and 7.7% of the PAHs emissions occur during the distribution phase. • The end-of-life phase is responsible for 79.0% of the production of hazardous or incinerated
waste. It is due to the 6.75 kg of plastics which are incinerated. • The manufacturing phase is responsible for 53.0% of the electricity consumed during the life-
cycle. However, the total energy consumed during this phase represents less than 0.1% of the overall energy consumption.
4.5.6 Base case 6: Large Industrial Furnace (brick kiln) The following table shows the environmental impacts of BC6 over its whole life cycle.
Table 101. Life-cycle analysis of BC6 using the EcoReport tool USE END-OF-LIFE* TOTAL Life Cycle
phases > PRODUCTION
Resource use and emissions
Units Material Manuf. Total
DISTRIBUTION Disposal Recycle
.Total
Other resources and waste debit creditTotal energy (GER) MJ 95515254 37351110 132866364 3297600 15344609155 11283618 186170 11097448 15491870568
of which, electricity (in primary MJ)
MJ 6352480 21110062 27462542 6896 274625 0 0 0 27744064
Water (process) L 62393510 273389 62666898 0 626669 0 0 0 63293567Water (cooling) L 0 8571111 8571111 0 85711 0 0 0 8656822Waste, non-haz./ landfill g 4800035664 202408199 5002443864 1589860 50024439 202463991 0 202463991 5256522153
Waste, hazardous/ incinerated
g 8703 36202 44905 31597 449 0 0 0 76951
Emissions (air) Greenhouse gases in GWP100
kg CO2eq. 8125518 2153686 10279204 194429 848397364 842265 13893 828372 859699368
Ozone depletion, emissions
mg R-11 eq. negligible
Acidification, emissions g SO2eq. 22240715 9368281 31608996 600222 299489315 1651500 17403 1634097 281205707

ERA Technology Limited ERA Report No. 2012-0230
043122753 ENTR Lot 4 Final Report v6 225 © ERA Technology Ltd
USE END-OF-LIFE* TOTAL Life Cycle phases >
PRODUCTION
Volatile Organic Compounds (VOC)
g 380253 54331 434583 50535 13516538 46737 240 46497 11707403
Persistent Organic Pollutants (POP)
ng i-Teq 72637626 6444173 79081798 8988 790818 1392906 0 1392906 81274510
Heavy metals mg Ni eq. 58902269 15095597 73997867 80744 739979 3303000 0 3303000 78121589
PAHs mg Ni eq. 30288 4737 35025 107741 590139 0 5 -5 572566
Particulate Matter (PM, dust)
g 7600448 1422125 9022573 8308315 5277472 14690801 294 14690507 36406205
Emissions (Water) Heavy Metals mg
Hg/20 5199808 7969 5207777 2516 52078 937630 0 937630 6200001
Eutrophication g PO4 151370 12045 163415 42 1634 53604 0 53604 218696Persistent Organic Pollutants (POP)
ng i-Teq negligible
The figure below shows the contribution of each life-cycle phase to each environmental impact.
����
��
���
���
���
���
������������ ����������� !�����"����� #�� ��������
Figure 24. Distribution of BC6 environmental impacts by life-cycle phase Several observations can be made based on this analysis:

ERA Technology Limited ERA Report No. 2012-0230
043122753 ENTR Lot 4 Final Report v6 226 © ERA Technology Ltd
• The use phase is clearly dominant, with the majority of the impacts measured by all indicators occurring during this stage of a large industrial furnace’s life cycle:
• Total energy (GER) 99.0% • Greenhouse gas emissions 98.7% • Acidification 88.0% • Volatile organic compounds 95.5% • PAHs 75.1%
The use phase is also responsible for 17.8% of particulate matter (PM, dust) emissions. The material acquisition phase is predominant for the following indicators:
• Waste, non-hazardous / landfill: 91.3% • Persistent Organic Pollutants: 89.4%
� Mainly due to the production of galvanised steel used for casing • Heavy metals to air: 75.4%
� Mainly due to the production of stainless steel • Heavy metals to water: 83.9%
� Mainly due to the production of stainless steel • Eutrophication: 69.2%
� Mainly due to the production of stainless steel The indicators which are also influenced by the material phase are:
• Electricity consumption: 22.9% � Mainly due to the production of stainless steel
• Acidification emissions 7.9% • Particulate matter (PM, dust): 20.9%
� Mainly due to the production of galvanised steel used for casing • The results of the EcoReport modelling indicate that 22.8% of the emissions of particulate matter
(PM, dust) into the air and 18.8% of the PAH emissions occur during the distribution phase. • The manufacturing phase is responsible for 76.1% of the electricity consumed over the life cycle.
However, the total energy consumed during this phase represents only 0.2% of the overall energy consumption.
• The end-of-life phase has even less impact; its only high contribution is to particulate matter (PM, dust) emissions to air (40.4%)133.

ERA Technology Limited ERA Report No. 2012-0230
043122753 ENTR Lot 4 Final Report v6 227 © ERA Technology Ltd
4.5.7 Base case 7: Large Industrial Oven (drying oven: bricks and tiles) The following table shows the environmental impacts of BC7 over its whole life cycle.
Table 102. Life-cycle analysis of BC7 using the EcoReport tool USE END-OF-LIFE* TOTAL Life Cycle
phases > PRODUCTION
Resource use and emissions
Units Material Manuf. Total
DISTRIBUTION Disposal Recyc
le. Total
Other resources and waste debit creditTotal energy (GER)
MJ 17576121 6833662 24409783 7558631 2404301811 8355958 30416 8325542 2444595767
of which, electricity (in primary MJ)
MJ 1037860 3862242 4900102 15807 49001 0 0 0 4964910
Water (process) L 7133851 50019 7183870 0 71839 0 0 0 7255709Water (cooling) L 0 1568148 1568148 0 15681 0 0 0 1583830Waste, non-haz./ landfill
g 784849056 37032077 821881133 3644181 8218811 149932462 0 149932462 983676587
Waste, hazardous/ incinerated
g13846 6623 20470 72425 205 0 0 0
93099
Emissions (air) Greenhouse gases in GWP100
kg CO2eq. 1674550 394033 2068583 445660 132935489 623730 2270 621460 136071192
Ozone depletion, emissions
mg R-11 eq. negligible
Acidification, emissions
g SO2eq. 5785988 1713996 7499984 1375802 38783382 1223000 2843 1220157 48879325
Volatile Organic Compounds (VOC)
g 62328 9940 72268 115835 1751117 34611 39 34572 1973792
Persistent Organic Pollutants (POP)
ng i-Teq 12081051 1179009 13260060 20601 132601 1031501 0 1031501 14444763
Heavy metals mg Ni eq. 7908277 2761851 10670128 185077 106701 2446000 0 2446000 13407906
PAHs mg Ni eq. 15874 867 16741 246959 67456 0 1 -1 331155
Particulate Matter (PM, dust)
g 1316492 260188 1576680 19044162 688663 10879110 48 10879062 32188566
Emissions (Water) Heavy Metals mg
Hg/20 1084535 1458 1085993 5767 10860 694352 0 694352 1796972
Eutrophication g PO4 26241 2204 28445 97 284 39696 0 39696 68522Persistent Organic Pollutants (POP)
ng i-Teq negligible

ERA Technology Limited ERA Report No. 2012-0230
043122753 ENTR Lot 4 Final Report v6 228 © ERA Technology Ltd
The figure below shows the contribution of each life-cycle phase to each environmental impact.
����
��
���
���
���
���
������������ ����������� !�����"����� #�� ��������
Figure 25. Distribution of BC7 environmental impacts by life-cycle phase Several observations can be made based on this analysis:
• The use phase clearly dominates, with the majority of the impacts measured by all the indicators occurring during this stage of a large industrial oven’s life cycle:
• Total energy (GER) 98.4% • Greenhouse gas emissions 97.7% • Acidification 79.3% • Volatile organic compounds 88.7%
The use phase is also responsible for 20.4% of PAH emissions.
• The material acquisition phase is dominant for the following indicators: • Waste, non-hazardous / landfill 79.8% • Persistent Organic Pollutants 83.6%
� Mainly due to the production of galvanised steel used for casing • Heavy metals to air 59.0%
� Mainly due to the production of stainless steel • Heavy metals to water 60.4%
� Mainly due to the production of stainless steel The indicators which are also influenced by the materials phase are:
• Eutrophication 38.3% � Mainly due to the production of stainless steel

ERA Technology Limited ERA Report No. 2012-0230
043122753 ENTR Lot 4 Final Report v6 229 © ERA Technology Ltd
• Electricity consumption: 20.9% � Mainly due to the production of stainless steel
• Acidification emissions 11.8 % • Waste hazardous/incinerated 14.9%
• The results of the EcoReport modelling indicate that 59.2% of the emissions of particulate matter (PM, dust) to the air, 77.8% of waste hazardous/incinerated and 74.6% of PAH emissions occur during the distribution phase.
• The manufacturing phase is responsible for 77.8% of the electricity consumed over the life cycle. However, the total energy consumed during this phase represents only 0.3% of the overall energy consumption.
• The end-of-life phase has some important impacts with its highest contribution is to eutrophication (57.9%), heavy metals into water (38.6%) and particular mater (PM, dust) (33.8%)133.

ERAT
echn
ology
Limite
dER
ARep
ortN
o.20
12-02
30
0431
2275
3ENT
RLot
4Fina
lRep
ortv6
230
©ER
ATech
nolog
yLtd
4.6.
Base
case
Life-
Cycle
Costs
Table
103s
hows
thelife
cycle
costs
forea
chBC
accord
ingto
EcoR
eport
calcu
lation
s.
Table
103:
Lifec
ycle
costs
ofba
seca
sesc
onsid
ered
inth
isstu
dy(e
uros
)Ind
icato
rBC
1LO
BC2a
MIBO
eBC
2bMI
BOg
BC3a
MICO
eBC
3bMI
COg
BC4a
MIBF
eBC
4bMI
BFg
BC5a
MICF
eBC
5bMI
CFg
BC6
BC7
Prod
uctp
rice
1500
2000
025
000
3000
035
000
2500
030
000
4000
045
000
4000
000
2000
000
Instal
lation
/ac
quisi
tion
costs
(ifan
y)0
250
500
300
600
500
1000
500
1000
1000
0070
00
Fuel
(gas
,oil,
wood
)0
049
1424
056
6120
049
1424
056
6120
8274
5930
1296
5023
Elec
tricit
y21
3237
3821
043
0642
037
3821
043
0642
00
0Re
pair
and
maint
enan
ceco
st0
205
819
409
1228
287
983
491
1228
7612
3806
Total
s36
3239
4276
5177
4346
1351
6029
4839
9608
5234
0747
1633
6133
4886
8535
4214
9758
29
Life-c
yclec
ostcal
culat
ionsc
learly
show
thate
nergy
costs
forall
types
ofind
ustria
lfurna
cesan
dove
nsare
signif
icantl
ylarg
ertha
nthe
origin
alpu
rchase
price
plusi
nstalla
tion,
repair
andm
ainten
ance
costs.
Forla
borat
oryov
ens,
electr
icityc
ostsa
resom
e40%
more
thant
heori
ginal
purch
asepri
cebu
tfor
indus
trial
oven
sand
furna
ces,t
herat
ioof
costs
ismu
chlar
ger.
Form
edium
indust
rialo
vens
andf
urnac
esthe
avera
geen
ergyc
ostsa
rebe
twee
n10t
o20t
imes
thepu
rchase
price.
Theb
asecas
ewith
thelar
gest
energ
ycost
:purc
hase
price
ratio
isBC
6–the
large
indus
trialfu
rnace
inwh
ichthe
lifetim
eene
rgyco
stis
justo
ver2
0tim
esmo
retha
nthe
purch
asepri
ce.It
isim
porta
ntto
note
howe
ver,
thatin
stallat
ionco
stsfor
BC1t
oBC5
arelow
asthe
sefur
naces
ando
vens
areins
talled
inex
isting
build
ingsa
ndlitt
lead
dition
alinf
rastru
cture
costs
areinc
urred
.How
ever
theins
tallat
ioncos
tsfor
large
furna
cesan
dove
nswil
lvary
consi
derab
ly.Wh
enan
ewfur
nace
orov
enis
instal
ledat
a“gre
enfie
ld”sit
e,the
instal
lation
costs
willin
clude
anew
build
ing,p
rovisio
nofs
ervice
s,saf
etyeq
uipme
nt,up
strea
man
ddow
nstrea
meq
uipme
nt,etc
.The
total
instal
lation
cost
canbe
farmo
retha
nthe
price
ofthe
furna
ceor
oven
assh
ownb
ythe
exam
plesi
nTa
ble37
.For
exam
ple,t
hetot
alins
tallat
ioncos
tfor
anew
float
glass
instal
lation
is€1
00–1
50mi
llionw
herea
sone
new
float
glass
meltin
gfurn
aceis
€10
millio
n.An
other
exam
pleis
theins
tallat
ioncos
tfor
anIsa
smelt
instal
lation
.The
instal
lation
cost
is€7
0millio
nbut
theco
stof
theIsa
smelt
furna
ceits
elfwil
l

ERAT
echn
ology
Limite
dER
ARep
ortN
o.20
12-02
30
0431
2275
3ENT
RLot
4Fina
lRep
ortv6
231
©ER
ATech
nolog
yLtd
beon
lyab
out€
10mi
llion.
Invest
ment
cost
willb
emuc
hhigh
erifa
new
build
ingne
edst
obec
onstr
ucted
andt
here
willb
ecost
sfor
safety
equip
ment,
upstr
eam
andd
ownst
ream
equip
ment,
etc.s
otha
t“ins
tallat
ionco
sts”c
anbe
tentim
esas
much
astho
seuse
dfor
BC6a
ndBC
7inT
able
103.
Where
anex
isting
oldfur
nace
isrep
laced
byan
ewfur
nace
ofsim
ilardim
ensio
ns,th
einst
allatio
ncost
willb
efar
lesst
hans
hown
inTa
ble10
3.Th
erefor
e,the
range
ofest
imate
dlife
cycle
costs
forBC
6and
BC7c
ould
beas
follow
s:
Table
104.
Lifec
ycle
costs
(Eur
os)f
orBC
6and
BC7,
with
minim
alan
dhigh
insta
llatio
ncos
ts
Indic
ator
BC6–
minim
alins
talla
tion
cost
BC6–
highi
nsta
llatio
ncos
tBC
7–mi
nimal
insta
llatio
nco
stBC
7–hig
hins
talla
tionc
ost
Prod
uctp
rice
4000
000
4000
000
2000
000
2000
000
Insta
llatio
n/ac
quisi
tion
costs
(ifan
y)10
0000
2000
0000
7000
1000
0000
Fuel
(gas
,oil,
wood
)82
7459
3082
7459
3012
9650
2312
9650
23Ele
ctrici
ty0
00
0Re
pair
andm
ainte
nanc
eco
st76
1276
1238
0638
06
Tota
ls��
�$%$
����
�&$%
$��
��'&
$��'
��'�
���'
Thep
roport
ionof
lifecyc
lecos
tsdu
etoe
nergy
costs
are:
Table
105.
Prop
ortio
nofli
fecy
cleco
stsdu
etoc
osto
fene
rgyf
orBC
6and
BC7w
ithmi
nimal
andh
ighins
talla
tionc
osts
Base
case
Minim
alins
tallat
ionco
stHi
ghins
talla
tionc
ost
BC6
95.3%
77.5%
BC7
86.6%
51.9%

ERA Technology Limited ERA Report No. 2012-0230
043122753 ENTR Lot 4 Final Report v6 232 © ERA Technology Ltd
4.7. EU-27 total impact EU-27 total impacts are calculated by multiplication of the environmental impacts of each base case by the number of this base case type of furnace or oven currently in stock in the EU. Table 106 presents the impacts of each Base case at the EU level in their respective units of measurement. The total amount of primary energy consumed is calculated to be 5 942 PJ (1 650 TWh) which is around 20% higher than predicted using a different method. The data in Table 54 and Table 55 indicates that a total of c. 1,200 TWh but this excludes energy consumed for manufacture of furnaces and ovens. An estimate provided by CECOF for total EU energy consumption by furnaces and ovens is 1,200 TWh / year. BC5b –MICFg, which is the Base case with the lowest share in energy consumption for manufacturing (0.07%), is responsible for 1.1 TWh of energy consumption whereas the large furnaces BC6 account for 1 375 TWh/year (83.3%) which is the largest energy consumption.
Table 108 presents the impacts of each Base case per functional unit per year135 which facilitates comparison across base cases. Figure 26, compares the shares of the laboratory and medium size Base cases.
135 Life-cycle impact divided by Product Life in years divided by Electricity (“On-mode: Consumption per hour, cycle, setting, etc.” in kWh) or Heat (“Avg. Heat Power Output” in kW) capacity from the EcoReport Tool.

ERAT
echn
ology
Limite
dER
ARep
ortN
o.20
12-02
30
0431
2275
3ENT
RLot
4Fina
lRep
ortv6
233
©ER
ATech
nolog
yLtd
Table
106:
Annu
alEU
impa
ctsof
thes
tock
oflab
orat
orya
ndind
ustri
alfu
rnac
esan
dove
nsIn
dicat
orUn
itBC
1LO
BC2a
MIBO
eBC
2bMI
BOg
BC3a
MICO
eBC
3bMI
COg
BC4a
MIBF
eBC
4bMI
BFg
BC5a
MICF
eBC
5bMI
CFg
BC6
BC7
TOTA
L
Othe
rRes
ource
s&W
aste
Total
Energ
y(GE
R)PJ
934
748
.6739
.175.4
925
2.91
35.37
28.30
3.97
4952
.7421
2.45
5935
ofwh
ich,e
lectric
ityPJ
934
70.0
139
.030.0
025
1.35
0.04
28.25
0.00
8.87
0.43
684
Water
(proc
ess)
mln.
m31
230.0
22.6
40.0
017
.400.0
61.9
00.0
020
.250.6
367
Water
(cooli
ng)
mln.
m324
924
0.01
103.9
90.0
066
9.23
0.02
75.30
0.00
2.77
0.14
1800
Waste
,non
-haz./
landfi
llkt
1241
81.3
952
.190.6
134
9.60
5.10
34.62
0.16
1629
.6775
.2725
79Wa
ste,h
azardo
us/inc
inerat
edkt
08
0.01
0.91
0.00
5.82
0.00
0.65
0.00
0.02
0.01
16
Emiss
ions(
Air)
Gree
nhou
seGa
sesin
GWP1
00mt
CO2
eq.
015
2.69
1.72
0.30
11.11
1.96
1.24
0.22
274.7
911
.8132
2
Ozon
eDep
letion
,emi
ssion
stR-
11eq
.Ne
gligib
leAc
idific
ation
,emi
ssion
sktS
O2eq
.2
89.53
0.81
10.13
0.10
65.36
0.63
7.30
0.07
89.53
4.17
270
VOCs
Kt0.0
10.1
30.0
40.0
20.0
00.1
00.0
30.0
10.0
03.7
30.1
74.2
POPs
gi-Te
q0.1
32.4
80.0
20.3
20.0
12.4
90.0
70.2
10.0
025
.641.1
933
Heav
yMeta
lstoa
irtNi
eq.
0.36.4
80.0
50.7
60.0
15.6
90.1
20.5
30.0
024
.141.0
039
PAHs
tNieq
.0.0
40.6
90.0
00.0
80.0
00.5
00.0
00.0
60.0
00.1
80.0
31.6
Partic
ulate
Matte
r(PM
,dust
)Kt
0.23
2.31
0.05
0.31
0.01
1.89
0.05
0.17
0.00
7.89
2.05
15Em
ission
s(W
ater
)He
avyM
etalst
owate
rtH
g/20
0.13
2.52
0.02
0.31
0.01
2.30
0.06
0.20
0.00
1.74
0.11
7.4Eu
troph
icatio
nktP
O40.0
00.0
20.0
00.0
00.0
00.0
30.0
00.0
00.0
00.0
60.0
00.1
1Pe
rsiste
ntOr
ganic
Pollu
tants
(POP)
gi-Te
qne
gligib
le
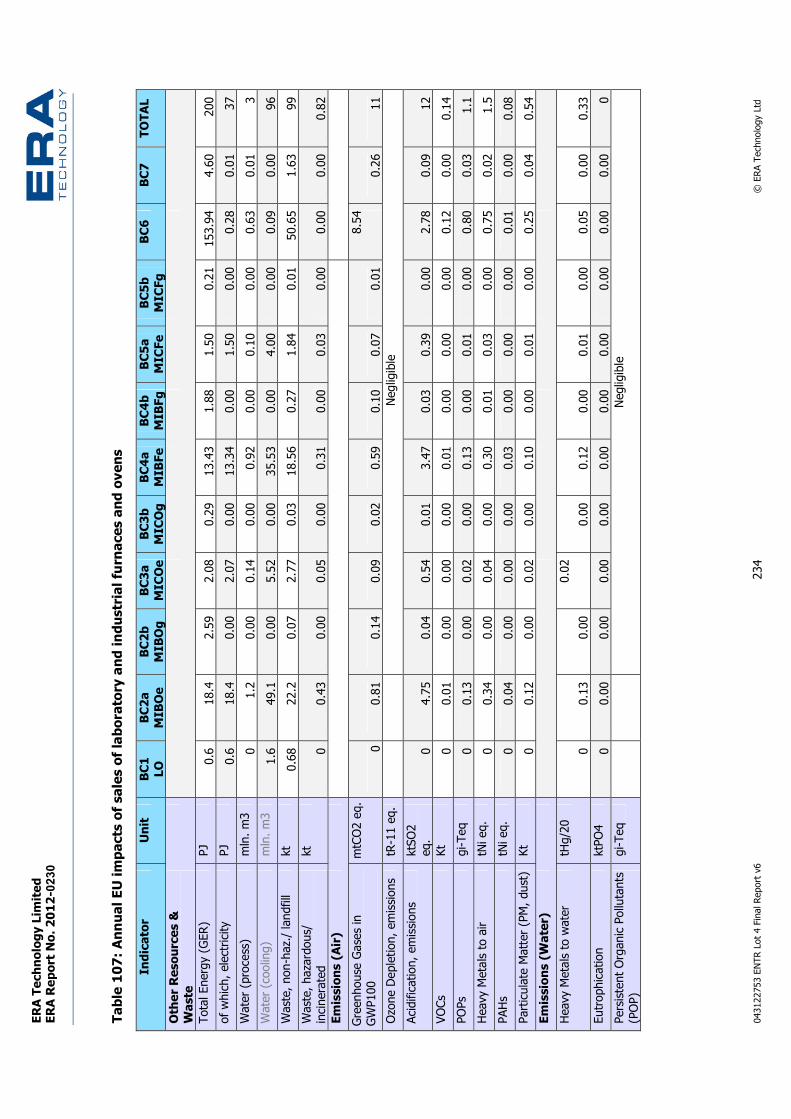
ERAT
echn
ology
Limite
dER
ARep
ortN
o.20
12-02
30
0431
2275
3ENT
RLot
4Fina
lRep
ortv6
234
©ER
ATech
nolog
yLtd
Table
107:
Annu
alEU
impa
ctsof
sales
oflab
orat
orya
ndind
ustri
alfu
rnac
esan
dove
nsIn
dicat
orUn
itBC
1LO
BC2a
MIBO
eBC
2bMI
BOg
BC3a
MICO
eBC
3bMI
COg
BC4a
MIBF
eBC
4bMI
BFg
BC5a
MICF
eBC
5bMI
CFg
BC6
BC7
TOTA
LOt
herR
esou
rces&
Was
teTo
talEn
ergy(
GER)
PJ0.6
18.4
2.59
2.08
0.29
13.43
1.88
1.50
0.21
153.9
44.6
020
0of
which
,elec
tricity
PJ0.6
18.4
0.00
2.07
0.00
13.34
0.00
1.50
0.00
0.28
0.01
37Wa
ter(pr
ocess
)ml
n.m3
01.2
0.00
0.14
0.00
0.92
0.00
0.10
0.00
0.63
0.01
3Wa
ter(co
oling
)ml
n.m3
1.649
.10.0
05.5
20.0
035
.530.0
04.0
00.0
00.0
90.0
096
Waste
,non
-haz./
landfi
llkt
0.68
22.2
0.07
2.77
0.03
18.56
0.27
1.84
0.01
50.65
1.63
99Wa
ste,h
azardo
us/inc
inerat
edkt
00.4
30.0
00.0
50.0
00.3
10.0
00.0
30.0
00.0
00.0
00.8
2Em
ission
s(Air
)Gr
eenh
ouse
Gases
inGW
P100
mtCO
2eq.
00.8
10.1
40.0
90.0
20.5
90.1
00.0
70.0
18.5
40.2
611
Ozon
eDep
letion
,emi
ssion
stR-
11eq
.Ne
gligib
leAc
idific
ation
,emi
ssion
sktS
O2eq
.0
4.75
0.04
0.54
0.01
3.47
0.03
0.39
0.00
2.78
0.09
12VO
CsKt
00.0
10.0
00.0
00.0
00.0
10.0
00.0
00.0
00.1
20.0
00.1
4PO
Psgi-
Teq
00.1
30.0
00.0
20.0
00.1
30.0
00.0
10.0
00.8
00.0
31.1
Heav
yMeta
lstoa
irtNi
eq.
00.3
40.0
00.0
40.0
00.3
00.0
10.0
30.0
00.7
50.0
21.5
PAHs
tNieq
.0
0.04
0.00
0.00
0.00
0.03
0.00
0.00
0.00
0.01
0.00
0.08
Partic
ulate
Matte
r(PM
,dust
)Kt
00.1
20.0
00.0
20.0
00.1
00.0
00.0
10.0
00.2
50.0
40.5
4Em
ission
s(W
ater
)He
avyM
etalst
owate
rtH
g/20
00.1
30.0
00.0
20.0
00.1
20.0
00.0
10.0
00.0
50.0
00.3
3Eu
troph
icatio
nktP
O40
0.00
0.00
0.00
0.00
0.00
0.00
0.00
0.00
0.00
0.00
0Pe
rsiste
ntOr
ganic
Pollu
tants
(POP)
gi-Te
qNe
gligib
le

ERAT
echn
ology
Limite
dER
ARep
ortN
o.20
12-02
30
0431
2275
3ENT
RLot
4Fina
lRep
ortv6
235
©ER
ATech
nolog
yLtd
Table
108:
Impa
ctsof
thel
abor
ator
yand
indus
trial
furn
aces
ando
vens
perf
uncti
onal
unit
(kW
)*pe
ryea
rIn
dicat
orUn
itBC
1LO
BC2a
MIBO
eBC
2bMI
BOg
BC3a
MICO
eBC
3bMI
COg
BC4a
MIBF
eBC
4bMI
BFg
BC5a
MICF
eBC
5bMI
CFg
BC6
BC7
Othe
rRes
ource
s&W
aste
Total
Energ
y(GE
R)GJ
&'&��
52.6
22.32
60.76
25.75
52.92
22.40
60.61
25.71
32.39
32.55
ofwh
ich,e
lectric
ity(in
prima
ryPJ)
GJ&�
'�%
52.5
0.01
60.54
0.02
52.60
0.03
60.51
0.01
0.06
0.07
Water
(proc
ess)
m3$$
��3.5
0.01
4.09
0.02
3.64
0.04
4.07
0.01
0.13
0.10
Water
(cooli
ng)
m3��
����
140.0
0.00
161.2
90.0
014
0.04
0.01
161.2
90.0
00.0
20.0
2Wa
ste,n
on-ha
z./lan
dfill
Kg��
����
63.3
0.64
80.95
2.85
73.15
3.23
74.15
1.06
10.66
11.53
Waste
,haza
rdous/
incine
rated
Kg�'
��1.2
0.01
1.42
0.01
1.22
0.00
1.40
0.00
0.00
0.00
Emiss
ions(
Air)
Gree
nhou
seGa
sesin
GWP1
00ton
neCO
2eq.
35.2
2.31.2
32.6
61.4
32.3
21.2
42.6
51.4
21.8
1.81
Ozon
eDep
letion
,emi
ssion
sgR
-11eq
.Ne
gligib
leAc
idific
ation
,emi
ssion
sKg
SO2eq
.��
���
13.57
0.37
15.71
0.45
13.68
0.40
15.63
0.43
0.59
0.64
Volat
ileOr
ganic
Comp
ound
s(VO
C)Kg
���
0.02
0.02
0.02
0.02
0.02
0.02
0.02
0.02
0.02
0.03
Persi
stent
Orga
nicPo
llutan
ts(PO
P)mg
i-Teq
&��
0.38
0.01
0.50
0.03
0.52
0.05
0.45
0.01
0.17
0.18
Heav
yMeta
lstoa
irg
Nieq
.�'
��0.9
80.0
21.1
80.0
41.1
90.0
81.1
30.0
20.1
60.1
5PA
Hsg
Nieq
.��%
0.10
0.00
0.12
0.00
0.10
0.00
0.12
0.00
0.00
0.00
Partic
ulate
Matte
r(PM
,dust
)Kg
�&��
0.35
0.02
0.48
0.05
0.40
0.03
0.37
0.02
0.05
0.31
Emiss
ions(
Wat
er)
Heav
yMeta
lstow
ater
gHg/2
0���
0.38
0.01
0.48
0.02
0.48
0.04
0.44
0.01
0.01
0.02
Eutro
phica
tion
KgPO
4���
0.00
0.00
0.00
0.00
0.01
0.00
0.00
0.00
0.00
0.00
Persi
stent
Orga
nicPo
llutan
ts(PO
P)mg
i-Teq
Negli
gible
*Life
-cycle
impa
ctdiv
idedb
yProd
uctL
ifein
years
divide
dbyE
lectric
ity(“O
n-mod
e:Co
nsum
ption
perh
our,
cycle,
settin
g,etc
.”in
kWh)
orHe
at(“A
vg.H
eat
Powe
rOutp
ut”in
kW)c
apaci
tyfro
mthe
EcoR
eport
Tool.

ERAT
echn
ology
Limite
dER
ARep
ortN
o.20
12-02
30
0431
2275
3ENT
RLot
4Fina
lRep
ortv6
236
©ER
ATech
nolog
yLtd
����
���
���
���
���
��
(���� ��
� )*+ �
,�
���
-��������
��)*��
���.
��)�/,
0����
*�����
��,
0����
*���
��� ,
0����-�
����1�2���
����
0����-
�1����
��2���
��������
+���
���
��+�
�����+0
����
�����������
�-�.
�������
3����
���4�
����5
�.��
����
*345
,��
�������
�4� ��
����
��������*�4�
,
6��7)�
�����
�����
��6�
�������
����������*
��-�
���,
6��7)�
�����
����
���
����
����
����
85��94
85��
��:84�
85�"
��:84
85%�
��:54�
85%"
��:54
85��
��:8;�
85�"
��:8;
85$�
��:5;�
85$"
��:5;
85�
85&
Figur
e26:
Shar
eofE
Uim
pacts
ofth
esto
ck

ERA Technology Limited ERA Report No. 2012-0230
043122753 ENTR Lot 4 Final Report v6 237 © ERA Technology Ltd
4.8. Task 4 - Conclusions Laboratory ovens – impacts are relatively small in comparison with medium-size and large industrial furnaces and ovens.
Medium size industrial ovens and furnaces in total have a significant impact with a total primary energy consumption of 211 TWh per year and GWP of 34 million tonnes CO2 equivalent, based on BC 2 - 5. For the electrically-powered ovens and furnaces, the largest impacts are in the use phase mainly due to electricity consumption and its associated impacts. Gas ovens and furnaces are however different, with 5 impacts being the most significant in the use phase and 5 in the production of materials phase. There is a difference in impacts due to the two different materials in the production phase between ovens and furnaces, e.g. non-hazardous waste, heavy metals to air and water and energy for materials production were all significantly larger for furnaces than ovens. The material chosen to represent the furnace insulation has larger environmental impacts than the material representing oven insulation. For oven insulation, the material parameter "glass – lamps" from the EcoReport tool was used to represent mineral wool, which is probably not very different in its environmental impacts to the actual mineral wool insulation material used. However, there was no suitable ceramic material available in the EcoReport tool spreadsheet; therefore, ferrites were used as the closest match, but it should be noted that this will not be the same, and so therefore this approximation will have introduced some inaccuracies into the overall assessment.
Large industrial – results show that energy consumption in the use phase is the most significant environmental impact and that large industrial furnaces are the most significant energy consumer in this sector with a consumption of 1 435 TWh/year of a total of 1 650 TWh/year. The stock of large industrial furnaces (BC6 and BC7) have a combined GWP impact of 287 million tonnes CO2 equivalent, per year.
Total EU energy consumption - The value of the total EU-27 energy consumption for all furnaces and ovens assessed is predicted at 1 650 TWh/year, which is around 20% more than that estimates from the stakeholder CECOF and slightly more than the estimates of energy consumption given in Table 54 and Table 55. This total however includes energy consumed in the manufacture and dispose of furnaces and ovens as well as energy consumed in the use phase. This value of total EU-27 GWP impact is estimated to be 321 million tonnes CO2 equivalent per year, for the EU27 stock of ovens and furnaces (source: Table 106).

ERA Technology Limited ERA Report No. 2012-0230
043122753 ENTR Lot 4 Final Report v6 238 © ERA Technology Ltd
Part B IMPROVEMENT POTENTIAL 5. Task 5 – Technical Analysis of BAT and BNAT The main eco-design impacts of furnaces and ovens during their life-cycles are (i) energy consumption and the corresponding carbon dioxide emissions and (ii) emissions of hazardous substances. To some extent these will be inter-related but for the purposes of Task 5 we will consider them separately.
• Energy efficiency – furnace and oven design is very varied and so a study of energy efficiency would be very complex; thus initially we will consider the main causes of energy losses that are due to furnace design. Operational losses will also be considered although furnace manufacturers have limited influence over how their customers use the equipment. Different furnace designs have different efficiencies but there will be many reasons why a particular design is selected. This will also be considered here. Energy is consumed by the parts or materials being processed within the furnace or oven and the quantity of energy required will depend on the material composition, quantity, temperature increase, energy to cause phase changes and energy for or from chemical reactions. This energy is necessary for the process and cannot be reduced. However energy to heat the interior of the equipment and heat losses will depend on furnace / oven design and to some extent these can be minimised. The main components of furnaces and ovens will be reviewed to assess the best available technology for each of the parts of furnaces and ovens that affect energy efficiency.
• Hazardous substances – hazardous substances are used and released during extraction and production of materials used to construct furnaces and ovens, to fabricate furnaces and ovens and at end of life when they are recycled. Some may also be emitted during use such as NOx from gas burners and CO from carbon-based fuels but otherwise emissions from furnaces and ovens are usually minimal. However, large quantities of hazardous substances are produced by heating materials in furnaces and ovens. These released substances are the result of processes carried out within the equipment and so should not be considered by this study. Furnace design can influence these released substances to a limited extent but usually these emissions are unavoidable and necessary.
Other issues include water consumption from the production and end of life cycle phases and as cooling water in the use phase. This is considered by the MEEuP methodology.
The best available technology of furnaces and ovens will be studied using the approach described above, i.e.
• Energy efficiency and losses affected by component parts of furnaces and ovens • Energy losses due to operational practices • Energy efficiency and furnace / oven design • Hazardous substances from furnace manufacture • Hazardous substances in the use phase

ERA Technology Limited ERA Report No. 2012-0230
043122753 ENTR Lot 4 Final Report v6 239 © ERA Technology Ltd
• Hazardous substances at end of life. However first it is important to understand what is the definition of “Best Available Technology”. This is defined by the Industrial Emissions Directive (2010/75/EU, Article 3.10) as:
"Best Available Techniques" means the most effective and advanced stage in the development of activities and their methods of operation which indicates the practical suitability of particular techniques for providing the basis for emission limit values and other permit conditions designed to prevent and, where that is not practicable, to reduce emissions and the impact on the environment as a whole:
a. "techniques" includes both the technology used and the way in which the installation is designed, built, maintained, operated and decommissioned;
b. "available techniques" means those developed on a scale which allows implementation in the relevant industrial sector, under economically and technically viable conditions, taking into consideration the costs and advantages, whether or not the techniques are used or produced inside the Member State in question, as long as they are reasonably accessible to the operator;
c. "best" means most effective in achieving a high general level of protection of the environment as a whole
Best Available Techniques (BAT) are defined slightly differently for eco-design studies. Ecodesign BAT is defined as the best technology available, irrespective of cost. Also, Ecodesign BAT represents the current best technology, whereas the BAT in IPPC BREF guides is inevitably out of date, by as much as 10 years in some cases.
5.1. Definition of BAT
5.1.1 Historical eco-design technology developments Over the last 30 – 40 years, there have been very significant improvements in the level of hazardous emissions and the energy efficiency of new furnaces in EU as a result of research by furnace manufacturers. The trend to reduce hazardous emissions has been driven mainly by legislation, whereas the rapid and large increase in energy prices has driven energy efficiency innovations.
Emissions The European Environment Agency has collected and reported data on the level of emissions of certain hazardous substances in the EU from industrial processes which will mostly be from processes carried out in industrial furnaces136.
136 European Union emission inventory report 1990 – 2008 under the UNECE Convention on long-range transboundary pollution. EEA Technical report no. 7/2010

ERA Technology Limited ERA Report No. 2012-0230
043122753 ENTR Lot 4 Final Report v6 240 © ERA Technology Ltd
Table 109. Decrease in pollutant emissions from industrial processes in EU since 1990 Pollutant Decrease between
1990 and 2008 Percentage of emission by industrial processes in EU
Carbon monoxide 20% 10% Sulphur dioxide 50% 5% Lead 50% 32% Cadmium 45% 16% Mercury 58% 19% Polychlorinated biphenyls 87% 37%
NOx emissions from industrial processes accounts for only 2% of the EU total emissions and so no data on decreased emissions is given in this report. NOx is a potent greenhouse gas which is emitted by road transport and farming (mainly from inefficient use of fertilisers) in significant quantities. A much larger reduction in NOx emissions in the EU should be achievable by control of transport and agriculture than is possible with industrial furnaces.
Emissions of many other substances have also decreased and legislation such as the IPPC (now IED) directive has achieved this by imposing limits on the emissions from industrial installations. It is important to note that the majority of these emissions arise from processes carried out in furnaces and ovens and only small quantities of CO, SO2 and NOx arise from the furnaces and ovens themselves, mainly from combustion of fossil fuels. Reductions in emissions have been achieved by a combination of process changes and the installation of hygiene equipment.
Although it is not clear whether waste to energy incinerators should be considered as a type of furnace (as discussed in Tasks 1 – 3), the historical changes in emissions have been considered here. A recent study in Spain showed that heavy metals emissions (lead, mercury, chromium and cadmium) are so low that people living close to incinerators (within 2km) have statistically the same blood and urine concentrations of these heavy metals as people living longer distances away from incinerators137. It should be stressed that fossil fuel power stations also emit these four metals, as they occur naturally in coal and oil. Design changes have resulted in large decreases in emissions of chloro-dioxins and furans so that the amounts emitted are now very small. In 1990 in Germany, 30% of dioxin emissions were from waste incinerators but by 2000 this had dropped to less than 1% and it is even less today. A study in Portugal showed that residents living near waste to energy plants did not have increased blood dioxin levels138.
137 Waste incinerator health risks: no evidence for toxic metal build-up, EC Science for Environment Policy newsletter, 11 Nov 2010, http://ec.europa.eu/environment/integration/research/newsalert/pdf/217na1.pdf 138 Determinants of dioxins and furans in blood of non-occupationally exposed populations living near Portuguese solid waste incinerators, Chemosphere 67 (2007) S224–S230, 22 Jan 2007, http://www.endseurope.com/docs/70820a.pdf, and Waste Incineration — A Potential Danger? Bidding Farewell to Dioxin Spouting, German Federal Ministry for the Environment, Nature Conservation and Nuclear Safety, Sept 2005, http://www.bmu.de/english/waste_management/downloads/doc/35950.php

ERA Technology Limited ERA Report No. 2012-0230
043122753 ENTR Lot 4 Final Report v6 241 © ERA Technology Ltd
Energy efficiency and reduction of energy consumption Significant improvements have occurred especially with large furnaces and ovens, encouraged by the increasing cost of energy. Improvements have also been made to medium-size industrial furnaces and ovens whereas there is very little information available on laboratory products.
Large furnaces and ovens It is difficult to quantify the overall improvement that has occurred because the improvements within each sector have varied considerably; as this has depended on many variables, but mainly on the type of furnace and process. However, energy consumption has decreased by c.50% in many sectors in the last c.50 years. Some examples are:
Table 110. Improvements in energy efficiency achieved by industry for industrial furnaces Furnace/process Improvement
Electric arc furnaces (steel melting)
Typical energy consumption for electric arc furnace melting and refining of steel has dropped from c.630 kWh/tonne in 1985 to as low as 300 kWh/tonne in 2008139 - 52% decrease.
Steel production process
World Steel Association figures for USA, Japan and EU15 since 1975 show a reduction of 45 – 50% in energy consumption for crude steel production. USA 1958 to 1994: energy consumption per tonne refined steel decreased by 27%140. Asmall increase in CO2 emissions occurred after 1990 due to a switch from oil to coal. ULCOS data shows that EU15 steel production energy consumption has decreased from 1000kgCO2/tonne steel in 1955 to c.600kgCO2/tonne in 1975 and to 490kgCO2/tonne in 2010 (51% decrease). ULCOS claim that the best EU plants have no further potential for improvement using current technology141. There is however very significant scope for energy reductions by refurbishment of existing plant and using all available energy efficiency innovations.
Cement kilns Between 1990 and 2006 (worldwide) 142 • Gross CO2 emissions decreased by 5.3% • Thermal energy consumption decrease of 14%
Energy consumption in Germany has improved from 8GJ/tonne clinker in 1950 to c.3.7GJ/tonne clinker in 2008 (3.7GJ/t is c.70% of the maximum theoretical efficiency)143 – 54% decrease. Further details are given below.
Brick and roof tile kilns and ovens
Some new processes consume up to half of the energy per tonne of product compared to kilns that they replace which were installed 30 years ago (up to 50% reduction)144.
139 A. Opfermann, Badische Stahl Engineering GmbH, http://www.bse-kehl.de/Energy_Efficiency_of_EAF__International_Arab_Iron___Steel_Conference__Qatar__March_2008_.pdf 140 “Energy Efficiency and Carbon Dioxide Emissions Reduction Opportunities in the U.S. Iron and Steel Sector”, E Worrel, et. al., 1999 141 Ultra-Low Carbon Steelmaking (ULCOS) http://www.ulcos.org/en/steel/co2_limits.php 142 “The Cement Sustainability Initiative - Cement Industry Energy and CO2 Performance”, World Business Council for Sustainable Development 143 Environmental data on the German cement industry 2008, VDZ 144 Information provided by brick and roof tile manufacturers

ERA Technology Limited ERA Report No. 2012-0230
043122753 ENTR Lot 4 Final Report v6 242 © ERA Technology Ltd
Furnace/process Improvement Glass manufacture Comité Permanent des Industries du Verre Européenes (CPIV) report that energy
consumption per tonne of glass manufactured has decreased by 60% (in France) since the 1960s. Most of this improvement was made between 1960 and c.1990.
Petrochemical Difficult to estimate as energy is used for many thermal processes that are not furnaces or ovens. One source estimates that energy consumption has decreased (per barrel) by 25% since 1973145.
Past performance of the cement industry The World Business Council for Sustainable Development (WBCSD) is an independent body that, amongst many other activities, monitors the performance of the cement industry worldwide 146 .WBCSD collects and publishes data on energy consumption and energy efficiency, including the thermal energy to produce clinker in rotary kilns. It also publishes data on electricity consumption, but it should be noted that only c.20% of this electricity is used by kilns during the process, most being used for grinding. Coverage is high for Europe with 94% of kilns included but lower elsewhere, especially China with only 5% of producers (probably the most efficient) providing data. The data shows trends over the past 20 years, and differences between countries. In Europe, very few new installations are being built, but existing installations are being refurbished; this refurbishment can include new kilns, and the new installation will be much more energy efficient than the ones they replace. The cost of new installations is very high; therefore, refits occur only after many years of use. The improvements in average energy efficiency in each country and region reflect the extent of refits. If there are few refurbishments carried out, and where most installations are older then the average, energy consumption will be higher than in those countries where more installations have been refurbished. Data from WBCSD is shown here:
Table 111. WBSCD data for European grey cement production Year European energy consumption excluding
electricity (kgCO2/tonne clinker) European thermal heat consumption
(MJ/tonne clinker) 1990 909 4050 2005 867 3690 2008 866 3730
The increase in thermal heat between 2005 and 2008 is partly due to changes in the type of fuel used to types that emit less CO2.
Within the EU there are differences between Member States as shown below:
145 http://www.need.org/needpdf/infobook_activities/SecInfo/ConsS.pdf 146 http://www.wbcsdcement.org/index.php?option=com_content&Task=view&id=57&Itemid=118

ERA Technology Limited ERA Report No. 2012-0230
043122753 ENTR Lot 4 Final Report v6 243 © ERA Technology Ltd
Table 112. WBSCD data for Europe and European countries Country 2008 energy consumption excluding
electricity (kgCO2/tonne clinker) 2008 thermal heat consumption
(MJ/tonne clinker) Europe 866 3730 Austria 831 3670 France 839 3790 Germany 847 3730 Italy 873 3640 Spain 863 3640 UK 903 4010
Newly refurbished cement installations are much more energy efficient than old installations. One aim of refurbishment is to reduce the very high cost of energy consumed for cement production and this is achieved not only by replacing worn insulation and parts but by installation of new equipment. However the cost of refurbishment is very high this tends to be left as long as possible and so the average energy consumption in some EU States is significantly higher than others due to an older average age of installations.
Cement installations in the EU are mostly fairly old but these are refurbished every 20 – 30 years. This involves replacing old inefficient kilns with new more energy-efficient designs. Although referred to as a refit or refurbishment, in effect new furnaces are installed. Most EU cement manufacturers have voluntary targets for specific CO2 emissions and these improvements are being made by replacing old inefficient technology with modern cement kilns; however small improvements to the energy efficiency and fossil CO2 emissions from new kilns may be achievable. For example, Lafarge had a target of 20% reduction (based on 1990 emissions) in specific emissions by 2010 which they recently announced they had met. Other manufacturers have targets ranging from 10 – 25% reductions from 1990 emissions (by 2010, 2012 or 2015) and Italcement’s target is 690 kg CO2 / tonne of cement by 2012147. As on average, cement contains c.77% clinker, this would be equivalent to 896 kgCO2/tonne clinker (if this clinker content is used) which is higher than the 2008 EU average.
Past performance of the steel industry The steel industry has very significantly reduced energy consumption by making changes to existing production facilities when refurbishment is carried out. New installations are very uncommon in the EU and no new plant are planned. This has occurred due to many different changes which are described in Task 4. One issue for the EU steel industry is that production costs are higher than in many other countries including Russia and Brazil. Despite this, the quantity of crude steel produced in the EU has not changed significantly during the last 10 years. There is a cost disincentive to transport steel over long distances as steel is heavy and so transport costs are relatively high. Several studies have concluded that further significant reductions in energy consumption or CO2 emissions from the
147 Data from WBCSD (World Business Council for Sustainable Development)

ERA Technology Limited ERA Report No. 2012-0230
043122753 ENTR Lot 4 Final Report v6 244 © ERA Technology Ltd
best EU steel plant (using currently available technology) are not possible but there is scope for improvements when older designs are refurbished148.
Past performance by the oil refinery industry The energy efficiency performance of oil refineries and the energy efficiency of furnaces used in refineries are not the same. There is some independent data on past performance of oil refineries but none for furnaces. Calculation of the performance of oil refineries is complex, as the energy consumption depends on the mix of products that is produced. The method used is to calculate the Solomon energy intensity indicator (SII or EII) which accounts for the blend of products. Data is available for Canadian refineries, which showed that the Solomon SII varied considerably between Canadian oil refineries in 2002, although members of the Canadian Petroleum Products Institute agreed to and surpassed a 1% per year reduction in SII between 1995 and 2000 and improvements continued after this date149. Data for the UK150 show that energy intensity increased by more than 10% between 1998 and 2003 due to tighter product specifications, particularly lower sulphur content of fuels. It also showed considerable variation in Energy Intensity Index in 2005 between EU refineries with the best being 53.5 and the worst 105.6. This shows big energy efficiency differences but this data does not give any information on the energy efficiency of furnaces used within refineries. One problem with considering furnaces as isolated equipment in refineries is that waste heat is often used elsewhere within the refinery and so it is often not possible to consider individual furnaces as isolated items of equipment.
Ceramics industry Large improvements in energy efficiency have been achieved by a variety of furnace and oven design changes. Better insulation and re-use of waste heat such as using heat from kilns for drying have been widely adopted. Continuous furnaces are now commonly used as they usually consume less energy per tonne of product than batch furnaces but this relies on sufficient consistent throughput. Furnace design and the use of control technology have also given energy efficiencies but further improvements are possible (at least 10% according to one manufacturer) but are often not adopted by ceramics manufacturers due to limitations on the availability of capital. Payback periods may be more than 3 years.
Glass industry Glass production involves a series of thermal processes but glass melting consumes most energy. Furnace designs have changed to reduce energy consumption, although glass is made in a variety of different types of furnace and the choice depends mainly on the type of glass and the throughput. The most significant change has been the widespread adoption of regenerative burners for large-scale flat and container glass melting. Oxy-fuel, recuperative and electric furnaces are also used, mainly for capacity or technical reasons. Very large reductions in energy consumption have been 148 Harry Croezen and Marisa Korteland, “Technological developments in Europe, A long-term view of CO2 efficient manufacturing in the European region” Delft, CE Delft, June 2010 149 Energy Consumption Benchmark Guide, Conventional Petroleum Refining in Canada”, J. Nyboer and N. Rivers, Dec. 2002. Cat No. M27-01-1860E 150 EU Emissions Trading Scheme Benchmark Research for Phase 2, Final Report, UK DTI (now BIS), July 2005, http://www.bis.gov.uk/files/file27734.pdf

ERA Technology Limited ERA Report No. 2012-0230
043122753 ENTR Lot 4 Final Report v6 245 © ERA Technology Ltd
achieved since 1960 (60% reduction / tonne for French manufacturers according to CPIV). Further improvements are possible but industry claims that this is limited by capital availability, and that there are long payback periods.
Medium-size furnaces and ovens The energy efficiency of the best medium size furnaces and ovens has significantly improved as a result of the types of technology developments described in Task 4. However users are cost-sensitive and tend to buy the cheapest product available, unless they are high energy consumers, and so inevitably these furnaces and ovens will not have the best insulation or highest energy efficiency. Except for high energy consumption processes, the percentage of the cost that is due to energy for the manufacture of products made on a relatively small scale is relatively little and so there is little incentive to buy the most energy efficient product. Very energy efficient furnaces and ovens can be produced and are sold to some users but these are inevitably more expensive and thus tend to be bought only for high energy consumption processes. There are low cost Asian suppliers on the market in the EU, some of which sell furnaces and ovens with very poor energy efficiency, and as users consider price as a high priority, this does not encourage the development or use of better energy efficient designs.
Laboratory furnaces and ovens There is usually no incentive for users to consider energy consumption and usually no information is available. However, manufacturers of laboratory ovens and furnaces are carrying out research into designs that consume less energy. The main approach is by improved insulation and better control of air circulation within the chamber. There are also low-cost Asian suppliers in this market but there is no comparative data available on their energy efficiency.
5.1.2 Improvement potential for BAT insulation Currently a wide variety of types of insulation are used and this depends on the size of the furnace or oven, the process being carried out and the size of the investment to minimise heat losses. The improvement potential is considered for the three main size classifications being considered by this study.
Laboratory – There are many manufacturers of laboratory ovens and furnaces and the quality of the insulation is likely to vary. However no comparative data is available on how much variation exists as no labelling information is required and no standard energy consumption measurement method exists that is not process-specific (as is, for example, the draft ISO 13579-1 standard). One laboratory oven manufacturer has claimed that improving insulation may reduce the energy consumption of their ovens by up to 10% but a larger improvement potential may be possible for the poorest-insulated products on the EU market.
Medium size industrial – Stakeholders have claimed that the quality of insulation used for medium size ovens and furnaces varies considerably. Some manufacturers reduce oven costs by using less effective thermal insulation although this is not always apparent to the buyer, as there is no requirement on labelling information, and to date no standard energy consumption measurement method, as discussed previously, above. Furthermore, stakeholders have indicated that some

ERA Technology Limited ERA Report No. 2012-0230
043122753 ENTR Lot 4 Final Report v6 246 © ERA Technology Ltd
insulation types deteriorate more rapidly than others causing air leaks, thus increasing energy consumption after a period of time in use. No data is yet available on the difference in heat loss between the best and the worst ovens and furnaces but for ovens this is likely to be >10% (as this is claimed possible for laboratory ovens) although less improvement is likely for high temperature furnaces as the external surface temperature should be limited by EU safety legislation. One manufacturer of medium-size industrial ovens offers standard and energy efficient versions151. The energy efficient version has six energy saving features which together reduce energy consumption by 30%. These include use of an additional 150mm of wall and roof insulation.
Large industrial – This is very varied and the type of insulation used is usually process dependent. As large industrial furnaces have large energy costs, there is an incentive to use the BAT insulation. However, limits on capital investment may result in less being used than is possible. With some processes, it is essential that some heat losses occur through the insulation to prevent over-heating and this limits the performance of the insulation. With processes where there is no risk of chemical attack to the insulation by substances from the process, and where internal temperature can be controlled by heat input, there is no upper limit on the amount of insulation that could be used. A manufacturer has calculated the impact of doubling the thickness of their standard insulation regarding energy consumption, additional investment cost and payback period. Their results are:
• Furnace operating at 1100°C, energy saving = 3.1%, payback period = 7.7 years • Furnace operating at 1250°C, energy saving = 2.8%, payback period = 9.9 years
These are clearly long payback periods and the investment cost is very large, and therefore this would not be acceptable to most furnace users. The basic design used for this calculation was already close to BAT, and heat losses through the walls of this type of furnace are only c.7% of total heat consumption. There would be a larger reduction in energy consumption where furnaces with inferior quality insulation (as used by some manufacturers) were to be compared with the best quality insulation.
The best insulations use several layers of different materials that include low density and low thermal conductivity materials. The type of process however limits the options that can be used.
5.1.3 Improvement potential from heat recovery One manufacturer has provided an estimate of the energy potentially saved by incorporation of a heat exchanger. This is designed for use with a tunnel kiln to recover heat from combustion gases after these have been used to pre-heat cold ceramic parts. For a flue gas flow of 55,900 Nm3/hour (this would be for a very large furnace), the investment cost would be €410,000 and would recover energy worth €400,000 per year equivalent to c.16% energy saved. This is a payback period of only around one year, but many ceramics kilns do not have heat exchangers installed. The recovered heat could be used for heating driers (in many installations, there is already sufficient from hot ceramic cooling air), district heating (requires new-built houses, factories or offices nearby and only in cool climates), heating process water or power generation. There are however limitations discussed in section 5.6.2.
151 http://www.rdmengineering.co.uk/pdffiles/ovendata.pdf

ERA Technology Limited ERA Report No. 2012-0230
043122753 ENTR Lot 4 Final Report v6 247 © ERA Technology Ltd
Energy recovery and re-use within a furnace can also be by:
• Using hot air for gas burners, derived via cooling the products (used in ceramics kilns). Such a measure can save up to 17%;
• The best designs of regenerative burners can save up to 50% of energy in comparison with cold air gas burners;
• Pre-heating raw materials can reduce energy consumption – several examples are described in Task 4.
5.1.4 Improvement potential from BAT heat sources Recuperative and regenerative burners: These are types of energy re-use options which are fairly common in large gas-fired furnaces, but uncommon in medium size furnaces. The latest BAT designs include self-regenerating and self-recuperating burners, which are relatively small and so are suitable for medium size installations. BAT design uses a combination of internal and external recuperators or regenerators. More details on available design types are given in Task 4.
Infrared heating: By controlling the energy wavelength to match the material being heated, for example, maximising energy at 3 µm in driers to vaporise water.
Microwave assist: where this technique can be used, research has shown that savings of 50% - 80% are achievable. This is suitable for dental zirconia furnaces, heating certain types of industrial ceramics and sintering some metal powders such as titanium.
5.1.5 Improvement potential for process control The main types of process controller including the best designs are described in Task 4. It is difficult to quantify the improvement potential as this tends to be process-specific. Usually when changing from one type of process control to a more advanced system, there are changes to the process itself and yield improvements may also occur. Therefore the reduction in energy consumption will not all be due to the change of type of controller. It is difficult to generalise what improvement is achievable by using more accurate process control because this is always process dependent. A typical example is with a pusher furnace for heating aluminium slabs using burners with a central recuperator. By changing the existing process control to a new more accurate system which ensured better gas/air ratio control, a saving of 3% fuel consumption was achieved152.
5.1.6 Improvement potential by changing from batch to continuous processes The differences in energy consumption between batch and continuous process are described in Task 4. Energy savings may be possible because pre-heating and heat recovery from hot cooling air are more straightforward in continuous processes. The choice between batch and continuous is usually decided on the basis of scale of production, but process requirements are also important. Consistency and quality are usually of primary importance and if throughput is sufficient then continuous 152 Information provided by manufacturer of this furnace

ERA Technology Limited ERA Report No. 2012-0230
043122753 ENTR Lot 4 Final Report v6 248 © ERA Technology Ltd
processes may be preferable. Several manufacturers have observed a trend in the last 10 years for batch processes to be increasingly used even though these will consume more energy. The reasons are not technical, and are mainly because smaller scale batch processes have a lower investment cost. One manufacturer has suggested that lower cost labour from the new EU States has also encouraged less efficient batch processes. Therefore, although users decide to use batch or continuous for technical product quality reasons and to save energy, there will be circumstances where an improvement potential exists although this is by changing user behaviour.
5.1.7 Improvement potential from other design changes A ceramic kiln manufacturer has provided information that the replacement of standard kiln car materials with lightweight materials can typically reduce energy consumption by 6%. These kiln cars are more expensive to buy initially but have useful lives that are the same as standard kiln car materials and the payback time is less than 2 years. There is no technical reason why these lightweight materials should not always be used but many users use cheaper heavier kiln cars to minimise the size of their investment.
5.2. Improvement potential for BAT designs of industrial and laboratory furnaces and ovens
The following sub-Tasks look at energy efficient furnace and oven designs. These are split into very large (section 5.2.1) which is assessed by sector, medium-size industrial (section 5.2.2) and laboratory (section 5.2.3).
5.2.1 Large furnaces and ovens: best new and refurbished designs
Lime and cement industries
Lime kilns. Most lime kilns in the EU and all new kilns are twin shaft regenerative kilns which have very high energy efficiency. This is achieved by the unique design which is ideally suited to lime production. Lime is manufactured in very large quantities, and the energy cost is very high (c.40% of production costs).
The process is the endothermic reaction of calcium carbonate to calcium oxide (lime) and carbon dioxide. If gas burners are used, the combustion products are CO2 and water. The water must not be allowed to condense in contact with lime as it will react to form calcium hydroxide. The twin shaft regenerative lime kiln is operated with 20 minute cycles. During each cycle, one side is heated (side A) by the burners with air that has been heated by passing through the other side (side B). The lime that emerges from the base of each shaft is air cooled and the waste gases are cooled to 100°C to extract as much energy as possible without allowing condensation. At the end of a cycle, as much energy as possible has been extracted from the cooling side so that the next cycle can begin. Cooled lime is recovered from the base of side B and air is passed through the hot lime in side A to recover the heat for combustion in side B.

ERA Technology Limited ERA Report No. 2012-0230
043122753 ENTR Lot 4 F
Figure 27. Flowcooling) The energy efficie90%. The chemic
The published entoxide (lime). The in the range 3.2 content (i.e. reacwater) and the pran energy consum3.18GJ/tonne. As efficiency would bEuropean Lime Askilns is 3.47GJ/toequivalent to >90potential for improhigh cost of energ
A small reduction using bio-fuels anreductions will beelectrical heating emissions from thcarbon capture an
Cement kilns. Efrom clinker produ
A B
Fuel to A
Air in
Waste gases out
Lime out
Feedstock in
A B
Fuel to A
Air in
Waste gases out
Lime out
Feedstock in
inal Report v6 249 © ERA Technology Ltd
diagram of a twin shaft regenerative lime kiln (side A is heating, side B is
ncy of this process is reported to be over 80%8 and in practice can be well over al reaction in the lime kiln is:
CaCO3 = CaO + CO2
halpy of this reaction is 179kJ/mole which is equivalent to 3.18GJ/tonne of calcium IPPC BREF for cement and lime quotes energy consumption for this type of furnace – 4.2GJ/tonne. The amount of energy consumed depends on the final carbonate tion not 100% complete), the limestone water content (heat required to evaporate esence of other impurities that may affect energy consumption. However, achieving ption of 3.2GJ/tonne is remarkable considering that the theoretical consumption is the waste gas emissions must be at least 100°C to avoid condensation, this energy e very close to the maximum possible for this process. Information provided by the sociation (EuLA) is that the average of the best 10% twin shaft regenerative lime nne. Assuming that the limestone is dry and that 100% reaction occurs, this is % theoretical energy efficiency. There does not therefore appear to be significant vement of the best performing lime kilns in the EU and this is indicative of the very y at 40% of costs.
in global warming gas emissions (from fossil fuel combustion) has been achieved by d wastes but the availability of these alternative fuels is very limited and so further possible only by the development of a completely different process that would use where the electricity is generated from sources other than fossil fuels. The CO2 e chemical reaction in the kiln are inevitable and so can only be decreased by d storage (or by reducing consumption).
nergy costs are estimated to be over 25% of cement production costs, most being ction in the cement kiln. The energy efficiency of cement kilns has been improved

ERA Technology Limited ERA Report No. 2012-0230
043122753 ENTR Lot 4 Final Report v6 250 © ERA Technology Ltd
by many design changes. Wet and long kilns have been replaced by kilns having pre-heaters which are fluidised bed “cyclones” that use hot exhaust gases from the rotary calciner to preheat and calcine the raw materials and this utilises heat that would otherwise be wasted. Modern kilns also have pre-calciners - additional burners that raise the temperature of the feedstock after pre-heating to continue the chemical reactions before the material enters the rotary kiln. A further energy re-use measure is to collect the hot clinker in a special chamber and blow cold air over it to cool and then pass the heated air into the pre-heaters. Up to six pre-heater cyclone stages are used depending on many variables, including the properties of the raw materials, particularly moisture content. On average, the lowest energy consumption is achieved by the most pre-heater stages. These energy efficiency improvements have been achieved by using three separate thermal stages to the process instead of one, and the excess heat from the rotary kiln flue gases and from cooling the hot clinker are used in the first two stages of the process. This results in a process with high energy efficiency. Other measures that have improved energy efficiency include153:
• Better process control which one article reports can save up to 8% of energy • Seal replacement (prevents leaks of hot gases out or cold air in) • Improved thermal insulation • Efficient fuel combustion – ensure complete combustion, minimise excess air and use of
precessing jet burners • Use of energy-efficient variable speed drives. The cement industry has been fairly successful in reducing energy consumption but there have been smaller reductions of CO2 emissions. In the USA, CO2 emissions have risen as fuels have changed from natural gas to coal. CO2 is emitted from fossil fuels and calcination of limestone. CO2 emission from limestone production is inevitable and cannot be avoided but, in practice, the amount of CO2 emitted is balanced by an equal amount that is absorbed from the air when cement and concrete cure. Therefore the only permanent additional CO2 emission is from fossil fuel combustion. Coal (and pet coke) is the main fuel in the EU and is carbon intensive. The cement industry has reduced fossil carbon emissions by use of waste materials and small amounts of bio-fuels (see section 0). Wastes include tyres, paper, dried sewage, waste plastics waste solvents, etc. and only some of these are derived from fossil fuels. Another method of reducing emissions is to use less clinker in cement; small reductions have already been made, but the scope for further reductions is limited. The WBCSD-IEA cement roadmap shows a planned average clinker content reducing from 77% in 2012 to 71% by 2050. Further improvements based on current BAT are limited and will not achieve the EU’s 2050 target of an 80% reduction in GHG emissions without the use of carbon capture and storage (CCS) or alternative technologies which will be discussed in section 5.4 although this is not likely to be available commercially within 10 years and so is not BNAT as defined by Eco-design preparatory studies. A recent study by CE Delft, commissioned by the Climate Action Network154, which represents the views of “green NGOs”, found that the energy efficiency of new cement plant cannot be significantly improved, although there is scope for further energy recovery from flue gases. 153 E. Worrel, “Energy Efficiency Improvement and Cost Saving Opportunities for Cement Making. An ENERGY STAR Guide for Energy and Plant Managers”, Lawrence Berkeley National Laboratory, USA, 2008 154 Harry Croezen and Marisa Korteland, “Technological developments in Europe, A long-term view of CO2 efficient manufacturing in the European region” Delft, CE Delft, June 2010
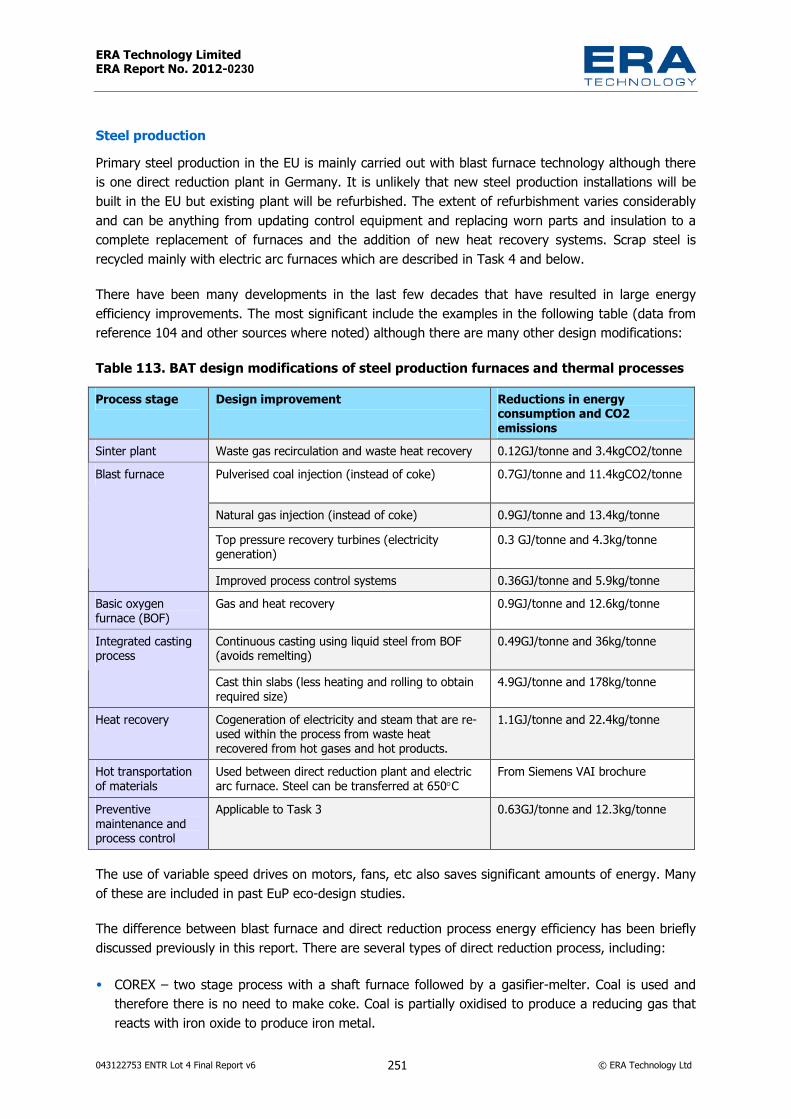
ERA Technology Limited ERA Report No. 2012-0230
043122753 ENTR Lot 4 Final Report v6 251 © ERA Technology Ltd
Steel production Primary steel production in the EU is mainly carried out with blast furnace technology although there is one direct reduction plant in Germany. It is unlikely that new steel production installations will be built in the EU but existing plant will be refurbished. The extent of refurbishment varies considerably and can be anything from updating control equipment and replacing worn parts and insulation to a complete replacement of furnaces and the addition of new heat recovery systems. Scrap steel is recycled mainly with electric arc furnaces which are described in Task 4 and below.
There have been many developments in the last few decades that have resulted in large energy efficiency improvements. The most significant include the examples in the following table (data from reference 104 and other sources where noted) although there are many other design modifications:
Table 113. BAT design modifications of steel production furnaces and thermal processes Process stage Design improvement Reductions in energy
consumption and CO2 emissions
Sinter plant Waste gas recirculation and waste heat recovery 0.12GJ/tonne and 3.4kgCO2/tonne Pulverised coal injection (instead of coke) 0.7GJ/tonne and 11.4kgCO2/tonne
Natural gas injection (instead of coke) 0.9GJ/tonne and 13.4kg/tonne Top pressure recovery turbines (electricity generation)
0.3 GJ/tonne and 4.3kg/tonne
Blast furnace
Improved process control systems 0.36GJ/tonne and 5.9kg/tonne Basic oxygen furnace (BOF)
Gas and heat recovery 0.9GJ/tonne and 12.6kg/tonne
Continuous casting using liquid steel from BOF (avoids remelting)
0.49GJ/tonne and 36kg/tonne Integrated casting process
Cast thin slabs (less heating and rolling to obtain required size)
4.9GJ/tonne and 178kg/tonne
Heat recovery Cogeneration of electricity and steam that are re-used within the process from waste heat recovered from hot gases and hot products.
1.1GJ/tonne and 22.4kg/tonne
Hot transportation of materials
Used between direct reduction plant and electric arc furnace. Steel can be transferred at 650°C
From Siemens VAI brochure
Preventive maintenance and process control
Applicable to Task 3 0.63GJ/tonne and 12.3kg/tonne
The use of variable speed drives on motors, fans, etc also saves significant amounts of energy. Many of these are included in past EuP eco-design studies.
The difference between blast furnace and direct reduction process energy efficiency has been briefly discussed previously in this report. There are several types of direct reduction process, including:
• COREX – two stage process with a shaft furnace followed by a gasifier-melter. Coal is used and therefore there is no need to make coke. Coal is partially oxidised to produce a reducing gas that reacts with iron oxide to produce iron metal.

ERA Technology Limited ERA Report No. 2012-0230
043122753 ENTR Lot 4 Final Report v6 252 © ERA Technology Ltd
• FINEX – Multi-stage fluidised bed reactors with iron ore reduced by reducing gas from coal. • MIDREX – Uses natural gas in a shaft furnace so is viable only where plentiful supplies of natural
gas are available. The reasons for the uncertainty over whether the blast furnace/BOF or direct reduction/Electric Arc Furnace (EAF) route uses less energy is that these are complex processes, with many local variations to consider. Also the energy consumption per tonne depends on many different variables including raw material composition and energy efficiency modifications installed in the plant. A theoretical study indicates that direct reduction will consume less energy per tonne, but also indicates that impurities in the ore have a significant impact155.
Energy consumption and CO2 emissions are related as the main energy source is coal (mostly carbon) but some CO2 is also produced by limestone which is added to the blast furnace and dolomite which is added as a flux to the BOF. CO2 is inevitable from blast furnace production of steel as carbon is necessary to react with the iron oxide:
C + Fe2O3 → CO2 + Fe
This reaction is very exothermic, generating more heat than is needed to melt iron, and so this is recovered for re-use elsewhere and also for electricity generation. The recent CE Delft study found that steel production using modern blast furnace technology emits 1.65 tonnes CO2 per tonne of steel produced mainly as a result of the need for carbon as a reducing agent and that there is little scope for any further reductions. The use of natural gas and biomass would reduce CO2 emissions but supplies of these fuels are limited.
Hot liquid steel from the BOF or electric arc furnace is cast into billets, ingots or slabs (usually several types of product are made simultaneously in each plant). Ideally, the shapes produced are close to those that can be used to minimise energy required to manufacture steel parts. Usually, however, large and fairly thick steel slabs (c.250mm) are produced and some are processed elsewhere and this requires a lot of energy to re-heat and roll the slabs into the thickness that is required. Re-melting and casting is also very energy intensive. Continuous casting of liquid steel from the BOF followed by hot rolling is common, but a fairly new innovation used at a few modern steel plant is to cast thin steel slabs (c.50mm) which are rolled while still hot to obtain the thickness required. This gives large savings in energy consumption. Some heat input is needed for heat treatment but overall much less energy is consumed.
Several designs of electric arc furnace are in use and the benefits of pre-heating and DC arc are shown by data published in 1999.
155 R. J. Fruehan et. al. “Theoretical minimum energies to produce steel for selected conditions” Carnegie Mellon University, May 2000, prepared for the US DoE
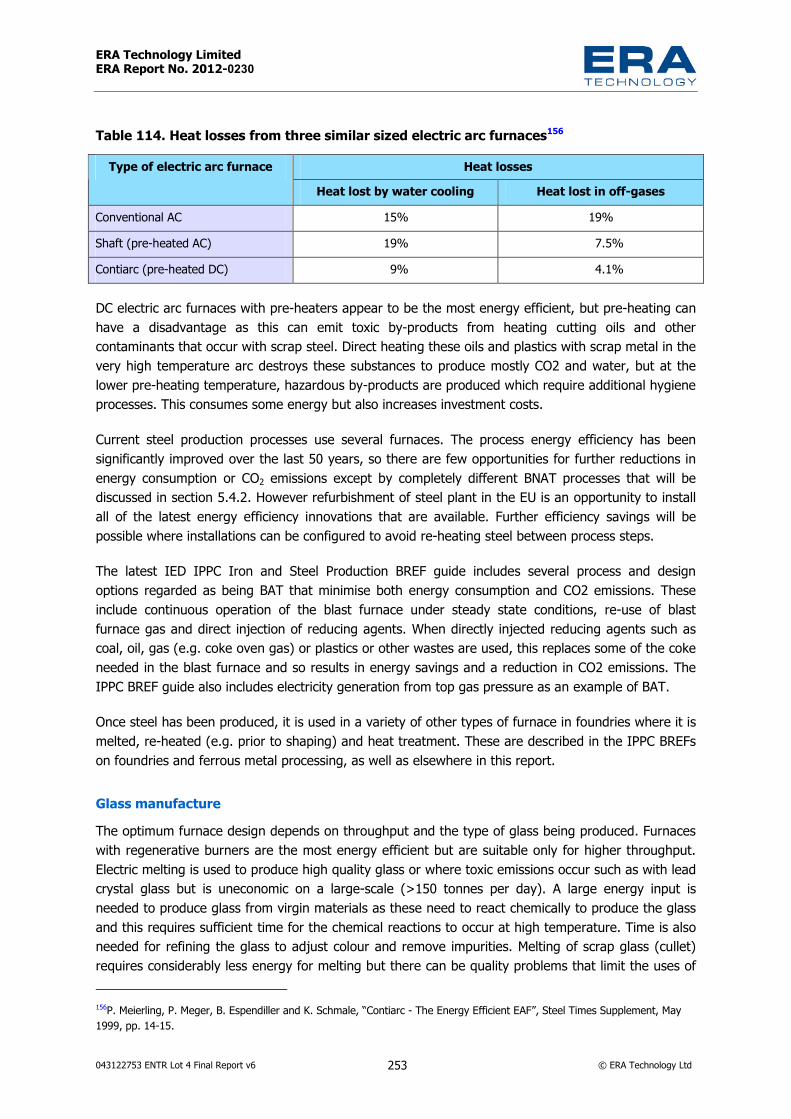
ERA Technology Limited ERA Report No. 2012-0230
043122753 ENTR Lot 4 Final Report v6 253 © ERA Technology Ltd
Table 114. Heat losses from three similar sized electric arc furnaces156 Heat losses Type of electric arc furnace
Heat lost by water cooling Heat lost in off-gases Conventional AC 15% 19% Shaft (pre-heated AC) 19% 7.5% Contiarc (pre-heated DC) 9% 4.1%
DC electric arc furnaces with pre-heaters appear to be the most energy efficient, but pre-heating can have a disadvantage as this can emit toxic by-products from heating cutting oils and other contaminants that occur with scrap steel. Direct heating these oils and plastics with scrap metal in the very high temperature arc destroys these substances to produce mostly CO2 and water, but at the lower pre-heating temperature, hazardous by-products are produced which require additional hygiene processes. This consumes some energy but also increases investment costs.
Current steel production processes use several furnaces. The process energy efficiency has been significantly improved over the last 50 years, so there are few opportunities for further reductions in energy consumption or CO2 emissions except by completely different BNAT processes that will be discussed in section 5.4.2. However refurbishment of steel plant in the EU is an opportunity to install all of the latest energy efficiency innovations that are available. Further efficiency savings will be possible where installations can be configured to avoid re-heating steel between process steps.
The latest IED IPPC Iron and Steel Production BREF guide includes several process and design options regarded as being BAT that minimise both energy consumption and CO2 emissions. These include continuous operation of the blast furnace under steady state conditions, re-use of blast furnace gas and direct injection of reducing agents. When directly injected reducing agents such as coal, oil, gas (e.g. coke oven gas) or plastics or other wastes are used, this replaces some of the coke needed in the blast furnace and so results in energy savings and a reduction in CO2 emissions. The IPPC BREF guide also includes electricity generation from top gas pressure as an example of BAT.
Once steel has been produced, it is used in a variety of other types of furnace in foundries where it is melted, re-heated (e.g. prior to shaping) and heat treatment. These are described in the IPPC BREFs on foundries and ferrous metal processing, as well as elsewhere in this report.
Glass manufacture The optimum furnace design depends on throughput and the type of glass being produced. Furnaces with regenerative burners are the most energy efficient but are suitable only for higher throughput. Electric melting is used to produce high quality glass or where toxic emissions occur such as with lead crystal glass but is uneconomic on a large-scale (>150 tonnes per day). A large energy input is needed to produce glass from virgin materials as these need to react chemically to produce the glass and this requires sufficient time for the chemical reactions to occur at high temperature. Time is also needed for refining the glass to adjust colour and remove impurities. Melting of scrap glass (cullet) requires considerably less energy for melting but there can be quality problems that limit the uses of 156P. Meierling, P. Meger, B. Espendiller and K. Schmale, “Contiarc - The Energy Efficient EAF”, Steel Times Supplement, May 1999, pp. 14-15.
ERA Technology Limited ERA Report No. 2012-0230
043122753 ENTR Lot 4 Final Report v6 254 © ERA Technology Ltd
this glass and additional energy is needed for refining. The main improvements that have been made to glass melting furnaces over recent years have been:
• Improved insulation • Improved combustion efficiency (e.g. burner design and limiting excess air) • Heat reuse such as with regenerative burners • Process control • Cullet and raw material pre-heaters using recovered waste heat. Some further improvements are possible but are not implemented, it is claimed, because of long payback periods and some of the above technologies are not always utilised because of restrictions on capital so that new and refurbished furnaces are not as energy efficient as possible. Trials in the EU with cullet preheating found that energy savings of 10 – 15% may be achieved but this is currently used in only a few plant in the EU. Payback time is estimated at about three years but the cost of equipment is high and there may be space limitations in existing plant although an added incentive is the possibility of a 10% increased plant throughput.
The design of regenerators also affects energy efficiency. Increasing the quantity of heat storage media increases efficiency of heat recovery but the law of diminishing returns means that beyond a certain point, the cost of additional media exceeds the energy saved. The IPPC BREF guide on glass states that a heat recovery efficiency of 70% is the maximum that can practically be achieved.
Waste heat from regenerators can be passed to waste heat boilers which are extensively used in flat glass plant in Germany but these are not used in all large glass plant in the EU due to long payback periods (examples given in IPPC BREF guide on glass). These boilers generate steam which is used for heating elsewhere in glass plant or for electricity generation. Waste heat is used for pre-heating feedstock only at three plant in the EU157. Two approaches are used, direct pre-heating and indirect preheating and it is reported that this can increase plant capacity by over 10%, reduce emissions and produce energy savings of 10% – 20%. Feedstock pre-heating is limited by several factors. Usually there is insufficient space for retro-fitting into existing plant. Investment costs are relatively high and technical problems have not been solved for “batch only” feedstock (raw materials without recycled glass). The IPPC BREF states that dust abatement is a problem but that it can be resolved with electrostatic precipitators. CPIV however claim that dust is an unsolved problem as even small amounts will block regenerators, creating more frequent downtime and maintenance. Dust is created because the raw materials for glass melting are fed into the melting furnace as a damp powder, which is a mixture of finely ground ingredients. Moisture is needed to avoid dust when transferring the raw material into the furnace but heat is then needed to remove it. Heating in the melting furnace is by flames above the powder that heat mainly by radiation, as convection could create dust. A solution to the dust problem has been investigated outside the EU and this is described in section 5.4.3. Pre-heaters for the raw materials (batch) for glass melting furnaces are now commercially
157 IPPC BREF draft guide, Glass Manufacturing Industry, 2009 (see page 323)

ERA Technology Limited ERA Report No. 2012-0230
043122753 ENTR Lot 4 Final Report v6 255 © ERA Technology Ltd
available from a German furnace manufacturer158. This manufacturer claims that it is possible to pre-heat 100% batch with their pre-heater design.
Ceramics production furnaces The IPPC BREF guide on ceramics production (published 2007) lists the following best available technologies for reducing energy consumption:
• Improved kiln and drier design – many design options are listed in the IPPC BREF guide which include plant automation, better kiln sealing, improved burners, improved refractories and insulation and reducing the thermal mass of kiln furniture. Replacement of old kilns with new is also proposed and will give very large benefits but at a high capital cost. These changes will reduce energy consumption and CO2 emissions as well as giving process cost savings, although payback times will not all be less than 3 years and so some new plant may not utilise all of the best technologies that are available. One article claims that a 19% reduction in wet brick drier energy consumption is possible by changes that include using hotter drying air from the brick kiln159.
• Recovery of excess heat from kilns – Excess heat can be utilised in many ways, for example, hot cooling air can be used in driers and pre-heaters. Heat exchangers can be used to recover heat from flue gases or from wet, but still hot drier air, for use elsewhere in the plant and steam and electricity generation are also possible in larger plant. These options are not all used in all new plant however. Some new installations use some heat recovery but not usually the maximum recovery possible as the payback periods can be longer than 3 years. The incorporation of heat recovery in new installations in EU is fairly varied and depends on the financial issues such as return on investment and capital available for the new plant. One EU furnace manufacturer claims that some furnace manufacturers provide lower priced equipment, but that this equipment has failed to perform as specified, so that energy consumption is higher than necessary.
• Fuel substitution – carbon intensive fuels such as coal and heavy oil result in much higher CO2 emissions than natural gas and other fuels with high H:C ratios. Changing from heavy oil to natural gas is reported to reduce CO2 emissions by 25%. Natural gas is an increasingly common fuel in ceramics production but there are some limitations to its availability. Piped natural gas is not available throughout the EU but liquid gases can be transported and used anywhere. However, liquid gases pose some safety risks, and are more expensive. The EU supply of natural gas could be limited in the future with increasing reliance on imports and growing global demand. Substitution in some sectors is very limited. 93% of ceramic kilns in Germany and 95% in UK already use natural gas160.
• Modification of ceramic bodies – this refers to changing the composition of the raw materials and several options can be considered. For example, reducing water content reduces heat energy for drying and the addition of sintering aids lowering the firing temperature and so saves energy although can increase CO2 emissions. Compositional changes may be possible that reduce mass so reducing heat requirements and with some products it may make it possible to use roller kilns
158 http://www.sorg.de/en/integrated_concept/integrated_concept.htm 159 Unpublished article from stakeholder 160 Data from Cerame Unie

ERA Technology Limited ERA Report No. 2012-0230
043122753 ENTR Lot 4 Final Report v6 256 © ERA Technology Ltd
that avoid the need for kiln furniture and so reduce energy consumption. The scope for composition changes is however limited as the appearance of the product is usually changed and this may not be acceptable.
Many other BAT design issues for ceramics production are described elsewhere in this report.
Non-ferrous metals production furnaces Non-ferrous metals are manufactured from ores in furnaces, scrap is recycled in furnaces and metal parts are heat treated and these are described briefly in Table 10. The energy efficiency of these processes varies considerably and depends mainly on furnace design but throughput is also a factor as some techniques are impractical on a small scale. Smelting tends to be carried out on a very large scale and due to the high cost of energy the best available technology tends to be used. The energy efficiency of recycling scrap varies considerably however. Examples of aluminium melting furnaces are given in Table 62 with efficiencies ranging from small gas-fired crucible melting pots with about 20% efficiency (as there is no heat recovery from combustion gases) whereas an efficiency of 80% is achievable on a much larger scale for continuous shaft furnaces, in which the feedstock is preheated by rising hot flue gases. A similar variability exists with heat treatment furnaces where the energy consumption depends on furnace design and the use of heat recovery. Best available techniques are described elsewhere in this report but a selection applicable to non-ferrous metals melting and heat treatment include:
• High performance thermal insulation • Pre-heating feedstock (with hot combustion gases) • Heat recovery and re-use (from flue gases and from hot cooling/quenching air or fluids) • Use recuperative and regenerative burners • Process control to avoid too high a temperature and to heat only for the correct period of time • Minimise water cooling and if possible recover heat from hot water or steam (see section 4.2.3) • Induction heating can be more energy efficient for heat treatment, particularly for surface heat
treatment • Superconductor magnetic DC heating – currently used only for billet heating but should be viable
for other melting and heat treatment. It is clear that medium-size furnaces and ovens often have fairly poor energy efficiency and so significant improvement potential exists. Large-scale furnaces will have better energy efficiency but there is scope for further improvement.
5.2.2 BAT medium-size industrial furnace and oven design Some examples of innovative designs used for medium-sized furnaces and ovens are as follows although these can also be large industrial furnaces.
ERA Technology Limited ERA Report No. 2012-0230
043122753 ENTR Lot 4 Final Report v6 257 © ERA Technology Ltd
Spray drier. This is a novel design of oven that is used to rapidly dry materials while preventing the particles from agglomerating. The wet solid (or a solution) is sprayed into a hot chamber where the spray droplets dry rapidly. The dry solid is carried by the hot draft into a cyclone where the solids are separated from the heat from the hot but wet exhaust air can be recovered with a heat exchanger for re-use. If the same materials were dried on a tray in an oven, they would give large irregular lumps whereas spray driers give free-flowing powders. This design of drier can be energy efficient using waste heat from other processes and recycling heat with heat exchangers but the main reason these are used is to obtain free-flowing non-dusty powders.
Fluidised bed. Rapid heat transfer to materials is essential for achieving a high energy efficiency and one of the best ways to efficiently heat materials is to heat them in a fluidised bed. Hot gases (e.g. air or flue gases) are blown up through the solids such as ceramic spheres which causes them to move and to behave similarly to a fluid. The high turbulence at the particle surfaces ensures good heat transfer and very rapid heating. Fluidised bed furnaces can be used to heat solid pieces, tubes and particulate materials which form the fluidised bed itself. Heat transfer is rapid and uniform which is beneficial for heating complex shapes that would distort if heating unevenly. The heat in hot exhaust gases can be recovered for reuse with heat exchangers.
Stirring molten metal. When metal is heated to melt it, there is a tendency to overheat some parts of the furnace in order for the coolest parts to reach the required temperature. Heat transfer is often far from ideal within a furnace. The melting efficiency of metals is improved by stirring the molten metal to avoid overheating which causes unnecessary heat losses and also loss of metal by accelerated oxidation. The most effective method of stirring molten metals that is used for steel and aluminium is electromagnetic stirring which uses induction coils outside the furnace to cause liquid metal to flow and cause stirring. Induction melting furnaces are also designed to create stirring of the melt.
Design variables that influence energy consumption of medium-size (and some small and some large) furnaces and ovens include the following design options:
• Choice, thickness and density of thermal insulation • The use of heat exchangers to recover heat from hot combustion gases (gas burners) or hot damp
air (electric heating) to heat cold air that is circulated through the oven and to feed gas burners • Use self-recuperative and self-regenerative burners. These are small enough for medium size
furnaces • Microwave assisted heating to shorten heating time and can reduce energy consumption by 50%
or more for certain processes (see section starting page 189). • Process control such as electronic temperature control, exhaust control and automated door
control161.The use of infrared heaters for drying materials. The energy efficiency is greatly increased if the wavelength of the infrared energy matches the peak adsorptions wavelength of water at c. 3µm. This
161 http://www.rdmengineering.co.uk/pdffiles/ovendata.pdf

ERA Technology Limited ERA Report No. 2012-0230
043122753 ENTR Lot 4 Final Report v6 258 © ERA Technology Ltd
is achieved by control of the temperature of the infrared source (lamp or gas burner) 162 . Astakeholder has suggested that infrared drying could reduce energy consumption by 20% – 50%.
Some materials can be dried efficiently by the use of desiccant drying. One source suggests that the thermal efficiency can be increased from 34% to 56%. In this process, hot dry air removes water from the materials and this water is then removed from the wet air with a desiccant and then can be re-used without having to heat fresh cold air. Desiccants are reactivated by heating but overall energy consumption is reduced by c.20%163.
Other drying methods are used by some industries and can give significant energy savings. Vacuum drying can save up to 80% energy and drying in the food industry using mechanical vapour recompression can be exceptionally energy efficient although this is fairly large-scale and the equipment would not normally be classified as an “oven”.
Metals can be heated in an energy efficient way by process specific electrical energy efficient heating methods. Surface heat treatment using induction heating heats only the surface and so consumes much less energy than a traditional furnace (c.90% less energy) although this type of induction heating is not in an enclosed cavity and so is not an oven or furnace. Another energy-efficient heating process used to heat aluminium billets is with superconducting magnetic heating, which consumes 140KWh electricity/tonne whereas induction heating consumes 230 kWh electricity/tonne. Gas heating consumes 370 kWh (gas energy)/tonne, although gas is a primary energy source unlike electricity. It is important always to bear in mind that electricity, as a secondary energy source, always incurs generation and transmission losses.
5.2.3 BAT laboratory furnace and oven design
Laboratory ovens Many of the design options that minimise energy consumption of laboratory ovens are also appropriate for medium size industrial ovens and these include:
• The use of sufficient high-performance thermal insulation • Good ventilation control, so that flow of cold air into the oven is minimised • Leak prevention • Glass doors are sometimes used on laboratory ovens. Heat loss through the glass is much greater
than through thermal insulation but can be reduced with extra sheets of glass and extra infrared reflective coatings. These options are used in the best domestic and commercial catering ovens and can save 3% – 4% energy
• Infrared drying can be used for laboratory drying ovens and according to a stakeholder this reduces energy consumption by 10%.
162 http://www.noblelight.net/resources/infrared_case_studies/drying_of_water_based_coatings.shtml 163 http://www.pmmda.org.uk/TU3%20-%20Drying.pdf

ERA Technology Limited ERA Report No. 2012-0230
043122753 ENTR Lot 4 Final Report v6 259 © ERA Technology Ltd
Laboratory furnaces Laboratory furnaces tend to have better thermal insulation than ovens so the scope for improvement is less but preventing leaks, control of ventilation and temperature control all help to minimise energy consumption.
Insulation can be improved by using thicker layers of the same material but this either reduces the cavity volume or increases the furnace size which may be unacceptable to the user. Alternative low thermal conductivity insulation materials such as microporous insulation can be used. This has a thermal conductivity almost half that of standard insulation materials and so reduces heat loss by half with the same thickness but it cannot be used as a drop-in replacement as its maximum temperature is 1000°C and so is used only for the outer layers.
Microwave-assisted laboratory furnaces are sold in the EU. They are suitable only for processes where the materials are susceptible to microwave heating. These furnaces consume less that half the energy used by traditional furnaces mainly as they can significantly reduce the heating time. These are used as dental furnaces for sintering zirconia where there is an 80% reduction in energy consumption compared to traditional electric ovens.
Laboratory vacuum ovens Laboratory vacuum ovens are used mainly for drying and removal of solvents from heat sensitive materials at relatively low temperature. Heat transfer to the material is limited by conduction via walls and shelves as no convection or radiation occur. Most ovens have heaters in the oven’s walls and so heating times are relatively long and energy inefficient. An innovation used for some ovens is to use heated shelves. This greatly increases heat transfer rates to the material which is in physical contact with the heated surface and so shortens drying time and reduced energy losses. One manufacturer claims that drying times can be reduced by as much as six-fold164.
5.2.4 BAT designs for base cases The best available technology for the laboratory, small and medium size industrial base cases will utilise the following technologies which are applicable to all base cases BC1 - BC5 unless specified:
• Thicker or lower thermal conductivity insulation • Process control to prevent over-heating, incorrect heating time, etc. • Ventilation control to avoid heat loss (where vents are used) • Recuperative or self-regenerative burners for gas ovens and furnaces (not for laboratory and
unlikely for the smallest industrial) • Microwave assist and infrared heating where appropriate for process • Heat exchangers for industrial ovens and furnaces (not laboratory BC1 or the smallest industrial)
164 Manufacturer’s datasheet for Heraeus Kendro “Vacutherm 6000” vacuum ovens

ERA Technology Limited ERA Report No. 2012-0230
043122753 ENTR Lot 4 Final Report v6 260 © ERA Technology Ltd
BAT design for base cases BC6 and BC7 are described below although all sizes of industrial furnaces and ovens will be assessed by the performance of certain parameters that are related to energy consumption in the use phase.
BAT Laboratory ovens (compare with BC1) Energy consumption in the use phase can be improved by utilising many of the above technologies.
The average energy savings achievable by a “best available” laboratory oven are estimated by a manufacturer to be up to 20% when compared to BC1. The features of one such best available laboratory oven are described below165:
• Capacity: 60 litres (same as BC1) • Rated power: 1.4 kW • Convection technology: mechanical convection • Temperature range: 50°C - 250 °C • Internal dimensions: 354 x 508 x 368 mm3 • External dimensions: 530 x 720 x 565 mm3 • Weight : 42 kg. The lower energy consumption is achieved by using many different design options which include:
• Door design to reduce heat emission • Timers to ensure that the oven switches off when processes are complete • Low surface temperature due to superior thermal insulation • Electronically controlled dampers for ventilation – these can minimise air changes and so reduce
heat lost in ventilated air. BC1 annual energy consumption in the use phase used for BC1 was 2KWh (primary energy) for 5000 hours per year totalling 10MWh/year. If energy consumption could be reduced by 20%, as claimed by the manufacturer, this would save 2MWh/year for each laboratory oven. This equates to annual EU energy savings of:
• Savings for stock of 400,000 = 0.8TWh / year • Savings due to annual sales of 25,000 = 50 GWh / year.
165 Based on Thermo Fisher Heratherm OGS60 oven http://193.218.17.133/ex/downloads/brochures/thermo/heratherm_ovens_eng.pdf

ERA Technology Limited ERA Report No. 2012-0230
043122753 ENTR Lot 4 Final Report v6 261 © ERA Technology Ltd
BAT for industrial small / medium furnaces and ovens: base cases The best small and medium-size industrial furnaces and ovens on the EU market use the technologies listed above and some manufacturers claim that by use of all BAT eco-design options, these may consume 30% less energy.
BAT of small and medium size industrial furnaces is described in more detail in section 5.5 and in the applicable sections of Task 4 where each of the above technologies are described:
There are many different BAT designs that can be compared with the base cases BC2 – BC5. Some are more energy efficient designs and others utilise different technologies that are suitable only for certain processes. These alternative technologies are usually used only in custom designed furnaces and ovens. Examples of BAT designs for BC2 – BC5 are as follows:
BC 2 and BC 3: One manufacturer sells two versions of its ovens, standard and low CO2 emission versions. The manufacturer claims that these consume 30% less energy than standard designs (i.e. the base cases). The BAT design uses:
• An additional 150 mm thickness of insulation • Improved heater control • Inverter control for fans • Electronic fume exhaust control • Programmable logic controller (PLC) automatic controls of doors for tunnel ovens (BC4). BC4: Several manufacturers sell small crucible melting furnaces with two gas burner options, either with cold air burners or with recuperative burners. For this type of small furnace, the recuperative burner is the BAT and the cold air burner is the base case. Use of the recuperative burner is predicted to save c.20% in fuel92.
BC5: Many manufacturers produce continuous furnaces and there are many different designs that are intended for specific processes and so they are not all interchangeable. The actual energy consumption cannot be compared as there is no standard test method and so the BAT design can only be estimated by consideration of the design features. One example is the choice of insulation material. A variety is used but at least one manufacturer uses microporous insulation. This has the lowest thermal conductivity and so is the BAT for this application where the process allows this material to be used64.
Other BAT that are used mainly in custom designs and so are difficult to compare with base cases are described elsewhere in this report and include: microwave assist, infrared heating, induction heating, superconducting magnetic heating, etc.
Large-size base case BAT Almost all large and very large furnaces and ovens are custom designs and are extremely varied in design. The base case calculations for representative types were carried out mainly to determine if energy consumption in the use phase was the dominant cause of environmental impacts. Eco-design

ERA Technology Limited ERA Report No. 2012-0230
043122753 ENTR Lot 4 Final Report v6 262 © ERA Technology Ltd
BAT for BC6 and BC7 is extensively discussed in Tasks 4 and 5 of this report and the applicable BAT technology depends on the type of furnace, fuel source and process being carried out. All of the design options listed for large industrial furnaces and ovens in Table 129 are BAT for large industrial furnaces and ovens, and each makes a contribution towards reductions in energy consumption by reducing energy losses. Eco-design options can be assessed and (regulated as in Japan) by the use of performance parameters that measure a process characteristic that is related to energy consumption and heat loss.
Performance parameter for all sizes of industrial furnaces and ovens In order to quantify the improvement potential for industrial furnaces and ovens, performance parameters have been identified that can be used to quantify the range of performance that exist for new furnaces and ovens as well as the average performance parameters. Performance parameters have been selected that measure the main heat losses from furnaces and ovens. There are two ways of looking at the energy consumption of furnaces and ovens: Either to measure the actual consumption and look for ways to reduce consumption, or to focus on heat losses and look at ways of reducing these losses. It is clear that the largest sources of energy loss from furnaces and ovens are:
• Heat in hot combustion gases – this is usually the most significant source of heat loss from fossil fuel combustion furnaces and ovens
• Heat lost by heating excess air passing through the furnace either with combustion air, due to leaks or as ventilation (e.g. for drying ovens) – if the gas / air ratio to the burner is not well controlled, some of the heat is used to heat the excess air and as a result, more fossil fuel is consumed than necessary. Similarly if there are leaks or excessive ventilation, additional fuel is used to heat air that passes through the furnace or oven.
• Through thermal insulation – the insulation is intended to retain heat inside the oven or furnace but is never 100% effective. The quality and quantity of insulation can have a significant impact on heat loss and heat lost through insulation is often the most significant heat loss for electrically heated ovens and furnaces.
• In cooling water – although this is essential where it is used such as in electric arc furnaces, the amount of heat lost in cooling water depends on the design of the furnace, the specific process and process control. Also, heat in hot water or steam can be recovered and re-used elsewhere and so only unrecovered heat should be considered as a heat loss. As water cooling is used in the largest and most energy intensive processes, water cooling heat losses may be fairly significant.
• Heat lost as steam and hot ventilation air from drying and curing processes – steam contains heat that can sometimes be recovered for re-use when it condenses although this has limited uses. It can be useful for pre-heating materials that are being dried. Some heat loss in hot ventilation air is inevitable as there must be ventilation to remove steam and chemical vapours from materials that are being dried or cured. However, if the quantity of air is not controlled, fuel is wasted raising the temperature of this excess air.
• In the product or kiln furniture (in some processes, the heat in hot products is not lost as it is utilised in the next process) – some of the heat from product and kiln furniture is recovered by cooling with air then reusing the heated air as combustion air, in drying ovens or to pre-heat
ERA Technology Limited ERA Report No. 2012-0230
043122753 ENTR Lot 4 Final Report v6 263 © ERA Technology Ltd
materials. Heat lost in kiln furniture can be reduced by selecting low mass designs and using lower specific heat capacity materials
• Process parameters have been selected that measure most of the above sources of heat loss (except for heat in product and kiln furniture). These performance parameters could include and are applicable to both electric and fossil fuel except where stated below:
• Temperature of combustion gases entering flue without dilution (fossil fuel combustion only) A stakeholder has stated that heat recover from flue gas reduces energy consumption by approximately 5% per 100°C, although this is not a linear relationship.
• Percentage of heat recovered from flue gases (fossil fuel combustion only) - this is used for Japanese legislation.
• Gas/oil to air ratio used for burners (fossil fuel only) - this is used for Japanese legislation • Temperature of external surfaces of thermal insulation material (note that some exclusions will be
needed) • Heat emitted (e.g. W/m2) from external surfaces of thermal insulation material • Energy consumption / kg water evaporated in drying ovens • Proportion of input energy that is removed by cooling water (where used) and proportion of this
energy that is re-used • Energy consumption per tonne of product – this depends on the process and on the scale of
production (this may be too complex and better managed using the IED) • Energy efficiency as determined by ISO 13579-1 (this will be process and scale-dependent and as
a result very complex – an option is to limit to certain types of process such as metals heat treatment)
• Proportion of heat input recovered and reused from ventilated emissions (electric heating only because this usually could otherwise be measured as heat recovery from combustion gases where fossil fuel used)
• Proportion of heat input recovered from product and reused (either within process or elsewhere). For each of the process parameters selected, the size of improvement that is achievable will be determined from the following data for furnaces and ovens currently being sold in the EU:
• Worst performing • Average performing and • Best performing. Clearly, there will be an overall improvement if the performance of the worst performing is raised to the current average value or better and this would be achievable using technology that is already in use. The improvement potential will also be estimated comparing currently sold furnaces and ovens with:

ERA Technology Limited ERA Report No. 2012-0230
043122753 ENTR Lot 4 Final Report v6 264 © ERA Technology Ltd
• Best available technology irrespective of cost and • Best not available technology (will be available within 10 years). • Energy savings resulting from improvements in process parameters. For example, this could be:
- MJ/tonne product resulting from a reduction in combustion gas temperature of 10°C by heat recovery
- MJ/tonne product resulting from an increase in heat recovery from combustion gases of 5% - MJ/tonne product resulting from a decrease in heat lost from the external surface of furnace
insulation of 10W/m2.- Etc.
In future Tasks, the life cycle costs of each improvement option are calculated including use of the best available technology (irrespective of cost) and technologies available within 10 years although the financial implications on manufacturers and users of furnaces and ovens will be taken into account. For example, if improvement in thermal insulation can save 3% of energy, the additional cost of insulation is added to the life cycle cost to determine if payback time or investment cost are acceptable
A complication is that the current and best available performance both depend on many variables such as the throughput and size of the furnace or oven as well as the type of process. As a result data is needed for as wide a variety of processes and throughputs as possible to ensure that any future eco-design requirements can be achieved and do not harm EU industry.
Performance parameters for large, medium and small furnaces and ovens could be used for eco-design requirements. There is no need to limit these to large-size as long as there is sufficient data available to determine the impact of eco-design options. From the performance parameter data, it should be possible to determine the size of the improvement potential for each eco-design option so that the Commission can determine what requirements are applicable. It is conceivable that eco-design requirements based on a larger number of minimum performance parameter will be justified for large size furnaces than for small and medium-size. Eco-design requirements are also likely to be based on environmental impact and improvement potential so that different requirements are imposed on large furnaces than small furnaces. For example;
• Minimum performance parameters for heat losses through insulation however may be applicable to all sizes as the performance of insulation in large furnaces tends to be superior to small furnaces because the cost of energy consumed by large furnaces is usually very large and so is an incentive to use efficient insulation. However it is conceivable that different limits would apply depending on operating temperature, capacity, etc. as is required by Japanese legislation (see section 1.5.3).
• The proportion of heat recovery from combustion gases that may be required would be larger for the largest and hottest furnaces. This approach is also used in Japan. Also, as in Japan, these obligations may not need to apply to small and medium-size furnaces if the improvement potential is demonstrated to be small or the costs prohibitive. This would also only apply to fossil fuel powered furnaces and possibly also to ovens but this depends on the data available.

ERA Technology Limited ERA Report No. 2012-0230
043122753 ENTR Lot 4 Final Report v6 265 © ERA Technology Ltd
• Eco-design requirements for water cooling are likely to be applicable only to large furnaces because water cooling is less common in medium and small size (where it is mainly used in vacuum furnaces) and so very little energy saving is possible with small and medium size. For large size, the energy lost in cooling water may be significant but if the improvement potential is found to be small then an eco-design requirement would not be justified.
Policy based on process parameters is therefore clearly an option for large, medium-size and possibly also for small industrial furnaces and ovens. Data is needed to determine policy options based on the performance of furnaces and ovens that are currently being sold in the EU (as well as comprehensive rebuilds). Data is required for as wide a variety of furnaces and ovens as possible considering throughput as this can affect the achievable performance. The worst, best and average performance will provide data on the energy consumption currently being achieved. The average figure will give an estimate of total EU energy consumption and the difference between the worst performing and best performing will indicate what improvement is already being achieved at reasonable cost with furnaces and ovens being sold in the EU. The achievable performance using eco-design best available technology (not BAT as defined by IPPC / IED) gives the theoretical upper limit for performance that could currently be achieved irrespective of cost. The performance that could be achieved within 10 years (BNAT) gives the potential future energy savings. The cost of BAT eco-design options will also need to be considered to avoid harming the competitiveness of EU industry. The performance parameters that are being considered are as follows:
• Flue gas temperatures corrected to 3% O2* 166 • Estimated percentages of heat recovered from flue gases* • Temperature of the external surface of the insulation °C - assuming still air at surface (i.e.
without forced air cooling)* • Actual heat emission W/m2 from insulation surface - assuming still air at surface (i.e. without
forced air cooling) • Fossil fuel to air ratio supplied to burners* • Percentage of heat removed by water cooling and not re-used by process or externally • Percentage of input heat lost in ventilated air • Contractual energy for drying ovens – evaporation energy consumption MJ/kg water • Note that the performance parameters marked * are regulated in Japan. These regulations apply
only to fossil fuel powered furnaces, whereas the scope of this study includes lower temperature ovens and electrically heated furnaces and ovens.
Some performance parameter data has been obtained from published research especially Sankey diagrams and also from data in IPPC BREFs. It appears that the main sources of heat loss are in flue gases from fossil fuel combustion and through the thermal insulation. Other losses are however important for some types of furnace and include heat adsorbed by kiln cars and kiln furniture, losses from leaks and losses in hot ventilation air (e.g. hot wet air from drying ovens). Heat is also retained 166 Temperature at X% oxygen = temperature at 3% oxygen x (21%-X%)/(21%-3%), from J. G. Wünning

ERA Technology Limited ERA Report No. 2012-0230
043122753 ENTR Lot 4 Final Report v6 266 © ERA Technology Ltd
by the products and by-products although some can be recovered for re-use and this is carried out in several sectors. The table below lists examples of process characteristics of a selection of large (and a few medium-size) industrial furnaces including data for the best, average and worst performance for flue gas heat losses and losses through thermal insulation. Data showing the proportion of input energy lost in combustion gases and through furnace insulation is used to estimate energy savings that should be technically achievable when comparing average design performance and BAT design performance in section 5.3.

ERAT
echn
ology
Limite
dER
ARep
ortN
o.20
12-02
30
0431
2275
3ENT
RLot
4Fina
lRep
ortv6
267
©ER
ATech
nolog
yLtd
Table
115.
Avail
able
heat
lossd
ataa
sper
cent
ageo
finpu
thea
tfor
large
andm
edium
furn
acep
roce
ssch
arac
teris
tics–
gas(
fossil
fuel)
heat
edEx
haus
tlos
ses
Insu
lation
losse
sPr
oces
s/fu
rnac
etyp
ePo
orAv
erag
eBe
stPo
orAv
erag
eBe
stSo
urce
ofda
ta/c
omme
nts
Ceme
ntkiln
s35
%los
t,hot
cooli
ngair
at40
0°C,fl
uega
sat
280°C
Relat
ively
lowKil
nat>
1200
°C.Co
-gene
ration
andr
awma
terials
drying
arepo
ssible
uses
ofwa
stehe
at
Lime
Long
rotary
=>3
00°C
(butw
ithpre
-heate
r=
>180
°C
PFRK
=60
-80°C
(loss
<10%
)Lo
wDa
tafro
mIPP
CBRE
Fsor
epres
ents
BATf
ortw
omain
types
ofne
wkiln
inEU
.Pea
ktem
perat
ure>9
00°C
Brick
&roo
ftile
kiln60
%25
%c.1
30°C,
c.10%
loss
30%
11%
5%Ex
haust
heat
lossa
ndins
ulatio
nloss
data
from
stake
holde
r.Int
heory
,<4%
insula
tionl
ossach
ievab
le(BA
T)bu
tune
cono
mic.
Heat
recov
eryus
inghe
atex
chan
gerv
iable
ifreco
vered
heat
canbe
used
167 .
Brick
drier
20%
1%Da
tafro
msta
keho
lder
Ceram
ics52
.1%(+
24.6%
sentto
drier)
34%
*11
.1%8.7
%*Ge
rman
kiln20
0716
8
*Data
forRie
dham
mert
ablew
arekiln
Glass
meltin
gc.2
0%,3
50–5
00°C
c.14%
CMIC
report
(2004
).Rep
resen
tsbe
stfur
nace
inEU
Glass
Meltin
g(19
92)
34%
17%
Glaste
chBe
r.Re
presen
tbest
for19
92bu
tim
prove
ments
made
since
then
Steel
re-he
ating
50%
350–
500°C
20%
10%
Low
3%La
rgeGe
rman
furna
ces(vi
sited
In20
10)w
ithrec
upera
tiveb
urners
andf
romUS
Burea
uofE
nergy
Efficie
ncy16
9
167
52nd
Intern
ation
alBri
ckPla
ntOp
erator
sForu
m,Oc
tober
2006
andf
romas
takeh
older
168
www.
sanke
y-diag
ram.co
m16
9htt
p://w
ww.em
-ea.or
g/Guid
e%20
Book
s/Boo
k-1/1.
4%20
MATE
RIAL
%20%
20AN
D%20
ENER
GY%2
0BAL
ANCE

ERAT
echn
ology
Limite
dER
ARep
ortN
o.20
12-02
30
0431
2275
3ENT
RLot
4Fina
lRep
ortv6
268
©ER
ATech
nolog
yLtd
Steel
re-he
ating
(Turke
y)22
–25%
0.47–
2.7%
Best
perfo
rming
large
furna
ces.“
Irona
ndSte
elRe
view,
Septe
mber
2008
”Ten
ovaw
ebsit
eAlu
miniu
mme
lting
76%
57%
20%
29%
20%
6%Ba
sicsm
all/m
edium
-size
gasc
rucibl
emelt
furna
cewit
hco
ldair
burne
r170
andr
efAlu
miniu
mme
lting
60%
25–4
0%6%
Avera
gefig
urefro
mUS
2008
/0014
537(
cold
airbu
rner),
best
issha
ftmelt
ingfur
nace
(seeT
able
62)
Biscu
ittun
nel
oven
60%
(indir
ectfire
d)35
%(di
rectfi
red)
25%
(direc
t,Carb
onTru
stfig
ure)
10%
From
manu
factur
eran
dCarb
onTru
st(U
K)pu
blicat
ion
170
www.
icme.o
rg.uk
/news
.asp?
ID=1
14

ERA Technology Limited ERA Report No. 2012-0230
043122753 ENTR Lot 4 Final Report v6 269 © ERA Technology Ltd
Ovens used for drying are fairly common in the EU. These may be heated with electric resistance heaters, infrared, gas heated hot air, by superheated steam or with waste hot air from other processes. Energy is required to convert liquid water into water vapour and to transport this away from the material being dried. The amount of energy used is always more than the amount theoretically required but in many cases could be reduced by process efficiency improvements. For example, the use of less, but hotter air, is more efficient than using a large volume of air at a lower temperature. Often however, hot air from processes is diluted to cool it in order to reduce the cost of transporting the hot air from its source to the drying oven. Published estimates are as follows:
Table 116. Drying oven energy consumption (kWh/kg of water)171 Option Energy consumption Process
2.5 MJ/kg (0.69kWh/kg)
Water at 100°C to vapour Theoretical energy requirement
2.6 MJ/kg (0.72 kWh/kg)
Water at 20°C to vapour (at 100°C)
Typical oven drying energy consumption – bricks
4.3 MJ/kg (1.19kWh/kg)
Uses diluted hot cooling air from brick kiln
High efficiency brick drier (realistic aim)
3.5 MJ/kg (0.97 kWh/kg)
By use of less, but hotter air (i.e. not diluted to cool before transfer to oven)
Best theoretically achievable for wet clay drying (bricks)
3.2 MJ/kg (0.89 kWh/kg)
Food industry IPPC BRFF Dehydration of solids in practice
0.556 – 1.08 kWh/kg Steam driers with multiple effect evaporators can be used (these are not ovens)
5.3. Performance parameters of EU furnaces and ovens Actual performance parameter data has been provided by stakeholders and this data is shown in the following tables. Table 117 lists the types for which data has been provided by stakeholders together with details on throughput, power rating, typical annual energy consumption, lifetime and other data that describes how they are used. Energy consumption is quoted as primary energy and so electrical energy is converted to primary energy using a conversion factor of 2.5.
171 Brick drier data from 52nd International Forum for Brick Plant Operators", Clemson, South Carolina, USA. Food data from Food IPPC BREF.

ERA Technology Limited ERA Report No. 2012-0230
043122753 ENTR Lot 4 Final Report v6 270 © ERA Technology Ltd
Table 117. Types of furnaces and ovens, throughput, power rating, energy consumption, lifetimes and capacity utilisation Type of furnace /
oven Throughput Power
rating MW (average or
range)
Energy consumption
Lifetime (years)
Capacity utilisation
Rotary cement kiln 1.2 million tpa 130 1000 GWh/y 40 60% / 8000 h/y Glass production Flat glass melting gas
90,000 – 270,000 tpa
60 156 – 477 GWh/y
15 (between rebuilds)
Continuous for 15 years
Container glass melting gas
100,000 – 200,000 tpa
12 – 50 300 – 500 GWh/y
10 (between rebuilds)
Continuous for 10 years
Container glass oxy-fuel
150,000 tpa 40 345 GWh/y 10 (between rebuilds)
Continuous for 10 years
Glass fibre melting oxy-fuel
3000 tpa 3.5 <30,000 MWh/y
4 (between rebuilds)
Continuous between rebuilds
Flat glass lehr mostly electric
90,000 – 270,000 tpa
2 1 GWh/y 30 >335 days/year
Metals processing Hot dip galvanizing, gas
30,000 – 500,000 tpa
30 Up to 123 GWh/y
25 40% / 6000 h/y to 50% / 8200 h/y
Continuous steel strip annealing, gas
500,000 tpa 30 123 GWh/y 25 50% / 8200 h/y
Steel wire heat treatment (various, gas)
13,000 – 26,000 tpa
1.1 – 1.5 11 GWh/y 40 90% / 8000 h/y
Steel wire galvanising (various, gas)
9,000 – 40,000 tpa
0.3 – 1 7.2 GWh/y 15 90% / 8000 h/y
Fluidised bed diffusion for wire (gas)
17,000 tpa 1.3 9.4 GWh/y 10 90% / 8000 h/y
Aluminium scrap melting gas
50,000 tpa 25 179 GWh/y 25 85% / 8400 h/y
Steel re-heating gas
100,000 tpa 10 50 GWh/y 20 60% / 6500 h/y
Steel heat treatment continuous gas
5,000 – 300,000 tpa
Process dependent
Process dependent
20 60% / 6500 h/y
20,000 – 160,000 tpa
1 – 20 6.4 – 128 GWh/y
15 – 30 80% / 8000 h/y Aluminium heat treatment gas
10,000 – 20,000 tpa
< 1 c. 4 GWh/y 20 60% / 6500 h/y
Aluminium melt holding electric
8,500 tpa 0.4 5 GWh/y (primary)
30 75% / 6700 h/y
Aluminium vacuum melting electric
1000 tpa 0.5 4.3 GWh/y (primary)
20 90% / 3800 h/y

ERA Technology Limited ERA Report No. 2012-0230
043122753 ENTR Lot 4 Final Report v6 271 © ERA Technology Ltd
Type of furnace / oven
Throughput Power rating MW
(average or range)
Energy consumption
Lifetime (years)
Capacity utilisation
Vacuum heat treatment furnace electric
600 tpa 0.25 570 MWh/y (1.4GWh primary / y)
20 60% / 6000 h/y
Vacuum heat treatment modular system172
8000 tpa 1.5 4.8 GWh/y (12 GWh primary / y)
15 60% / 6000 h/y
Vacuum brazing (copper or aluminium, gas or electric)
4920 tpa 1.5 8.6 GWh/y 20 70% / 8200 h/y
rotary ferrous melting furnace gas
360 to 50,000 tpa
1 – 4 200 to 27,000 MWh/y
30 10 hours per day
Rotary non-ferrous melting gas
360 to 50,000 tpa
1 – 4 300 – 43,000 MWh/y (copper)_
30 years 10 hours per day
Bright annealing stainless steel gas
32,000 tpa 2 12 GWh/y 25y 8000 h/y
belt heat treatment of screws, gas
4,000 tpa 1 2 GWh/y 20 40% / 5000 h/y
Bell type steel annealing gas
c.25,000 tpa 1 5 GWh/y 25y 8000 h/y
Ceramics manufacture Heavy clay kiln * 200,000 tpa 20 17,700 MWh/y
*15 years 335 days/year
Wall tile kiln 53,600 tpa 6 14,000 MWh/y *
15 - 20 years 335 days/year
Sanitary ware kiln * 20,100 tpa 5 12,000 MWh/y *
15 years 335 days/year
Miscellaneous and multipurpose Electric batch chamber furnace
300 tpa 0.04 500 MWh / y (primary energy)
10 years 80% / 7200 h/y
Small electric batch chamber furnace
14 tpa 0.12 100 MWh/y (primary energy)
10 years 40% / 100 batches per year
Small electric batch drying oven
7 tpa 0.024 30 MWh/y (primary energy)
10 years 40% / 140 batches per year
Small continuous “strand” furnace electric
5 tpa 0.018 117 MWh/y (primary energy)
10 years 50% / 5200 hours per year
Hazardous waste incinerators
70 – 1000 tpa 300 – 600 kW 100 – 500 MWh/y
10 – 15 years Varies (c.2000 h/y)
Batch electric semiconductor diffusion furnace
32 – 144 tpa 50kW (electricity)
60 – 120 MWh electricity/y
20 years c.4000 h/y
172 For example, ALD “ModulTherm”

ERA Technology Limited ERA Report No. 2012-0230
043122753 ENTR Lot 4 Final Report v6 272 © ERA Technology Ltd
Type of furnace / oven
Throughput Power rating MW
(average or range)
Energy consumption
Lifetime (years)
Capacity utilisation
PCB reflow oven (electric, continuous)
Very variable 40 Kw (electricity)
120 MWh/y (primary energy)
12 years 30% / 4000 h/y
Electric continuous multi-zone furnace
Process dependent
80 kW (electricity)
240 MWh/y (primary energy)
20 years 30% / 4000 h/y
Food manufacture Bakery tunnel oven, biscuits, gas
7,000 – 21,000 tpa
2 c.10 GWh/y 30 7000 h/y
Bakery tunnel oven, cereals, gas
5,000 – 20,650 tpa
0.36 – 2.3 MW c.6 GWh/y 30 7000h/y
Bakery tunnel oven, bread gas
10,000 – 15,000 tpa
0.15 – 1 MW 400 – 4000 MWh/y
25 50 – 80% / 5000 – 8000 h/y
Bakery batch rack (gas and electric)
600 – 1500 tpa 0.05 – 0.12 MW
80 – 346 MWh/y
15 4000 – 7200 h/y
Bakery batch deck (gas and electric)
450 – 3700 tpa 0.03 – 0.3 MW 24 – 864 MWh/y
15 2000 – 7200 h/y
Batch and continuous drying ovens gas
Batch 1 to 50,000 tpa. Continuous 1000 to 100,000 tpa
Large range Large range >20 Variable
Batch oven gas 1000 tpa 0.12 288 MWh/y 20 60% / 4000 h/y Drying Continuous wire drying oven gas
13,000 – 40,000 tpa
75 – 100 kW 720 MWh/y 15 90% / 8000 h/y
Hybrid microwave belt drier (electricity)
360 tpa 0.05 MW 288 MWh/y 20 80% / 7200 h/y
Batch grain drier (diesel or LPG)
1000 – 2000 tpa
0.7 – 1.63 MW 15.9 MWh/y 15 Used for 6 weeks per year
In cases where stakeholders have omitted some data, estimates have been made based on information that was available and is marked *. Some of the types included in Table 117 are for one design of furnace and others are for types of similar designs but of a range of sizes and in some cases data is a combination of figures from several manufacturers.
The performance parameter data provided by stakeholders is given in the tables below. Much of the data is from single stakeholders but some has been combined where more than one stakeholder has provided data for one type of furnace or oven. In the tables, n.d. = no data provided by stakeholders. Estimated energy savings are either values provided by a stakeholder or where none have been received, they have been estimated from the difference between the average and BAT values and the estimated losses from the applicable route (e.g. in combustion gases) . In a few cases, average = BAT and so the difference between average and BNAT is estimated (and marked “BNAT” in the tables).

ERA Technology Limited ERA Report No. 2012-0230
043122753 ENTR Lot 4 Final Report v6 273 © ERA Technology Ltd
Table 118 gives the flue gas temperature of furnaces and ovens at 3% O2. Some manufacturers provided actual temperatures and the flue gas oxygen content. These values have been converted to 3% O2 in Table 118 using the formula:
Temperature at 3% O2 = temperature at x%O2 x (21-3/21-x)
A few manufacturers that submitted data do not measure or know the actual oxygen concentration in flue gases (e.g. tunnel biscuit ovens) and so this has been estimated from the known efficiency using the equation:
Heat loss % = (tA – tL) x {(A/(21-O2))+B} where:
A = 0.66 and B = 0.009 for natural gas, tA = flue gas temperature and TL is combustion air temperature (i.e. ambient with no heat recovery).
Table 118. Range of flue gas temperature at 3% oxygen and estimated potential energy saving Type of furnace / oven
Max. process
temperature °°°°C
Worst Average Best BAT BNAT Energy saving achievable
Rotary cement kiln
1450 350 265 (280 @ 2%)
237 (250 @2%)
237 n.d. 10% (but recovered heat must be used elsewhere)
Flat glass melting gas
1500 750 700 650 500 300 5% (more if batch preheating used)
Container glass melting gas
1550 n.d. 600 n.d. n.d. n.d. Significant if batch preheating used
Container glass and glass fibre melting oxy-fuel
1600 n.d. 1690 (1500 @
5%) n.d. n.d. n.d. Heat recovery is
not common with oxy-fuel
Hot dip galvanizing, gas
950 800 650 400 400 350 10%
Forging furnace (all sizes)
1250 1250 700 350 350 300 10%
Bell type steel annealing gas
950 600 450 400 400 n.d. 10%
Steel reheating gas
1250 788 (700 @ 5%)
500 350 350 n.d. 10%
Bright annealing stainless steel gas
1200 n.d. n.d. 868* 868* 530 10% (BNAT)
Strip annealing furnace
>1000°C n.d. n.d. 820 530 (if strip
preheating is used)
Strip annealing furnace
<1000°C n.d. n.d. 500 350 (if strip
preheating is used)

ERA Technology Limited ERA Report No. 2012-0230
043122753 ENTR Lot 4 Final Report v6 274 © ERA Technology Ltd
Type of furnace / oven
Max. process
temperature °°°°C
Worst Average Best BAT BNAT Energy saving achievable
Steel wire heat treatment (various, gas)
1100 (austenizing
)900 @ 0.5% (790
@3%)
750 @ 0.5%
(659 @ 3%)
600 @ 0.5%
(527 @ 3%)
200 @ 0.5%
(176 @ 3%)
n.d. 25% (Note 0.5% O2 used to prevent
oxidation).
Steel wire galvanising (various, gas)
450 750 @ 1%
540 – 675 @ 0.5%
(different processe
s
500 – 600 @ 0.5%
200 @ 0.5%
n.d. 25%
Fluidised bed diffusion for wire (gas)
560 600 @ 9%
590 @ 9%
580 @ 9%
580 @ 9%
200 @ 2% Negligible
Aluminium heat treatment
500 550 300 160 160 n.d. c.10%
Vacuum brazing gas (copper)
670 686 (610 @ 5%)
610 587 (610 @ 2.3%)
578 (610 @
2%) n.d. c.2%
Aluminium scrap melting gas
1050 800 300 180 180 n.d. 12%
Rotary ferrous melting furnace gas
1600 700 600 450 450 n.d. With heat exchangers save
20% Compared to cold air burners
(alternatively, oxy-fuel burners save
45%) Rotary non-ferrous melting gas
1100 (copper)
700 600 550 550 n.d. Save 20% Compared to cold
air burners Aluminium holding gas
950 950 900 300 300 n.d. 15%
Wall tile kiln** 1200 300°C 250°C 180°C n.d. n.d. 10 – 12% Sanitary ware kiln**
1200 300°C 250°C 180°C n.d. n.d. 5 – 6%
Heavy clay kiln**
1050 n.d. 150 – 180°C
n.d. n.d. n.d. 5 – 6%
Bakery tunnel oven, biscuits, gas
200 1000 * n.d. 554 * n.d. n.d. 15%
Bakery tunnel oven, cereals, gas
250 c.1000 * n.d. c.550 * n.d. n.d. c.15%
Bakery tunnel oven, bread gas
250 – 300 780 c.400 320 n.d. n.d. c.10%
Bakery batch rack (gas)
250 780 350 250 n.d. n.d. 10 – 15%
Bakery batch deck (gas)
230 – 280 780 350 280 n.d. n.d. 10 – 12%

ERA Technology Limited ERA Report No. 2012-0230
043122753 ENTR Lot 4 Final Report v6 275 © ERA Technology Ltd
Type of furnace / oven
Max. process
temperature °°°°C
Worst Average Best BAT BNAT Energy saving achievable
Batch oven gas (indirect)
250 463 (450 @ 3.5%)
400 340 (350 @2.5%)
280 (300 @
2%) n.d. 10 – 15%
Continuous wire drying oven gas
200 250 @ 20% (no
heat recovery)
200 @ 20%
150 @ 20%
150 @ 20%
n.d. 5%
Data marked * are stakeholders figures at different O2 concentrations which were converted to 3% oxygen. Data for ceramics kilns marked ** are actual temperatures and the %O2 in combustion gases is much more than 3%.
Table 119 lists data provided by stakeholders for the percent heat recovered from combustion gases. There is less data here than in Table 118 because some manufacturers were not able to provide this information as they do not measure it. Some of the figures quoted are too low as they refer to heat recovered and reused to preheat burner air but do not include heat recovered by pre-heating incoming material. Therefore, in reality, the heat recovery values for the wall tile, sanitary ware and heavy clay kilns are higher than quoted.
Table 119. Estimated percentage of heat recovered from combustion gases Type of furnace /
oven Worst Average Best BAT BNAT Energy
saving achievable
Flat glass melting gas
30% 45% 56% 60% n.d. c.5%
Rotary ferrous melting furnace gas
10% 12% 20% 20% 25 – 30% 5%
Rotary non-ferrous melting gas
0% 10% 25% 25% 25 – 30% 10% (a)
Large strip annealing >1000°C
30% 39% (with strip preheating
Large strip annealing >1000°C
35% 40% c.60% (with strip pre-heating)
Wall tile kiln 3% 8% 20% n.d. n.d. 8% Sanitary ware kiln n.d. 5% n.d. n.d. n.d. 3 – 5% Heavy clay kiln n.d. 5 – 10% n.d. n.d. n.d. 3 – 5% Hazardous waste incinerators
900 – 1000
Most do not recover heat
30% 30% (b)
Bakery tunnel oven, biscuits, gas
0% n.d. Not used for direct fired ovens
50% (with indirect fired only)
50% 15%
Bakery tunnel oven, cereals, gas
0% n.d. Not used for direct fired ovens
50% (with indirect fired only)
50% 15%
ERA Technology Limited ERA Report No. 2012-0230
043122753 ENTR Lot 4 Final Report v6 276 © ERA Technology Ltd
Note (a); heat recovery is not possible for processes where slow controlled cooling of vapour is necessary such as with zinc oxide manufacture where the cooling rate controls particle size. Use of oxy-fuel gives lower fuel consumption but heat recovery is not viable Note (b); Although heat can be recovered from the combustion gases after the afterburner, this recovered heat cannot be re-used by the furnace so must be needed elsewhere. Combustion gases without heat recovery are c.850°C.
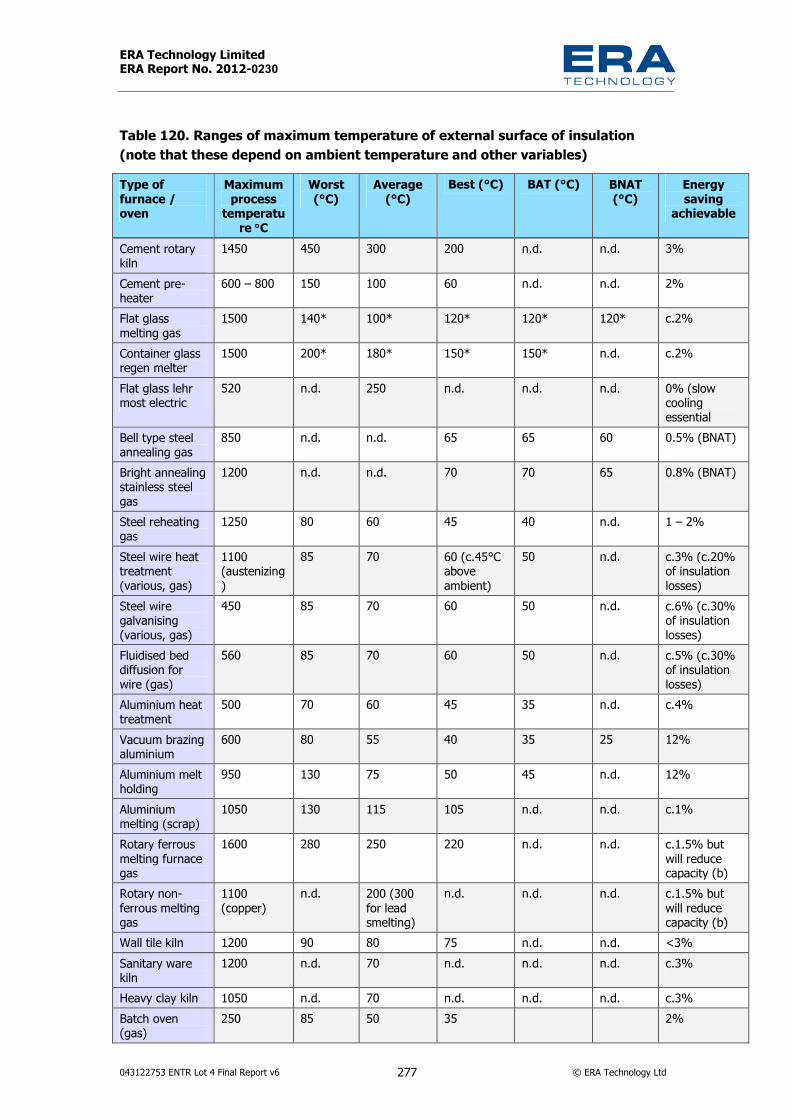
ERA Technology Limited ERA Report No. 2012-0230
043122753 ENTR Lot 4 Final Report v6 277 © ERA Technology Ltd
Table 120. Ranges of maximum temperature of external surface of insulation (note that these depend on ambient temperature and other variables) Type of furnace / oven
Maximum process
temperature °°°°C
Worst (°C)
Average (°C)
Best (°C) BAT (°C) BNAT (°C)
Energy saving
achievable
Cement rotary kiln
1450 450 300 200 n.d. n.d. 3%
Cement pre-heater
600 – 800 150 100 60 n.d. n.d. 2%
Flat glass melting gas
1500 140* 100* 120* 120* 120* c.2%
Container glass regen melter
1500 200* 180* 150* 150* n.d. c.2%
Flat glass lehr most electric
520 n.d. 250 n.d. n.d. n.d. 0% (slow cooling essential
Bell type steel annealing gas
850 n.d. n.d. 65 65 60 0.5% (BNAT)
Bright annealing stainless steel gas
1200 n.d. n.d. 70 70 65 0.8% (BNAT)
Steel reheating gas
1250 80 60 45 40 n.d. 1 – 2%
Steel wire heat treatment (various, gas)
1100 (austenizing)
85 70 60 (c.45°C above ambient)
50 n.d. c.3% (c.20% of insulation losses)
Steel wire galvanising (various, gas)
450 85 70 60 50 n.d. c.6% (c.30% of insulation losses)
Fluidised bed diffusion for wire (gas)
560 85 70 60 50 n.d. c.5% (c.30% of insulation losses)
Aluminium heat treatment
500 70 60 45 35 n.d. c.4%
Vacuum brazing aluminium
600 80 55 40 35 25 12%
Aluminium melt holding
950 130 75 50 45 n.d. 12%
Aluminium melting (scrap)
1050 130 115 105 n.d. n.d. c.1%
Rotary ferrous melting furnace gas
1600 280 250 220 n.d. n.d. c.1.5% but will reduce capacity (b)
Rotary non-ferrous melting gas
1100 (copper)
n.d. 200 (300 for lead smelting)
n.d. n.d. n.d. c.1.5% but will reduce capacity (b)
Wall tile kiln 1200 90 80 75 n.d. n.d. <3% Sanitary ware kiln
1200 n.d. 70 n.d. n.d. n.d. c.3%
Heavy clay kiln 1050 n.d. 70 n.d. n.d. n.d. c.3% Batch oven (gas)
250 85 50 35 2%

ERA Technology Limited ERA Report No. 2012-0230
043122753 ENTR Lot 4 Final Report v6 278 © ERA Technology Ltd
Type of furnace / oven
Maximum process
temperature °°°°C
Worst (°C)
Average (°C)
Best (°C) BAT (°C) BNAT (°C)
Energy saving
achievable
Electric batch and continuous furnace
1000 (batch) or 850 (continuous)
150 55 45 40 30 10% (unless fast cooling needed)
Electric multizone continuous furnace
1800 with high temperature accuracy
n.d. 200 n.d. n.d. n.d. None by improving insulation
Electric multizone continuous furnace
1000 n.d. 100 100 100 n.d. None by improving insulation
Electric multizone oven
300 n.d. 40 n.d. n.d. n.d. n.d.
Small electric batch chamber furnace (a)
1200 150 75 35 150 120 5 – 10%
Small electric batch drying oven (a)
250 70 60 30 70 60 c.4%
Small continuous “strand” furnace electric (a)
1000 100 70 30 100 90 c.2 – 3%
Hazardous waste incinerator
900 – 1000 250 200 150 n.d. n.d. 0%
Bakery tunnel oven, biscuits, gas
200 n.d. n.d. 40 – 50 40 – 50 n.d. 0%
Bakery tunnel oven, cereals, gas
250 n.d. n.d. 40 – 50 40 – 50 n.d. 0%
Bakery tunnel oven, bread gas
300 120 50 45 45 40 2 – 4%
Bakery batch rack (gas and electric)
250 70 50 30 (d) 30 n.d. c.3%
Bakery batch deck (gas and electric)
230 – 280 110 50 30 (d) 30 n.d. c.3%
Drying ovens Up to 600 90 70 50 n.d. n.d. <1% Continuous wire drying gas
200 60 50 40 40 n.d. 1 – 2%
* Achieved only with forced air cooling. Would be c.400°C in still air
Note (a); this manufacturer has supplied actual values for three types of furnace / oven. The “worst” corresponds to the temperature around the door, the average corresponds to the roof and the best corresponds with the sides and floor.
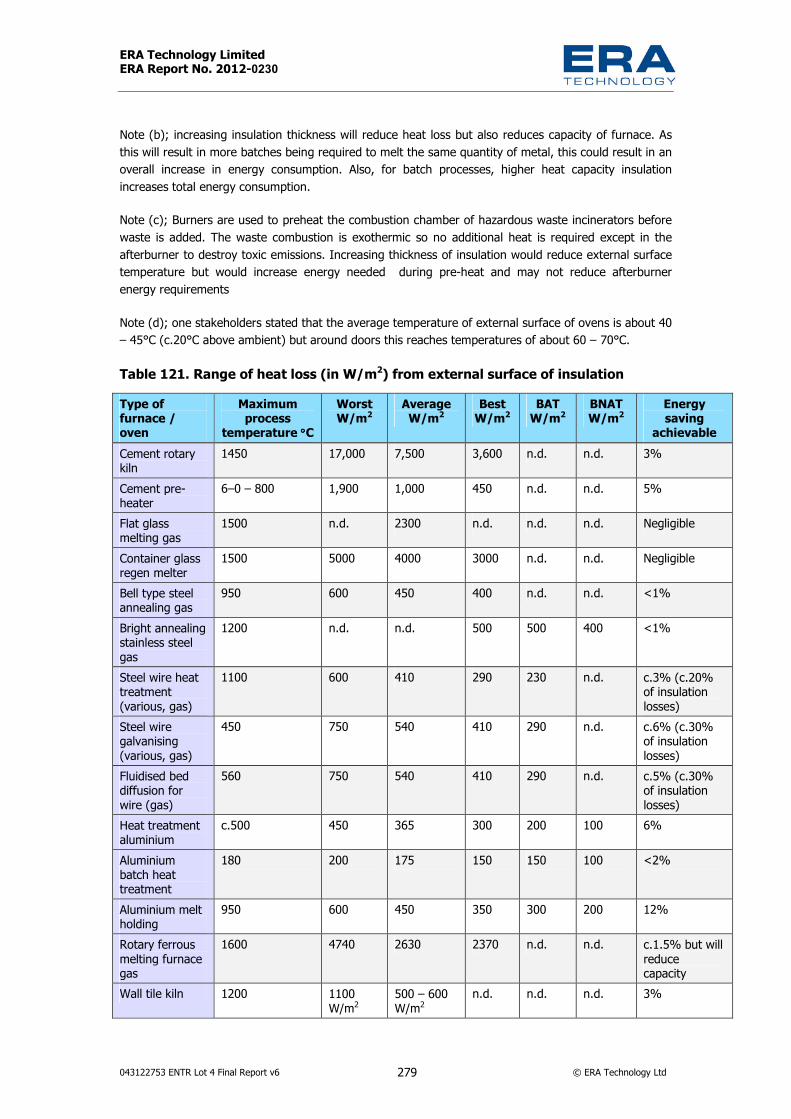
ERA Technology Limited ERA Report No. 2012-0230
043122753 ENTR Lot 4 Final Report v6 279 © ERA Technology Ltd
Note (b); increasing insulation thickness will reduce heat loss but also reduces capacity of furnace. As this will result in more batches being required to melt the same quantity of metal, this could result in an overall increase in energy consumption. Also, for batch processes, higher heat capacity insulation increases total energy consumption.
Note (c); Burners are used to preheat the combustion chamber of hazardous waste incinerators before waste is added. The waste combustion is exothermic so no additional heat is required except in the afterburner to destroy toxic emissions. Increasing thickness of insulation would reduce external surface temperature but would increase energy needed during pre-heat and may not reduce afterburner energy requirements
Note (d); one stakeholders stated that the average temperature of external surface of ovens is about 40 – 45°C (c.20°C above ambient) but around doors this reaches temperatures of about 60 – 70°C.
Table 121. Range of heat loss (in W/m2) from external surface of insulation Type of furnace / oven
Maximum process
temperature °°°°CWorst W/m2
Average W/m2
Best W/m2
BAT W/m2
BNAT W/m2
Energy saving
achievable Cement rotary kiln
1450 17,000 7,500 3,600 n.d. n.d. 3%
Cement pre-heater
6–0 – 800 1,900 1,000 450 n.d. n.d. 5%
Flat glass melting gas
1500 n.d. 2300 n.d. n.d. n.d. Negligible
Container glass regen melter
1500 5000 4000 3000 n.d. n.d. Negligible
Bell type steel annealing gas
950 600 450 400 n.d. n.d. <1%
Bright annealing stainless steel gas
1200 n.d. n.d. 500 500 400 <1%
Steel wire heat treatment (various, gas)
1100 600 410 290 230 n.d. c.3% (c.20% of insulation losses)
Steel wire galvanising (various, gas)
450 750 540 410 290 n.d. c.6% (c.30% of insulation losses)
Fluidised bed diffusion for wire (gas)
560 750 540 410 290 n.d. c.5% (c.30% of insulation losses)
Heat treatment aluminium
c.500 450 365 300 200 100 6%
Aluminium batch heat treatment
180 200 175 150 150 100 <2%
Aluminium melt holding
950 600 450 350 300 200 12%
Rotary ferrous melting furnace gas
1600 4740 2630 2370 n.d. n.d. c.1.5% but will reduce capacity
Wall tile kiln 1200 1100 W/m2
500 – 600 W/m2
n.d. n.d. n.d. 3%

ERA Technology Limited ERA Report No. 2012-0230
043122753 ENTR Lot 4 Final Report v6 280 © ERA Technology Ltd
Type of furnace / oven
Maximum process
temperature °°°°CWorst W/m2
Average W/m2
Best W/m2
BAT W/m2
BNAT W/m2
Energy saving
achievable Electric batch and continuous furnace
1000 (batch) or 850 (continuous)
>500 400 300 300 250 10% (unless fast cooling needed)
Small electric batch chamber furnace (a)
1200 2000 1500 1000 1500 1250 5 – 10%
Small continuous “strand” furnace electric (a)
1000 1500 1000 750 1500 1250 c.2 – 3%
Bakery tunnel oven, bread gas
300 400 300 50 n.d. n.d. c.3%
Bakery batch rack (gas and electric)
250 800 200 50 n.d. n.d. c.3%
Bakery batch deck (gas and electric–
2–0 – 280 700 200 50 n.d. n.d. c.3%
Medium / large drying ovens (gas)
Up to 600 350 250 180 n.d. n.d. <2%
Continuous wire drier (gas)
200 410 290 180 180 n.d. c.2%
Batch oven (gas)
250 700 300 150 n.d. n.d. c.2.5%
Small electric batch drying oven (a)
250 750 500 300 750 500 c.5%
Note (a); see below Table 120
A few manufacturers have provided gas : air ratio data which is listed below. It should be noted that this is not applicable to direct fired lower temperature processes (where the flame is inside the heating chamber), because secondary air is always added to mix with the hot combustion gases to maintain the lower temperature. The temperature of combustion gases from a gas flame are typically in excess of 1000°C, and so are usually diluted with air to achieve temperatures of <400°C. Some bakery ovens use indirect heating, where heat from combustion gases is transferred to circulating air with a heat exchanger. In these designs, the emitted combustion gas temperature will be hotter than the process temperature. Gas : air ratio data was provided in several formats. Many manufacturers use λ values and this is also used for the Japanese legislation.
λ = (Actual mass ratio of air/gas)/(Stoichiometric mass ratio of air/gas)
Stoichiometric mass ratio of air to methane (main constituent of natural gas) = 17.125 so when the gas/air ratio is stoichiometric (i.e. no excess air), λ = 1.00. The table below lists the calculated air / gas ratio expressed in different formats. Note that natural gas and other fuels will have slightly different values but λ is a useful ratio for eco-design options.

ERA Technology Limited ERA Report No. 2012-0230
043122753 ENTR Lot 4 Final Report v6 281 © ERA Technology Ltd
Excess air % Excess oxygen % by volume of
combustion gas Mass ratio parts air :
parts methane λλλλ
0% 0% 17.13 1.00 5% 0.9% 18.0 1.05 10% 1.74% 18.8 1.10 15% 2.5% 19.7 1.15 20% 3.2% 20.6 1.20 25% 3.9% 21.0 1.25
Fuel : air ratio performance parameters provided by stakeholders is as follows:
Table 122. Stakeholder data - range of fossil fuel : air ratio supplied to burners as λλλλ values and stakeholders estimates of energy saving achievable by superior control Type of furnace / oven
Worst Average Best BAT BNAT Energy saving achievable
Cement rotary kiln
1.25 1.15 1.05 1.05 n.d. c.1%
Container glass melting (regen)
n.d. 1.15 n.d. n.d. n.d. <1%
Flat glass melting gas
n.d. 1:10 n.d. n.d. n.d. Negligible
Bell type steel annealing gas
n.d. 1.235 1.235 1.16 0.5%
Bright annealing stainless steel gas
n.d. n.d. 1.235 1.235 n.d. 1%
Rotary ferrous melting furnace gas
n.d. 1:1.1 n.d. n.d. n.d. 0%
Rotary non-ferrous melting gas
Gas air ratio adjusted to meet process requirements. E.g. copper melting needs 10% excess air to melt then no excess air once molten
n.d. n.d.
Wall tile kiln 1.25 1.20 1.10 1.1 for NG, (1.25 for LPG)
n.d. c.1%
Sanitary ware kiln
1.25 1.20 1.10 1.1 for NG, (1.25 for LPG)
n.d. c.1%
Heavy clay kiln 1.25 1.20 1.10 1:1.10 for NG, (1.25 for LPG)
n.d. c.1%
Batch bakery ovens (indirect)
1.6 1.4 1.15 1.15 1.1 c.2%
Medium / large drying ovens (gas)
1.25 1.2 1.12 1.12 n.d. 1% (indirect driers)

ERA Technology Limited ERA Report No. 2012-0230
043122753 ENTR Lot 4 Final Report v6 282 © ERA Technology Ltd
Two stakeholders provided ratios for processes where reducing atmospheres are needed and so there is a small excess of gas.
Table 123. Energy lost data for water cooling of ovens and furnaces Type of
furnace / oven
Worst Average Best BAT BNAT Energy saving
achievable Vacuum heat treatment *
100% 100% 100% 100% 85% 15% (BNAT)
Vacuum induction melting
85% 77% 70% 70% 65% 5%
Vacuum heat treatment *
42% 35% 30% 15% 10% 6%
Modular vacuum heat treatment system
34% 26% 18% 14% 11% 5%
Aluminium heat treatment (retort pit furnace electric)
30% 27% 23% 23% 20% 33%
Electric melting furnace (23,000 tpa)
n.d. 15kW (0.05%)
n.d. n.d. n.d. 0%
Batch electric semiconductor diffusion furnace
n.d. >50% n.d. n.d. n.d. 0%. Fast cooling essential for process
* Very different values were provided by two stakeholders for vacuum furnaces, and so both are included in this table.
Some stakeholders have provided their estimates of heat lost in ventilated air. Ventilated air is applicable only to electrically heated ovens and furnaces and is either due to intentional ventilation to remove moisture, solvents, etc. or to control temperature. It also occurs as a result of leaks. Stakeholders have provided this information in a variety of ways and so these have been included in the table below.

ERA Technology Limited ERA Report No. 2012-0230
043122753 ENTR Lot 4 Final Report v6 283 © ERA Technology Ltd
Table 124. Electrically heated ovens and furnaces, range of heat lost in vented air Type of furnace / oven
Worst Average Best BAT BNAT Energy saving
achievableFlat glass lehr most are electric
n.d. 90 – 100% 100% of input heat – losses through insulation
Sometimes possible to use waste heat for building heating
n.d. n.d. 0%. Very slow controlled cooling needed.
Batch electric semiconductor diffusion furnace
n.d. >30% n.d. n.d. n.d. Fast cooling essential for process
PCB reflow oven (electric, continuous)
n.d. >90% (estimated)
n.d. n.d. n.d. Conveyer and product fast cooled
Electric continuous multi-zone furnace
n.d. >80% n.d. n.d. n.d. Conveyer and product fast cooled
Small electric batch chamber furnace
75% (around door)
60% (average value)
n.d. 60% 55% 5%
Small continuous “strand” furnace electric
50% (around door)
45% (average value)
n.d. 50% 45% 5%
Medium / large drying ovens gas
50% 25% 0% 0% n.d. 25%
Small electric batch drying oven
50% (around door)
40% (average value)
n.d. 50% 35% 5%
Very few manufacturers were able to provide energy consumption per kg of water evaporated during drying and this data is included in the table below. Technical constraints are important as some materials are temperature sensitive and so cannot be dried at higher temperature, which may be theoretically more energy efficient.
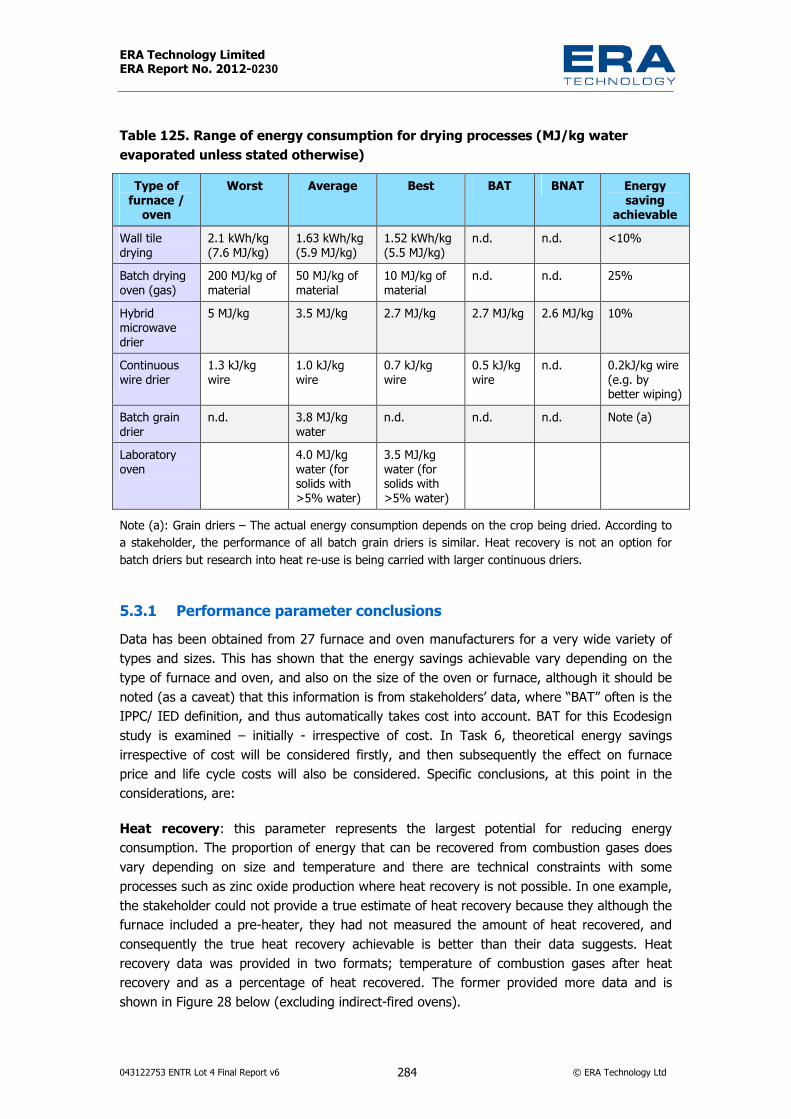
ERA Technology Limited ERA Report No. 2012-0230
043122753 ENTR Lot 4 Final Report v6 284 © ERA Technology Ltd
Table 125. Range of energy consumption for drying processes (MJ/kg water evaporated unless stated otherwise)
Type of furnace /
oven Worst Average Best BAT BNAT Energy
saving achievable
Wall tile drying
2.1 kWh/kg (7.6 MJ/kg)
1.63 kWh/kg (5.9 MJ/kg)
1.52 kWh/kg (5.5 MJ/kg)
n.d. n.d. <10%
Batch drying oven (gas)
200 MJ/kg of material
50 MJ/kg of material
10 MJ/kg of material
n.d. n.d. 25%
Hybrid microwave drier
5 MJ/kg 3.5 MJ/kg 2.7 MJ/kg 2.7 MJ/kg 2.6 MJ/kg 10%
Continuous wire drier
1.3 kJ/kg wire
1.0 kJ/kg wire
0.7 kJ/kg wire
0.5 kJ/kg wire
n.d. 0.2kJ/kg wire (e.g. by better wiping)
Batch grain drier
n.d. 3.8 MJ/kg water
n.d. n.d. n.d. Note (a)
Laboratory oven
4.0 MJ/kg water (for solids with >5% water)
3.5 MJ/kg water (for solids with >5% water)
Note (a): Grain driers – The actual energy consumption depends on the crop being dried. According to a stakeholder, the performance of all batch grain driers is similar. Heat recovery is not an option for batch driers but research into heat re-use is being carried with larger continuous driers.
5.3.1 Performance parameter conclusions Data has been obtained from 27 furnace and oven manufacturers for a very wide variety of types and sizes. This has shown that the energy savings achievable vary depending on the type of furnace and oven, and also on the size of the oven or furnace, although it should be noted (as a caveat) that this information is from stakeholders’ data, where “BAT” often is the IPPC/ IED definition, and thus automatically takes cost into account. BAT for this Ecodesign study is examined – initially - irrespective of cost. In Task 6, theoretical energy savings irrespective of cost will be considered firstly, and then subsequently the effect on furnace price and life cycle costs will also be considered. Specific conclusions, at this point in the considerations, are:
Heat recovery: this parameter represents the largest potential for reducing energy consumption. The proportion of energy that can be recovered from combustion gases does vary depending on size and temperature and there are technical constraints with some processes such as zinc oxide production where heat recovery is not possible. In one example, the stakeholder could not provide a true estimate of heat recovery because they although the furnace included a pre-heater, they had not measured the amount of heat recovered, and consequently the true heat recovery achievable is better than their data suggests. Heat recovery data was provided in two formats; temperature of combustion gases after heat recovery and as a percentage of heat recovered. The former provided more data and is shown in Figure 28 below (excluding indirect-fired ovens).

ERA Technology Limited ERA Report No. 2012-0230
043122753 ENTR Lot 4 Final Report v6 285 © ERA Technology Ltd
0200400600800
10001200140016001800
0 500 1000 1500 2000Process temperature
Comb
ustio
ngas
tempa
fterh
eatre
cove
ry
WorstAverageBestBATBNAT
Figure 28. Heat recovery – flue gas temperature This shows a wide scatter of data, with values mostly in the range 200°C - 800°C. The data point at 1690°C on the vertical axis is for an oxy-fuel burner, where heat recovery is not usually used (although may give energy savings if this were possible). Most “worst” values are in the range 600°C – 900°C, most “average” are in the range 200°C – 800°C and most “best” and BAT are in the range 200°C - 600°C. Thus it is clear that new furnace performance does vary, and therefore that an overall improvement is possible.
BAT values provided by stakeholders vary considerably. This is at least partly due to differences between processes. The range of BAT values provided by stakeholders is from 20% to 60% of heat from combustion gases leaving the main furnace chamber. The temperature of combustion gas entering the chimney also varied from 200°C to 600°C for furnaces (plus one value at 868°C) and from 160° to 200° for ovens. CECOF (The European Committee of Industrial Furnace and Heating Equipment Associations) recommended considering furnaces with process temperatures above 1000°C differently to those at below 1000°C. Examination of the data indicates that there is a difference between large-size and medium-size furnaces and ovens. The most commonly-quoted average values and BAT values from stakeholders provided were:
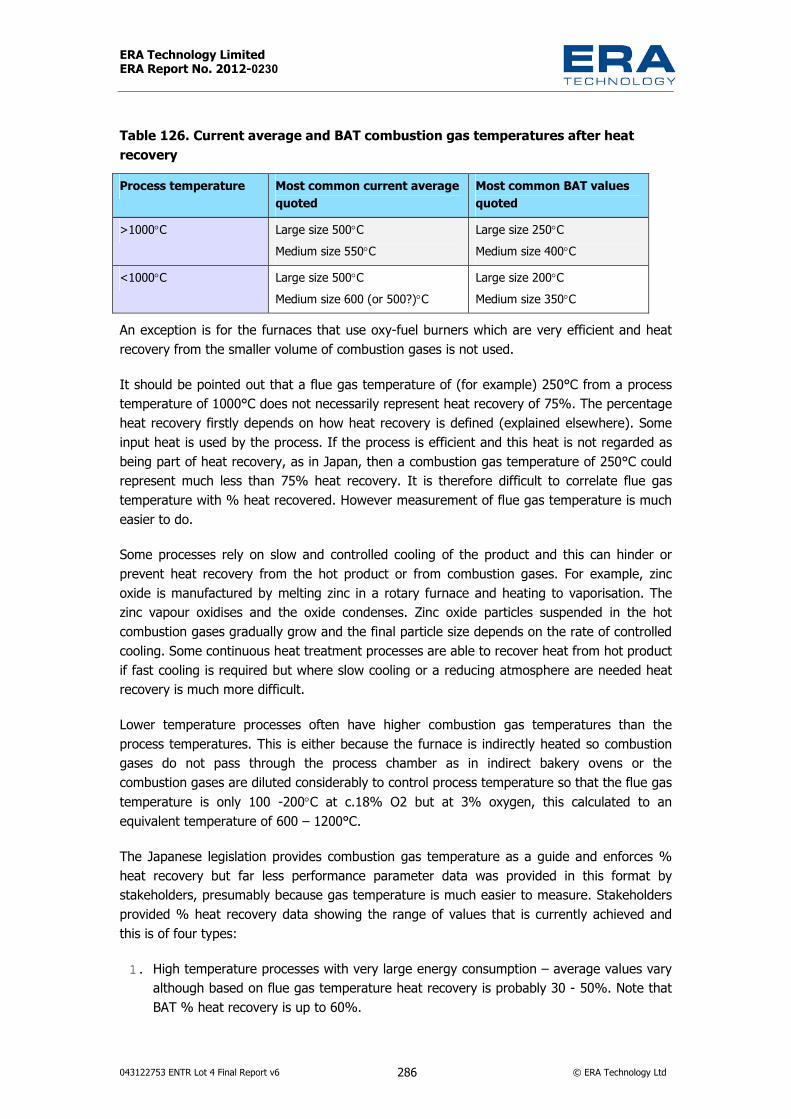
ERA Technology Limited ERA Report No. 2012-0230
043122753 ENTR Lot 4 Final Report v6 286 © ERA Technology Ltd
Table 126. Current average and BAT combustion gas temperatures after heat recovery Process temperature Most common current average
quoted Most common BAT values quoted
>1000°C Large size 500°CMedium size 550°C
Large size 250°CMedium size 400°C
<1000°C Large size 500°CMedium size 600 (or 500?)°C
Large size 200°CMedium size 350°C
An exception is for the furnaces that use oxy-fuel burners which are very efficient and heat recovery from the smaller volume of combustion gases is not used.
It should be pointed out that a flue gas temperature of (for example) 250°C from a process temperature of 1000°C does not necessarily represent heat recovery of 75%. The percentage heat recovery firstly depends on how heat recovery is defined (explained elsewhere). Some input heat is used by the process. If the process is efficient and this heat is not regarded as being part of heat recovery, as in Japan, then a combustion gas temperature of 250°C could represent much less than 75% heat recovery. It is therefore difficult to correlate flue gas temperature with % heat recovered. However measurement of flue gas temperature is much easier to do.
Some processes rely on slow and controlled cooling of the product and this can hinder or prevent heat recovery from the hot product or from combustion gases. For example, zinc oxide is manufactured by melting zinc in a rotary furnace and heating to vaporisation. The zinc vapour oxidises and the oxide condenses. Zinc oxide particles suspended in the hot combustion gases gradually grow and the final particle size depends on the rate of controlled cooling. Some continuous heat treatment processes are able to recover heat from hot product if fast cooling is required but where slow cooling or a reducing atmosphere are needed heat recovery is much more difficult.
Lower temperature processes often have higher combustion gas temperatures than the process temperatures. This is either because the furnace is indirectly heated so combustion gases do not pass through the process chamber as in indirect bakery ovens or the combustion gases are diluted considerably to control process temperature so that the flue gas temperature is only 100 -200°C at c.18% O2 but at 3% oxygen, this calculated to an equivalent temperature of 600 – 1200°C.
The Japanese legislation provides combustion gas temperature as a guide and enforces % heat recovery but far less performance parameter data was provided in this format by stakeholders, presumably because gas temperature is much easier to measure. Stakeholders provided % heat recovery data showing the range of values that is currently achieved and this is of four types:
1. High temperature processes with very large energy consumption – average values vary although based on flue gas temperature heat recovery is probably 30 - 50%. Note that BAT % heat recovery is up to 60%.

ERA Technology Limited ERA Report No. 2012-0230
043122753 ENTR Lot 4 Final Report v6 287 © ERA Technology Ltd
2. Large-scale ceramics kilns – a range of lower values was submitted from 3% to 20% but these values are only for reuse of heat used by gas burners. Heat is also recovered and reused in the pre-heater stage of the kiln but this stakeholder could not provide data for this. As the temperature of the combustion gases leaving the pre-heater can be as low as 250°C, it is likely that heat recovery by the preheater is better than 40% with the best performing kilns (this depends on preheater length) and additional heat recovery using a heat exchanger is also possible recovering at least 10% more heat. Therefore if heat reused by burners plus the heat recovered by the pre-heater and by a heat exchanger are totalled, then a total of 60% heat recovery should be achievable.
3. Smaller-scale process – rotary melting furnaces are medium-size industrial and the best heat recovery currently achieved is 25% with an average value of c.10%. Higher % heat recovery would be achievable but stakeholders claim that the cost would be very high whereas ox-fuel burners, although expensive should give lower fuel consumption.
4. Data for direct fired bakery ovens – these do not have heat exchangers unlike some of the less efficient indirect fired ovens, but discussion with the stakeholder indicated that 40 - 50% heat recovery would be achievable by installing heat exchangers.
It appears that the following may be realistic average and BAT values:
Process temperature Current average BAT values >1000°C Large size 40%
Medium size 30% Large size 60% Medium size 40%
<1000°C Large size 35% Medium size 25%
Large size 50% Medium size 35%
The above values are the best performance values provided by stakeholders although with some processes, they will not be achievable due to technical constraints. Some types of processes do not currently meet these values because the cost of achieving them is too high although this is quantified in task 6.
Based on stakeholders data, only a few designs can already achieve the BAT values. Others, mainly smaller – size furnaces currently recover less energy than the average values.
CECOF have also suggested an intermediate level that should be technically achievable currently for most furnaces and ovens based on two process temperature ranges:
• >1000°C 40% heat recovery (all sizes) • <1000°C combustion gas maximum temperature 600°C measured at 3% oxygen (all
sizes) To achieve the maximum overall decrease in energy consumption, it is common for implementing measures to impose several levels or “tiers” of progressively more severe requirements over a period of time. In this study, three tiers of minimum eco-design parameters are considered, with the first being the least severe and the third and last being the most severe, i.e., most progressive. Timescales between tiers needs to be considered. Tier 1 comprises the recommendations of CECOF, and is not very ambitious; Tier 1should be
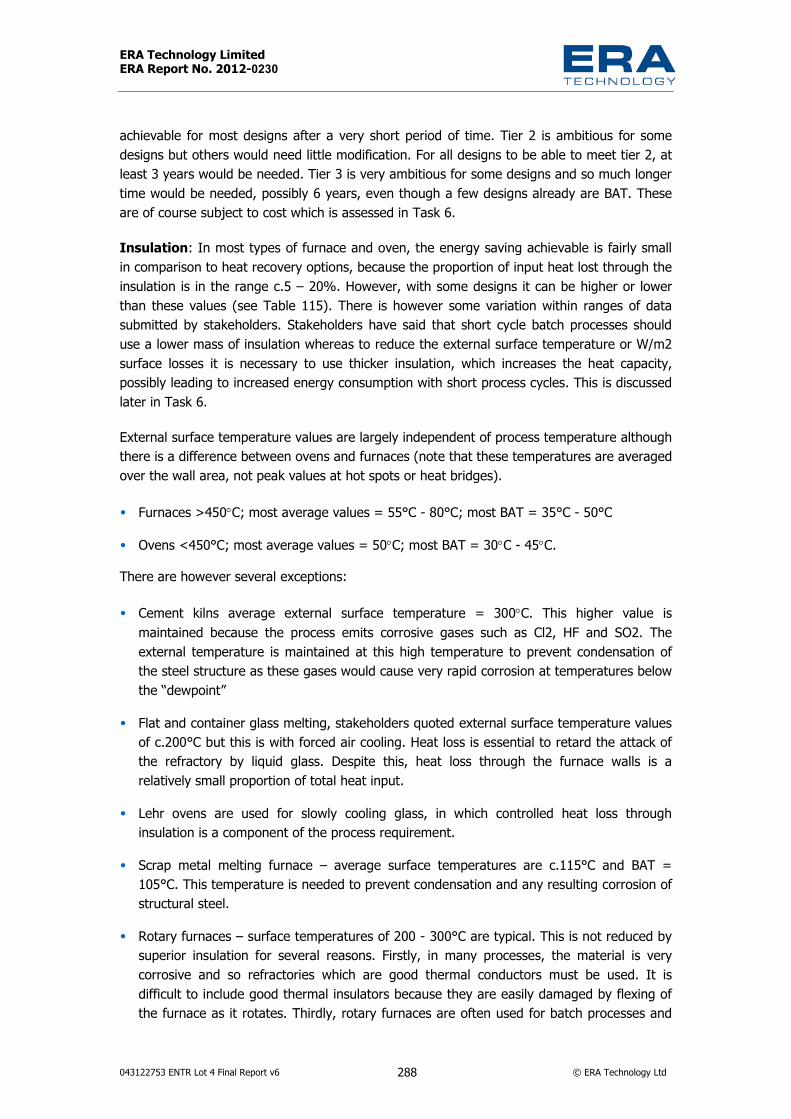
ERA Technology Limited ERA Report No. 2012-0230
043122753 ENTR Lot 4 Final Report v6 288 © ERA Technology Ltd
achievable for most designs after a very short period of time. Tier 2 is ambitious for some designs but others would need little modification. For all designs to be able to meet tier 2, at least 3 years would be needed. Tier 3 is very ambitious for some designs and so much longer time would be needed, possibly 6 years, even though a few designs already are BAT. These are of course subject to cost which is assessed in Task 6.
Insulation: In most types of furnace and oven, the energy saving achievable is fairly small in comparison to heat recovery options, because the proportion of input heat lost through the insulation is in the range c.5 – 20%. However, with some designs it can be higher or lower than these values (see Table 115). There is however some variation within ranges of data submitted by stakeholders. Stakeholders have said that short cycle batch processes should use a lower mass of insulation whereas to reduce the external surface temperature or W/m2 surface losses it is necessary to use thicker insulation, which increases the heat capacity, possibly leading to increased energy consumption with short process cycles. This is discussed later in Task 6.
External surface temperature values are largely independent of process temperature although there is a difference between ovens and furnaces (note that these temperatures are averaged over the wall area, not peak values at hot spots or heat bridges).
• Furnaces >450°C; most average values = 55°C - 80°C; most BAT = 35°C - 50°C • Ovens <450°C; most average values = 50°C; most BAT = 30°C - 45°C. There are however several exceptions:
• Cement kilns average external surface temperature = 300°C. This higher value is maintained because the process emits corrosive gases such as Cl2, HF and SO2. The external temperature is maintained at this high temperature to prevent condensation of the steel structure as these gases would cause very rapid corrosion at temperatures below the “dewpoint”
• Flat and container glass melting, stakeholders quoted external surface temperature values of c.200°C but this is with forced air cooling. Heat loss is essential to retard the attack of the refractory by liquid glass. Despite this, heat loss through the furnace walls is a relatively small proportion of total heat input.
• Lehr ovens are used for slowly cooling glass, in which controlled heat loss through insulation is a component of the process requirement.
• Scrap metal melting furnace – average surface temperatures are c.115°C and BAT = 105°C. This temperature is needed to prevent condensation and any resulting corrosion of structural steel.
• Rotary furnaces – surface temperatures of 200 - 300°C are typical. This is not reduced by superior insulation for several reasons. Firstly, in many processes, the material is very corrosive and so refractories which are good thermal conductors must be used. It is difficult to include good thermal insulators because they are easily damaged by flexing of the furnace as it rotates. Thirdly, rotary furnaces are often used for batch processes and

ERA Technology Limited ERA Report No. 2012-0230
043122753 ENTR Lot 4 Final Report v6 289 © ERA Technology Ltd
as the proportion of input heat lost through the refractories is quite small, increasing the heat capacity would result in an increase in energy consumption.
• Multizone furnaces which are designed to give accurate temperature profiles must loose heat from the hotter zones to be able to control the temperature of adjacent cooler zones. As a result, the external surface of the insulation is 100°C - 200°C, depending on process temperature. These furnaces have an air gap between the insulation and the external case to allow air to flow around the furnace and remove heat. This hot air is vented without heat recovery as the payback time for heat exchangers would be several decades.
Some stakeholders have also provided insulation performance data as W/m2. Similar exceptions apply as for external surface temperature and the ranges of values provided are:
• Furnaces >450°C average values = 400 – 550 W/m2, BAT = 200 – 400 W/m2. • Ovens <450°C average values = 200 – 500 W/m2, BAT = 150 – 290 W/m2 with 50 W/m2
quoted for batch bakery ovens by one stakeholder. Based on stakeholders data, the following values appear to be achievable eco-design options at least for some ovens and furnaces that can be evaluated in task 6.
Design Wall temperature Surface heat loss Small / medium Batch ovens Maximum average wall temperature 40°C < 200 W/m2
Small / medium Continuous oven
Maximum average wall temperature 40°C < 200 W/m2.
Small / medium Batch furnace Maximum average wall temperature 60°C < 400 W/m2.Small / medium Continuous furnace
Maximum average wall temperature 50°C < 400 W/m2.
Large furnace i). >1000°C maximum = 70°C, ii). In range 450°C – 1000°C maximum = 60°C
<400 W/m2.
Large oven <450°C maximum = 40°C with maximum (hot-spots) <100°C
<200W/m2.
Batch ovens with short cycle times may need to be considered differently (see task 6).
Hot areas such as around doors and burners are usually the maximum external temperatures as these are thermal bridges whereas these account for only small proportions of a wall’s area and so the use of average wall temperature limits may be preferable. Although measurement of temperature is simpler than heat loss in W/m2, the use of W/m2 limits may be easier to enforce as this avoids the need to define how average wall temperature is calculated. Several stakeholders have expressed concern that if either calculated temperature values or W/m2 are quoted to show compliance, users will expect these to be achieved by their furnaces, whereas the actual W/m2 values may be lower, as the theoretical calculations will have limited accuracy.
External wall temperature and heat loss in W/m2 are related but there are variables that affect this relationship such as the emissivity of the outer surface. In general, the thicker the layer of insulation, the lower the outer surface temperature and heat loss. However thermal conductivity is also important and so thinner layers of microporous insulator can achieve the
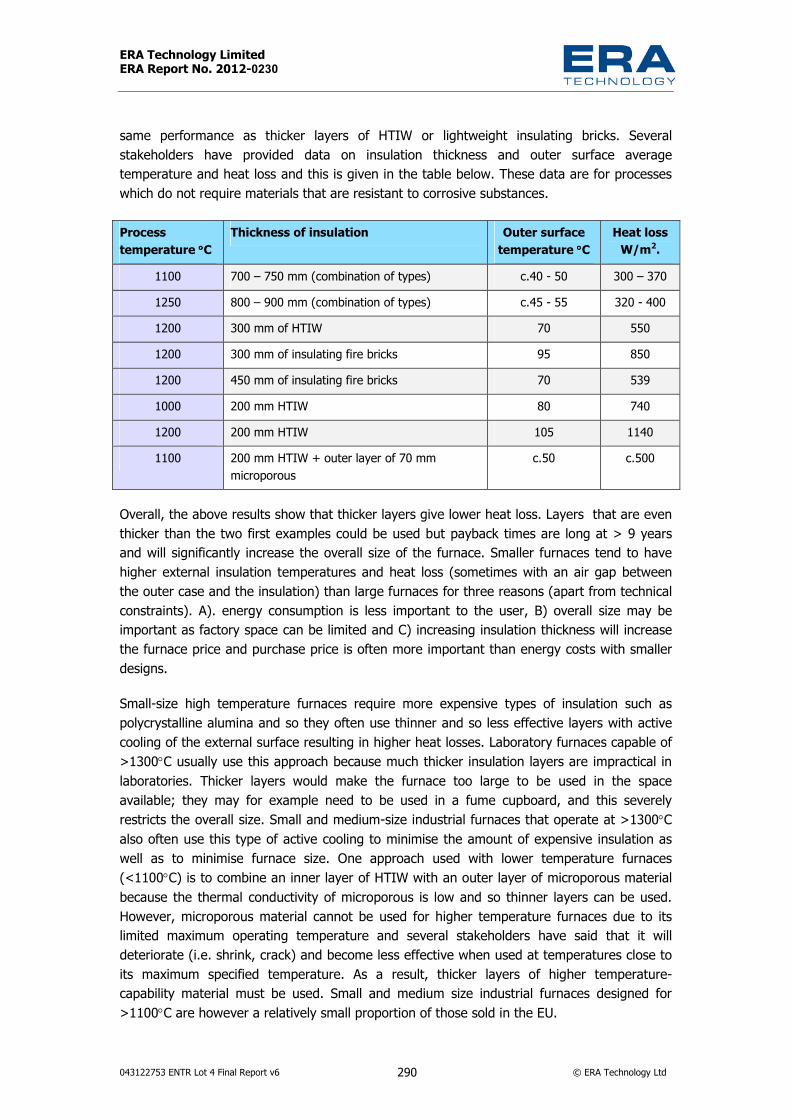
ERA Technology Limited ERA Report No. 2012-0230
043122753 ENTR Lot 4 Final Report v6 290 © ERA Technology Ltd
same performance as thicker layers of HTIW or lightweight insulating bricks. Several stakeholders have provided data on insulation thickness and outer surface average temperature and heat loss and this is given in the table below. These data are for processes which do not require materials that are resistant to corrosive substances.
Process temperature °°°°C
Thickness of insulation Outer surface temperature °°°°C
Heat loss W/m2.
1100 700 – 750 mm (combination of types) c.40 - 50 300 – 370 1250 800 – 900 mm (combination of types) c.45 - 55 320 - 400 1200 300 mm of HTIW 70 550 1200 300 mm of insulating fire bricks 95 850 1200 450 mm of insulating fire bricks 70 539 1000 200 mm HTIW 80 740 1200 200 mm HTIW 105 1140 1100 200 mm HTIW + outer layer of 70 mm
microporous c.50 c.500
Overall, the above results show that thicker layers give lower heat loss. Layers that are even thicker than the two first examples could be used but payback times are long at > 9 years and will significantly increase the overall size of the furnace. Smaller furnaces tend to have higher external insulation temperatures and heat loss (sometimes with an air gap between the outer case and the insulation) than large furnaces for three reasons (apart from technical constraints). A). energy consumption is less important to the user, B) overall size may be important as factory space can be limited and C) increasing insulation thickness will increase the furnace price and purchase price is often more important than energy costs with smaller designs.
Small-size high temperature furnaces require more expensive types of insulation such as polycrystalline alumina and so they often use thinner and so less effective layers with active cooling of the external surface resulting in higher heat losses. Laboratory furnaces capable of >1300°C usually use this approach because much thicker insulation layers are impractical in laboratories. Thicker layers would make the furnace too large to be used in the space available; they may for example need to be used in a fume cupboard, and this severely restricts the overall size. Small and medium-size industrial furnaces that operate at >1300°Calso often use this type of active cooling to minimise the amount of expensive insulation as well as to minimise furnace size. One approach used with lower temperature furnaces (<1100°C) is to combine an inner layer of HTIW with an outer layer of microporous material because the thermal conductivity of microporous is low and so thinner layers can be used. However, microporous material cannot be used for higher temperature furnaces due to its limited maximum operating temperature and several stakeholders have said that it will deteriorate (i.e. shrink, crack) and become less effective when used at temperatures close to its maximum specified temperature. As a result, thicker layers of higher temperature-capability material must be used. Small and medium size industrial furnaces designed for >1100°C are however a relatively small proportion of those sold in the EU.

ERA Technology Limited ERA Report No. 2012-0230
043122753 ENTR Lot 4 Final Report v6 291 © ERA Technology Ltd
The result of these constraints is that small and medium-size furnaces (especially very high temperature designs) cannot achieve the same low heat loss or low external temperature values as large-size furnaces.
Gas: air ratio: This is applicable only for higher temperature processes and indirect furnaces and ovens because if the burner gases need to be mixed with cold air to control oven temperature such as in biscuit ovens, there is no benefit in accurate gas:air ratio control. Only a few stakeholders provided data and this showed a small difference between average values and BAT values and all claimed that potential energy savings are relatively small. Apart from one stakeholder’s data, average values were in the range 1:1 to 1:4 and BAT values were in the range 1:1.05 to 1:15 for natural gas as fuel (1:1.25 with LPG fuel). As burner design is less dependent on process, it is reasonable to assume that if one manufacturer can achieve 1:1.05 then this is possible for all, although it may be costly. However, the 1:1.05 value is for cement kilns which are unusual, as they have only one very large burner; therefore, it is much easier to control the fuel/air ratio than with furnaces with many burners. A ratio of 1:1.1 is probably achievable using BAT for multiburner furnaces using natural gas, and a ratio of 1:1.25 with Liquid Petroleum Gas (LPG).
Gas : air ratio control is unsuitable for direct-fired ovens because the combustion gases must be diluted with air to achieve the required process temperature. Cold air has to be mixed with combustion gases to achieve the desired temperature, therefore limiting excess burner air is pointless. The gas:air ratio control cannot be regulated by an implementing measure where specific atmosphere conditions are needed. Some processes require a reducing atmosphere with, for example - a 1:0.95 ratio, whereas some processes are designed to oxidise metal surfaces and so higher proportions of air are used.
Those stakeholders who estimated energy savings claimed that a reduction of λ value from 1.2 to 1.1 reduces energy consumption by c.1%. This is in contrast to two publications173 which state that the theoretical energy saving for a furnace operating at 1100°C from using 20% excess air to stoichiometric would be 18% less fuel needed. Based on this, a reduction of λ value from 1.2 (20% excess air) to 1.1 (10% excess air) would save 9% fuel.
Heat losses from ventilation: very little data could be obtained. In some of the cases where data was provided, this showed that ventilation air is used for controlled (fast) cooling of parts.
Water cooling: only applicable to a few types of furnace and only limited data provided. In some furnaces water cooling is used to fast-cool products and so removes up to 100% of input heat. In some designs, there is variation in the amount of heat removed but the range is different for each type of furnace.
Drying energy: only applicable to driers and very limited data provided. It is clear that hybrid microwave drying is one of the most efficient processes although microwave energy is electrical (not primary energy). Some manufacturers provided data for energy consumed per
173 A Best Practices Process Heating Technical Brief - Waste Heat Reduction and Recovery for Improving Furnace Efficiency, Productivity and Emissions Performance, U.S. Department of Energy. 2004. The second publication refers to the DoE’s Energy Efficiency handbook which states that a 1% decrease in excess air saves 1% of fuel.

ERA Technology Limited ERA Report No. 2012-0230
043122753 ENTR Lot 4 Final Report v6 292 © ERA Technology Ltd
kg of material being dried, not per kg of water evaporated and so this cannot be compared. In one case (wire drying), energy saving is achievable by better wiping which is not dependent on the drier design. Based on the limited data provided, at least for relatively wet materials, it appears that drying energy requirements are process dependent. Data in Table 116 (section 5.2.4) is for brick drying and gives lower values than for wall tiles. This is probably correct as wall tiles are more prone to forming small cracks which make them unusable if drying temperatures are too high. As drying temperature and drying efficiency are directly related it is reasonable that wall tile drying consumes more energy than clay brick drying. BAT for wall tile drying is quoted at 5.5 MJ/kg water whereas 4 MJ/kg water may be achievable for most materials with at least 10% moisture, and which are not overly heat sensitive.
5.4. Definition of BNAT Research into new technologies that will be available within 10 years include a wide variety of innovative furnace designs as well as alternative processes for making the products that are currently produced in standard design ovens and furnaces. These innovations have two main aims which are:
• Reduction in energy consumption; and • Reduction in global warming gas emissions, especially CO2. Reduction in energy consumption is needed because energy supplies are not an unlimited resource and energy prices are expected to rise in the long term. Traditional sources of energy will decline as demand exceeds supply and many new renewable sources require very large land areas, considerable investment or both.
Fossil CO2 emissions from industrial furnaces and ovens are mainly from combustion of fossil fuels. Emissions of CO2 will be reduced by energy efficiency changes to furnaces and ovens but, as shown in this report, these alone will not achieve the target of an 80% reduction by 2050. With some processes, it may be possible to switch to electricity as an energy source but, as this is currently generated primarily from fossil fuels in most EU States and generation efficiency from coal and gas is c.30% - 40%174, this may give no benefit in fossil carbon emissions. Only when a significantly higher proportion of EU electricity is generated from sources other than fossil fuels will switching to electricity as an energy source be beneficial. Some existing process cannot however use electricity. Cement manufacture will require fossil fuels into the foreseeable future and so the only way to reduce CO2 emissions will be by carbon capture and storage (CCS) although not within the next ten years. This is also being considered for steel manufacture (again, not within ten years). The CCS process however consumes additional energy and so a new oxy-fuel cement kiln with added CCS will consume c.5% more fossil fuel and more than double the amount of electricity than the best new traditional cement kilns.
174 174 http://www.ecofys.com/files/files/ecofys_2011_international_comparison_fossil_power_efficiency.pdf
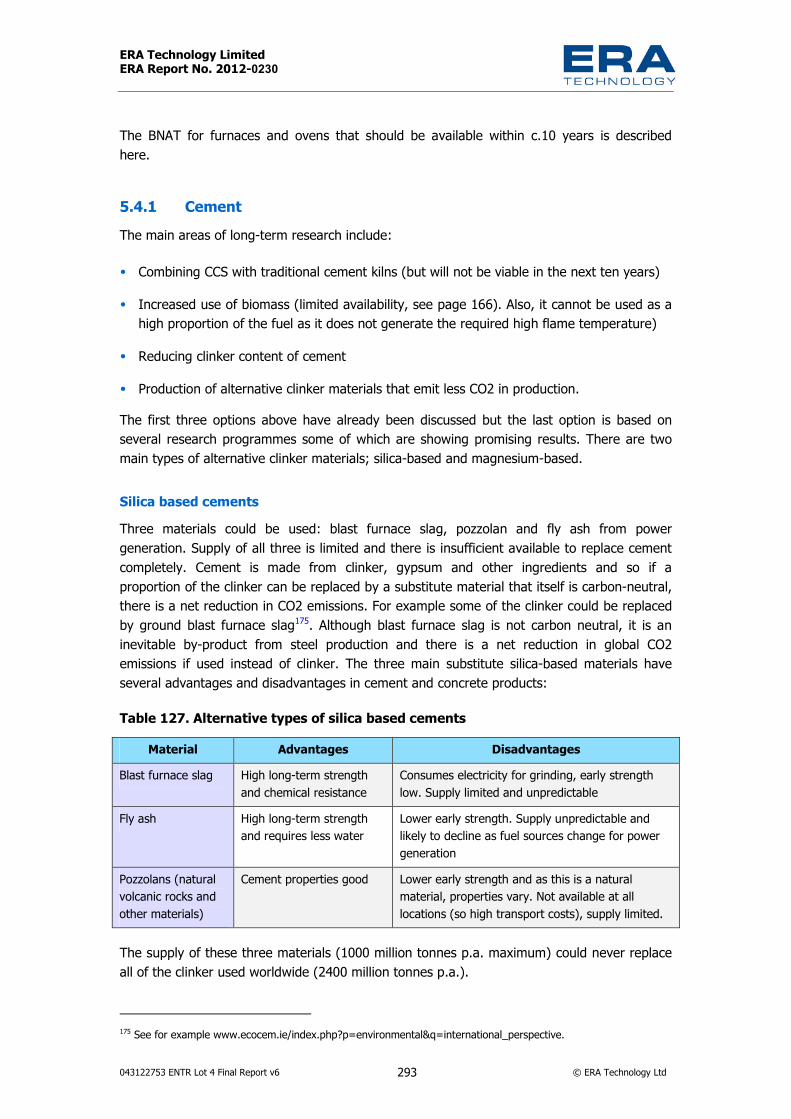
ERA Technology Limited ERA Report No. 2012-0230
043122753 ENTR Lot 4 Final Report v6 293 © ERA Technology Ltd
The BNAT for furnaces and ovens that should be available within c.10 years is described here.
5.4.1 Cement The main areas of long-term research include:
• Combining CCS with traditional cement kilns (but will not be viable in the next ten years) • Increased use of biomass (limited availability, see page 166). Also, it cannot be used as a
high proportion of the fuel as it does not generate the required high flame temperature) • Reducing clinker content of cement • Production of alternative clinker materials that emit less CO2 in production. The first three options above have already been discussed but the last option is based on several research programmes some of which are showing promising results. There are two main types of alternative clinker materials; silica-based and magnesium-based.
Silica based cements Three materials could be used: blast furnace slag, pozzolan and fly ash from power generation. Supply of all three is limited and there is insufficient available to replace cement completely. Cement is made from clinker, gypsum and other ingredients and so if a proportion of the clinker can be replaced by a substitute material that itself is carbon-neutral, there is a net reduction in CO2 emissions. For example some of the clinker could be replaced by ground blast furnace slag175. Although blast furnace slag is not carbon neutral, it is an inevitable by-product from steel production and there is a net reduction in global CO2 emissions if used instead of clinker. The three main substitute silica-based materials have several advantages and disadvantages in cement and concrete products:
Table 127. Alternative types of silica based cements Material Advantages Disadvantages
Blast furnace slag High long-term strength and chemical resistance
Consumes electricity for grinding, early strength low. Supply limited and unpredictable
Fly ash High long-term strength and requires less water
Lower early strength. Supply unpredictable and likely to decline as fuel sources change for power generation
Pozzolans (natural volcanic rocks and other materials)
Cement properties good Lower early strength and as this is a natural material, properties vary. Not available at all locations (so high transport costs), supply limited.
The supply of these three materials (1000 million tonnes p.a. maximum) could never replace all of the clinker used worldwide (2400 million tonnes p.a.).
175 See for example www.ecocem.ie/index.php?p=environmental&q=international_perspective.

ERA Technology Limited ERA Report No. 2012-0230
043122753 ENTR Lot 4 Final Report v6 294 © ERA Technology Ltd
Magnesium-based cements Magnesium-based cements are relatively new materials which have the advantages that their supply is not limited and that their use can be carbon-negative. This means that overall in their life cycle, there is a net decrease in atmospheric CO2. This is because, although some CO2 is generated by combustion of fossil fuels, there are no CO2 emissions from heating the magnesium silicate raw materials unlike with traditional cement that emits CO2 from calcination of limestone. The magnesia cement then absorbs atmospheric CO2 (as does traditional cement) when it cures and the amount absorbed is more than the amount emitted during its manufacture. The production of these materials involve furnace processes which consume less energy than traditional cement. The main types are:
• CeramiCrete was developed in USA176 and is made from magnesium oxide and a water soluble phosphate. The extent that this reduces CO2 emissions, if any, is unclear as most magnesium oxide is made by thermal processes from magnesium carbonate.
• Novacem cement is made of magnesium oxide but this is produced from silicates and so no carbon dioxide is produced from the mineral. Some CO2 is generated from fuels used to heat the magnesium silicate but this is less than the amount that is absorbed when the cement cures. The overall process results in the absorption of 100kg more CO2 per tonne of cement than production emits177. The developers claim that reserves of magnesium silicate minerals are very large and so would not limit adoption of this technology. CE Delft calculate that in comparison with a new BAT traditional cement kiln, Novacem cement production consumes 40% less fossil fuel energy, uses 40% more electricity but life cycle CO2 emissions are negative as more is adsorbed by curing cement than is generated by the process178.
• Calera have a process to sequester CO2 from power generation by passing into seawater where it reacts with dissolved magnesium and calcium to form magnesium and calcium carbonates that are subsequently filtered, and can then be used to make cement. It is unclear to what extent this will reduce total carbon dioxide emissions179.
• Calix is an Australian organisation that has developed a flash calcination process. This heats small particles of dolomite very quickly and so could be very energy efficient. In this process, dolomite (mixed magnesium/calcium carbonates) is heated to create a magnesium-based cement binder. This is a thermal process and so consumes energy and which emits CO2 from the dolomite, which is a carbonate mineral. The emitted CO2 can be sequestered by a separate process and hence could reduce overall CO2 emissions180.
176 Ceramicrete: Chemically Bonded Ceramic; Argonne National Laboratory, website; Dec 2010; http://www.anl.gov/techtransfer/Available_Technologies/Material_Science/Ceramicrete/index.html 177 Carbon negative cement; Novacem website; Dec 2010; http://novacem.com/technology/novacem-technology/ 178 Harry Croezen and Marisa Korteland “Technological developments in Europe A long-term view of CO2 efficient manufacturing in the European region”, CE Delft, July 2010 179 $19.9 million to turn CO2 into cement; Deborah Gage; Smartplanet website; 23 Jul 2010; http://www.smartplanet.com/technology/blog/thinking-tech/199-million-to-turn-co2-into-cement/4838/ 180 http://www.calix.com.au/History.aspx

ERA Technology Limited ERA Report No. 2012-0230
043122753 ENTR Lot 4 Final Report v6 295 © ERA Technology Ltd
• TecEco is another Australian cement based on magnesium oxide produced by calcination of magnesium carbonate181. The developers claim that the temperature needed to convert the magnesium carbonate to magnesium oxide is only 700°C which is much lower than the temperature needed for clinker production and so it consumes less energy.
Magnesium-based cements are relatively new and their performance is not identical to traditional Portland cement. Some types clearly result in lower CO2 emissions or even negative emissions, but for others this is less clear and detailed life cycle analyses would be needed to determine the extent of any environmental benefits. Even if some are suitable for a wide variety of applications, one issue is that there has been very large investment in traditional cement kilns in the EU and these will not be closed down and replaced before their useful lives have ended while the alternative materials are not significantly cheaper to produce.
Other types of cement There are also other materials that have been developed as cement substitutes.
• Geopolymer cement was developed in the 1950s using fly ash, steel slag and other waste materials with caustic alkali17. Much lower process temperatures are needed for this material than are used for traditional Portland cement which significantly reduces CO2 emissions and energy consumption. It is clear that this process significantly reduced CO2 emissions but raw materials such as fly ash are of a limited supply although a variety of other materials could be used. Strength may be an issue and has limited its use.
• C-Fix (Shell Delft) is an oil-based binder which has been developed by Shell and UKM182 who claim that this type of “cement” significantly reduces CO2 emissions. This material is available in the EU and has been used mainly to construct roads but can be used to replace cement in other applications.
One alternative option for reducing the energy consumption for clinker production is to modify the composition so that a lower process temperature can be used. One proposed option is to add c.1% of fluoride as calcium fluoride to the raw clinker mix. This allows the process temperature to be lowered by 150°C which is estimated to save 50 – 180MJ / tonne of clinker and 5 – 16 kg CO2 / tonne clinker. This option has not however been adopted as the added cost for calcium fluoride is more than the cost of the fuel saved, owing to the limited availability of calcium fluoride and the added energy costs for grinding clinker and scrubbing fluoride emissions183.
5.4.2 Steel manufacture The EC and some Member States are supporting research with several studies. These include ULCOS which involves a consortium of steel manufacturers who are researching four energy 181 Tececo website; Dec 2010; http://www.tececo.com/ 182 C-Fix, C-Fix website; Dec 2010; http://www.c-fix.com/english/default.htm 183 Cement Sustainability Initiative and European Cement Research Academy, Development of state of the art techniques in cement manufacturing, 4 June 2009. Technology Paper No. 1: Improve raw mix burnability, e.g. by mineralisers

ERA Technology Limited ERA Report No. 2012-0230
043122753 ENTR Lot 4 Final Report v6 296 © ERA Technology Ltd
efficiency developments as well as carbon capture and storage184. The German government has provided a €30 million grant for top gas recycling research, which is an energy efficiency improvement to the blast furnace process. Although pilot plant are being built or are planned, it is unlikely that any of these new technologies will be operating commercially by 2020, with the possible exception of the Hlarsa process.
Top gas recycling – reducing gases (mainly carbon monoxide and hydrogen) are separated from CO2 that is emitted from the top of the blast furnace and then recycled back into the furnace as a reducing agent. This is facilitated by oxygen injection rather than air to reduce the nitrogen content of top gases. Top gases are hot and contain combustible carbon monoxide and hydrogen and so can also be used to generate electricity on site for use within the plant so the use of top gas recycling will reduce electricity generation although there will be an overall improved energy efficiency. This process has been successfully demonstrated at a pilot plant in Sweden185 and can be retrofitted to existing blast furnaces. Less coke reducing agent is used but more electricity is consumed however the developers believe that some energy savings should be possible. The main benefit of this technology is that it provides an opportunity to use CCS with the pure CO2 removed from the top gas.
The ULCOS (Ultra–Low Carbon dioxide Steelmaking) consortium is also carrying out research into alternative steelmaking processes:
Hlarsa smelting technology – Coal and ore are pre-heated and partially pyrolysed in a reactor, then the ore is melted in a cyclone and finally iron is produced in a smelter furnace. It is expected to produce 20% less CO2 than the traditional blast furnace mainly because ore sintering and coke production are not required. As a result, less coal is used and some of this can be substituted by other fuels. Each stage has been demonstrated and a large-scale pilot plant (60,000 tonnes p.a.) is being constructed in the Netherlands. The liquid pig iron is transferred to a basic oxygen furnace for further processing using traditional steel production technology. A new Hlarsa plant can be considerably smaller than a blast furnace and so capital costs are much lower. As 20% less energy is used, operating costs are also reduced partly because a wider range of feed-stocks can be used. As no new steel production is planned in the EU and existing blast furnaces can be refurbished for less than a new Hlarsa plant, it is unclear whether this technology will be utilised in the EU without legislation, or tightening of energy efficiency requirements via IED IPPC BREF guidance.
ULCORED – Direct reduction of iron is reported by ULCOS to be more expensive than the blast furnace route in the EU, and consumes more energy. This new route is based on directly reduced iron (DRI) production, but uses natural gas as a reducing agent, and aims to use less gas than traditional DRI. This option has several problems, however. Natural gas is too expensive in the EU for this option to be competitive and there are technical problems with impurities that need to be resolved. Furthermore, switching from coal to natural gas will not achieve the EU’s target for GHG emission reduction by 2050 of 80%186. The use of 184 HIsarna smelter technology; ULCOS website; Dec 2010; http://www.ulcos.org/en/research/isarna.php 185 http:/Lead /www.ulcos.org/en/research/blast_furnace.php# 186 This is mostly because iron oxide reduction to metal requires a fixed amount of carbon and methane is composed of 78% carbon by weight. Note, however, that less CO2 will be emitted via methane use, as methane generates 882 kJ/mole of CO2 compared to coal (carbon) at 394 KJ/mole (see Table 70).

ERA Technology Limited ERA Report No. 2012-0230
043122753 ENTR Lot 4 Final Report v6 297 © ERA Technology Ltd
biomass is also being considered but there is insufficient world supply and increased use would have other undesirable effects as described on page 166.
Molten oxide electrowinning – iron ore (oxide) is dissolved in a mixture of molten oxides at 1600°C. This temperature is above the melting point of iron so that liquid iron is produced by electrowinning on an inert cathode. Oxygen gas is produced at the anode. Electrowinning processes can be energy efficient as electricity is efficiently used to produce the metal although some is needed for heating. Some heat is required to melt the oxides but as electricity is the energy source, carbon dioxide emissions could be eliminated if in the future this could be generated from fossil fuel-free sources. Electrowinning using molten oxides is already carried out on a very large scale to produce aluminium from bauxite although the energy consumption per tonne is relatively large. As iron is a more dense metal, the energy consumption for iron production per tonne by electrolysis would be considerably less than for aluminium (more than half). The IPPC BREF guide for steel indicates that the electrolysis process would require 4.5MWh/tonne steel. If this were generated today in average EU coal-fired power station, this would generate 4.5 tonnes CO2/tonne of steel which is about three times as much as the blast furnace route. This process is only viable if electricity is generated from renewable or nuclear sources. This research is at a relatively early stage with a pilot plant planned. It is not likely to become an attractive option until cheap CO2 emission-free electricity is available although it does have the advantage that CCS would not be required to produce steel without CO2 emissions.
A different consortium of steel manufacturers is being supported by the EC in a study “Energy efficiency and CO2 emissions prospective scenarios for the iron and steel industry in the EU” (EC contract 2009/S 156-226975). The aim of this study is to analyse technology innovations in the iron and steel industry in the EU to quantify their impact on energy efficiency and CO2 emissions and cost up to 2030.
Outside the EU, the “FASTSMELT” process is being developed by Kobe Steel. This includes a rotary hearth furnace and a 500,000 tonnes p.a. demonstration unit has been built in USA. This is a two-stage thermal process in which iron ore / coal briquettes are heated in a reducing gas in the rotary hearth furnace and the hot product is then transferred to a melting furnace which can be electrically heated (e.g. an electric arc furnace) or coal / oxygen heated to melt the iron. The researchers estimate that this process will use 10% less energy and emit 5% less CO2 than an EU blast furnace, but the cost of a new installation will be considerably more than a new blast furnace - although operating costs will be less.
One current source of lost heat energy is from blast furnace slag. The IPPC BREF guide for steel states that this emerges at c.1450°C but that the heat is not recovered anywhere in the world. Tests have been carried out but technical problems exist. There is c.0.35GJ energy available per tonne of steel produced.
Research into electric arc furnace design is being carried out and the Contiarc process has been developed and one plant installed in USA. This is a continuous process using a DC arc which also smelts materials. Due to its design, the feedstock is pre-heated by emerging hot gases making this a very energy-efficient process.

ERA Technology Limited ERA Report No. 2012-0230
043122753 ENTR Lot 4 Final Report v6 298 © ERA Technology Ltd
5.4.3 Glass A variety of new process and design options are being investigated which could lead to improvements in glass melting technology. These include:
Advanced pre-heaters for oxy-fuel furnaces187 – Preheating cullet is used at some glass installations in the EU as described in section 5.2.1 but these cannot currently be used with oxy-fuel furnaces because the flue gases are too hot unless quenched with water or diluted with cold air which gives too large a volume such that much of the heat is lost. A new process (Praxair-BCB) is being developed which can use undiluted gases at >1200°C for preheating feedstock and should reduce CO2 emissions and energy consumption by up to 25% for oxy-fuel furnaces.
Pre-heating the raw materials for glass melting furnaces is very uncommon in the EU for the reasons described in section 5.2.1 but US research was carried into a solution to dust formation, mostly in the 1980s188. The introduction of fine powders as pellets or briquettes is fairly common in many industry sectors including steel production. To produce pellets or briquettes, the mixture of raw material powders are mixed with a binder and a small amount of water and this is either rolled into pellets or pressed to form briquettes. The pellets and briquettes are usually made slightly damp and should be dust-free. These could be dried using hot exhaust gases that are emitted from the regenerators of the glass melting furnace. These hot gases, which can be at up to 500°C, could also be used to pre-heat the pellets or briquettes. This research found that by forming pellets, the heating time was reduced, which also saves energy and increases furnace capacity but since the work was carried out in the 1980s, it has not been widely adopted (except for glass wool manufacture189). Technical problems are often encountered when processes are scaled up and stakeholders have pointed out that a full-scale demonstrator plant has yet to be built to prove that this technology is viable and that the energy savings achieved in the 1980s research can be replicated on a larger scale.
Submerged combustion melting – this has been researched since the 1960s but there are many technical issues that have not been fully resolved. Burners are situated below the melt which cause very efficient stirring of the raw materials and reduce the time required in the melter by at least 80% and this reduces energy consumption. This is used in a few plant outside the EU for mineral wool production but cannot yet be used for other types of glass. It is estimated that energy savings of at least 5% will be possible. Research reported in 2006 has also been carried out in the USA using submerged oxy-fuel burners which is claimed to give energy savings of up to 23%190.
187 IPPC BREF Guide on glass draft, 2009. 188 http://www.osti.gov/glass/Glass%20R&D%20Project%20Final%20Reports/selective_batching.pdf 189 http://www.propubs.com/gic/presentations2009/6GrenzebachFenne.pdf 190 Energy-Efficient Glass Melting — Next Generation Melter; US DoE; 2 Oct 2010; http://www1.eere.energy.gov/industry/glass/pdfs/glassnextgenmelter.pdf
ERA Technology Limited ERA Report No. 2012-0230
043122753 ENTR Lot 4 Final Report v6 299 © ERA Technology Ltd
GlasFlox recuperative burners – These are a new type of flameless recuperative burner designed for glass melting and which are claimed to reduce NOx emissions by 50%191.
High intensity plasma melting123 – Several studies have examined the use of plasma heating for glass melting but none have so far been commercialised as some technical issues have yet to be resolved. US research from 2006 claims that a new modular plasma glass melter design would reduce energy consumption by 40% compared to current technology192.
5.4.4 Ceramics Microwave assisted firing and drying – This is relatively new as research was carried out in 1995. Microwave radiation heats the ceramic parts directly including the interior of stacks of parts so that heating is more uniform inducing less stress. Microwave alone however is not suitable as the air inside the furnace is not heated so that heat is lost from the surface of ceramic parts which can cause stresses. Gas or electric heating is used in combination with microwave energy. There is a significant reduction in heat energy consumption, mainly as process times are much shorter although in processes where hot air from kilns is used for drying, less excess heat will be available and so will need to be generated separately. There are also other technical benefits (improved density) but microwave assisted firing cannot be used for all materials and is unsuitable for complex or thin shapes.
Radiant tube burners in kilns – Radiant tube burners have advantages over other types of heaters as discussed in Task 4 on page 165. There is, however an additional advantage in their use in ceramic kilns that no flue gases enter the kiln. Flue gases contain water which at high temperature results in the formation of HF (hydrogen fluoride) gas by reaction with fluorides in the clay. HF is very toxic and must be scrubbed from flue gases and so the use of radiant tube burners avoids HF formation.
5.4.5 Non-ferrous metals Emerging technologies are described in the draft IPPC BREF guide on non-ferrous metals (2009) and in other sources of data. These include the following that are applicable to furnaces:
Copper – Some research into new continuous smelting and converter techniques has been carried out with large-scale trials outside the EU. An option for potentially lowering CO2 emissions is to use hydrometallurgical instead of thermal processes, although environmental benefits would rely on electricity being generated without the use of fossil fuels.
191 Application of Flameless Oxidation in Glass Melting Furnaces - GlassFLOXTM; Anne Giese, Uwe Konold, Ahmad Al-Halbouni, Klaus Görner, Gottfried Schwarz, Benjamin Köster, 7th Int. Symp. of High Temperature Air Combustion and Gasification, 13-16 Jan 2008; http://www.uni-due.de/imperia/md/content/luat/publikationen/2008-01-13_hitacg_gwi-drh.pdf 192 High-Intensity Plasma Glass Melter; US DoE; 27 Sep 2006; http://www.osti.gov/glass/Glass%20R&D%20Project%20Factsheets/High%20intensity%20plasma%20glass%20melter.pdf

ERA Technology Limited ERA Report No. 2012-0230
043122753 ENTR Lot 4 Final Report v6 300 © ERA Technology Ltd
Aluminium – the development of inert anodes (for the electrolysis process) would avoid the need for large amounts of thermal energy used to produce carbon anodes as well as other benefits but technical issues still need to be resolved. An option for refining aluminium dross without the need for corrosive salt fluxes is the use of electric arc furnaces. Plasma melting has been investigated in the USA and is reported to have an electrical energy efficiency of >70% and has a higher capacity than an equivalent gas-fired furnace193. Other R & D has been carried out to design more energy efficient regenerative and other types of burners (see the section on page 157).
Lead and zinc – several technologies may be viable: Secondary zinc melting with plasma burners, new furnace designs such as the Outotec flash smelter for lead (demonstrated but not commercialised) and modifications to blast furnaces such as fines injection through tuyeres to avoid re-treating in the sinter plant and to use furnace control technology that is already used in other sectors such as steel194.
5.4.6 Other industrial processes Discussions with stakeholders has identified research being carried out into the adoption of heat exchangers for processes that currently do not recover flue gas energy, for example in bakery ovens and continuous grain driers. Some of these could be available commercially within 10 years. Increasing energy prices is encouraging research into designs to re-use excess heat from furnaces more efficiently. This is clearly possible in new factories but is often difficult in established installations where a kiln that generates hot air may be a long distance from a location where a new drying oven can be located, which would use the kiln air for drying. The greater the distance, the larger the heat losses, even with good insulation.
5.4.7 Laboratory ovens and furnaces Laboratory oven and furnace manufacturers do not publish their research and so little data is available on BNAT for these products. Most research is however targeted at new thermal insulation materials.
5.4.8 Other BNAT technologies Several new and developing technologies are being studied by the EDEFU study195 which is being carried out by a consortium of furnace manufacturers, users and research organisations. The aim is to develop new technologies for the aluminium and other non-ferrous metals, glass, ceramics and cement industries. The main areas of research are:
• Plasma processes – this is a high intensity heat source so will give faster melting, which in turn shortens process time, increasing productivity and reducing energy losses per tonne of product as each batch is heated for less time.
193 Original research by “Electric Power Research Institute” (EPRI), see http://mydocs.epri.com/docs/public/IN-107020.pdf and http://www.oneatmosphereplasma.com/one/benefits.html 194 http://www.outotec.com/pages/Page.aspx?id=38082&epslanguage=EN 195 http://www.edefu.eu/english/homepage
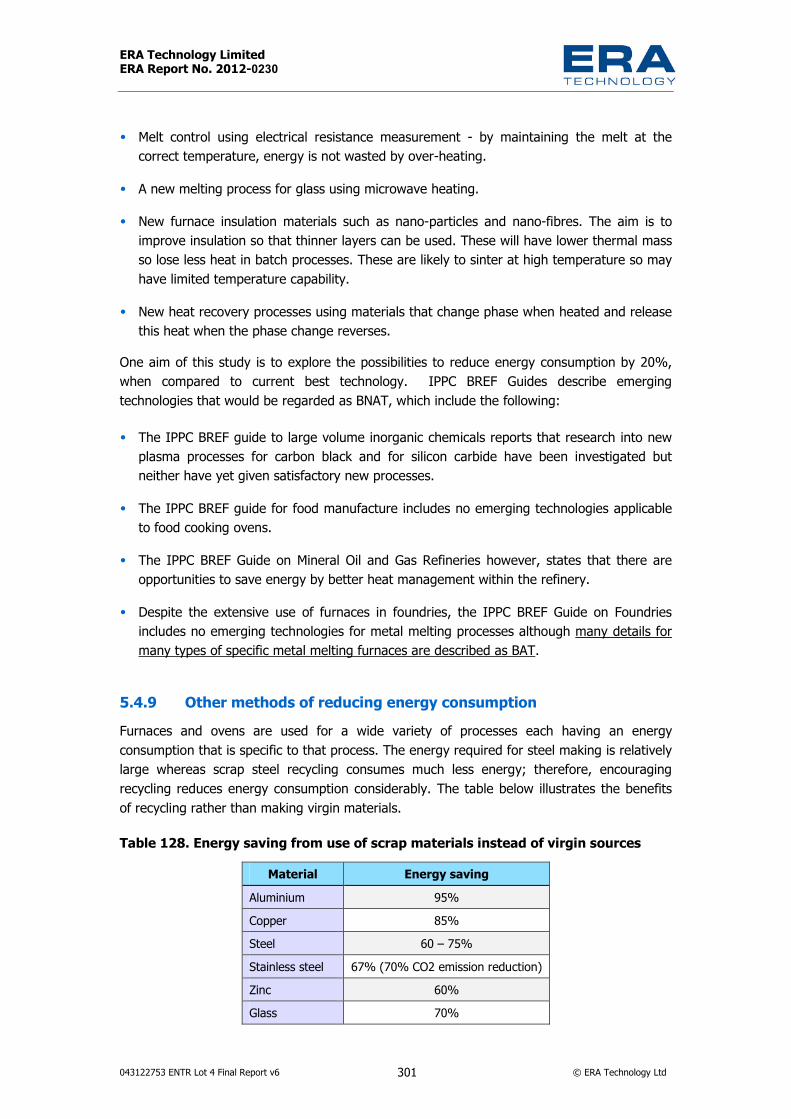
ERA Technology Limited ERA Report No. 2012-0230
043122753 ENTR Lot 4 Final Report v6 301 © ERA Technology Ltd
• Melt control using electrical resistance measurement - by maintaining the melt at the correct temperature, energy is not wasted by over-heating.
• A new melting process for glass using microwave heating. • New furnace insulation materials such as nano-particles and nano-fibres. The aim is to
improve insulation so that thinner layers can be used. These will have lower thermal mass so lose less heat in batch processes. These are likely to sinter at high temperature so may have limited temperature capability.
• New heat recovery processes using materials that change phase when heated and release this heat when the phase change reverses.
One aim of this study is to explore the possibilities to reduce energy consumption by 20%, when compared to current best technology. IPPC BREF Guides describe emerging technologies that would be regarded as BNAT, which include the following:
• The IPPC BREF guide to large volume inorganic chemicals reports that research into new plasma processes for carbon black and for silicon carbide have been investigated but neither have yet given satisfactory new processes.
• The IPPC BREF guide for food manufacture includes no emerging technologies applicable to food cooking ovens.
• The IPPC BREF Guide on Mineral Oil and Gas Refineries however, states that there are opportunities to save energy by better heat management within the refinery.
• Despite the extensive use of furnaces in foundries, the IPPC BREF Guide on Foundries includes no emerging technologies for metal melting processes although many details for many types of specific metal melting furnaces are described as BAT.
5.4.9 Other methods of reducing energy consumption Furnaces and ovens are used for a wide variety of processes each having an energy consumption that is specific to that process. The energy required for steel making is relatively large whereas scrap steel recycling consumes much less energy; therefore, encouraging recycling reduces energy consumption considerably. The table below illustrates the benefits of recycling rather than making virgin materials.
Table 128. Energy saving from use of scrap materials instead of virgin sources Material Energy saving
Aluminium 95% Copper 85% Steel 60 – 75% Stainless steel 67% (70% CO2 emission reduction) Zinc 60% Glass 70%
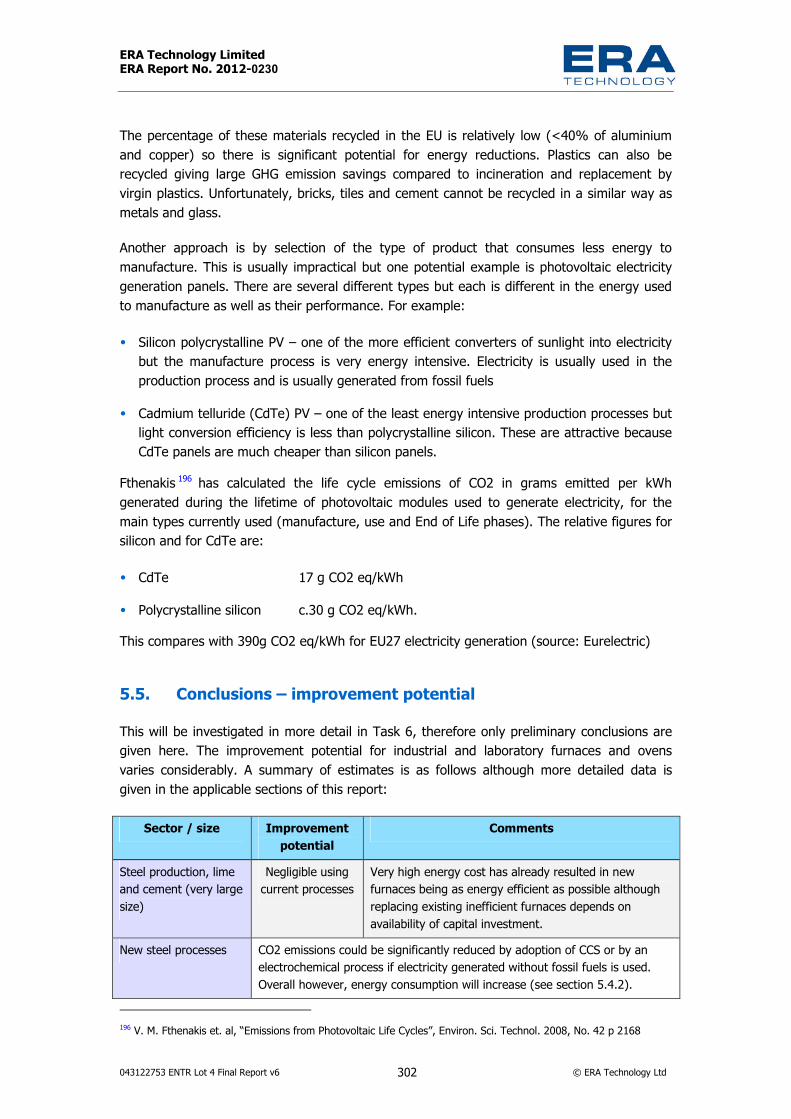
ERA Technology Limited ERA Report No. 2012-0230
043122753 ENTR Lot 4 Final Report v6 302 © ERA Technology Ltd
The percentage of these materials recycled in the EU is relatively low (<40% of aluminium and copper) so there is significant potential for energy reductions. Plastics can also be recycled giving large GHG emission savings compared to incineration and replacement by virgin plastics. Unfortunately, bricks, tiles and cement cannot be recycled in a similar way as metals and glass.
Another approach is by selection of the type of product that consumes less energy to manufacture. This is usually impractical but one potential example is photovoltaic electricity generation panels. There are several different types but each is different in the energy used to manufacture as well as their performance. For example:
• Silicon polycrystalline PV – one of the more efficient converters of sunlight into electricity but the manufacture process is very energy intensive. Electricity is usually used in the production process and is usually generated from fossil fuels
• Cadmium telluride (CdTe) PV – one of the least energy intensive production processes but light conversion efficiency is less than polycrystalline silicon. These are attractive because CdTe panels are much cheaper than silicon panels.
Fthenakis 196 has calculated the life cycle emissions of CO2 in grams emitted per kWh generated during the lifetime of photovoltaic modules used to generate electricity, for the main types currently used (manufacture, use and End of Life phases). The relative figures for silicon and for CdTe are:
• CdTe 17 g CO2 eq/kWh • Polycrystalline silicon c.30 g CO2 eq/kWh. This compares with 390g CO2 eq/kWh for EU27 electricity generation (source: Eurelectric)
5.5. Conclusions – improvement potential This will be investigated in more detail in Task 6, therefore only preliminary conclusions are given here. The improvement potential for industrial and laboratory furnaces and ovens varies considerably. A summary of estimates is as follows although more detailed data is given in the applicable sections of this report:
Sector / size Improvement potential
Comments
Steel production, lime and cement (very large size)
Negligible using current processes
Very high energy cost has already resulted in new furnaces being as energy efficient as possible although replacing existing inefficient furnaces depends on availability of capital investment.
New steel processes CO2 emissions could be significantly reduced by adoption of CCS or by an electrochemical process if electricity generated without fossil fuels is used. Overall however, energy consumption will increase (see section 5.4.2).
196 V. M. Fthenakis et. al, “Emissions from Photovoltaic Life Cycles”, Environ. Sci. Technol. 2008, No. 42 p 2168

ERA Technology Limited ERA Report No. 2012-0230
043122753 ENTR Lot 4 Final Report v6 303 © ERA Technology Ltd
Sector / size Improvement potential
Comments
New cement process CO2 emissions can be reduced by CCS (increased energy consumption) or by changing to magnesium based cements (see section 5.4.1)
Large steel re-heating c.10% However this depends on availability of uses for waste heat (reductions possible from various design options discussed in section 4.2.2). Stakeholders have also suggested that c.10% may be achievable.
Glass melting and processing,
10% – 20% Heat loss from glass melting is significant and improvement appears to be technically possible but significant technical issues need to be resolved (discussed in section 5.4.3)
Ceramics – large size c.10% – 20% Lower estimate from ceramics furnace manufacture but further energy reductions possible at higher cost (see Table 72).
Metal melting / foundries / scrap refining
20% – 40% Large-scale processes (smelting and melting) are energy efficient but smaller-scale have large heat losses if no heat recovery is used. Recuperative and regenerative burners can reduce energy consumption by 20% – 40%
Bread and bakery Small Research has shown that further energy savings are not currently possible and more research is needed (information from a bread manufacturer).
Medium-size furnaces and ovens – electric
c.10% Majority of medium size are electric but higher energy consumers tend to be gas/oil. Heat losses from electric heated are mainly due to quality of insulation (page 146) and presence of leaks (page 185). Much larger savings (up to 80%) are feasible for those processes where infrared or microwave heating are viable.
Medium-size furnaces and ovens – gas / oil
20% – 40% Heat losses large from hot combustion gases as heat recovery and use of recuperative and regenerative burners is very uncommon (page 157).
Laboratory ovens and furnaces
c.10% Estimate from manufacturers. Most are electric so most heat losses are through insulation and due to leaks but large losses can also occur if ventilation is poorly controlled.
There are many technology developments that can reduce energy consumption. Some can benefit most types of furnace and ovens such as improved insulation performance whereas others are specific to certain types of process only. These technologies have been described in Tasks 4 and 5 and are summarised here in the table below. Note that each option is applicable only to certain processes and estimated values are based on current average designs. The size of the energy saving achievable will be estimated in Task 6.

ERA Technology Limited ERA Report No. 2012-0230
043122753 ENTR Lot 4 Final Report v6 304 © ERA Technology Ltd
Table 129. Summary of improvement potential of eco-design options of laboratory, medium-size and large industrial furnaces and ovens
Design option Improvement potential (energy use reduction)
Comments
Laboratory Improved insulation Ovens 10%
Furnaces 5% Stakeholders estimates. Either thicker layer (unattractive to users) or lower thermal conductivity more expensive)
Improved ventilation control Estimated c.20% User dependent and suitable mainly applicable for drying processes (see page 181)
Microwave assist Varies depending on process, can be 20% – 90% so on average c.50%
Only for certain processes such as dental zirconia (see section starting page 168)
Additional door glass and infrared coating
2% – 3% (where glass doors used)
Only some ovens have glass doors (from DG ENER Lot 22 study)
Temperature control / timers Estimated c. 20% Small energy reduction by preventing too high temperature being used. Bigger benefit by automatically switching off when not in use.
Infrared heating for drying ovens
10% – 20% For drying only (from stakeholder)
Medium size industrial Improved insulation Estimates: Ovens 15%
Furnaces 10% Improvement by increased thickness and in some furnaces by use of lower thermal conductivity types. Already used in some furnaces but not suitable for all types (page 146).
Improved process control Estimated at c.10% but very variable
Process dependent
Heat exchangers for ventilation air or gas burner air
c.16% heat recovery These are used in commercial catering ovens (from DG ENER Lot 22 study)
Self-recuperative burners 20% – 30% Already available with some metal melting furnaces (page 157)
Self-regenerative burners c.40% Rare in medium-size but are used in large furnaces (page 157)
Others Similar to large (below) but not all feasible
Large size industrial Improved thermal insulation c. 3% – 5% Large furnace insulation tends to be better
than that used in smaller designs and may be specified by user. Lower thermal conductivity insulation may half insulation losses (c.3% energy saving) but suitable only for some types (page 146).
Hot air for gas burners Up to 20% Depends on hot air temperature (see Table 72).
Recuperative burners 20% – >50% Based on change from cold air burners (page 157)
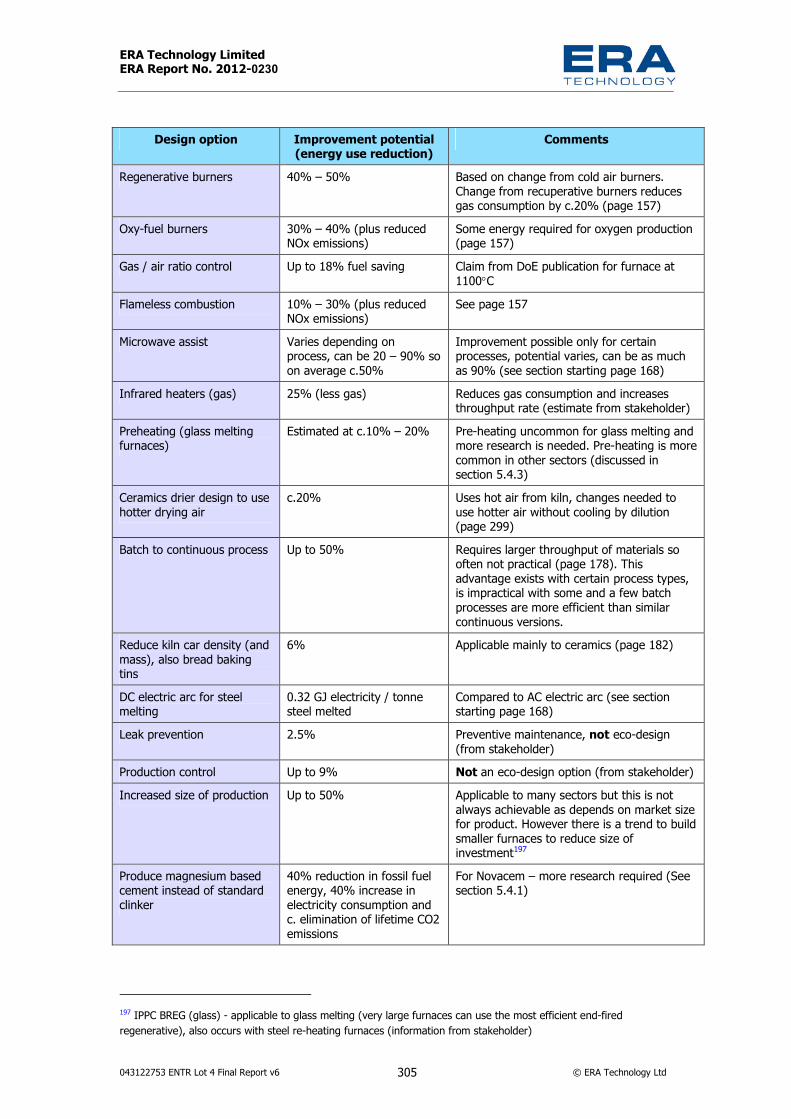
ERA Technology Limited ERA Report No. 2012-0230
043122753 ENTR Lot 4 Final Report v6 305 © ERA Technology Ltd
Design option Improvement potential (energy use reduction)
Comments
Regenerative burners 40% – 50% Based on change from cold air burners. Change from recuperative burners reduces gas consumption by c.20% (page 157)
Oxy-fuel burners 30% – 40% (plus reduced NOx emissions)
Some energy required for oxygen production (page 157)
Gas / air ratio control Up to 18% fuel saving Claim from DoE publication for furnace at 1100°C
Flameless combustion 10% – 30% (plus reduced NOx emissions)
See page 157
Microwave assist Varies depending on process, can be 20 – 90% so on average c.50%
Improvement possible only for certain processes, potential varies, can be as much as 90% (see section starting page 168)
Infrared heaters (gas) 25% (less gas) Reduces gas consumption and increases throughput rate (estimate from stakeholder)
Preheating (glass melting furnaces)
Estimated at c.10% – 20% Pre-heating uncommon for glass melting and more research is needed. Pre-heating is more common in other sectors (discussed in section 5.4.3)
Ceramics drier design to use hotter drying air
c.20% Uses hot air from kiln, changes needed to use hotter air without cooling by dilution (page 299)
Batch to continuous process Up to 50% Requires larger throughput of materials so often not practical (page 178). This advantage exists with certain process types, is impractical with some and a few batch processes are more efficient than similar continuous versions.
Reduce kiln car density (and mass), also bread baking tins
6% Applicable mainly to ceramics (page 182)
DC electric arc for steel melting
0.32 GJ electricity / tonne steel melted
Compared to AC electric arc (see section starting page 168)
Leak prevention 2.5% Preventive maintenance, not eco-design (from stakeholder)
Production control Up to 9% Not an eco-design option (from stakeholder) Increased size of production Up to 50% Applicable to many sectors but this is not
always achievable as depends on market size for product. However there is a trend to build smaller furnaces to reduce size of investment197
Produce magnesium based cement instead of standard clinker
40% reduction in fossil fuel energy, 40% increase in electricity consumption and c. elimination of lifetime CO2 emissions
For Novacem – more research required (See section 5.4.1)
197 IPPC BREG (glass) - applicable to glass melting (very large furnaces can use the most efficient end-fired regenerative), also occurs with steel re-heating furnaces (information from stakeholder)

ERA Technology Limited ERA Report No. 2012-0230
043122753 ENTR Lot 4 Final Report v6 306 © ERA Technology Ltd
It should also be pointed out that energy efficiency and CO2 emissions are not always directly related as shown below.
Very large quantities of coal are used in blast furnaces and for lime and cement production. In terms of kgCO2/MJ, CO2 emissions are greatest from coal, compared to oil and gas.
Electricity is usually obtained from national grids and is generated mainly from fossil fuels in most EU Member States with a conversion and transmission efficiency of c.30% - 40% (from fossil fuel generation). Although electrical energy efficiency for heating is usually fairly high, primary energy efficiency will be <30%. Electricity is sometimes generated on site from waste heat in very large installations but the primary energy source is usually fossil fuels.
Gas-fuelled furnaces can be very energy efficient (up to 80%) if a large proportion of heat from hot combustion gases is re-used and these processes may emit much less CO2 than an equivalent electrically-powered furnace where the electricity is generated mainly from fossil fuels, as occurs in most EU Member States. However, gas supplies in the EU are limited. This is discussed in more detail in section 5.8.
5.6. Technical constraints and barriers to improvements of environmental performance
5.6.1 Laboratory furnaces and ovens Heat loss through insulation – the size of ovens and furnaces is limited and so it is not possible to significantly increase the thickness of insulation. Ovens and furnaces are often used in fairly small rooms where it is not possible to use larger equipment. Use of lower thermal conductivity materials will give only limited improvement, especially for high temperature furnaces, because the best materials are unsuitable at very high temperature. If the thermal mass of the insulation is large and the thermal conductivity is low, the rate of heat loss will be slow and the temperature will drop slowly when heating is stopped. This is a problem where the user wants to cool parts quickly to remove them before placing more parts into a cool furnace. Very efficient insulation may not affect fast heating rates if the heat source is inside the chamber and so heats the parts directly but it will severely delay cooling which will hinder throughput and productivity. Where furnaces are used for fairly short tests, increasing insulation thermal mass increases energy consumption (see Task 6).
Heat recovery – adding heat recovery equipment to a small laboratory oven or furnace would significantly increase the size which may not be acceptable to users due to space constraints. Heat recovery equipment would significantly increase the product price which could make EU test laboratories uneconomic compared to non-EU competitors
Process control – most already have accurate temperature controllers but only a few ovens and furnaces have timers that switch off when tests are complete. Timers have the potential to reduce energy consumption but rely on users to use them. Manufacturers experience is that timers are not popular with ovens (more common with furnaces) and are rarely used.

ERA Technology Limited ERA Report No. 2012-0230
043122753 ENTR Lot 4 Final Report v6 307 © ERA Technology Ltd
Lack of information on energy consumption– It is very uncommon for there to be information available on the energy consumption of laboratory ovens and furnaces for potential customers to make a purchase decision. Responses to the first study questionnaire showed that this was a common reason why energy efficiency was not considered in purchase decisions. A few manufacturers test their products and some of this data is in this report. However, they all use in-house tests as no European Standard test method exists.
Size – laboratories are often quite small and so the space available for ovens and furnaces is quite limited. Where noxious emissions occur from processes, the ovens and furnaces may be used inside fume cupboards, which are very limited in space. Therefore it is not always possible to use a sufficient thickness of insulation to minimise heat losses without actively cooling the insulation surface, which – in turn - causes a high heat loss rate. For example, to attain a 50°C external temperature for a 1200°C furnace, the necessary 500mm thickness of insulation would double the width and height of a small furnace to a size where it would not be usable in some laboratory locations. Another constraint with very thick insulation is the very long cooling time, which could seriously delay any work which requires commencing with a cold furnace.
5.6.2 Industrial furnaces and ovens Heat loss through refractories and insulation – There are several technical reasons why better insulation may not be used including:
• Some processes are very exothermic such as steel production in a blast furnace and copper smelting from sulphide ores. It is important that this heat is removed otherwise the insulation could become so hot that it melts
• Melting glass and metal smelting involve substances that are very corrosive to most types of insulation material and so special materials are used that are chemically resistant. The thermal insulation properties are, however inferior to other types that cannot therefore be used, owing to the above-mentioned technical constraints.
• Electric arc furnaces generate extremely high temperatures and often also use corrosive fluxes. It is therefore necessary to water cool the insulation to prevent it from melting or being attacked by the fluxes that are used, or the slags that are produced.
• Short batch processes consume less energy if the insulation has a small thermal mass. If thicker insulation were to be used, this would increase energy consumption (see Task 6).
There are several types of HTIW which have low thermal conductivity and low thermal mass so they are a good choice if they can be used. However they cannot be used at above their maximum upper temperature limit or if the environment is corrosive. Some types of HTIW are used externally to other materials that are able to withstand higher temperature or corrosive materials. Microporous materials have a lower maximum temperature than several types of HTIW, can be brittle and deteriorate in use, so that the associated heat losses, although low initially, can increase significantly over time with use.

ERA Technology Limited ERA Report No. 2012-0230
043122753 ENTR Lot 4 Final Report v6 308 © ERA Technology Ltd
Electric resistance heaters use conductors that need to pass through the insulation layers, but as they are electrical conductors, they also are good heat conductors and so can cause as much heat loss as is lost through the thermal insulation of an average furnace.
Some types of process have specific design requirements that limit the choice of insulation and the most effective insulation cannot be used. These processes include:
• Glass melting furnaces – liquid glass is very corrosive to the refractory; therefore to prevent their rapid degradation of the refractories, heat is intentionally removed from the areas of the furnace in contact with liquid glass to minimise the temperature at these locations.
• Electric arc furnace melting of metals – liquid metal, fluxes and slags are very corrosive to the refractory materials and so these are water-cooled to ensure that a layer of solid material is present on the refractory surface to prevent it from rapidly degrading.
• Blast furnaces and cement kilns – both are used for at least 20 years and have steel outer shells. It is essential that condensation does not occur, as the corrosive process gases will dissolve in liquid water and will cause rapid corrosion. The outer surface therefore has to maintained at temperatures above the dew-point which is >100°C (irrespective of O2 concentration) and an actual temperature of 200°C is typically used (which would be a higher value when calculated at 3%O2).
• Induction melting furnaces – The thickness of the insulation needs to be a compromise between the need to allow RF (radio frequency) energy to pass through the insulation into the furnace and to prevent heat losses out of the furnace. If the insulation is too thick, RF energy is lost before it reaches the process material.
Cement kiln refractory materials: It is technically possible to use two layers of different materials by combining an outer layer of dense brick containing 30% - 50% Alumina outer layer in combination with an inner layer of Magnesia-Spinel bricks, which are resistant to the very aggressive cement clinker process conditions. Alumina bricks have a lower thermal conductivity (i.e., they are a better insulator) than Magnesia-Spinel bricks, but have a higher thermal conductivity (i.e., are poorer insulators) than lightweight insulating bricks. If the thermal conductivity of the outer layer is too low, such as with lightweight insulating bricks, a hot spot in the inner layer might develop which then is likely to lead to overheating and destruction of the inner layer. The lifetime of this type of lining typically tends to be significantly shorter than the lifetime of a lining without an outer dense alumina layer. Clinker product emits several corrosive gases (SO2, Chlorine, NOx) and so it is important that no part of the outer steel shell has a temperature below the dew-point to avoid condensation of corrosive acid on the steel, as referred to previously.
The use of Magnesia-Chromite refractory bricks in cement clinker production is an "old technology" and is now only used outside the EU in countries having lower standards for worker- and environmental protection. Used Magnesia-Chromite bricks must be disposed of in a special hazardous landfill due to the chromium content. Cement clinker made in kilns with these bricks contains Chromium (VI), which is classified as a category 1A carcinogen and the allowable content of Chromium (VI) in cement and cement products is restricted in the EU to less than 0,0002% by weight by the REACH Regulation 1907/2006/EC, Annex XVII. Chromite

ERA Technology Limited ERA Report No. 2012-0230
043122753 ENTR Lot 4 Final Report v6 309 © ERA Technology Ltd
bricks are used in the EU only if there is no alternative material available, which is suitable for a purpose, e.g. Alumina-Chromite bricks in rotary furnaces for waste incineration but for the production of High Alumina Cement, corundum bricks are used. These material constraints limit the options for insulating cement kilns and some other types of furnace.
Wall thickness limitation due to roller length: The thickness of furnace refractories and insulation where rollers pass through and are supported by the furnace walls is limited so that it may not be possible to increase the wall thickness because the roller cannot be lengthened. As the rollers are very hot, they have limited strength. If their length is increased they could distort. This is a potential issue with continuous reheating furnaces which treat heavy (>25 tonne) steel slabs.
Heat losses in combustion gases – where fossil fuel combustion is the source of heat, heat transfer from the hot gases to the process materials is not usually very efficient unless the gases can be passed counter-current to the raw materials such as in parallel flow regenerative lime kilns and shaft aluminium melting furnaces. Therefore heat recovery and reuse from combustion gases is necessary for high fuel efficiency. Heat recovery is common in new large furnaces but much less common in small and medium size furnaces. Until recently, recuperative burners and regenerative burners were only suitable for very large furnaces but recently designs suitable for small furnaces have been developed. Another limitation is what is done with the recovered heat:
• Hot air from heat exchangers or from air cooling product is used in gas burners to consume less gas than cold air burners
• Hot combustion gases can be used for drying and pre-heating but this has limitations. Drying is commonly needed with ceramics but is not needed with many other sectors. If heat re-use reduces fuel consumption there clearly is a benefit but often excess heat is available but there is no use for it. Excess heat can be used for heating the factory building but this is not needed in warm climates. On a larger scale it is used to generate steam or electricity but this is impractical if the amount of heat available is too small.
• Pre-heating with hot combustion gases is common in cement and ceramics production with continuous processes but continuous glass melting furnaces rarely use pre-heating (this is described elsewhere in this report). The reasons are complex but where an existing plant is refurbished, there may not be enough space to add a preheating stage. Pre-heating metal scrap before melting in an electric arc furnace is not acceptable except with clean metal because preheating dirty scrap creates very toxic substances such as dioxins that have to be destroyed in energy intensive downstream processes. Overall, less energy is used if the dirty scrap is fed directly into the melt of the electric arc furnace where there is a sufficiently high temperature to destroy the toxic substances.
The temperature of combustion gases exiting furnaces is usually above the dewpoint. For pure water this is 100°C but where there are contaminants from the process, this will be higher. For example, if sulphur dioxide is produced such as in some brick kilns and from some metal smelting processes, this gas reacts with water to make sulphuric acid so that the dewpoint is typically c.120°C. Condensed sulphuric acid is very corrosive and so the flue gas temperature is not allowed to drop below the dewpoint. The combustion gases from some processes contain much more than 3% oxygen and this is often necessary for the process as

ERA Technology Limited ERA Report No. 2012-0230
043122753 ENTR Lot 4 Final Report v6 310 © ERA Technology Ltd
a large volume of gas is needed for efficient heat transfer by convection. As a result, the minim combustion gas temperature calculated at 3% oxygen is much higher for some types of process than others. The Japan Energy Act does not specify a gas / air ratio for ceramics processes because additional air is needed to provide the gas flow required in the preheater stage.
Heat exchangers or recuperators can be of simple designs or very complex designs. The design affects the amount of heat recovered but increasing complexity also increases the price of the heat exchanger as well as the pay-back time. For example, if hot combustion gases are passed through triple loop counter-current to cold air, this will recover - for example - 20% of the available heat. Doubling the size and complexity (hence requiring 6 loops) doubles the heat exchanger cost, but will increase energy recovery to only about 30%. Therefore, pay-back time is longer. According to one stakeholder, it is financially viable to recover >45% of energy with very large furnaces, but with small furnaces, the pay-back time is too long and only 20% energy recovery is viable. With mid-size rotary melting furnaces (c.40 tonne capacity), 20% heat recovery is viable but oxy-fuel burners (without heat recovery) can also be used, and can reduce energy consumption to that of a level equivalent to 45% heat recovery. It should be noted that heat exchangers can have technical constraints, such as:
• Power and steam generation will have a low efficiency if the recovered heat is <200°C • Heat exchangers will not be installed if the recovered heat cannot be used; this aspect
depends on the user, not the furnace manufacturer. • Some furnaces and kilns have efficient pre-heaters so that exhaust gas temperature can
be as low at c.130°C. Heat recovery from gases at this temperature is not viable. • Combustion gases from some processes such as brick kilns and from metal smelters
contain acidic gases. The dewpoint of acid gases is c.130°C and so if the heat exchanger recovers heat and the exhaust is <130°C, this will cause severe corrosion to the steel parts of the exchanger and the heat exchanger will have a lifetime of 5 years or less.
Re-use of hot air or hot combustion gases – there are technical constraints that limit the ability to recover heat from combustion gases such as:
• Temperature capability – pipework and valves must be able to withstand the air or gas temperature - as the temperature increases, more expensive alloys must be used and these alloys are more difficult (and so expensive) to make. Also for safety reasons as well as with regards to energy conservation, the hot surfaces must be insulated so that the “touch temperature” of the exterior is within safe limits. This can result in very thick layers of insulation, which can be a problem where space is limited. Furnaces are usually designed to dilute hot air and gases so that they are cooled and cheaper materials can be used. This is principally a cost issue as there are usually no technical reasons why hotter gases could not be used. The only exception is where the hot gases are used for drying or pre-heating materials which would be damaged if exposed to too high a temperature.
• Entrained dust and particulates – Recuperators and regenerators use hot combustion gases to reduce fuel consumption by the use of heat exchangers. However, these will

ERA Technology Limited ERA Report No. 2012-0230
043122753 ENTR Lot 4 Final Report v6 311 © ERA Technology Ltd
become blocked if the combustion gases contain solid particulates. Solids can be removed from gases by various methods with baghouses being fairly common in which the gases are forced through fabric filters. However, as baghouses use polymer filters, the gases must first be cooled to avoid damaging the polymer and this considerably reduces the amount of heat that can be recovered. High temperature filtration is possible with several techniques being used (ceramic filters and electrostatic filters) but these need to be constructed of materials that can withstand the gas temperature and can be expensive and difficult to fabricate using special alloys if the gases are very hot. As a result, it is common for gases to be cooled by dilution with air.
• Condensable vapours from ovens – Large tunnel bakery ovens for bread, biscuits and cakes use gas or oil combustion but heating the food emits oils and greases which will collect onto heat exchangers, reducing efficiency and eventually blocking them. A similar limitation exists with electrically-heated solder reflow ovens where flux vapour is emitted from the heated solder paste and is intentionally condensed on water-cooled heat exchangers to prevent the flux from being emitted into the environment, or to block vents in the ovens.
Low energy efficiency due to small size – it is very common for large furnaces and ovens to be more energy efficient than smaller versions. Continuous processes usually produce much more product per hour than batch versions of similar processes and they are also often more energy efficient as the hot materials inside the furnace or oven (i.e. the insulation) does not need to be cooled when parts are removed. There are designs of furnace and oven, e.g. shaft melting furnaces for aluminium, which consume less energy per tonne than designs used for similar processes but on a small-scale such as crucible melting furnaces. Manufacturers however, often have little control over the scale of their production processes, as these are governed by their ability to sell the products made utilising the furnace or oven. There are other reasons, such as:
• Some large designs require tall or large buildings which may not be available. • Gas-heated continuous furnaces with long pre-heaters are very efficient as hot combustion
gases pass counter-current to incoming product which absorbs most of the heat. However this requires a sufficiently large floor area.
• Some manufacturers have limited capital and so prefer to buy several small furnaces gradually over a period of many years, thereby gradually increasing capacity rather than installing one large furnace initially.
• Large furnaces and ovens may be less flexible than several smaller ones. If sales were to significantly decrease, one of several small furnaces can be switched off but this is not an option if only one large furnace is available.
• Lost sales due to faults with equipment can be very expensive, in some sectors. For example, in the semiconductors sector, one days lost production can equate to more than the cost of one furnace. Manufacturers therefore prefer to have several smaller furnaces, so that production is not halted when one furnace needs to be repaired or is otherwise not available.

ERA Technology Limited ERA Report No. 2012-0230
043122753 ENTR Lot 4 Final Report v6 312 © ERA Technology Ltd
Gas : air ratio – The optimum gas air ratio is often controlled such that fuel is fully burned, no carbon monoxide is formed and a minimum of excess air is present. There are heat treatment processes for metals where a reducing atmosphere is essential to prevent surface oxidation and so less air is used to ensure that some carbon monoxide is produced. There is, as a result, less heat energy generated from a given quantity of burning gas (thus producing carbon monoxide) than from full combustion (which produces carbon dioxide).
The quantities in terms of mass or volume of fossil fuel and air required by a burner depend on the fuel composition. As long as the fuel composition remains constant, limiting excess air is relatively straightforward. Where oil or Liquid Petroleum Gas (LPG - a mixture of propane and butane) are supplied in tanks, no fuel composition change will occur until the next batch of fuel is used. However, the use of piped natural gas is quite common in the EU for industrial furnaces and ovens but its composition is variable. Natural gas contains mostly methane but also ethane, propane and other hydrocarbon constituents depending on its source. North Sea gas consists of mostly methane whereas liquid natural gas from the Middle East has a higher ethane content. The hydrocarbon composition affects the amount of oxygen for stoichiometric combustion and so to prevent the formation of hazardous carbon monoxide, a higher excess air content is used in case the composition changes. Gas supplies in the EU are linked via a grid, and the gas supplied at any location depends on the sources of gas being used and the demand throughout the EU. As a result, composition changes can occur unpredictably. To avoid excessive changes, EU Member States limit 198 the composition change by imposing maximum and minimum Wobbe Index values, and the EC is proposing an EU-wide range based on prescribed values of Wobbe Index199 but this is a fairly large range intended to guarantee security of supply rather than minimise energy consumption. The Wobbe Index is a measure of gross calorific value in MJ/m3 although the actual values depend on temperature and pressure. The proposed Wobbe Index range is 47 – 54 MJ/m3.which represents a range of 15%. The reactions between the two of the main natural gas constituents methane and ethane with oxygen are as shown below (with net calorific values):
CH4 + 3O2 → CO2 + 2H2O Net calorific value200 35.88MJ/m3.
C2H6 + 5O2 → 2CO2 + 3H2O Net calorific value 64.43MJ/m3.
The effect on excess oxygen gas composition is illustrated below. The values are calculated from the gas / oxygen molar ratios and the calorific values of the above chemical reactions. Molar ratios are proportional to volume rations.
Gas Stoichiometric ratio of oxygen with 1 part gas
Calculated calorific value of gas MJ/m3.
100% methane 3 parts O2 to 1 part methane 35.88 Methane with 10% ethane 3.2 parts O2. 38.66 Methane with 20% ethane 3.4 parts O2. 41.59
198 http://www.eu-gasturbine.org/resources/1/Publications/ETN_FuelPP_Final_Feb%2009.pdf 199 http://ec.europa.eu/energy/gas_electricity/gas_quality_harmonisation_en.htm 200 Values from ISO/WD 13579-1

ERA Technology Limited ERA Report No. 2012-0230
043122753 ENTR Lot 4 Final Report v6 313 © ERA Technology Ltd
The proposed 15% range in Wobbe Index of piped natural gas composition is equivalent to the difference between 100% methane and the mix: {80% methane + 20% ethane}. This change in gas composition requires a 13% increase in the amount of oxygen in order to maintain stoichiometry. Therefore, for example, if 5% excess oxygen is used with 100% methane and the gas composition changed to 80% methane + 20% ethane, there would be insufficient oxygen for full combustion unless the air flow to the burner were to be increased. Furnace operators need to adjust the gas and oxygen flow rates to provide the correct energy input to the furnace as well as to minimise excess air. This is relatively straightforward if combustion gas analysers are fitted to furnaces that have only a small number of burners. The analysers can have alarms to warn operators if there are changes outside preset limits giving a warning that adjustment is needed. However, some designs of large furnace have a large number of burners; for example, a tunnel brick kiln may have 300 or more burners. Manual adjustment of these burners to compensate for gas composition changes is practically impossible, as gas composition changes occur without warning. It is therefore necessary for the user of the furnace to utilise a higher excess air content than the optimum ratio for energy efficiency, to avoid carbon monoxide formation when composition changes occur. A higher excess air content is also used with small ovens and kilns, where the gas consumption is relatively low (thus implying that a combustion gas analyser would have too long a payback period, and is therefore not used).
There is a technical solution for large multi-burner furnaces. The gas supply can be monitored with a Wobbe Index analyser. There are two types of Wobbe Index analyser: one measures calorific value, and the second type is a gas chromatograph, which monitors composition (however, both analysers require c.20 minutes to function, and therefore seem to preclude the control of, or response to, rapid gas composition changes). The gas analysis data can be used with computer control to automatically adjust gas flow rates to each burner, but this is expensive because one flow controller is needed for each burner. The best precision is achieved with mass flow controllers which for high gas flow rates can be c.€4000 each. This means that to compensate for variations in gas composition there would be a cost of c.25% of the original furnace price, which would entail with a payback time of 10 years201. Volume flow controllers are cheaper than mass flow controllers, but flow control is more complex, as it must compensate for temperature and pressure, which also constantly fluctuate. A 10 year return on investment (ROI) would be unacceptable, and so higher excess air concentrations than are technically achievable have to be used if the gas supply Wobbe Index is not constant. Currently, it is not possible to store methane or ethane and feed this into the piped natural gas supply to compensate for changes in gas composition that will occur when sources of gas change in order to maintain a constant Wobbe index. Stakeholders claim that gas composition changes can occur very rapidly but the gas analysis time of 20 minutes is too long. As a result, significant changes in Wobbe index can occur before the gas composition can be adjusted and this could create a temporary hazardous situation. The stock of the gases needed for large-scale processes would need to be huge and this would pose a serious safety hazard.
Insulation for short cycle batch processes - Limiting wall temperature or heat loss via prescribing W/m2 limits may not be appropriate for short process-time batch processes, 201 300 mass flow controllers at €4000 each, plus gas chromatograph (€20,000) plus computer controller etc.

ERA Technology Limited ERA Report No. 2012-0230
043122753 ENTR Lot 4 Final Report v6 314 © ERA Technology Ltd
because increasing insulation thickness to reduce external surface temperature can result in higher energy consumption. The above limitation has been stated by several furnace manufacturers. This is demonstrated below by calculating the effect of increasing the thickness of insulation of two batch processes, one based on BC2 (gas-fired) and BC4 (also gas-fired). Two calculation methods have been used; however, note that both “Method 1” and “Method 2” make several assumptions, and therefore will not be totally accurate. They do, however, illustrate the conclusion that increasing insulation thickness of short process time batch processes may increase energy consumption.
Method 1:
Assumptions: Specific heat capacity of thermal insulation is typically 1.2kJ/kg/°C, initial mass of insulation used = mass of “miscellaneous” from report Table 86. Improved insulation is double thickness and mass, heating insulation is 80% efficient, process times of 5, 10, 24 and 48 hours are considered and doubling the insulation’s thickness has the effect of reducing the percentage of input heat from 20% to 10%. 10% to 5% or 5% to 2.5%. The results are shown graphically in Figure 29 below.
-400
-200
0
200
400
600
800
0 10 20 30 40 50
Batch process time (hours)
Savin
g/inc
reas
eine
nerg
yco
nsum
ption Series1
Series2Series3Series4Series5Series6
Figure 29. Energy consumption saving (or loss) from thicker insulation Series 1 – 3 are for BC2 (ovens) and series 4 – 6 are for BC4 (furnaces). Series 1 and 4 are for decreases from 5% to 2.5% losses and series 3 and 6 are for the larger percentage saving from 20% to 10% heat losses. Clearly from this indicative calculation, increasing insulation thickness for BC4 with short batch times results in increases in energy consumption. For BC2 (ovens), there is a small increase in energy consumption only with series 1 and the 5 hour process time. Clearly for intermediate temperatures between BC2 and BC 4, there will be intermediate results. The results of this estimation are inevitably very approximate because heat transfer rates and thermal conductivity are not taken into account. Method 2 below may be more accurate.

ERA Technology Limited ERA Report No. 2012-0230
043122753 ENTR Lot 4 Final Report v6 315 © ERA Technology Ltd
Method 2:
This method uses the equations used to calculate the heat losses H2 and H3 in section 0.3.
H2 = m.Tm.Cp
H3 = λ∆T(A/d)t
H2 is the heat supplied to the insulation and H3 is the heat lost to the exterior of the furnace or oven through the insulation.
Assumptions:
Variable BC2 (interior = 250C)
BC2 double thickness
BC4 (interior = 1000C)
BC4 double thickness
M (mass kg of insulation)
228 456 802 1604
Tm (Mean temperature of insulation)
105 (external surface = 60C)
100 (external surface = 50C)
465 (external surface = 90C)
495 (external surface = 70C)
Cp (Specific heat capacity, kJ/kg/°C)
1.2
λ (thermal conductivity of insulation, W/mK)
0.1
∆T (Difference in temperature between outer and inner surfaces)
210° (external surface = 60C)
200° (external surface = 50C)
930° (external surface = 90C)
990° (external surface = 70C)
A (Area of insulation surface, m2)
38.4m2. Calculated from sizes in Table 85
42m2. Calculated from sizes in Table 85
D (Thickness of insulation, m)
0.1 0.2 0.2 0.4
T (Process time, hours)
5, 10, 24 or 48 hours
Assuming constant heat input values used for BC2 and BC4 (gas) of 40kWh/h and 152 kWh/h (from Table 88), the difference in total energy consumption due to H2 and H3 are (Heat input to process material H1 assumed to be the constant):
Process Time (hours)
5 10 24 48
BC2 Saving of 8.5kWh Saving of 25.8kWh
Saving of 74.2kWh
Saving of 218.6kWh
BC4 Increase in consumption of 97.6 kWh
Increase in consumption of 50.9 kWh
Saving of 79.9kWh
Saving of 304.2kWh
These results show that for process times of c.10 hours and shorter, increasing the thickness of insulation of furnaces operating at 1000°C will consume more energy. Processes at 250°C
ERA Technology Limited ERA Report No. 2012-0230
043122753 ENTR Lot 4 Final Report v6 316 © ERA Technology Ltd
will benefit from increased insulation thickness although this may not be true for process times that are much less than 5 hours. At intermediate temperatures, there may not be a benefit from increasing insulation thickness for short batch processes.
It may be concluded that Method 1 and Method 2 give similar results although Method 2 is probably more accurate.
5.6.3 Financial reasons for lack of investment Limits on capital for investment – the first study questionnaire asked stakeholders what were the main barriers to investing in more energy efficient processes. The most common survey response was that there was a lack of capital available for investment. Many manufacturers rely on maximum payback periods as decisions for investment, with 2-year limits being fairly common. However, in practice, this is not the reason for the lack of investments. All manufacturers are able to borrow money from banks or may have money available from profits to invest, but the total amount will always be limited. The first priority for investment is where safety equipment is needed. The next priority is to replace defective equipment. What is left can then be invested but manufacturers will have a variety of options which they could select, and inevitably will choose the one that appears likely to give the best return on investment. More efficient furnace designs will be only one of several choices. Manufacturers could for example:
• Buy a new company to broaden their product range or geographic area. • Invest in equipment other than furnaces or ovens. This investment may reduce their
energy consumption more than by spending the same money on a furnace replacement or furnace improvement.
• Decide to invest in energy efficiency improvements to furnaces or ovens, but the amount of money available may not be sufficient to achieve the maximum savings that are technically possible (i.e. BAT), since their aim is to maximise their return on investment.
The production processes that use furnaces and ovens self-evidently make products that the manufacturer wants to sell. Investment in new plant is a risk, because it is not possible to guarantee that the products from the process will continue to be sold at the same or higher prices for the expected life of the production plant. Sales, prices or both may decrease in the future, due to competition, recessions, reduced demand by customers as “fashions” change, etc. and so most manufacturers will want to minimise this risk by limiting the size of the capital investment, even though the predicted life cycle costs would be lower with a higher level of investment, assuming no reduction in sales.
Other reasons for not investing
Companies do not invest in new equipment for many reasons, which include the following of which many have been found to occur in many companies world-wide202:
202 Industrial Development Report 2011, Industrial energy efficiency for sustainable wealth creation. UN Industrial Development Organization http://issuu.com/unido/docs/unido_full_report_ebook?mode=a_p
ERA Technology Limited ERA Report No. 2012-0230
043122753 ENTR Lot 4 Final Report v6 317 © ERA Technology Ltd
• Lack of information about energy efficiency of standard design furnaces and ovens - this is applicable mainly to smaller size furnaces and ovens. Good data is usually available for large size.
• Lack of expertise of energy-efficient design technology by employees. Often employees will not be aware of energy efficient technologies or may not have the necessary technical knowledge. Training would help to overcome this limitation.
• Employees are not encouraged to pursue investment in energy savings. This is often related to the way that different departments in a business are funded. Those responsible for investment may not be those that operate the equipment. It is common that the department that makes the decision to invest in energy-efficient designs will not receive the benefit from the accrued energy savings, which will instead be shared with other departments. This often reduces employees’ incentives to pursue investment.
• Unwillingness to invest in new “unproven” technology. There is often a perception that this could prove to be unreliable causing expensive stoppages to production or not giving the expected performance. This can be overcome by national governments and/ or EU-funded demonstration projects, to eliminate technical problems and prove that the technology can be reliable.
• Staff may be too busy to look for, and then bid for new equipment. Managers are usually busy and hence have time only to make decisions relating to the largest costs to their businesses. They will consider energy efficiency measures if energy costs are a significant proportion of production costs but this is less likely if energy costs are a small proportion. Energy cost reduction is a high priority for products such as cement, glass and bricks because energy costs are 20% – 40% of production costs but bread bakery ovens rarely have heat exchangers to reduce energy consumption because energy costs are a small proportion of production costs. Preparation of capital investment requests is time-consuming and so methods are used to assist the process. It is common for smaller projects to be assessed mainly on payback period with a limit of 2 – 3 years (sometimes less). Larger projects are assessed on ROI, which should be at least 15%, and the payback period is therefore not relevant.
• Some financial institutions lack the technical expertise needed to decide whether to invest in high-technology or energy efficient technologies. Companies can insure against failure of energy efficiency investments, but costs are very high because the insurers often also do not have the necessary suitable technical expertise.
• There is a disincentive against investments with longer payback times if there is no certainty that the business will not survive, long term
• Future interest rates are uncertain, and ROI depends on these. ROI also depends on energy prices and the costs of the EU Emissions Trading Scheme (ETS), if applicable, and these are also uncertain.
• Capital markets may react adversely to increased borrowings by the organisation concerned.
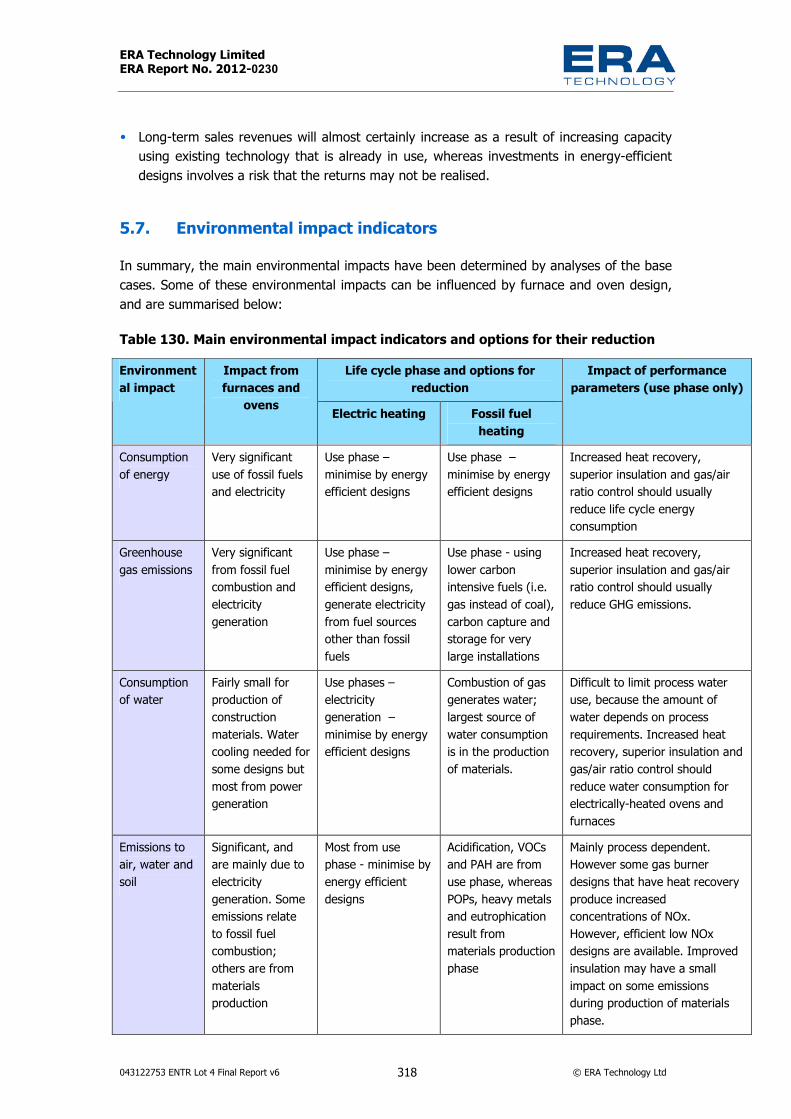
ERA Technology Limited ERA Report No. 2012-0230
043122753 ENTR Lot 4 Final Report v6 318 © ERA Technology Ltd
• Long-term sales revenues will almost certainly increase as a result of increasing capacity using existing technology that is already in use, whereas investments in energy-efficient designs involves a risk that the returns may not be realised.
5.7. Environmental impact indicators In summary, the main environmental impacts have been determined by analyses of the base cases. Some of these environmental impacts can be influenced by furnace and oven design, and are summarised below:
Table 130. Main environmental impact indicators and options for their reduction Life cycle phase and options for
reduction Environmental impact
Impact from furnaces and
ovens Electric heating Fossil fuel heating
Impact of performance parameters (use phase only)
Consumption of energy
Very significant use of fossil fuels and electricity
Use phase – minimise by energy efficient designs
Use phase – minimise by energy efficient designs
Increased heat recovery, superior insulation and gas/air ratio control should usually reduce life cycle energy consumption
Greenhouse gas emissions
Very significant from fossil fuel combustion and electricity generation
Use phase – minimise by energy efficient designs, generate electricity from fuel sources other than fossil fuels
Use phase - using lower carbon intensive fuels (i.e. gas instead of coal), carbon capture and storage for very large installations
Increased heat recovery, superior insulation and gas/air ratio control should usually reduce GHG emissions.
Consumption of water
Fairly small for production of construction materials. Water cooling needed for some designs but most from power generation
Use phases – electricity generation – minimise by energy efficient designs
Combustion of gas generates water; largest source of water consumption is in the production of materials.
Difficult to limit process water use, because the amount of water depends on process requirements. Increased heat recovery, superior insulation and gas/air ratio control should reduce water consumption for electrically-heated ovens and furnaces
Emissions to air, water and soil
Significant, and are mainly due to electricity generation. Some emissions relate to fossil fuel combustion; others are from materials production
Most from use phase - minimise by energy efficient designs
Acidification, VOCs and PAH are from use phase, whereas POPs, heavy metals and eutrophication result from materials production phase
Mainly process dependent. However some gas burner designs that have heat recovery produce increased concentrations of NOx. However, efficient low NOx designs are available. Improved insulation may have a small impact on some emissions during production of materials phase.
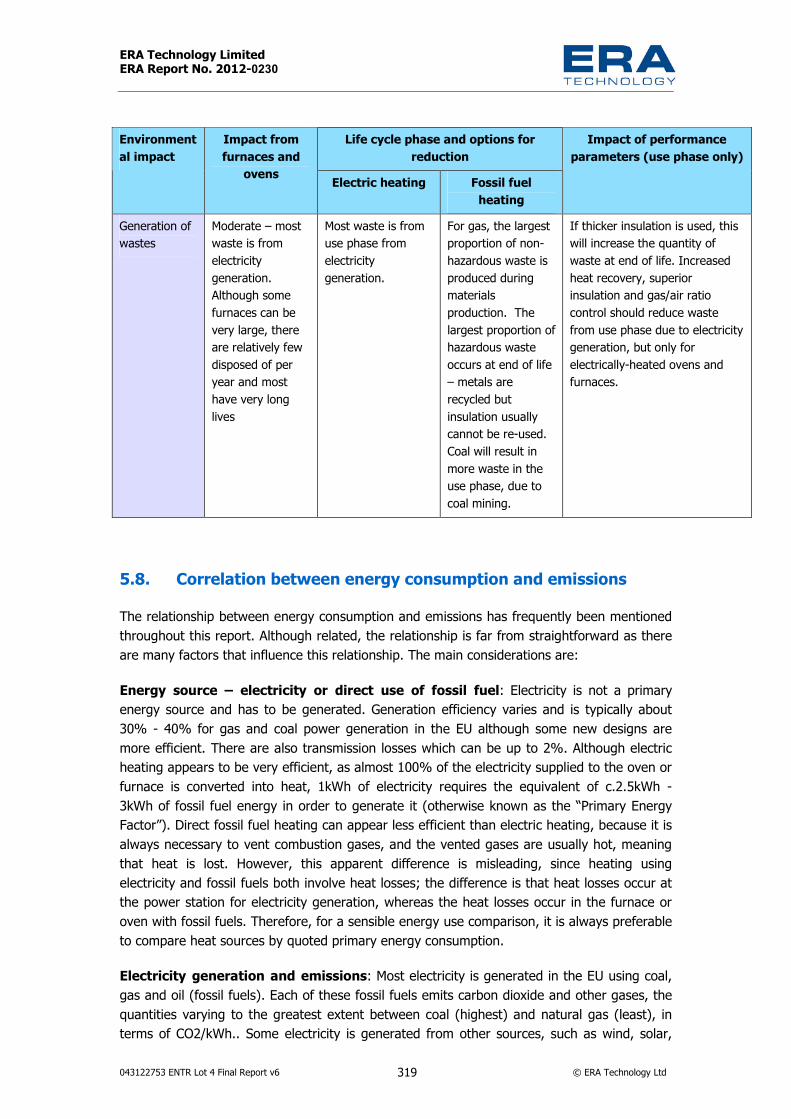
ERA Technology Limited ERA Report No. 2012-0230
043122753 ENTR Lot 4 Final Report v6 319 © ERA Technology Ltd
Life cycle phase and options for reduction
Environmental impact
Impact from furnaces and
ovens Electric heating Fossil fuel heating
Impact of performance parameters (use phase only)
Generation of wastes
Moderate – most waste is from electricity generation. Although some furnaces can be very large, there are relatively few disposed of per year and most have very long lives
Most waste is from use phase from electricity generation.
For gas, the largest proportion of non-hazardous waste is produced during materials production. The largest proportion of hazardous waste occurs at end of life – metals are recycled but insulation usually cannot be re-used. Coal will result in more waste in the use phase, due to coal mining.
If thicker insulation is used, this will increase the quantity of waste at end of life. Increased heat recovery, superior insulation and gas/air ratio control should reduce waste from use phase due to electricity generation, but only for electrically-heated ovens and furnaces.
5.8. Correlation between energy consumption and emissions The relationship between energy consumption and emissions has frequently been mentioned throughout this report. Although related, the relationship is far from straightforward as there are many factors that influence this relationship. The main considerations are:
Energy source – electricity or direct use of fossil fuel: Electricity is not a primary energy source and has to be generated. Generation efficiency varies and is typically about 30% - 40% for gas and coal power generation in the EU although some new designs are more efficient. There are also transmission losses which can be up to 2%. Although electric heating appears to be very efficient, as almost 100% of the electricity supplied to the oven or furnace is converted into heat, 1kWh of electricity requires the equivalent of c.2.5kWh - 3kWh of fossil fuel energy in order to generate it (otherwise known as the “Primary Energy Factor”). Direct fossil fuel heating can appear less efficient than electric heating, because it is always necessary to vent combustion gases, and the vented gases are usually hot, meaning that heat is lost. However, this apparent difference is misleading, since heating using electricity and fossil fuels both involve heat losses; the difference is that heat losses occur at the power station for electricity generation, whereas the heat losses occur in the furnace or oven with fossil fuels. Therefore, for a sensible energy use comparison, it is always preferable to compare heat sources by quoted primary energy consumption.
Electricity generation and emissions: Most electricity is generated in the EU using coal, gas and oil (fossil fuels). Each of these fossil fuels emits carbon dioxide and other gases, the quantities varying to the greatest extent between coal (highest) and natural gas (least), in terms of CO2/kWh.. Some electricity is generated from other sources, such as wind, solar,
ERA Technology Limited ERA Report No. 2012-0230
043122753 ENTR Lot 4 Final Report v6 320 © ERA Technology Ltd
hydro and nuclear, and therefore the kgCO2/kWh electricity figure varies considerably between EU Member States. Electricity is exported across borders to an extent, but it would not be correct to say that the kgCO2/kWh figure is equal across the EU. Some large installations, such as steel plant and cement works, generate their own electricity onsite, and therefore the onsite specific kgCO2/kWh figure will be quite different to national or EU figures. In most onsite generation cases, solely fossil fuels are used, although some wastes are also used as fuels. Modern fossil fuel electricity generators are more efficient than older installations. The mix of generation sources varies across the EU with most be hydroelectric in Norway, about 50% nuclear in France but there is a high proportion of fossil fuel used in many other States. In the future, the mix of sources will change so that the EU-wide conversion ratio for primary energy to electrical energy will decrease, possibly eventually to close to 1.0. However, the rate of change across the EU is slow. Germany recently decided to abandon nuclear (which is fossil-fuel free) electricity which could delay their ability to reduce the conversion ratio. Eco-design policy needs to based on actual GHG emissions and so needs to use the conversion ratio that will exist during the period that the policy operates and until 2025 or even 2030, it seems highly unlikely that the ratio will decrease significantly below 2.5 as an average EU figure unless the rate that changes are made to EU electricity generation is significantly accelerated and this will require very significant investment. If fossil fuel powered furnaces are converted to use electricity, this will require quite a large increase in EU generating capacity beyond current levels.
Fossil fuel combustion: This is a primary heat source but different fuels emit different amounts of CO2 (see Table 70) although heat transfer efficiency from coal and some oil flames can be better than from less luminous gas flames. The choice of fossil fuel type is complex and is based on process requirements and cost. Blast furnaces and some metal smelting processes must use coal or coke as the reductant. Coal is widely available in the EU, whereas natural gas supply is mostly imported and supplies are limited. Coal is cheaper than oil or natural gas, but is an option only in very large-scale processes as equipment to handle coal, as a fuel is expensive. The lower cost of coal should, however be offset by the EU energy trading scheme (ETS) which imposes a price on CO2 emissions. As GHG emissions are inevitable if fossil fuels are used, the only way to reduce GHG emissions is via:
• Efficiency improvements – as described in this report. • Switching from high carbon-content fuels, such as coal, to lower carbon-content fuels,
such as natural gas. This may not always be possible, as coal is used in smelting processes as a reducing agent, for example (as previously referred to).
• By changing the process to electricity generated from fossil fuel-free sources. However, this may not be currently possible for many processes (cement production, steel production, etc.) and it may be much more expensive, e.g., if used for large-scale glass melting
• Use more bio-fuels and waste – limited by availability of sustainable fuels. In practice this may not be a viable option, as significant increases in the use of biofuels may have considerable effects on food production, and food markets.
• By carbon capture and storage (CCS – as discussed below).

ERA Technology Limited ERA Report No. 2012-0230
043122753 ENTR Lot 4 Final Report v6 321 © ERA Technology Ltd
CCS: Research is being carried out on carbon capture and storage (CCS), as a method of reducing carbon dioxide emissions. This process will increase total energy consumption overall, because the same amount of fuel is needed to generate the heat required for the process but in addition, energy is required to capture and store carbon dioxide. One option is to use oxy-fuel combustion to avoid diluting the carbon dioxide to make capture easier. Where ox-fuel combustion is used, additional energy is needed to generate the oxygen gas used for the oxy-fuel burners although this may be more than offset by increased energy efficiency of oxy-fuel burners compared to standard cold air burners (the efficiencies of oxy-fuel and regenerative burners are however fairly similar). CCS related research is not expected to result in viable commercial-scale processes for at least ten years. As CCS will be very expensive to install, industry is not investing significant amounts into this technology and is expecting governments to fund this whereas EU Governments believe that industry should fund research. As a result, progress is slow.
Other emissions: apart from carbon dioxide, other gases and pollutants may be created by combustion of fossil fuels. Where these fossil fuels are used to generate electricity, the emission of pollutant gases is relatively low due to the stringent controls on power stations, as well as owing to the economies of scale applied to pollutant capture. Fossil fuel combustion for heating furnaces depends on the type of fuel. Natural gas combustion is usually a very clean process, so the only pollutants may be nitrogen oxides, which depends on the type of burner used (described elsewhere in this report). There are many types of oil used and the quantity of pollutants depends on how well refined these oils are. Coal usually emits the largest amounts of pollutants per given energy input, although the amount varies considerably; e.g. fine particulate material, sulphur compounds, etc. However, coal is a viable fuel only for very large installations and these emissions are regulated by IPPC / IED and the relevant IPPC BREFs require scrubbing/ other emission cleaning technologies to be used.
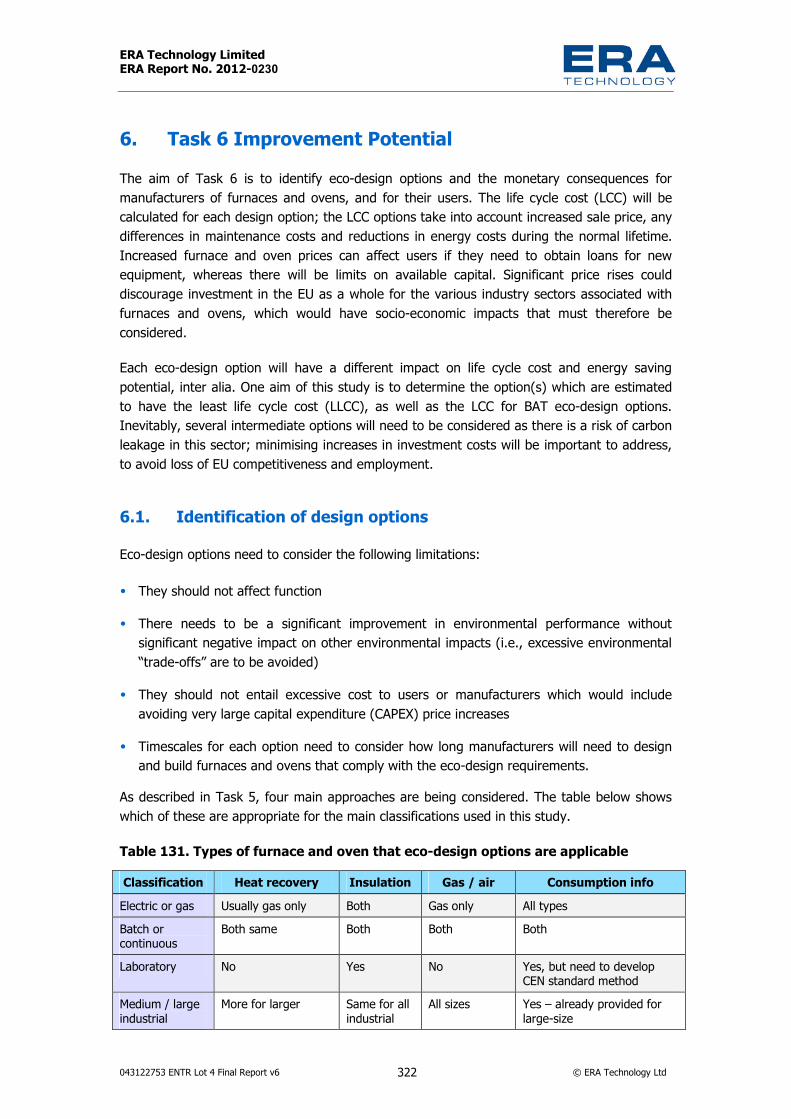
ERA Technology Limited ERA Report No. 2012-0230
043122753 ENTR Lot 4 Final Report v6 322 © ERA Technology Ltd
6. Task 6 Improvement Potential The aim of Task 6 is to identify eco-design options and the monetary consequences for manufacturers of furnaces and ovens, and for their users. The life cycle cost (LCC) will be calculated for each design option; the LCC options take into account increased sale price, any differences in maintenance costs and reductions in energy costs during the normal lifetime. Increased furnace and oven prices can affect users if they need to obtain loans for new equipment, whereas there will be limits on available capital. Significant price rises could discourage investment in the EU as a whole for the various industry sectors associated with furnaces and ovens, which would have socio-economic impacts that must therefore be considered.
Each eco-design option will have a different impact on life cycle cost and energy saving potential, inter alia. One aim of this study is to determine the option(s) which are estimated to have the least life cycle cost (LLCC), as well as the LCC for BAT eco-design options. Inevitably, several intermediate options will need to be considered as there is a risk of carbon leakage in this sector; minimising increases in investment costs will be important to address, to avoid loss of EU competitiveness and employment.
6.1. Identification of design options Eco-design options need to consider the following limitations:
• They should not affect function • There needs to be a significant improvement in environmental performance without
significant negative impact on other environmental impacts (i.e., excessive environmental “trade-offs” are to be avoided)
• They should not entail excessive cost to users or manufacturers which would include avoiding very large capital expenditure (CAPEX) price increases
• Timescales for each option need to consider how long manufacturers will need to design and build furnaces and ovens that comply with the eco-design requirements.
As described in Task 5, four main approaches are being considered. The table below shows which of these are appropriate for the main classifications used in this study.
Table 131. Types of furnace and oven that eco-design options are applicable Classification Heat recovery Insulation Gas / air Consumption info Electric or gas Usually gas only Both Gas only All types Batch or continuous
Both same Both Both Both
Laboratory No Yes No Yes, but need to develop CEN standard method
Medium / large industrial
More for larger Same for all industrial
All sizes Yes – already provided for large-size

ERA Technology Limited ERA Report No. 2012-0230
043122753 ENTR Lot 4 Final Report v6 323 © ERA Technology Ltd
Classification Heat recovery Insulation Gas / air Consumption info Oven / furnace Both but more with
higher temperature Both Furnaces and
indirect ovens Both
In addition to “gas” as fuel, other fossil fuels may be considered such as all types of gas and liquid fuels and possibly coal.
In Task 5, performance parameter data was obtained from stakeholders and from this, potential energy savings were calculated. The main conclusions were:
• Heat reuse – largest potential energy reduction of >10% but for fossil fuel only. The method of calculating “heat recovery” will need to be defined. This is suitable only for fossil fuel processes. Heat recovery is theoretically possible with some electrically heated furnaces but is uneconomic with extremely long payback times.
• Improved insulation – could be significant but mainly for continuous processes, at energy saving levels of 1% – 5% but can increase consumption with short batch processes. Use of maximum temperature may be more difficult to enforce than heat loss as W/m2 as discussed below.
• Gas / air ratio – small saving achievable, possibly in the region of 1% – 2%, for fossil fuel only, and solely for high temperature processes and indirect-fired ovens
• Water cooling – unclear, very little data. Used either for processes with high energy costs so there is an incentive to minimise (and to recover heat), or for functional reasons (e.g. fast cooling), so the improvement potential is not large. Probably offers no significant potential, as the largest heat losses occur with very large-scale processes, where it should be more or less automatic that the significant energy costs encourage energy savings to be.
• Ventilation control – no data but likely to be improvement with small / medium size processes where energy cost is not significant (based on R&D by one stakeholder, vents are essential). Impossible to regulate quantitatively. Could require small & medium multipurpose ovens/ furnaces to have user controllable vents – unless inappropriate
• Drying efficiency – may need to consider as part of the measure for drying processes, as there are several designs that are not ovens (e.g. belt driers). c.5% of small/ medium size used for drying and <5% of large size, therefore the energy consumption is 50TWh. The derived energy saving would be 5 – 10 TWh, if the saving potential is 10% – 20%. Difficult to regulate but could, for example impose maximum kJ/kg water evaporated (from solids with >10% water content because at low water content, a significant proportion of the total heat consumed is used raising the temperature of the solids being dried).
• Others - process specific (described in Task 4 of report), see table below:

ERA Technology Limited ERA Report No. 2012-0230
043122753 ENTR Lot 4 Final Report v6 324 © ERA Technology Ltd
Table 132. Suitability of other design options Option Suitable for Comments
Thermal mass of kiln furniture, supports, tins, etc
Ceramics (bricks, roof tiles), food (bread)
Affects small % of processes, difficult to legislate
Maintenance – more frequent and comprehensive
All industrial processes >2.5% saving from elimination of leaks. More frequent repairs to insulation and refractory materials
Not eco-design but significant impact. Adds costs but saves energy
Use of microwave or infrared heating
Drying, curing, certain types of ceramics (dental implants, etc.). A limited range of processes.
Only suitable for certain processes but benefit large where applicable. Users may adopt if offered free independent expert advice (as in USA & Canada)
Process design & scheduling
Some processes. Improvement potential where skill levels inadequate. May benefit from independent expert advice
More precise process control
Many processes but benefit very variable
Impossible to legislate. May benefit from independent expert advice
Unlike consumer and many types of standard design commercial equipment, industrial users often have the option of building new installations outside the EU to avoid the additional costs incurred as a result of EU legislation such as ETS as well as higher labour costs, etc. Therefore, large price increases and long payback times would be unacceptable to some users.
Some eco-design options may be technically viable for all sizes of furnace and oven but the additional equipment required can be a larger proportion of the price of small new furnaces and ovens than for large-sizes. Therefore an additional requirement for Task 6 will be to determine the minimum size that eco-design options do not detrimentally affect costs to users and manufacturer’s competitiveness.
Different approaches are considered for laboratory (BC1) and industrial (BC2 - BC7) base cases, as follows:
6.1.1 BC1: Laboratory oven/ furnace eco-design options The eco-design requirement being considered is a minimum energy performance standard based on an EN standard energy consumption measurement test method. This measurement method will need to be developed before enough products can be tested and compared to determine the level of the minimum performance value which could aim to eliminate the worst performing 10% – 20% of models from the EU market. It is not possible to set this limit without a standard test method, together with data from a reasonable cross-section of products on the EU market. There is currently no way of comparing ovens produced by different manufacturers.
There could also be information requirements to provide information to users of the energy performance in order to help them to choose the most energy efficient design and also to act as an incentive to oven manufacturers to reduce energy consumption. The eco-design study of domestic ovens for cooking (Lot 22) found that the electric oven energy label did act as an
ERA Technology Limited ERA Report No. 2012-0230
043122753 ENTR Lot 4 Final Report v6 325 © ERA Technology Ltd
incentive to improve eco-design and as a result, average energy consumption has decreased. The first ENTR Lot 4 study questionnaire found that information on energy consumption is not readily available to users so they cannot select the best performing products. Information provided to prospective users could include:
• Explanation of the test method used to measure energy consumption • Test results (this could be as kWh or as a rating such as A – G) • Explanation of how to use the equipment to minimise energy consumption, i.e. control of
vents, use of timers to automatically switch off, etc. • Power rating, energy consumed (in kWh/h) to maintain the empty oven or furnace at a
temperature of 100°C below its maximum rated temperature, etc. Marketing information from manufacturer for their BAT ovens indicates that energy consumption can be 20% – 30% lower than for other ovens. Marketing claims tend to be optimistic, and this may be a larger than comparative average energy use, for BAT ovens used in the same conditions. Therefore, it may be applicable only if automatic power-down and automatic vent control are used in the BAT version. Tests by one manufacturer has found that a BAT design of BC1 consumed 40% less energy at 150°C, and 27% less energy at c.300°C, than an older equivalent type of oven that is representative of laboratory ovens on the EU market. These tests were carried out with ovens in continuous use and the saving could be different with short cycle times, although semi-continuous use is common with laboratory ovens. The BAT oven price is c.10% higher than the BC1 price.
The total estimated EU energy consumption of laboratory furnaces is smaller than laboratory ovens and a different measurement method and eco-design requirement would be needed. As potential energy savings are relatively small, the use of a standard energy measurement test method and information provision could be voluntary although there is a risk that some manufacturers may not provide accurate information to users.
Energy consumption measurement method.
Laboratory oven and furnace energy consumption measurement methods should ideally be defined by an EU harmonised standard; oven and furnace manufacturers will have the required expertise to define the test procedure. However the method must take into account the following:
1. Realistic use conditions of ovens or furnaces need to be used. Different procedures would be needed for ovens than for furnaces as the two equipment types are used in quite different ways. Based on information from manufacturers:
• Laboratory ovens are used either continuously at a fixed temperature or are used periodically. Temperatures used vary but c.120°C is common for drying and they may also be used at temperatures close to the maximum set temperature which is most frequently 250 – 350°C.

ERA Technology Limited ERA Report No. 2012-0230
043122753 ENTR Lot 4 Final Report v6 326 © ERA Technology Ltd
• Laboratory furnaces are used intermittently to heat up parts and materials and then cool down. They can be used at any temperature at which they are capable and common maximum values of laboratory furnaces are 1000°C, 1200°C, 1600°C and 1800°C
The test temperature selected could be 150°C (commonly used for drying) or 250°C which the majority of laboratory ovens can achieve. Comparative tests by one oven manufacturer that are described above showed a larger difference between the base case design and the BAT design when tested at 150°C than at 300°C which suggests that 150°C may be the optimum oven test temperature.
2. The test method needs to use a realistic load. The size/ thermal mass will need to be dependent on cavity size. The approach being proposed for commercial ovens for cooking203 is to use a number of ceramic bricks where the number used is proportional to the cavity volume. Ceramic bricks are stable and their thermal properties will be constant so these would be a good choice. Porous ceramic “Hipor” wet bricks are used for the domestic electric oven energy consumption test method and may be ideally suited for laboratory ovens as these are often used for drying. However, dry bricks may be more appropriate if ovens are set at 250°C and it should be noted that different ceramic materials will be needed for furnaces. These must be stable and not melt during the test.
3. To enable users to compare the performance of laboratory ovens and furnaces, their performance should be rated independently of cavity volume such as by an “energy efficiency index” (EEI) as is being proposed for Lot 22 for ovens for cooking.
4. The test method will require a heat-up phase to reach the pre-defined temperature (i.e. 150°C for ovens), a period of time holding the set temperature (e.g. 4 hours for ovens) and then a phase during which the equipment cools down to ambient temperature. The total energy consumed for these three cycles would be quoted on marketing literature and used to calculate EEI.
6.1.2 BC 2 – 7 Industrial furnaces and ovens In this study, the improvement potentials (reduction in energy consumption) are calculated from performance parameters provided by stakeholders and the proportion of the total energy input that is lost by the applicable route (see Table 115 for examples). For a hypothetical example:
From 100% of energy input, 10% may be lost through insulation, 40% lost in vented combustion gases and 50% used by the process. If 50% of the energy lost in vented combustion gases can be recovered and re-used, there could be a potential energy saving of 20%. In this example, the eco-design option is to impose a minimum of 50% heat recovery from combustion gases which will achieve in this example, in theory, a reduction in energy consumption of 20%.
203 Oven performance measurement method given in Commission Working Document on possible Ecodesign Requirements for domestic and commercial ovens, hobs, grills and domestic range hoods, April 2012

ERA Technology Limited ERA Report No. 2012-0230
043122753 ENTR Lot 4 Final Report v6 327 © ERA Technology Ltd
Eco-design options for reducing energy consumption based on each of the main performance parameters that were described in Task 5 are discussed here.
Increased heat recovery and reuse (fossil fuel burners only) Heat recovery can be achieved by at least four methods and each of these methods will reduce energy consumption. Some of these methods are unsuitable for some processes due to technical constraints.
• Recuperative / regenerative burners are claimed to be able to reduce energy consumption by c.20% to over 50%, depending on the complexity of design and flue gas temperature. Percent heat recoverable depends on combustion gas temperature and size of regenerators or recuperators which are essentially types of heat exchanger. Recuperators can recover 20% – 50% of heat whereas regenerators can save up to 85% of heat although the maximum value is process-dependent.
• Heat exchangers are used to recover heat from combustion gases or from hot contaminated gases to make clean, dry hot air that can be used as hot air for burners, as secondary hot air entering ovens, or used elsewhere. Heat exchangers can recover over 50% of combustion gas heat if no other heat recovery method is additionally used. The percentage heat recoverable depends on combustion gas temperature and on the size and design of heat exchanger.
• Pre-heating feedstock (usually within continuous furnace processes, but can also be used separately for batch processes). The percentage of heat re-used depends on the process temperature and the % of input heat adsorbed by the product. Pre-heating is commonly used, for example in continuous ceramics kilns and continuous metal reheating furnaces.
• Recovery of heat from hot product, which is used, for example with cement kilns, to recover heat from hot clinker and in brick kilns as a result of rapidly cooling hot bricks which produces air at up to 500°C (which can be used for hot air burners and in drying ovens).
There are several ways that heat recovery could be measured. Heat recovery can be estimated from the temperature of the flue gas (calculated, for consistency at 3% oxygen) but this will not give an accurate heat recovery percentage. In Japan, the percentage heat recovery is determined using the equation described in Task 1 and is quoted as a percentage of the energy in combustion gases as they leave the main combustion chamber. The Japanese legislation uses combustion gas temperature only as an indication of heat recovery. There are, however several ways that “heat recovery” can be defined as an eco-design option.
• From the difference in temperature between combustion gases leaving the main furnace chamber and the entrance to the chimney
• The difference in heat energy before and after heat exchangers (recuperators, regenerators, etc). This difference may not be the same as heat recovered and reused, as

ERA Technology Limited ERA Report No. 2012-0230
043122753 ENTR Lot 4 Final Report v6 328 © ERA Technology Ltd
there are usually losses between heat exchanger output and where recovered heat is used (c.5% – 10%).
• Total of all re-used heat, compared to total input heat. This would include heat recovered from hot product which is suitable for processes where moderately fast cooling is needed and forced air cooling is used (bricks, cement clinker, etc.). This would also include heat recovered by pre-heaters when these can be used. This definition is different to the one used in Japan which only includes heat recovered from combustion gases but heat recovery from hot product is beneficial where this is technically possible and therefore should be encouraged.
Performance parameter data provided by stakeholders in section 5.3 shows that a single eco-design option value is unsuitable for all types of furnace and oven processes and this is due to technical constraints of some processes, as describe in section 5.6. These data indicates that there is large variation in the percentage of heat recovered by some types of process and there are also differences between process types. There are differences between large and small furnaces and ovens, although this is at least partly due to the cost of heat recovery equipment. The Japanese Energy Act imposes heat recovery values that depend on process energy consumption and process temperature where larger-scale and hotter processes are required to have larger percentage heat recoveries. CECOF has suggested a simpler approach, at least initially with single values for furnaces operating at >1000°C and a different option for furnaces and ovens that operate at <1000°C.
Eco-design studies need to consider BAT as at least one of the eco-design options and so the BAT performance parameter values provided by stakeholders will be considered in Task 6. The long payback periods are discussed in section 6.2 and contributions from several stakeholders shows that achieving BAT as a minimum performance would be very demanding in some sectors and could require large increases in furnace and oven prices. Therefore, an intermediate eco-design option is also considered, which comprises the current average heat recovery values that have been provided in the performance parameter data is also considered. These options could be adopted as three “Tiers” coming into effect after industry sectors have had time to implement the necessary design changes, and for the oven/ furnace manufacturers to develop the necessary expertise.
The heat recovery eco-design options listed below comprise; (i) those suggested by CECOF, (ii) values based on current average performance parameters; and (iii) values based on BAT performance parameter that were provided by stakeholders. Some values are averages of values from several stakeholders because the average and BAT values vary to some extent, as described in section 5.3.

ERA Technology Limited ERA Report No. 2012-0230
043122753 ENTR Lot 4 Final Report v6 329 © ERA Technology Ltd
Table 133. Heat recovery eco-design options from CECOF and based on performance parameter data
Eco-design options Process temperature /
size 1st. tier 2nd tier. Based on average performance
3rd. tier – from BAT performance parameters
>1000°C large Heat recovery minimum 40%
Minimum 40% of energy recovered and re-used (Flue gas 500°C at 3% O2).
Minimum 55% of energy recovered and re-used (Flue gas 300°C at 3% O2).
>1000°C medium
Minimum 30% of energy recovered and re-used (Flue gas 550°C at 3% O2).
Minimum 40% of energy recovered and re-used (Flue gas 400°C at 3% O2).
<1000°C large Flue gas 600°C at 3% O2. Minimum 35% of energy recovered and re-used (Flue gas 500°C at 3% O2).
Minimum 50% of energy recovered and re-used (Flue gas 350°C at 3% O2).
<1000°C medium
Minimum 25% of energy recovered and re-used (Flue gas 500°C at 3% O2).
Minimum 35% of energy recovered and re-used (Flue gas 350°C at 3% O2).
In Tiers 2 and 3, % heat recovery is mandatory, temperatures are indicative (as in Japanese Energy Act).
The table above shows the three Tiers that could be considered as eco-design options for heat recovery:
1. CECOF’s proposal is similar to the approach used in Japan. However, in Japan, only furnaces with a capacity of >840 MJ/hour (>233 kWh/h) are regulated for heat recovery.
2. The average performance eco-design option in the above table is based on current average performance. This could therefore affect up to 50% of furnaces and ovens on the EU market, and therefore would have a significant impact, although it would remove the worst performing from the EU market. Of course, “average” is not the same as median, therefore the proportion actually affected could be different; some types of furnace may be more significantly affected by eco-design requirements than others.
3. BAT eco-design option values are based on BAT performance provided by stakeholders – these are very ambitious and would affect a large proportion of furnaces and ovens on the EU market but should be technically possible apart from where technical constraints exist.
Technical constraints that would exclude furnaces from heat recovery requirements would include, for example:
• Oxy-fuel burner used; these are very efficient and are at least as good as the best regenerative systems.

ERA Technology Limited ERA Report No. 2012-0230
043122753 ENTR Lot 4 Final Report v6 330 © ERA Technology Ltd
• Processes where slow cooling of vapours are needed, such as zinc oxide production using rotary furnaces, which melt zinc metal to generate zinc vapour, that subsequently oxidises to zinc oxide vapour, which is then cooled at a controlled rate to control the product’s particle size.
• Ovens that use recovered heat as the main heat source, such as brick drying ovens which use recovered heat from the brick kiln. Hot bricks are cooled with cold air to produce air at 500°C and this hot air is used elsewhere in brick installations including in drying ovens. Cooling hot bricks to produce hot air is one method of recovering heat that would otherwise be wasted and some brick drying ovens need no other sources of heat.
The temperature of the exhausted combustion gas and the percent heat recovery values in the above table are not necessarily equivalent. The Japan Energy Act imposes a minimum percentage heat recovery from the combustion gases leaving the furnace and gives flue gas temperatures as a guide only. As stated above, heat recovery, as defined by the Japan Energy Act, is calculated by the difference between heat content of combustion gases leaving the main furnace chamber and heat content of gases entering the chimney. This will include recuperators, regenerators, heat exchangers and pre-heaters, but does not include heat recovered from hot product which can be significant for some processes. For example, brick and tile kilns do not use recuperators or regenerators and usually also do not have heat exchangers but heat recovered from hot product is used for gas burners and significantly reduces fuel consumption, which should therefore be encouraged.
Stakeholders provided performance parameter data mostly as temperature values, with fewer stakeholders also giving % heat recovery values. The % heat recovery values in the table therefore have had to be estimated from the limited data available but a good estimate of the improvement potential has been made from the ranges of values for flue gas temperature, from worst-case design up to BAT. Eco-design option values ranging from 25% to 55% have been considered in the above table and are based on data from stakeholders and given in Task 5. These values are comparable to the mandatory values from 25% to 45%, which were imposed by the Japan Energy Act in 1993, with higher target values from 35% to 55% which would be achievable for at least some designs.
Heat recovery cost data from stakeholders and other sources Heat can be recovered by a variety of methods. To reach each Tier, the eco-design option may require additional equipment unless the level is already being achieved but the cost of this additional equipment, as a percentage of the original furnace price will vary considerably. This is partly due to the very wide variation in processes that use furnaces and the technical constraints that exist. Heat can be recovered by a variety of methods each of which has technical limitations that are process dependent. These limitations include:

ERA Technology Limited ERA Report No. 2012-0230
043122753 ENTR Lot 4 Final Report v6 331 © ERA Technology Ltd
Method Limitations Heat exchangers for combustion gases
Corrosion if gases contain corrosive substances, for example those emitted from brick clays
External recuperators % heat recovered depends on size and complexity. These affect price so that a higher percent heat recovery is financially viable for large furnaces than for small furnaces
Regenerators Will become blocked if combustion gases contain dust or particulates
Self-regenerative and self-recuperative burners
Some are designed for smaller furnaces but minimum power rating is 150kW so not suitable for very small designs
Pre-heating incoming materials Suitable only for continuous processes. Uncommon for batch processes.
Heat recovery from hot product Some products are used hot and others need slow controlled cooling so heat cannot be recovered
Another limitation is that there must be a use for any recovered heat.
Very few stakeholders provided heat recovery cost data and most of this data was for larger-size furnaces. Therefore to complete Task 6, costs have had to be estimated as follows.
BC1 – not applicable as all are electric heated.
BC2 - BC5 (medium size), considered fossil fuel heated only. Heat recovery from medium-size furnaces and ovens can be by two main methods.
• Self-recuperative and self-regenerative burners are available with relatively small capacities, so that they can be used with medium-size and some small furnaces and ovens. A stakeholder has provided example prices of €7000 – €8000 for a self-regenerative burner (150kW), whereas a similar capacity cold air burner is c.€1000- €2000. Research has compared a crucible metal melting furnace with cold air burners and self-regenerative burners and the latter reduced gas consumption by 50% in one publication and by 35% in another204 and recovers and reuses over 50% of combustion gas heat. This would be regarded as BAT (Tier 3). The additional cost of c.€6000 and 50% energy saving is not applicable to all medium size furnace designs and so 40% has been assumed to be the best that can be achieved.
• External heat exchangers can also be used either as recuperators or other designs. One example price provided by a stakeholder is €30 000 for a triple pass recuperator that is used with melting furnaces with c.1 tonne capacity. These can recover c.20 – 30% of heat from high temperature processes (>1000°C) but only c.10% from lower temperature processes (e.g. at c.500°C). Therefore an energy saving figure of 15% is used for ovens and 25% for furnaces.
BC6 (large furnaces) – Three stakeholders provided examples of costs and energy savings:
204 Page 7 of http://flox.com/documents/07_TP.pdf and “Development of a self-regenerative burner for non-ferrous metal melting pot furnaces” by H. Shibata, Y. Shimizu, S. Yamagami, 23rd World Gas Conference, Amsterdam 2006 (http://www.igu.org/html/wgc2006/pdf/paper/add10204.pdf )

ERA Technology Limited ERA Report No. 2012-0230
043122753 ENTR Lot 4 Final Report v6 332 © ERA Technology Ltd
• One is for a flat glass melting furnaces. >40% heat recovery is already achieved but the best that is achieved currently is <60%. To increase heat recovery to at least 60% would require additional investment costing 100% of the price of a new furnace and would save 4% of fuel used by the installation.
• Two examples of heat treatment furnaces were provided. One is for a furnace that operates at 1150°C. An additional cost of 15% of the current furnace price is required to increase heat recovery from 30% currently to over 40% (Tier 1). This would reduce fuel consumption by c.15%. The second example illustrates the large variability in costs and fuel savings due to differences in type of process. The second example is a heat treatment process that operates at <1000°C which currently already achieves almost 40% heat recovery. An additional expenditure of 10% of furnace price would increase heat recovery to >60% (Tier 3, BAT).
• A third stakeholder has estimated that to achieve 60% heat recovery would increase the installation cost by at least 75% for a heat treatment process.
• Another manufacturer of ceramics kilns has calculated that installing a large heat exchanger to recover heat from combustion gases that have already passed through a pre-heater would cost c.€400 000, which for a large-size furnace is c.10% of the current price. This could save c.15% fuel although there are technical constraints that limit this option and there are not always uses for this recovered heat.
Additional information provided is from CECOF who have stated that a 10% energy saving should be achievable by heat recovery. The cost of large-size recuperators and regenerators can be at least €1 million (c.20% of the cost of a large furnace). These very limited data show that some furnaces already achieve Tier 1, but that some will require an additional investment (e.g. of 15% to achieve savings of 15% fuel). The three examples of costs to achieve Tier 3 (BAT design) range from 10% to 100%, with potential energy savings of 4% to c.15%. Therefore an additional average price of 50% and an energy saving of 10% has been used.
BC7 (large ovens) – No data was provided by stakeholders although a possible design option was considered from discussion with a biscuit tunnel oven manufacturer. Large ovens are directly heated or indirectly heated, and as explained previously, direct heating is more energy efficient. Some indirect-heated bakery ovens have heat exchangers, but heat exchangers are not used with direct-heated bakery ovens although this is theoretically possible and the following estimates were made by an oven manufacturer: Additional cost = 36%, with up to 50% of combustion gas heat being potentially recoverable and energy savings of up to c.15% may be achievable. The options for heat recovery from ovens are clearly less than from furnaces because the heat recovery efficiency is dependent on combustion gas temperature. The temperature of combustion gases (after dilution) from direct fired ovens can be less than 200°C, in which case achieving a heat recovery and reuse of 50% would be very difficult, and 35% may not always be feasible. It would therefore be reasonable to exclude direct fired ovens from heat recovery eco-design options. Heat recovery is possible with indirect fired oven designs, because the emitted combustion gases are much hotter, therefore heat recovery is viable and so these types can be subject to regulation.

ERA Technology Limited ERA Report No. 2012-0230
043122753 ENTR Lot 4 Final Report v6 333 © ERA Technology Ltd
Improved insulation Heat losses through furnace and oven walls, the roof and floors can be measured in several ways. For example:
• Average external surface temperature of wall, floor or roof. • Maximum value at hot spots, e.g. around door. • As W/m2. of wall, floor or roof (either of the insulation itself or the entire surface,
including hot spots). Eco-design options have been considered for each of the industrial base cases which are based on the average and BAT performance parameter values provided by stakeholders:
Table 134. Insulation eco-design options (ambient 20°°°°C) Base case BAT Eco-design options BC2 Batch ovens i). Maximum average wall temperature 50°C
ii) < 300 W/m2.BC3 Continuous oven i). Maximum average wall temperature 50°C
ii) < 300 W/m2.BC4 Batch furnace i). Maximum average wall temperature 70°C
ii) < 500 W/m2.BC5 Continuous furnace i). Maximum average wall temperature 60°C
ii) < 400 W/m2.BC6 Large furnace i). >1000°C maximum = 70°C or <500 W/m2.
ii). 450°C – 1000°C maximum = 60°C or <400 W/m2.BC7 Large oven i). <450°C maximum = 45°C
ii). <200W/m2.
In the above table, ovens are designed to have maximum temperature of <450°C and furnaces are those that are designed to have maximum temperatures of >450°C. External wall temperature and wall heat losses as W/m2 are approximately equivalent as follows (at 20°C ambient and calm air):
Ovens: 40°C 200W/m2.
50°C 300W/m2.
Furnaces: 60°C 400W/m2.
70°C 500W/m2.
A stakeholder has provided calculations to show the relationship between insulation thickness, surface temperature and heat loss. These assume 20°C ambient and calm air using HTIW insulation (max. temp. 1260°C, density 128kg/m3)

ERA Technology Limited ERA Report No. 2012-0230
043122753 ENTR Lot 4 Final Report v6 334 © ERA Technology Ltd
Thickness of insulation (mm)
External surface temperature (°°°°C) at ambient 20°°°°C and calm air
Heat loss (W/m3) at ambient 20°°°°C and calm air
Furnace operating at 1000°°°°C185 76°C 600 210 68°C 500 270 60°C 400
Oven operating at 400°°°°C60 200 44 40 300 50
These calculations have the following limitations205:
• These figures are applicable only to those processes that are suitable for this type of thermal insulation;
• Heat lost via heat bridges are excluded; • Assumes steady state conditions; • These are calculated values that would be applicable to new insulation that has been
installed correctly. Several stakeholders have indicated difficulties with maximum external temperature limits as there are often “hot spots” at door edges and around burners. Some manufacturers stated that it may be technically not possible to achieve the low maximum external temperatures in the above table although the majority of wall areas are well below these temperatures. Average wall temperatures are another option, but at present, there are no standards prescribing how this should be calculated. Another problem with maximum temperature is that this is affected by:
• Air flow past surface; • Other ovens or furnaces nearby; • Ambient temperature (some bakery ovens are used in areas with ambient temperature of
40°C or hotter, and so a 40°C upper limit is impractical). Some processes intentionally flow air over the external insulation surface to cool it. One stakeholder provided data for bakery ovens which showed that when a single oven is used, the wall temperature is 50°C but when two or more are used with small spaces between them, the temperature is at least 70°C. The use of limits based on W/m2 should overcome these problems and also has the benefit of being directly related to heat loss. It is related to 205 There are standards for insulation materials and for refractories which are listed in table 14. These standards are mainly specifications for the materials and do not give details of change in performance with time. Manufacturers of insulation and refractories provide specifications for their products including minimum performance as well as guidance on installation and suitability. However, insulation choice, design and installation are highly skilled which is why sometimes, it is not done very well and lifetimes may not be as long as expected.

ERA Technology Limited ERA Report No. 2012-0230
043122753 ENTR Lot 4 Final Report v6 335 © ERA Technology Ltd
external temperature as shown in section 5.3 and is not difficult to determine. Commercial software is used to calculate heat loss in W/m2 for new designs based on insulation properties, thickness and internal and ambient temperature. This can also be used for multiple layers of refractory and insulation. One stakeholder has stated that for smaller furnaces, this software gives results that are within c.20% of the actual new furnace value.
CECOF has proposed that the requirements of the Japan Energy Act are used as the first Tier (see below). It is understood that these values are maximum average values and exclude heat bridges. In the EU, wall temperatures need to be below safe touch temperatures unless technical constraints prevent this and then physical barriers are used to stop workers from being burnt. It is believed that except for excluded types of furnace, the standard temperature values from the Japan Energy Act are already met by most furnaces and ovens in the EU.
The Japanese Act excludes certain types of furnace as described in section 1.5.3. It has been pointed out that the outer wall temperature of furnaces is often hotter than the roof contrary to the Japanese requirements. In one example from a stakeholder, a furnace operating at 1300ºC with the same thickness of insulation at the roof and walls has outer surface temperatures of : wall = 78ºC, roof = 73ºC.
Insulation cost data provided by stakeholders and from other sources It is clear that most new furnaces and ovens in the EU already achieve the Japanese maximum temperature limits except where technical constraints prevent this. Therefore, the cost of achieving BAT performance only is considered.
Unfortunately, very little information was provided by stakeholders (except to say that they could already meet Tier 1 or that the BAT values were impossible!). Therefore estimates have had to be made although these have been verified using data from two manufacturers:
• One manufacturer of small and medium-size electrically heated furnaces calculated that to halve the heat loss through insulation of an 1100°C furnace by increasing its thickness would increase the furnace price by 23%.
• A manufacturer of large tunnel furnaces has calculated that doubling the thickness of insulation of an already BAT design furnace would increased the furnace cost by 9%, whilst giving an energy saving of c.3%.
In order to estimate costs and energy savings from improved thermal insulation, the following assumptions were made:
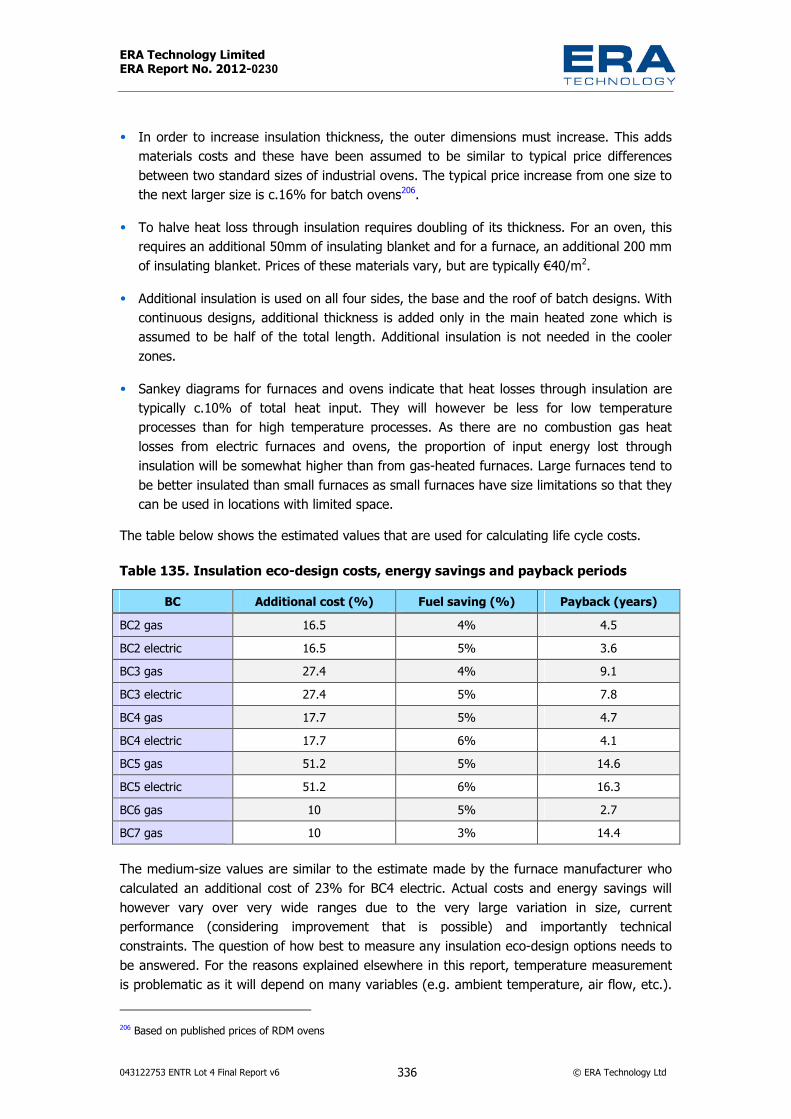
ERA Technology Limited ERA Report No. 2012-0230
043122753 ENTR Lot 4 Final Report v6 336 © ERA Technology Ltd
• In order to increase insulation thickness, the outer dimensions must increase. This adds materials costs and these have been assumed to be similar to typical price differences between two standard sizes of industrial ovens. The typical price increase from one size to the next larger size is c.16% for batch ovens206.
• To halve heat loss through insulation requires doubling of its thickness. For an oven, this requires an additional 50mm of insulating blanket and for a furnace, an additional 200 mm of insulating blanket. Prices of these materials vary, but are typically €40/m2.
• Additional insulation is used on all four sides, the base and the roof of batch designs. With continuous designs, additional thickness is added only in the main heated zone which is assumed to be half of the total length. Additional insulation is not needed in the cooler zones.
• Sankey diagrams for furnaces and ovens indicate that heat losses through insulation are typically c.10% of total heat input. They will however be less for low temperature processes than for high temperature processes. As there are no combustion gas heat losses from electric furnaces and ovens, the proportion of input energy lost through insulation will be somewhat higher than from gas-heated furnaces. Large furnaces tend to be better insulated than small furnaces as small furnaces have size limitations so that they can be used in locations with limited space.
The table below shows the estimated values that are used for calculating life cycle costs.
Table 135. Insulation eco-design costs, energy savings and payback periods BC Additional cost (%) Fuel saving (%) Payback (years)
BC2 gas 16.5 4% 4.5 BC2 electric 16.5 5% 3.6 BC3 gas 27.4 4% 9.1 BC3 electric 27.4 5% 7.8 BC4 gas 17.7 5% 4.7 BC4 electric 17.7 6% 4.1 BC5 gas 51.2 5% 14.6 BC5 electric 51.2 6% 16.3 BC6 gas 10 5% 2.7 BC7 gas 10 3% 14.4
The medium-size values are similar to the estimate made by the furnace manufacturer who calculated an additional cost of 23% for BC4 electric. Actual costs and energy savings will however vary over very wide ranges due to the very large variation in size, current performance (considering improvement that is possible) and importantly technical constraints. The question of how best to measure any insulation eco-design options needs to be answered. For the reasons explained elsewhere in this report, temperature measurement is problematic as it will depend on many variables (e.g. ambient temperature, air flow, etc.). 206 Based on published prices of RDM ovens

ERA Technology Limited ERA Report No. 2012-0230
043122753 ENTR Lot 4 Final Report v6 337 © ERA Technology Ltd
Measurement of heat loss as W/m2 is impractical for custom-designed furnaces and ovens as once these have been built, it is too late to change the design. Predicting W/m2 heat loss is not very accurate and the actual value can be ±10% more or less than the prediction. As the aim is to reduce heat losses through insulation, it is appropriate to calculate the heat loss based on refractory and insulation material properties, thickness and internal process temperature. Software exists to carry this out, and manufacturers have found that such software is accurate to within ±10% of the actual performance value under operating conditions. It should be noted, however that this is the calculated heat loss through areas of insulation that are away from structures that pass through the walls, such as burners, electrical connections and doors, all of which will loose heat. Therefore, the total surface heat loss from all surfaces of a furnace or oven will always be greater than the heat loss through the insulation only. Total heat loss is related to energy consumption of the furnace and oven and this is discussed below as an eco-design option for providing energy consumption information to users.
Fuel / air ratio The optimum ratio of fossil fuel to air supplied to burners will have an impact on energy consumption because any air in excess of the stoichiometric amount required for complete combustion of the fuel will need to be heated and so will consume heat and this represents a loss of efficiency. A ratio of 1 part air to 1 equivalent part gas represents the theoretically correct ratio of fuel to air but this is rarely used because there are always mixing inefficiencies and thus a small excess of air is needed to ensure complete fuel combustion and to avoid formation of toxic carbon monoxide. Gas/air and liquid fuel/ air ratios are regulated in many types of Japanese furnaces, with minimum values of excess air required. Stakeholders were asked to provide performance parameter data on fossil fuel/ air ratios and this data is included in section 5.3. Data were provided by only a few of those that submitted data, but this does show that there is a range of values in new EU furnaces and therefore, a reduction in fuel consumption may be achievable. The potential fuel savings claimed by stakeholders (<1%) is much less than suggested by the US DoE (1% for each 1% decrease in excess air). Unlike with heat recovery, the eco-design options for fuel/ air ratio could be independent of furnace size, although it would of course be applicable only to fossil fuel burners. Large furnaces typically have more burners than small furnaces (although there are exceptions) so that controlling the fuel air ratio of a small furnace with one burner is easier than controlling a large furnace with, for example 300 independently-controlled burners. This is because the main control method is to monitor the oxygen content of the combustion gases with a single oxygen sensor at the entrance to the flue (before any dilution occurs). These combustion gases are a mixture of the gases from all 300 burners and a small variation in gas/ air ratio between burners is inevitable.
With complex multi-burner furnaces, stakeholders report that the gas/ air ratio varies within a small range, so if the excess air is too small, there will be periods when there is unburned fuel. This will lead to the formation of carbon monoxide, which would increase fuel consumption (possibly by up to 10% if λ = 1) and so the lowest energy consumption is achieved at an average of 10% excess air (λ = 1.10). Therefore, allowing for ±5% fluctuations gives a maximum λ value of 1.15. An intermediate value has been suggested by CECOF as follows:

ERA Technology Limited ERA Report No. 2012-0230
043122753 ENTR Lot 4 Final Report v6 338 © ERA Technology Ltd
1st. Tier based on CECOF proposal: Maximum λ = 1.25 (target =1.15 ≅3%O2) except for safety or process reasons.
2nd. Tier based on BAT performance: The lowest λ value quoted as BAT by stakeholders was 1.1 using natural gas. This stakeholder also said that a BAT value of 1.25 would be BAT for LPG although technically 1.1 should be also be achievable for LPG but may be BNAT at present. Higher carbon content fuels will need to have larger λ values. Single burner furnaces can more easily control to 1.1 but maintaining this value with multi-burner processes is technically very difficult. 1.1 can be achieved but is very difficult to maintain within the range 1.05 and 1.1 to avoid CO emissions. A maximum λ value of 1.15, as described above may be more realistic as a second Tier (BAT) eco-design requirement.
BAT λλλλ values for different fuel types207:
• Natural gas 1.15 • LPG 1.25. Fuel oil is also used and the λ values will be different to those of gas and LPG but no published reliable value could be located during this study.
Industrial furnace burners have volume or mass flow valves that control air and gas, such that the ratio can be adjusted by the user, based on readings from the combustion gas analyser or other indications of ratio (flame colour is sometimes used). This eco-design option is therefore a requirement that the ratio of gas and air to each burner can be adjusted with sufficient accuracy to comply with the eco-design option to minimise fuel consumption. Of course the user must be able to make adjustments to different ratios for safety or process reasons, but user behaviour cannot be regulated by the eco-design directive.
Limitations
• Direct-fired ovens (<650°C) – limiting gas/ air ratio of direct fired ovens is pointless because to achieve the required temperature, combustion gases are diluted with cold air to achieve the required process temperature. Gas/ air ratio can be regulated for indirect fired ovens, because the combustion gases are not diluted.
• Furnaces that need reducing atmospheres – these furnaces use less air to ensure that there is no free oxygen, and there may also be some carbon monoxide which acts as a reducing agent for some metal oxides (so giving bright metal surfaces after heat treatment). Minimising CO is clearly desirable as it is toxic and also represents a lower heat output from combustion.
• Oxy-fuel burners - excess oxygen has much less effect on efficiency than excess air and use of more oxygen than necessary represents a significant additional cost, so there is already a large incentive to minimise the λ value.
207 http://www.engineeringtoolbox.com/fuels-combustion-efficiency-d_167.html
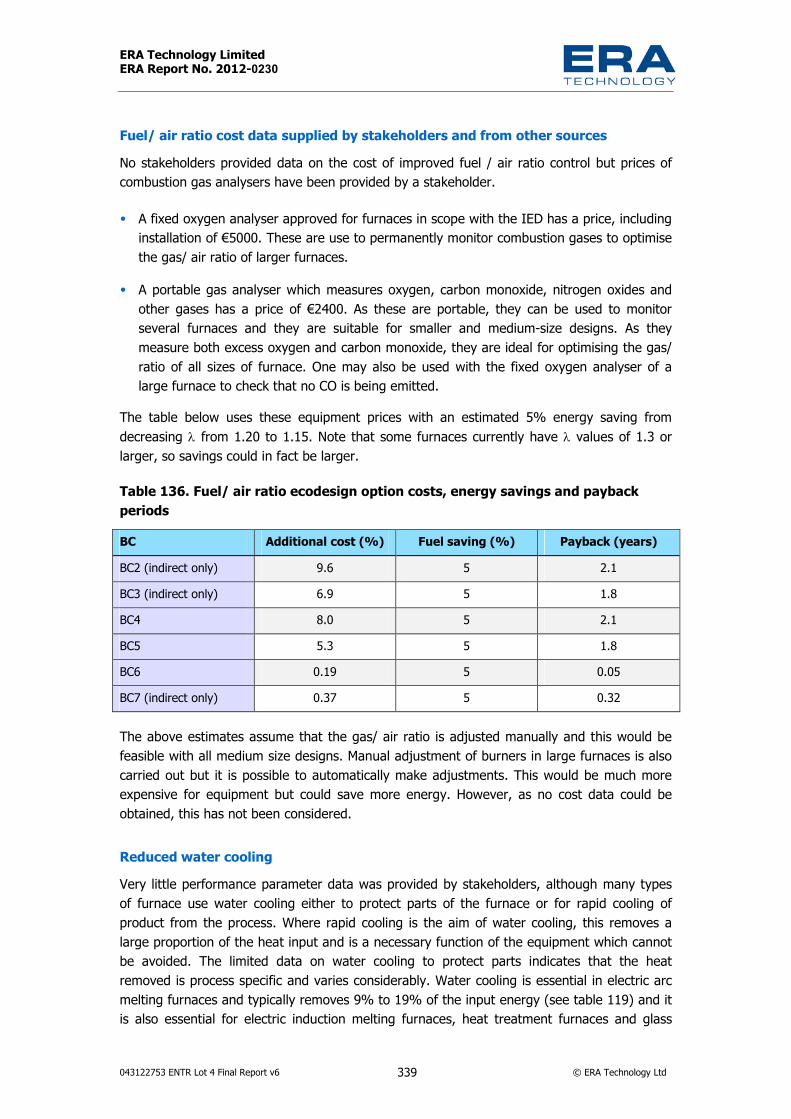
ERA Technology Limited ERA Report No. 2012-0230
043122753 ENTR Lot 4 Final Report v6 339 © ERA Technology Ltd
Fuel/ air ratio cost data supplied by stakeholders and from other sources No stakeholders provided data on the cost of improved fuel / air ratio control but prices of combustion gas analysers have been provided by a stakeholder.
• A fixed oxygen analyser approved for furnaces in scope with the IED has a price, including installation of €5000. These are use to permanently monitor combustion gases to optimise the gas/ air ratio of larger furnaces.
• A portable gas analyser which measures oxygen, carbon monoxide, nitrogen oxides and other gases has a price of €2400. As these are portable, they can be used to monitor several furnaces and they are suitable for smaller and medium-size designs. As they measure both excess oxygen and carbon monoxide, they are ideal for optimising the gas/ ratio of all sizes of furnace. One may also be used with the fixed oxygen analyser of a large furnace to check that no CO is being emitted.
The table below uses these equipment prices with an estimated 5% energy saving from decreasing λ from 1.20 to 1.15. Note that some furnaces currently have λ values of 1.3 or larger, so savings could in fact be larger.
Table 136. Fuel/ air ratio ecodesign option costs, energy savings and payback periods BC Additional cost (%) Fuel saving (%) Payback (years) BC2 (indirect only) 9.6 5 2.1 BC3 (indirect only) 6.9 5 1.8 BC4 8.0 5 2.1 BC5 5.3 5 1.8 BC6 0.19 5 0.05 BC7 (indirect only) 0.37 5 0.32
The above estimates assume that the gas/ air ratio is adjusted manually and this would be feasible with all medium size designs. Manual adjustment of burners in large furnaces is also carried out but it is possible to automatically make adjustments. This would be much more expensive for equipment but could save more energy. However, as no cost data could be obtained, this has not been considered.
Reduced water cooling Very little performance parameter data was provided by stakeholders, although many types of furnace use water cooling either to protect parts of the furnace or for rapid cooling of product from the process. Where rapid cooling is the aim of water cooling, this removes a large proportion of the heat input and is a necessary function of the equipment which cannot be avoided. The limited data on water cooling to protect parts indicates that the heat removed is process specific and varies considerably. Water cooling is essential in electric arc melting furnaces and typically removes 9% to 19% of the input energy (see table 119) and it is also essential for electric induction melting furnaces, heat treatment furnaces and glass
ERA Technology Limited ERA Report No. 2012-0230
043122753 ENTR Lot 4 Final Report v6 340 © ERA Technology Ltd
melting furnaces. Those furnaces where water cooling is needed to protect the furnace from the process materials tend to be large or very large and so the high energy cost is an incentive to minimise water cooling and also to use the hot water or steam that is produced if possible.
Without more performance parameter data, it is not possible to propose eco-design options, although from the evidence available, it seems likely that the improvement potential is probably small and that energy savings would not be significant.
Reduced ventilation losses Electrically-heated ovens and furnaces cannot be sealed because, unless their insulation is poor, their temperature will become uncontrollable and they could over-heat. Efficient ovens require fans to create convection heating but all electric fans generate waste heat and this is retained within the oven or furnace chamber. In well-insulated designs, without a vent, this heat cannot escape and can cause the internal temperature to rise, even with no other source of heating. One stakeholder reported that with vents closed, a well insulated oven’s temperature could not be controlled due to this effect. Therefore all electrically heated ovens and furnaces use vents to allow some fresh air in and hot air out. As energy is consumed heating the incoming cold air, the precision of vent control affects energy consumption. Unfortunately, however, there is no data on the effect of vent control precision on energy consumption and so it is not possible to estimate potential EU energy savings or propose quantitative eco-design options. Vent control is likely to be appropriate only for BC2 and BC4 (and possibly also BC1) electrically heated batch processes, as continuous processes tend to have openings at the entrance and exit. Direct gas heated versions must vent combustion gases. Therefore, if more accurate vent control were able to reduce energy consumption by 1%, this would save 569GWh/y (1% of annual energy consumption of BC2e and BC4e) although there is no data to determine whether 1% is too large or too small.
Vent control of large-size is less important as most are continuous and gas-heated.
With laboratory ovens (BC1), vent control precision is very varied as described in table 80 and one laboratory oven manufacturer’s BAT oven has electronically-controlled vents. RDM also advertise industrial ovens with automatic fume exhaust control in their low energy consumption ovens.
Reduction in drying energy consumption One stakeholder has reported that 5% of their sales of small and medium industrial ovens and furnaces are designed for drying materials. There are also some large drying ovens sold in the EU for drying ceramics, chemicals, etc. although these are a relatively small proportion of the large-size industrial furnace and oven energy consumption. Only limited performance parameter data were submitted by stakeholders and so it is difficult to determine the potential EU energy saving or to determine eco-design options. The most energy efficient drier designs are those that are microwave assisted but these are not suitable for all materials. For example, they cannot be used for drying wet metals because metals more efficiently adsorb microwave energy than water. The lowest theoretical energy consumption is 2.6MJ/kg of water whereas the lowest practical energy consumption for drying wet clay

ERA Technology Limited ERA Report No. 2012-0230
043122753 ENTR Lot 4 Final Report v6 341 © ERA Technology Ltd
bricks is 3.2MJ/kg water (see table 96). A maximum eco-design option for energy consumption of drying ovens could be, for example 4MJ/kg water for drying solids with an initial water content of at least 10% although a lower content may also be feasible. However, as so little performance parameter data were submitted, it is not known whether the EU energy saving achievable would be significant.
A constraint here is that energy is consumed heating the solids and so materials with low water content inevitably require more energy / kg water than very wet solids. Another issue is that there are many different types of drier and some of these are not ovens or furnaces (e.g. belt driers which are not enclosed). Additionally, although the type of drier used affects energy consumption, it is necessary to use certain types for functional reasons. For example, spray driers are used to obtain free-flowing powders and vacuum and freeze driers are needed for heat sensitive materials
Minimum power factor In Japan, large-size electric equipment including electric furnaces must comply with a minimum power factor requirement of 0.95 (see section 1.5.3). This could be an eco-design option in the EU but is probably unnecessary, as electricity suppliers in the EU take power factor into account when invoicing their industrial customers. There is therefore an incentive to have as high a power factor as possible to reduce energy bills.
Obligation to provide energy consumption information The above eco-design options are not appropriate for laboratory ovens or furnaces. Most are electric and the insulation of these furnaces cannot be sufficiently thick to meet the outer temperature limits or heat emission limits as it would be far too thick to be practical in small laboratories. The majority of small and medium-size industrial furnaces and ovens are batch and electric and so there are some types of process where none of these eco-design options are suitable (see discussion of energy consumption of short cycle time batch processes below). Therefore an alternative option is needed.
BC1: Laboratory ovens (and furnaces) are standard designs manufactured in moderate numbers and so can be regulated in the same way as consumer products, using an energy consumption measurement standard and an information requirement to provide potential users with standardised energy consumption data that they can compare with other models. It would also be possible to impose a maximum energy performance standard. The energy consumption measurement methods would need to be representative of how ovens and furnaces are used although it is known that this is very variable.
BC2 – 5: Some manufacturers of small and medium-size furnaces and ovens provide energy consumption data to their customers but according to the replies to first ENTR Lot 4 study questionnaire, users frequently are not able to obtain this information. One manufacturer of small- and medium-size ovens and furnaces has stated that they always provide energy consumption data, either for specific processes or for example processes for multi-purpose designs. Another manufacturer said that they can provide energy consumption data but the accuracy will be within 10% of the actual value. Most EU eco-design implementing measures for consumer products permit a tolerance of 10% to allow for manufacturing variability. Mass
ERA Technology Limited ERA Report No. 2012-0230
043122753 ENTR Lot 4 Final Report v6 342 © ERA Technology Ltd
produced consumer products should not vary significantly and so type testing of one model should give a result that is within a tolerance range of 10% of all of the type tested unit. However, small and medium-size ovens and furnaces are not standard models produced by a consistent continuous process. Although some are based on standardised designs, each is custom-designed and built and so energy consumption will often be unique; therefore, it would be impractical to measure the consumption after construction. Instead, the energy consumption should be calculated, and the predicted value provided to potential users. The accuracy of this prediction will be within 10% of the actual value; according to manufacturers, such a prediction could usually not be more accurate.
BC6 – BC7: All suppliers of large furnaces and ovens already provide detailed energy consumption data for new furnaces, so that potential users/ customers can compare equipment from different suppliers. These predictions should be reasonably accurate and performance (such as energy consumption) may be specified in contracts exchanged between the furnace manufacturer and user. Performance significantly below that specified would therefore be a breach of contract. A few suppliers will go further and will guarantee a maximum energy consumption per tonne of product made by the furnace, when their furnaces are used as designed. The manufacturer would have to repay the user for any additional energy consumed above this maximum specified value.
Stability of performance - The stability of performance in use is related to energy information and eco-design, for all base cases is. Energy efficiency can deteriorate because of poor construction design, or incorrect selection of refractories and insulation. Several stakeholders have said that HTIW, and in particular microporous materials, can be affected at high temperatures, causing leaks and so an increase in energy consumption. Insulation material manufacturers, however, disagree, stating that if performance deteriorates, this is probably due to poor design or selection of an incorrect type of insulation material. This was a common problem in the EU some 30 years ago, when HTIW was fairly new, but most EU manufacturers have learned how to select and to use these materials correctly in the intervening period. Some stakeholders have commented that there are still some low cost, poor quality designs available in the EU, which give performance that more rapidly deteriorates that better designed equipment.
As far as the users are concerned, they do not want performance to deteriorate as this will result in increasing energy and maintenance costs. The choice of refractory and insulation materials and good design will limit deterioration although for some processes such as glass melting, gradual erosion of refractory is inevitable and expected. The provision of information to users on how the performance will change in the first year or so of use should help to remove from the EU market poorly designed furnaces and ovens that deteriorate more rapidly than good designs, as users will be less likely to be misled by claims of good initial performance and unusually low prices. It would be impractical to require performance to remain with a small specified percentage of the initial value because i) some designs will degrade in a known and expected manner and ii) as most are custom designs, there are always uncertainties with “one-offs” so it is not possible to precisely predict performance. The tolerance for performance stability can be fairly small as performance could be measured once when new and then again after a year using the same measurement method. It is important however that this is based on the furnace being used in the manner for which it was designed as abnormal use can cause more rapid deterioration.
ERA Technology Limited ERA Report No. 2012-0230
043122753 ENTR Lot 4 Final Report v6 343 © ERA Technology Ltd
Potential energy saving: Although no data is available on the energy saving achievable for BC2 – BC5, based on published data on energy savings that can be achieved which are referred to elsewhere in this report, this may be as much as 5%. No energy savings would be expected for BC6 or BC7, as full details on energy consumption are already provided. Energy savings for BC1 are a significant percentage and are assessed as BC1 eco-design option 1.
Cost of providing energy information It is estimated that for BC2 -7, there would be minimal additional costs incurred as most manufacturers are already able to provide this information to their potential customers, although according to users, this data is often not provided for smaller sizes. For laboratory ovens and furnaces, the costs would be similar to those incurred at present for compliance with existing eco-design implementing measures.
Rejected eco-design options Eco-design options which are very costly and those that are applicable only to a limited range of processes have not been considered further even though some energy savings may be achievable. These are:
• Microwave and infrared heating – this is suitable only for a small percentage of processes • Heat recovery using heat exchangers – is sometimes an option and are moderately
common but have technical constraints. These can have short lifetimes if combustion gases are corrosive and there must a use for any recovered heat which is user dependent. These are unsuitable for recovery of heat from gases at less than c.200°C
• Heat recovery by use of recovered hot air in gas burners – this is used in some ceramics processes where hot air from cooling product is available but hot air is not available from most other processes
• Lightweight kiln cars, furniture, containers – suitable for some types of ceramics such as bricks and roof tiles, also used to support metal parts for heat treatment and as containers for baking. Potentially gives significant energy savings but suitable for a fairly small percentage of processes
• Use direct heating instead of indirect – direct heating is always more efficient than indirect but the types of process where there is a choice is fairly small. Some processes have to use indirect heating, for example if the furnace chamber needs to contain an inert gas or hydrogen.
• Use of regenerative burners – heat recovery is achieved using regenerative burners so this would be suitable for BC6. External regenerators are however too expensive for BC2 – 5 as they cost at least €150,000 which is more than the current furnace price.
• Oxy-fuel burners – give large energy savings and should be encouraged. However, they are relatively expensive costing at least €80,000 so will not be appropriate for BC2 – 5
• Fully automated gas / air flow control – this is not needed for BC2 - 5 but would be needed to minimise gas / air ratio for complex BC6 & BC7, with many hundreds of burners
ERA Technology Limited ERA Report No. 2012-0230
043122753 ENTR Lot 4 Final Report v6 344 © ERA Technology Ltd
to compensate for possible variations in gas supply composition. The estimated additional cost for this option could up to €3 million for a large 300-burner furnace, and therefore pay back times are too long.
• Electricity generation from recovered heat – this is used only with the largest furnaces after other heat reuse options have been used. In an example of a large flat glass melting furnace, the current best designs are able to recover 55% of heat from combustion gases using regenerative burners. Stakeholders have stated that the only option available currently to increase heat recovery to 60% (i.e. 5% more heat recovered) would require the installation of an electricity generator, which would cost as much as the furnace itself. Payback time would be too long, at c.30 years.
6.1.3 Legislation and standards available regarding eco-design options There are two EU-wide regulations that influence energy consumption of some of the equipment covered by this study. There is also legislation in some Member States. To date these have had only a small or negligible impact on eco-design. The EU-wide legislation is the EU Energy Trading Scheme (ETS) and Industrial Emissions Directive (IED), previously the Industrial Pollution Prevention and Control (IPPC) Directive. These two pieces of legislation regulate installations that are in their scope, which includes most of the large furnaces and ovens (described by BC6 and BC7) that are also in scope of this study. There are, however many smaller furnaces and ovens (many of those described by BC1 – BC5) that are not regulated by ETS or IED. This section considers whether the ETS and IED policies, and national legislation already in place, as relevant, will achieve energy savings and how these compare with eco-design options.
ETS The eco-design options described here aim to reduce energy consumption of furnaces and ovens and the best that could be achieved is estimated to be c.20% overall. The main energy source is fossil fuels, either used directly as gas, oil or coal or used indirectly via electricity generated using fossil fuels. The EU ETS (2003/87/EC) is an incentive to reduce GHG emissions from the EU’s larger furnaces and ovens, and is an indirect incentive to reduce energy consumption. The ETS applies only to larger installations, as described in Table 16 but includes at least 75% of the energy consumption of the EU’s furnaces and ovens. This legislation does not target furnaces and ovens specifically, since it covers all greenhouse gas emissions from installations; however, GHG emissions from furnaces and ovens are a significant proportion. In general, when the proportion of production costs due to energy is high, there is a large incentive to minimise energy consumption and the ETS is intended to be an additional financial incentive. However, where the cost of energy is a small proportion of production costs, this is much less effective and manufacturers can choose to buy carbon credits rather than reduce energy consumption.
An advantage of ETS over other methods is that it sets targets for installations, and so the operators can choose how to reduce GHG emissions. The approach used by each installation owner will be to achieve the largest reduction in carbon emissions per Euro of investment. This may not be by changes made to furnaces but to other processes within the installation and so in this respect, ETS would be more effective than eco-design obligations.
ERA Technology Limited ERA Report No. 2012-0230
043122753 ENTR Lot 4 Final Report v6 345 © ERA Technology Ltd
A disadvantage of ETS is that carbon prices fluctuate and have at times been very low, and thus may at times provide little or no incentive to reduce emissions. Operators of installations consider the likely return on investment before making investment decisions, but when there is uncertainty over the carbon prices, this discourages investment in energy savings because there is a possibility that prices will be low and so the incentive to invest is commensurately low. Another disadvantage of ETS is described in Task 1, which refers to carbon leakage. This occurs where the manufacturing cost in the EU is so much higher than outside the EU that the operator decides to build new installations outside the EU. The cost of ETS is one of the additional costs which are not incurred by most countries outside of the EU. Of course, ecodesign implementing measures can potentially have the same effect, and could also encourages carbon leakage but if eco-design options only place obligations on manufacturers that have fairly short payback times, then this should not be a significant incentive to relocate.
Although there is a need to significantly reduce GHG emissions, there is also a need to reduce energy consumption, as supplies in the EU are not unlimited, especially if fossil carbon intensive energy sources are phased out in order for the EU to reach its 2050 target of an 80% decrease in GHG emissions. More energy efficient industrial processes will be increasingly important; however, making energy savings in all other areas is also essential, in order to meet this demanding target. To put the scope of this study into perspective, the possibilities for reductions in emissions from EU furnaces are limited, to quite an extent.
An important difference between ETS and eco-design is that ETS is intended to reduce GHG emissions, whereas eco-design considers all environmental impacts, and applies equally to products used in the EU irrespective of where they are produced. Eco-design should not cause a “carbon leakage frontier” per se, which can occur with installations and processes subject to ETS. However, relocation of manufacturing facilities (which include furnaces) to locations outside the EU could occur as a result of new eco-design requirements that cause significant higher costs in the short-term, and should be avoided by careful drafting of any implementing measures. Progressive eco-design recommendations should make processes and products more energy efficient, inter alia, with regard to environmental improvements. Implementation of eco-design requirements is not dependent on capacity, and - in general - energy efficiency can be better with larger capacity designs.
It should be noted that one radical way via which the GHG emissions from within the borders of the EU could be lowered from furnace-using EU installations is when companies choose to reduce capacity via moving some production outside of the EU. However, environmentally, it must be appreciated that there is no net benefit globally from such an approach, as the difference would be made up by the non-EU installations elsewhere (and possibly this would have a detrimental effect arising from less stringently-regulated facilities in non-EU countries). From a competitiveness perspective, EU industrial capacity is impaired by all such decisions made to relocate industrial furnace-using facilities outside of the EU.
IED Article 11 of the IED states that Member States shall ensure that energy shall be used efficiently, although Article 9 excludes IED greenhouse gas emission requirements for installations that are in scope of the EU ETS. The scope of IED includes most large and some

ERA Technology Limited ERA Report No. 2012-0230
043122753 ENTR Lot 4 Final Report v6 346 © ERA Technology Ltd
medium size industrial furnaces and ovens. This directive requires industrial installations to have permits to operate which in principal are granted if the processes are BAT as defined by applicable IPPC BREF guides. As described in section 1.5.1, the impact of IED on energy consumption and GHG emissions is relatively small. There have been problems in the past with IPPC that the IED has been designed to resolve; however, whether this is successful remains to be seen. One issue is the review periods for renewal of permits, which is very variable, and in some plant is quite long. Long review periods for permits run the risk of allowing old, out-of-date technology to be used for many years. Another issue with regard to IPPC is that some permits have been granted despite installations not being compliant with IPPC BREF guidance, and this has occurred without good reasons for exceptions being given. IED introduces changes which hopefully will resolve these two issues to some extent. However there is a limitation with IED for energy efficiency. IED’s main aim is to limit polluting emissions which is achieved in most installations fairly effectively. However, although there is an Energy Efficiency BREF guide and some processes in sector specific guides indicate energy consumption, IED does not effectively limit energy consumption for the following reasons:
• The Energy Efficiency BREF covers all aspects of energy efficiency and so has a very broad scope. It does include sections on burners, insulation, furnace openings, drying and heat recovery but only in general terms and no useful quantitative targets or minimum performance specifications are included that national authorities can use for assessing installations. Refractory and insulation manufacturers believe that the Iron and Steel Production BREF and the Energy Efficiency BREF (and probably other BREFs) largely ignore BAT insulation and refractory materials.
• Sector-specific BREFs include typical ranges of energy consumption that should be expected per tonne, which could act as target values, although it is not known whether these are checked when permits are reviewed. These energy consumption values are those from furnaces that are being installed in the EU, and do not necessarily represent the best that could technically be achieved with a little more investment. Ranges of values often need to be given because of variable raw materials, or differences in product characteristics, but this potentially allows inferior performance to the best that could theoretically be achieved. Various furnace designs are described in sector-specific BREFs, each having different energy consumption per tonne of product, but the choice of furnace design is left to the installation operator. For some processes (such as scrap aluminium melting) the choice of furnace design depends mainly on process parameters, such as raw material composition and purity, and so consequently operators may not be able to select the most energy efficient type. For other processes, the choice depends largely on throughput, with the larger capacity designs being slightly more efficient than smaller capacity designs. This choice is left to the installation operator, and thus the most efficient design is not always achieved. This is probably inevitable, as manufacturers have limited control over their market size. However, there is a disincentive to build the largest most efficient design, as this will be more expensive to build, entailing larger investment needs. If a new installation were to produce more products than can be sold within the EU, then the owner may decide to build elsewhere and supply the EU market from this new facility, because production costs may be lower, outside the EU. Another reason why several small furnaces may be installed instead of one large furnace is that this gives much greater flexibility to cope with market size fluctuations and production of small batches. However,

ERA Technology Limited ERA Report No. 2012-0230
043122753 ENTR Lot 4 Final Report v6 347 © ERA Technology Ltd
the energy consumption/ tonne for several smaller furnaces compared may be higher than for one large furnace. These decisions do not appear to be taken into account in IPPC BREFs.
• Another limitation of the IPPC approach is that IPPC BREF guides are written by committees, which primarily include industry experts, who are mainly are employed by furnace users and possibly also some furnace manufacturers; these same industry experts are the persons who contribute to the descriptions in the guides regarding the technology (BAT) that is currently being installed in the EU. This may not be the same as the best technology that could be installed. To be able to include a completely unbiased view of BAT in BREF Guides, it would be necessary for completely independent experts - without any potential conflict of interest - to sit on BREF committees. These experts could be funded by the European Commission, so that their work is sufficiently remunerated, but at the same time hopefully maximising impartiality.
• IED does not specify permit review periods, but instead states that a review is needed within four years of publication of a new BREF guide. As BREF guides are published every c.10 years, this means that technology can be used in the EU that is up to 14 years old. Clearly, BREF Guidance reviews need to be more rapid for this approach to be more effective at controlling energy consumption.
A limitation of eco-design options for large complex furnaces is that these designs need to be very varied, and thus their typical performance parameters may also vary within a very large range. Also, if all furnaces/ ovens are required to meet a specific BAT eco-design option, some will already meet the requirements, whereas some will require relatively small changes, and others may require very significant investment. There are also many different technical constraints. Therefore, although using the eco-design directive to regulate industrial furnaces and ovens could reduce both energy consumption and GHG emissions, to be most effective it would need to impose many different requirements for each type of process, in order to ensure the biggest energy saving without making some EU manufacturers uncompetitive. Within Task 6, the LCC will later be demonstrated, but as the cost to meet eco-design options is very varied, LCC for each furnace process also varies considerably. The option of using IED to regulate energy efficiency could be an effective alternative approach, but IED would need to be changed first. It may be possible to change the way that the IED regulates energy efficiency to be more effective, but note that this would require:
• Permits renewed only if BAT is utilised – this should already occur but needs to be monitored;
• More regular audits to ensure BAT is being utilised; for example, IED permit reviews could be stipulated at a maximum of every 4 years. Such a regime of more frequent reviews should also ensure that maintenance is carried out correctly, as this can also be a key issue in saving energy;
• The energy efficiency of furnaces (e.g. expressed in kWh/tonne) in IPPC BREFs should be more frequently updated and should be used as minimum standards for granting and renewing permits by Member States;
ERA Technology Limited ERA Report No. 2012-0230
043122753 ENTR Lot 4 Final Report v6 348 © ERA Technology Ltd
• The energy efficiency BREF and sector-specific BREFs, where appropriate should give details of BAT for heat recovery, insulation and gas/air ratio. Other eco-design options that affect energy consumption may also be specified such as BAT kiln car materials, water cooling and energy consumption for drying processes.
• Minimum energy efficiency standards should be imposed by independent technical experts. Users of furnaces and furnace manufacturers have a potential conflict of interest (users will want more lenient requirements and furnace manufacturers may want more stringent requirements although at the same time not wanting to upset their customers).
• Commission Decision 2012/119/EU, published in February 2012, may help to make IED BREF guides more effective for energy efficiency. This Decision states that a maximum period between publication of BREF guides should be eight years, and it lays down timetables for preparation and publication of guides, which are at most 39 weeks (just over 3 years); therefore, new guides could be available much more frequently than is currently normal. It emphasises that current energy consumption levels for new equipment should be included, as well as defining BAT. For IED to be effective in reducing energy consumption, it would be necessary for national permit limits to be based on BAT values, not the average of energy consumption of furnaces that are being installed. The above-referenced Decision states that more details of economics should be included than at present. Currently, it is common for BAT designs to be described in some detail, but the economic data is omitted. The Decision also recommends that working groups should include suppliers (i.e. furnace, insulation, burner manufacturers, etc.) as well as users.
IED is potentially an alternative to eco-design but not in its present form. The vast technical detail in IPPC BREFs is potentially a more effective way of ensuring that all processes, irrespective of their complexity and diversity, can be required to be as energy efficient as possible. However, to achieve this, the necessary changes to IED and the associated BREFs will be needed, and a lot of work may be necessary to ensure that the relevant, up-to-date energy consumption information is available to Member States so that they can set permit levels. A significant advantage of using IED instead of eco-design would be that IED includes all the existing stock of furnaces; consequently, the IED so would regulate rebuilds, and would accelerate the replacement of old inefficient furnaces, as well as regulating new installations. The use of IED/ BREFs could also ensure that maintenance was being carried out, by requiring users to monitor energy consumption, and to ensure that it does not increase above levels specified by permit requirement. Member States would need to carry out time-limited random unannounced audits to ensure that this requirement is being met.
Carbon taxes For processes that are outside the scope of ETS, there are plans for carbon taxation which, if adopted, will affect small and medium size furnaces and ovens. However, unless these taxes are very large, they may not influence users where energy costs are a small proportion of production costs. The Energy Taxation Directive 2003/96/EC will affect furnaces and ovens that are excluded from ETS and may enter force in 2013 if Member States can agree on tax levels. As this would increase energy prices, it could act as an incentive for energy efficiency savings as long as the increased cost does not cause carbon leakage.

ERA Technology Limited ERA Report No. 2012-0230
043122753 ENTR Lot 4 Final Report v6 349 © ERA Technology Ltd
Carbon taxes are charged in some EU States, such as the Climate levy in the UK (see section 1.5.2). Carbon taxes on industry sectors that are not in scope of ETS or IPPC/ IED are an additional incentive for energy efficiency by larger energy consumers although where the cost of energy is a small proportion of production costs, this may not be very influential.
An EU carbon tax for industry outside the scope of ETS has been encouraged by the European Parliament208. Note also that paragraph 26 of this reference recommends taxation of imported products to reduce the competitive disadvantage to EU manufacturers from carbon taxes.
In practice, increasing energy prices will encourage energy efficiencies, particularly where energy costs are a large proportion of production costs. Global energy price rises seem likely but are difficult to predict in the long term. However, stakeholders have said that if energy prices were to triple, then most large users would probably ensure that they achieve the proposed Tier 3 heat recovery eco-design options. Unilateral price increases only within the EU as a result of taxation will however have a similar effect except that some users will consider relocation outside the EU (carbon leakage). This will limit the effectiveness of EU energy and GHG taxes to encourage energy savings as beyond a certain energy price, manufacturers will relocate. Imposition of eco-design options also increases users’ costs and so could have the same effect. Therefore, it will be necessary to consider a variety of policy options as discussed in Task 7.
6.1.4 How will market forces address eco-design options Business as usual (BAU) should result in a gradual decrease in energy consumption and GHG emissions because of the high and increasing cost of energy. Energy efficiency is also encouraged with larger installations by the EU ETS, national carbon taxes and incentives and to some extent by the IED. This Task compares BAU reductions in energy consumption and GHG emissions with any reductions that could be achieved by eco-design options.
Laboratory (BC1) – Currently users are not able to compare the energy consumption of different models of laboratory ovens and furnaces as this is not available and so this does not affect purchase decisions. However, users are increasingly concerned about energy costs and so are likely to take energy performance into account when buying new laboratory ovens and furnaces as long as the more energy efficient products are not significantly more expensive. Historically laboratory equipment users have made decisions first on function and then price, and energy information has not played a great role, partly because this information has not been available. Price will continue to be important but some stakeholders have stated that energy costs are increasingly used to make purchase decisions and so having to provide energy consumption information will act as an incentive to design lower energy consumption products.
Industrial (BC2 – 7) – The importance of energy costs depends on the proportion of production costs that is due to energy and the amount of energy used. All manufacturers who use very large amounts of energy are aware that energy savings increase profits but all users 208 http://www.europarl.europa.eu/meetdocs/2009_2014/documents/econ/pr/834/834408/834408en.pdf See paragraphs 23 – 27. This has also been proposed - http://www.carbontax.org/issues/border-adjustments/

ERA Technology Limited ERA Report No. 2012-0230
043122753 ENTR Lot 4 Final Report v6 350 © ERA Technology Ltd
are constrained by availability of capital for investment (see section 5.5). However, for industrial users, there is the additional option for new installations that these can be located anywhere in the world. When considering installing a new process, the investment decision is made from many factors including the size of the investment and the return on this investment. The return on investment is rarely decided on the full life of the installation but on a shorter period for several reasons:
• To minimise long-term debts and interest payments. Large debts are often not viewed favourably by capital markets
• The amount of money available from investors is limited so is used for projects with the largest ROI unless it is needed for safety equipment or to comply with legislation.
• Long-term profitability is less certain than short-term profits, so payback of investment within a relatively short period is preferred.
• Returns made in the future are worth less that short term returns and these are based on discount rates
The investment decision takes into account:
• Labour costs (which are lower in developing countries than in the EU) • Projected future energy costs will influence the extent that energy-saving measures will be
incorporated • Incentives and subsidies, which are available in many countries outside the EU. In some of
these third countries, this includes subsidised energy; the subsidised energy price may be only half the cost of energy in some EU Member States.
• Compliance costs which can be higher in the EU than most developing countries as emissions of hazardous substances are regulated at least for larger installations
• The effect of ETS on profitability. Although this encourages reductions in GHG emissions, some stakeholders have claimed that it can prevent expansion of capacity as this would increase GHG emissions, despite new capacity being more energy efficient.
• Transport costs – this discourages production in distant locations for heavy low value products such as bricks, steel and cement as transport costs are very significant. Transport costs are however, much less significant for higher value and lightweight products.
• Technical and quality issues – these often favour EU locations, as technical expertise is often more readily available so that less wastage occurs, quality can be better and delays in production can be reduced when stoppages occur due to technical problems. These issues can often be overcome elsewhere in the world with sufficient time and effort.
These issues create a complex calculation which determines where a user will install a new process and its energy consumption. In fact businesses do not always make good decisions due to the financial and other constraints discussed in section 5.6. In the last few decades, there has been a trend to relocate production to locations outside the EU and this is shown

ERA Technology Limited ERA Report No. 2012-0230
043122753 ENTR Lot 4 Final Report v6 351 © ERA Technology Ltd
by the decrease in EU furnace consumption in figure 6. This trend is bad for EU jobs, for the EU balance of trade, and frequently also has a negative effect overall, on global emissions of GHG and other pollutants. Outside the EU, toxic industrial emissions are not as well regulated and energy efficiency may be inferior to the EU 209 . In many countries including China, electricity generation uses much higher proportions of coal than the EU so there are higher GHG emission/kWh generated. Some stakeholders also report that new furnaces designed for some markets outside the EU have to be of an inferior performance (i.e. less energy efficient) than those that would be required in the EU.
The effect of relocation of industry out of the EU is to reduce the EU’s domestic GHG emissions, but such actions only move the emissions to other countries so that global emissions do not change and may increase. The actual GHG emissions due to each EU citizen (and all non-EU countries) would be more accurately determined by including the emissions from production of imported goods when determining the total EU or EU Member State GHG emissions. It has been estimated that GHG emissions from the manufacture and transport of products consumed in the EU but made outside the EU adds significant GHG emissions to the EU’s total210 and this effect is larger in some EU States than others. The Carbon Trust has calculated that total consumption emissions are greater than national GHG emissions, as follows211:
UK 34% higher
Germany 29% higher
France 43% higher
Sweden 61% higher
The figures for France and Sweden are higher than UK and Germany because of the lower carbon intensity within these countries.
A proportion of the energy used to produce imported goods is due to furnaces and ovens, and these cannot be regulated by EU eco-design legislation.
It is necessary to determine how market forces will address eco-design options, i.e. will they be adopted without legislation and what effect legislation will have. The following issues are important:
Heat recovery – Small and medium-size furnaces rarely have heat recovery and so an eco-design requirement could give significant energy savings. Large furnaces usually have effective heat recovery and so the scope for further savings is smaller and also very dependent on the process. The cost of further heat recovery savings for large furnaces is also very variable and depends on the currently used technology and what else is feasible. 209 Industrial Development Report 2011, Industrial energy efficiency for sustainable wealth creation. UN Industrial Development Organization http://issuu.com/unido/docs/unido_full_report_ebook?mode=a_p chapter 2 210 “Consumption based accounting of CO2 emissions” S. J. Davis and K. Caldeira, March 2010, from www.pnas.org/cgi/doi/10.1073/pnas.0906974107 211 “International Carbon Flows”, Carbon Trust report CTC795, 2011.

ERA Technology Limited ERA Report No. 2012-0230
043122753 ENTR Lot 4 Final Report v6 352 © ERA Technology Ltd
Insulation – There are many constraints with insulation. The choice of material depends on the process, process temperature and process cycle time. A heat loss through insulation comprises a smaller proportion of the input heat than the heat lost in combustion gases, but the additional cost can be significant, especially for continuous furnaces. There are also other heat losses that are more difficult to define, such as around doors, etc which can be as large as insulation heat losses.
Fuel / air ratio – Furnace and oven manufacturers can design gas and oil burners with flow control that can be adjusted to give the optimum performance in terms of energy consumption and safety, but users will need to be able to make adjustments to allow for changes in piped gas supply composition. Although users should be able to adjust fuel / air ratio to λ values as low as 1.10, they may set higher values and consume more fuel to avoid the risk of toxic carbon monoxide emissions that could occur when gas composition changes occur. The difference in possible EU energy consumption between an optimum ratio of c.1.2 and a commonly used ratio of 1.4 is up to 10% of EU furnace gas consumption, and is therefore very significant. Any measures that can be adopted to make gas composition changes less common and to provide warnings in advance of changes would allow users to adjust their burners closer to the stoichiometric ratio.
Energy consumption information for SMEs - For small and medium size furnaces and ovens, stakeholders report that it is often not possible to obtain energy consumption data before they make purchase decisions. A requirement to provide this information would therefore be beneficial. This is unlikely to affect prices significantly and it will act as an incentive to oven and furnace manufacturers.
Payback periods - Many users have policies that limit pay-back times for repayment of additional investment costs such as the addition of a heat exchanger to recover and reuse waste heat. These times vary from 6 months to 3 years and are an artificial measure to control and limit capital investment, although in practice, all users will accept longer pay-back periods. In practice, however, payback period limits on investment are used only for small projects where it is not worthwhile carrying out complex financial calculations to determine the likely ROI. For larger projects, payback periods are not used and the ROI is calculated taking into account net present value. Most manufacturers expect an ROI of at least 15% and up to 30% may be expected. As long as returns are good from energy efficiency measures, then this can be equivalent to payback periods of as long as 5 years or even slightly more for low risk long lifetime processes. ROI that are equivalent to payback periods of over 7 years would however usually be unattractive.
The aim of eco-design requirements would be to prevent the installation of lower energy efficiency designs, but increasing equipment prices will prevent investment for two reasons: (A) if this reduces ROI to <10%; or (B) if the price of new equipment exceeds the investment funds that are available (see financial constraints in section 5.6).
Compromise decisions - Users of large furnaces and ovens which have energy costs that are a high proportion of production costs already have an incentive to reduce energy consumption. However, information from stakeholders shows that users usually compromise so that the BAT designs are not installed, and that further savings would be achievable with larger investments, which can often have short pay-back times, in some cases, of less than
ERA Technology Limited ERA Report No. 2012-0230
043122753 ENTR Lot 4 Final Report v6 353 © ERA Technology Ltd
one year. Therefore although market forces will reduce energy consumption in the EU, this will not be by as much as would be achieved by legislation, with the caveat that this applies as long as “carbon leakage” does not occur as a result.
The issues described here therefore show a complex combination of market forces that influence decisions on eco-design options, as well as where to locate new installations.
Rebuilds and refurbishment
A separate issue concerns rebuilds and refurbishment of existing furnaces. This occurs sometimes because old furnaces are worn out but may also be because new technology can be used to replace part or most of the existing structure with a more energy efficient design, that the pay-back time is sufficiently short and the return on investment sufficiently attractive. This is an opportunity to reduce energy consumption as a new for old replacement but energy consumption could be minimised if the eco-design options were followed. As with new furnaces and ovens, the same economic arguments exist for rebuilds. However there is also the investment in the remaining parts of the installation to consider. For example, it is very unlikely that a new steel blast furnace will be installed in the EU, but existing blast furnaces in the EU are rebuilt fairly regularly. When large furnaces such as glass melters and cement kilns are rebuilt, energy consumption is minimised as far as possible within financial and technical constraints. With small and medium sizes, however, these are usually refurbished to a similar specification to that when they were first built; there are rarely additional energy saving features added.
Barriers for energy intensive sectors
The study of European competitiveness by Ecorys published in 2011212 found that there are barriers that limit energy savings in the largest energy-consuming furnace sectors.
• Cement – This above study found that there is little scope for further energy savings, although savings would be realised by replacing old designs for new; however, it should be noted that the eco-design directive per se cannot accelerate old furnace (still being used) replacement. The only way to gain further improvements would be from more research, or via substitution, using alternative cement materials, as described elsewhere in this report.
• Steel – There is little scope for reducing GHG emissions from the process used in the EU due to the large amount of coke used. Alternative processes being developed by ULCOS will not be available within 10 years and will require very large investments to be commercialised and - to be realised - reasonable ROI must be achievable. Savings would be achieved by new-for-old rebuilds.
• Glass – as re-melting scrap glass consumes much less energy than production of new glass, any measures to improve collection rates will reduce GHG emissions. Currently collection rates vary considerably across the EU ranging from 10% in Cyprus to 96% in Belgium for glass containers. Collection rates for other types of glass are much lower. As
212 Study on the competitiveness of European Companies and Resource Efficiency, by Koen Rademaekers, Sahar Zaki, Johannes Berg of ECORYS for the European Commission, 2011

ERA Technology Limited ERA Report No. 2012-0230
043122753 ENTR Lot 4 Final Report v6 354 © ERA Technology Ltd
explained elsewhere, more research is needed to accelerate the adoption of new technology such as batch pre-heaters to reduce energy consumption.
• Non-ferrous metals – as with glass, recycling of scrap metals consumes much less energy than manufacture of primary metals. However, the quantity of scrap exported out of the EU has been increasing for several years. This would not increase global GHG emissions if the most efficient technology were always used but the EU has no control over furnace designs outside the EU, and often less efficient designs are used. Research will be needed for further technology improvements but this would be costly, and so would benefit from financial incentives.
In conclusion therefore, BAU for these energy-intensive processes will give a reduction in energy consumption as old furnaces are replaced. However, there is likely to be some carbon leakage due to lower production costs outside the EU but with no net global GHG benefit. There is little further scope for technology improvements to install even more efficient designs than is current practice in some sectors and more research will be needed in others. Any improvements will be expensive and so may not be realised due to a shortage of capital for investment. Stakeholders within these sectors have said that these processes are as efficient as possible within financial constraints and so eco-design options could not achieve further energy savings. It is true that the potential for further energy savings is limited but some are achievable although in many cases with relatively long payback periods. There appear to be technical constraints within these sectors so that eco-design options would be limited but according to the Japanese Furnace Manufacturers Association (JIFMA), the steel and cement sectors were able to comply with the requirements of the Japan Energy Act by 1993.
6.1.5 Effect of eco-design options on new designs Furnaces and ovens on the EU market have very variable performance although this is in part due to different functional requirements which are process specific. For example, glass melting furnaces must have much higher insulation surface heat loss (in W/m2) than ceramics kilns. However, according to stakeholders who provided performance parameter data, there are also variations in performance of furnaces and ovens designs for each type of process. This variation is described here comparing typical performance with each eco-design option Tier.
Heat recovery Intermediate Tier 1 – CECOF have indicated that most furnaces and ovens, irrespective of size will be able to achieve the Tier 1 eco-design option. However, discussion with individual manufacturers has shown that:
• Designs used for some processes either currently do not have heat recovery; • Some types of furnace (>1000°C) have some heat recovery but recover less than 40% of
heat of combustion gases leaving the furnace chamber and lower temperature processes recover even less heat although may achieve 600°C (calculated at 3%O2);
ERA Technology Limited ERA Report No. 2012-0230
043122753 ENTR Lot 4 Final Report v6 355 © ERA Technology Ltd
• Many types of large furnaces should be able to comply with Tier 1. Stakeholders performance parameter data showed in table 118 that for processes of <1000°C, flue gas temperature varied between from c.300°C to 900°C but that for those with average values 600 - 1000°C, stakeholders stated that <600°C was achievable as BAT;
• For large furnaces with process temperatures of >1000°C, CECOF recommended 40% heat recovery but relatively few stakeholders provided data in this format. It is probable however that many types of large furnace will already achieve 40% heat recovery. For example, brick kilns use long preheaters which recover and use heat from combustion gases emerging from the main kiln chamber. Cement kiln combustion gases are used in precalciners and pre heaters. As the combustion gases emerge from the kiln at c.1000°C and are emitted after precalciners and preheaters at an average of 265°C, this indicates that >40% of heat is recovered and used. A manufacturer of flat glass has stated that regenerative flat glass melters recover and reuse at least 40% of combustion gas heat and that container glass melters are more efficient and recover more heat as they can use a higher percentage of cullet (recycled glass). Performance parameter data for large >1000°C furnaces shows that average flue gas temperatures vary and from some processes exceeds 600°C which indicates that <40% heat is recovered. However, in all but one of the examples of large, >1000°C furnaces in table 118, BAT flue gas temperatures were <600°C indicating that 40% heat recovery would be achievable. However, a stakeholder has stated that forging furnaces may not currently achieve Tier 1 and tunnel bakery ovens will also not currently meet the 40% recovery requirement so designs will need to be changed;
• For smaller furnaces and ovens, data in tables 118 and 119 shows several examples where the Tier 1 eco-design options are not met, even by BAT. This is partly because the cost of a heat exchanger or recuperator is relatively high in proportion to small / medium furnaces and so payback times are longer than 3 years. This has had the result that as large and efficient heat exchangers would be too expensive, they are not used.
Intermediate Tier 2 – The Tier 2 eco-design options are based on the average values provided by stakeholders. This reflects the lower % heat recovery and higher flue gas temperature values for small and medium size compared to large size furnaces. For large >1000°C furnaces, 40% heat recovery is the eco-design option, the same as Tier 1. Emitted combustion gas temperatures are lower than the Tier 1 value for processes <1000°C and are based on average and best values in table 118 so should be achievable for most types of furnace and oven. Very few stakeholders have provided price information for the Tier 2 option so it is difficult to predict how manufacturers and users will respond to Tier 2.
BAT Tier 3 – Most new furnaces and ovens will not currently meet the BAT eco-design option and one aim of Task 6 is to determine the life cycle cost of achieving these options.
Insulation Intermediate Tier 1 – This eco-design option is already used in Japan although will not be achievable by a few types of process such as glass melting and cement kilns which are excluded from the Japanese insulation obligation as they are types that require forced air cooling (the insulation obligations are technically not possible, since the surface temperatures for such kilns will not reflect insulation performance, and measurement is also supposed to be

ERA Technology Limited ERA Report No. 2012-0230
043122753 ENTR Lot 4 Final Report v6 356 © ERA Technology Ltd
carried out in still air). The temperatures are maximum average values excluding heat bridges, and so exclude hot spots such as those which occur at edges of doors and burners. Most stakeholders who responded stated that they can already comply with Tier 1, with the exception of glass melting furnaces, cement kilns and rotary melting furnaces, for technical reasons. If the designs that are exempt in Japan are excluded it is likely that the Tier 1 insulation eco-design option would be BAU for most designs and so improvement would be achieved utilising this option.
BAT Tier 2 – Two options are considered for Tier 2; either a maximum average temperature or a maximum emitted heat output in W/m2. As explained above, the definition of an average temperature is not straightforward. The performance parameter values provided by stakeholders do not make the same assumptions and thus care is needed when comparing data from different stakeholders. W/m2 data is less ambiguous, although less data was provided in this format.
• Average temperature option – several stakeholders have provided comments that the temperature limits were not achievable for several reasons (despite others claiming that they are achievable). In some cases, there are good technical reasons why these temperatures cannot be achieved but cost is another reason;
• W/m2 option – The heat output limit for furnaces is already achieved by the best designs of some types of large furnace so this is clearly achievable except where technical constraints exist. Achieving the 400 Wm2 limit may cause difficulties with smaller designs because to reduce heat loss, thicker insulation is needed and this will make the furnace or oven significantly larger and so a larger space is needed. Another issue is whether the heat loss in W/m2 is solely from the insulation or the entire wall area. One manufacturer of medium-size electric furnaces has pointed out that achieving 400W/m2 may be possible if this is calculated from the internal and external temperatures, the thickness and the thermal conductivity of the insulation but if the actual W/m2 is measured, a much high value is measured due to heat loss via the connections to the heating elements (a heat bridge). An example give by a stakeholder is that the calculated wall temperature was 320W/m2 for an 1100°C furnace but when heat loss was measured (with an infrared camera) after 6 months in use, a value of 640W/m2 was found, with most of the difference being due to the heating element conductors.
Gas/air ratio Two tiers are considered:
• Intermediate Tier 1 limit of 1.25 – Many stakeholders say that 1.25 is technically achievable for many types of furnace and oven and this value is required by the Japanese legislation for several types of furnace.
• BAT Tier 2 limit of 1.15 – Based on feedback from two manufacturers stating that a λ of 1.10 is achievable, and a few others that a λ of 1.15 is achievable.
Achieving these ratios can be achieved by equipment that measures the oxygen and carbon monoxide concentrations of combustion gases and using manual control of gas and oxygen flow rates. This however relies on stable fuel composition as discussed in section 5.6.2. This

ERA Technology Limited ERA Report No. 2012-0230
043122753 ENTR Lot 4 Final Report v6 357 © ERA Technology Ltd
option would not significantly influence new designs but would encourage the greater use of combustion gas analysers. The situation for large furnaces with many burners may be different, as manual adjustment may not be feasible, whereas automatic control would need significant additional relatively expensive equipment.
Energy information The provision of energy information is a qualitative eco-design option that would act as an incentive for better designs, with lower energy consumption. This approach will be particularly effective when the users have high energy costs or have policies in place to reduce their overall energy consumption.
• BC1 – This would be influential because at present, it is not possible for users to obtain this information. Many users will be aware of environmental issues and will want to limit energy costs and so this will act as an incentive to manufacturers to modify their designs, to use less energy.
• BC2 - BC5 – Energy consumption is sometimes available but not always and it can be presented in a variety of ways. Users have indicated that energy consumption is one of the issues that influence purchase decisions, but is not always available, and so if this was a requirement, it would act as an incentive to better eco-design as manufacturers would not want their products to appear to be less efficient than those of their competitors.
• BC6 and BC7 – This will have very little influence, because this information is already available
Labelling and information for users. Energy labels may be applicable only to the laboratory sector as these would be based on standard energy measurement methods which can be used only where large numbers of each model are produced. Some users of small and medium-size (and most users of large-size) industrial ovens and furnaces including custom designs consider energy consumption in their decisions to purchase so a requirement to provide accurate energy information would act as an incentive for manufacturers to minimise consumption. Some users will expect performance to be maintained so that the initial good performance will not rapidly deteriorate due to poor design. Therefore, the energy information could for example include the maximum energy consumption to be expected after one or more years in normal use. This approach is already used for most large furnaces and ovens and users are usually able to obtain very detailed and accurate energy consumption predictions. Some designs consume an increasing amount of energy in normal use such as glass melting furnaces but several stakeholders have said that some lower-priced small and medium batch multipurpose ovens and furnaces deteriorate due to poor design, at rates which are considerably faster than better-designed equipment. If this option is to be effective, the energy information accuracy would need to be enforced.

ERA Technology Limited ERA Report No. 2012-0230
043122753 ENTR Lot 4 Final Report v6 358 © ERA Technology Ltd
6.1.6 Size of disparity between products on the EU market and the eco-design options
The size of the energy consumption disparity is the difference between the average performance of new furnaces and ovens being placed on the EU market, compared to furnaces and ovens that would be regarded as having BAT performance. Smaller differences exist when intermediate eco-design options are considered.
The size of the decrease in energy consumption has been estimated for each industrial base case (BC2 – 7) using stock data and estimated energy savings derived from the difference between average and BAT performance parameter data in section 5.3 from stakeholders with the average heat lost by each route. For example, if an additional 30% of heat can be recovered from combustion gases and combustion gases account for 50% of all heat losses, then an energy saving of 30% x 50% = 15% saving is feasible. Savings by each of the three main eco-design options; namely heat recovery, insulation and gas/ air ratio have been calculated, as well as total values.
Percentage energy consumption reductions are determined from performance parameter data supplied by stakeholders and other data from all other sources referred to in this report. These values are given in the table below as percent reduction in energy consumption for small and medium-size industrial furnaces and ovens for each eco-design option.
Table 137. Estimated percent energy savings for BC 2 – BC5
TypeHeat recovery
(%)Improved
insulation (%) Gas/air (%)Others (vent,
design, etc) (%)Theoretical totals (%)
BOe 2 5 7BOg 15 2 5 2 24COe 3 5 8COg 15 3 5 2 25BFe 3 5 8BFg 15 3 5 2 25CFe 5 5 10CFg 15 5 5 2 27
The above heat recovery, improved insulation and gas / air values are from performance parameter data submitted by stakeholders. “Others” is an estimate of energy savings that may be possible at least for some designs, as obtained from publications which are described elsewhere in this report. The total will be only an approximation but gives an indication of energy savings (in addition to heat recovery, insulation and gas/air ratio) that may result from good engineering design that should be encouraged by the eco-design option for providing energy consumption information.
The table below gives the calculated reduction in energy consumption for each of the small and medium-size base cases in TWh/year using the assumptions in the table above. Values are given for heat recovery, insulation and for gas/air ratio.

ERAT
echn
ology
Limite
dER
ARep
ortN
o.20
12-02
30
0431
2275
3ENT
RLot
4Fina
lRep
ortv6
359
©ER
ATech
nolog
yLtd
Table
138.
Calcu
lation
used
tode
term
ineTW
h/ye
nerg
ysav
ingsf
orea
chme
dium-
sizef
urna
cean
dove
ndes
ignSm
allan
dmed
iumind
ustri
alDa
tafro
mtab
les28
,29a
ndse
ction
5.3
Type
Aver
agea
nnua
len
ergy
cons
umpt
ion(M
Wh)
Stoc
k
Total
cons
umpt
ionGW
h/yIm
prov
emen
tpo
tentia
l(%)
Total
poten
tial
annu
alen
ergy
savin
gTW
h/ySa
ving
from
heat
reco
very
Savin
gfro
mins
ulatio
nSa
vingf
rom
gas/a
irBO
e20
016
5,000
33,00
07
2.31
00.6
600
BOg
760
14,35
010
,906
242.6
21.6
360.2
180.5
45CO
e23
016
,120
3,708
80.3
00
0.111
0CO
g87
61,4
001,2
2625
0.31
0.184
0.037
0.061
BFe
200
119,5
0023
,900
81.9
10
0.717
0BF
g76
010
,390
7,896
251.9
71.1
840.2
370.3
95CF
e23
011
,670
2,684
100.2
70
0.134
0CF
g87
61,0
1588
927
0.24
0.133
0.044
0.044
Tota
ls9.9
33.1
42.1
61.0
5
TWh/y
stock
Them
ostsig
nifica
nten
ergys
aving
sare
forba
tchpro
cesses
(BC2a
nd4)
beca
usethe
seacc
ount
forc.9
0%of
these
base
cases
BC2
–5.
Altho
ugh
gas
furna
cesan
dove
nsacc
ount
foron
lyc.1
0%of
base
cases
BC2-
5,tot
alen
ergys
aving
sfrom
heat
recov
eryare
signif
icant.
Thet
able
below
show
sthe
equiv
alent
data
forlar
ge-si
zefur
naces
(BC6)
ando
vens
(BC7)
assum
ingtha
tthe
poten
tials
aving
scan
bema
defor
allBC
6and
7fur
naces
ando
vens
,but
withd
atafor
electr
ically
heate
dfurn
acesc
alcula
tedsep
aratel
ytof
ossilf
uel(g
as)fur
naces
ando
vens
.Ta
ble13
9.Es
timat
eden
ergy
savin
gsfor
BC6&
BC7
Larg
e-size
indus
trial
Type
Numb
ersto
ck
Aver
agee
nerg
yco
nsum
ption
(MW
h/y)
Total
annu
alen
ergy
cons
umpt
ionTW
h/y)
Heat
reco
very
Insula
tion
gas/a
irOt
hers
Savin
gfro
mhe
atre
cove
ry
Savin
gfro
mins
ulatio
n
Savin
gfro
mga
s/air
Total
(TW
h/y)
Gaso
ven
3,050
15,46
447
101
04.7
20.4
70
5.19
Gasf
urnac
e10
,936
98,36
51,0
7610
25
107.5
721
.5153
.7918
2.87
Electr
ic26
018
0,000
470
0.50
00.2
340
0.234
Total
s11
2.29
22.22
53.79
188.2
9
Impr
ovem
entp
oten
tial%
TWh/y
ears
aving
spot
entia
l
.

ERA Technology Limited ERA Report No. 2012-0230
043122753 ENTR Lot 4 Final Report v6 360 © ERA Technology Ltd
There are three main types of large-size electric furnaces; electric arc, some glass melting and some metal melting. Of these three designs, the electric arc type is by far the most significant, in terms of energy consumption. Electric arc furnaces are large energy consumers, and thus new furnaces are relatively energy efficient; therefore, the improvement potential should be relatively small in comparison with fossil fuel furnaces and ovens. The available improvement options also have several technical constraints described in section 5. In practice, the disparity will be smaller than the potential savings listed in the two above tables, especially for BC6, because a number of the eco-design options are unsuitable for some processes as discussed below in section 6.2, Table 140 and the following tables and some of the largest BC6 furnaces are already as efficient is possible. Types where new furnaces installed in the EU probably cannot be further improved beyond business as usual include:
• Cement kilns with pre-heaters, pre-calciners and heat recovery from combustion gases • Parallel flow regenerative lime kilns – already very efficient due to this innovative design • Steel production – it is less clear whether further improvements are achievable. Stakeholders in
this sector have not provided performance parameter data that would show whether energy savings are achievable. However previous studies that are mentioned elsewhere in this report have concluded that there is little potential for energy savings beyond those achieved by newly-installed furnaces in this sector
Cement and lime kilns account for c.300TWh/year in the EU so if these are excluded from Table 139, the large-size energy saving potential (disparity between BAU and eco-design options) is 56TWh/y; thus the actual potential disparity for large-size is 132TWh/y. If steel production were also excluded, then the large-size disparity would be c.58TWh/y although this may be over-pessimistic, therefore the actual value could be larger as some eco-design improvements in steel production are probably achievable213. Another limitation is that heat recovery energy savings and gas/air energy savings are not additive and an allowance is made for this in calculation of eco-design option impacts
Many stakeholders have stated that it is not possible to gain further energy savings beyond those already achieved but this is due to financial constraints. They also point out that if energy prices were to increase, then further energy savings would be achievable and so eco-design BAT is clearly not the same as the “best” designs that are currently being installed. Cost constraints are however important in this sector because users have the opportunity in many cases to install furnaces outside the EU if costs in the EU are too large.
The scope for energy savings may however be increased if types of furnace have not been included in the calculations due to a lack of data from stakeholders and from published sources. This may apply to furnaces used in oil refineries and for chemical manufacture which are large energy consumers.
Another opportunity for reducing EU furnace energy consumption is to accelerate the replacement of old furnaces by new furnaces. Old (>20 years) furnaces usually are much less efficient than new so their replacement can achieve large energy savings. However, due to the long lifetimes, savings will take a long time to be realised. Policy options that accelerate replacement would, however, increase annual energy savings and so should be considered.
213 This is difficult to estimate as the steel sector has not provided data for this study. Comments from stakeholders from within the steel industry however indicate that when furnaces are rebuild, the inclusion of new energy saving features is limited by the available investment and so more could be done.

ERA Technology Limited ERA Report No. 2012-0230
043122753 ENTR Lot 4 Final Report v6 361 © ERA Technology Ltd
Rebuilds In the above calculations, rebuilds were excluded as it is uncertain whether EU Member States will consider these as being “new” and so eco-design options would apply. The types of furnace that are rebuilt and potential energy savings beyond BAU may be achievable are as follows:
Process Number of rebuilds annually Energy saving beyond BAU Steel production Up to 10 refurbished / rebuilt annually Unclear but may be significant due to the
very large fuel consumption in this sector Cement and lime kilns
2 per year Probably small
Flat glass melting 3 – 4 per year *220GWh/y x 10% (heat recovery) x 3.5 = 77GWh/y
Container glass melting
Up to 25 per year *53GWh/y x 10% (heat recovery) x 25 = 132.5GWh/y
Petrochem Not known but replacement of furnaces within refineries likely to be called “rebuilds”
No data from stakeholders in this sector so assuming that a 10% saving is achievable, we estimate could be c.10TWh/y, possibly more
Others Rebuilds are more unusual in other sectors; more are likely to be replaced by new furnaces.
Unknown, but may be significant
* Annual furnace energy consumption from Table 55 multiplied by number of rebuilds and eco-design BAT percent energy saving from heat recovery estimated at 10% for all large furnaces.
6.2. Analysis BAT and LLCC In this Task, the costs and environmental impacts of a variety of eco-design options have been determined, however, each option is suitable only for certain types of furnace and oven. These are listed below:
Table 140. Eco-design options used for base cases and their suitability Option Description Suitability BC1 option 1 Energy information Laboratory ovens BC2 – 5 heat recovery 1
self-regenerative burner (recovers 30 – 40% of energy from combustion gases)
Suitable for most gas burner furnaces and indirect ovens where very little dust is produced. Unsuitable for low power ratings as smallest self-regenerative burner is 150kW. Used for heat treatment furnaces, metal melting, etc. Option 1 assumes 1 burner but larger furnaces have multiple burners. These use more gas so the % energy saving and payback time will be similar
BC2 – 5 heat recovery 2
External triple pass recuperator (a type of heat exchanger) Recovers c.20% of energy from combustion gases
More expensive option than option 1 so would be used where option 1 is not suitable, e.g. dusty processes (for gas / oil burners only)

ERA Technology Limited ERA Report No. 2012-0230
043122753 ENTR Lot 4 Final Report v6 362 © ERA Technology Ltd
Option Description Suitability BC2 – 5 insulation
Double insulation thickness to achieve wall loss of <500W/m2.
Suitable for all designs except rotary and where rapid and controlled heat loss through insulation is needed for technical reasons. This option will also be unsuitable for furnaces of >1250°C as different types of insulation must be used such as polycrystalline alumina which has a price of 15 times that of Alkaline Earth Silicate (AES). Furnaces of >1250°C are, however, a very small proportion of BC4 & 5 furnaces
BC2 – 5 gas / air
Control of gas / air ratio with combustion gas analyser to achieve λ = 1.15
Suitable for all gas and oil burner furnaces and indirect ovens except where a reducing atmosphere is required
BC6 heat recovery
Use hot air to burners, increase heat recovery by c.15%
Suitable for large furnaces where recovered hot air is available, e.g. from air cooling hot product or from a heat exchanger. Usually used instead of regenerative and recuperative burners
BC6 heat recovery
Increase size of external recuperator / heat exchanger – increases heat recovery to >55% (so BAT)
Suitable for those furnaces with scope for additional heat recovery beyond that already used. Would not be used if oxy-fuel burners are used
BC6 heat recovery
Install steam generator to use excess heat (increases heat recovery to >55% so BAT)
Suitable for all large-size furnaces but only if the steam can be used
BC6 insulation Double thickness of insulation to achieve wall losses of <400W/m2.
All furnaces except rotary furnaces and those requiring forced cooling (so excludes cement kilns, rotary melting and smelting, glass melting, etc.)
BC6 gas / air Control of gas / air ratio with combustion gas analyser to achieve λ = 1.15
Most types of furnace but excludes furnaces requiring reducing atmospheres, and would not be used if oxy-fuel burners are used
BC7 heat recovery
Install heat exchanger to recover heat from hot air or hot combustion gases Achieve heat recovery of >50%
Higher temperature processes (above about 200°C). Also suitable for indirect fired ovens
BC7 insulation Double thickness of insulation to achieve <200W/m2.
All types
BC7 gas / air Control of gas / air ratio with combustion gas analyser to achieve λ = 1.15
Indirect fired ovens only. Also unsuitable for ovens heated by recovered heat from other processes, such as furnaces
The table below contains estimates of the proportion of new furnaces and ovens for which each eco-design option would be suitable (100% of laboratory ovens are suitable for BC1 option 1 – good engineering design).

ERA Technology Limited ERA Report No. 2012-0230
043122753 ENTR Lot 4 Final Report v6 363 © ERA Technology Ltd
Table 141. Estimated proportion of small / medium industrial furnaces and ovens that are appropriate for the relevant eco-design options, in each case
Base case Option 1 heat recovery 1
Option 2 heat recovery 2
Insulation Gas / air ratio
BC2 electric oven batch
0% 0% 60% (excludes short process times)
0%
BC2 gas oven batch 50% 50% 60% (excludes short process times)
100%
BC3 electric oven continuous
0% 0% 100% 0%
BC3 gas oven continuous
90% (excludes dusty processes)
100% 100% 100%
BC4 electric furnace batch
0% 0% 60% (excludes short process times)
0%
BC4 gas furnace batch
90% (excludes dusty processes)
100% 60% (excludes short process times)
100%
BC5 electric furnace continuous
0% 0% 100% 0%
BC5 gas furnace continuous
90% (excludes dusty processes)
100% 60% (excludes short process times)
100%
The proportions for large-size industrial are as follows.
Table 142. Estimated proportion of large industrial furnaces and ovens that are appropriate for eco-design options
Option Estimated proportion of
BC6 Comments Estimated
proportion of BC7
Comments
Option 1 (hot air to burners)
c.30% Applicable only when hot air available (furnaces with burners only)
- -
Option 2 (more efficient recuperator or regenerator)
80% Can be used except where large regenerative or oxy-fuel burners already used
- -
Option 3 (steam generation)
50% Possible where steam can be used
- -
Option 1 (BC7 - heat exchanger)
- - 75% Unsuitable for low temperature processes
Option 4 insulation 85% Not suitable for glass melting, smelting, rotary furnaces, etc.
100% All
Option 5 gas / air c.80% Excludes electric designs, heat treatment with reducing atmosphere, some ceramics processes
50% Unsuitable where recovered heat is heat source and for direct fired ovens

ERA Technology Limited ERA Report No. 2012-0230
043122753 ENTR Lot 4 Final Report v6 364 © ERA Technology Ltd
6.2.1 Base case 1: Laboratory ovens Table 143 indicates the main impacts of the improvement option proposed for the laboratory ovens Base Case and is based on actual measurements and cost data from a stakeholder.
Table 143: Summary of the cost and benefit effects of implementing individual improvement options for the Base case
Option Option description
Energy savings (%)
Increase of product price compared to Base case %
Payback time (years)
0 Base case Option 1 30-40% 10%
An environmental and economic assessment was carried out for the improvement option, using the EcoReport tool. Outcomes of this assessment, taking into account the whole life cycle, are provided in Table 144 with absolute values (in units) and variations with the Base Case.
Table 144: Environmental impacts of the Base case and its improvement options Life-cycle indicators per unit Unit Base case Option 1
Other resources and waste GJ 335.08 209.08 Total Energy (GER) % change with BC 0% -38% primary GJ 331.49 205.49 MWh 92.15 57.13
of which, electricity
% change with BC 0% -38% kL 23.17 14.77 Water (process) % change with BC 0% -36% kL 882.46 546.46 Water (cooling) % change with BC 0% -38% kg 453.68 307.59 Waste, non-haz./ landfill % change with BC 0% -32% kg 8.33 5.42 Waste, hazardous/ incinerated % change with BC 0% -35%
Emissions (Air) t CO2 eq. 14.77 9.27 Greenhouse Gases in GWP100 % change with BC 0% -37% kg SO2 eq. 86.61 54.17 Acidification, emissions % change with BC 0% -37% g 156.52 109.07 Volatile Organic Compounds
(VOC) % change with BC 0% -30% ng i-Teq 3110.47 2284.59 Persistent Organic Pollutants
(POP) % change with BC 0% -27% Heavy Metals mg Ni eq. 8336.37 6174.69

ERA Technology Limited ERA Report No. 2012-0230
043122753 ENTR Lot 4 Final Report v6 365 © ERA Technology Ltd
Life-cycle indicators per unit Unit Base case Option 1 % change with BC 0% -26% mg Ni eq. 948.17 699.95 PAHs % change with BC 0% -26% kg 7.39 6.70 Particulate Matter (PM, dust) % change with BC 0% -9%
Emissions (Water) mg Hg/20 3423.52 2611.11 Heavy Metals % change with BC 0% -24% gg PO4 46.45 42.58 Eutrophication % change with BC 0% -8%
Economic indicators € 2131.73 1319.64 Electricity cost % change with BC 0% -38% € 3631.73 2969.64 Life-cycle cost % change with BC 0% -18%
As only one design option is considered (Option 1), it is the only candidate for LLCC and also for the BAT option. Option 1 allows GER saving of 38% compared to the Base Case, and has an 18% lower LCC compared to the Base Case.
Figure 30: Base case – LCC and electricity costs

ERA Technology Limited ERA Report No. 2012-0230
043122753 ENTR Lot 4 Final Report v6 366 © ERA Technology Ltd
Figure 31: Base case – TEC and LCC
6.2.2 Base case 2a: Medium Industrial Batch Oven - electric The Table 145 Table 143indicates the main impacts of the improvement option proposed for the medium industrial batch oven (electric) Base Case.
Table 145: Summary of the cost and benefit effects of implementing individual improvement options for the Base case
Option Option description
Energy savings (%)
Increase of product price compared to Base case %
Payback time (years)
0 Base case Option 1 insulation 5% 16.5% 3.6
An environmental and economic assessment was carried out for the improvement option, using the EcoReport tool. Outcomes of this assessment, taking into account the whole life cycle, are provided in Table 146 with absolute values (in units) and variations with the Base Case.
Table 146: Environmental impacts of the Base case and its improvement options Life-cycle indicators per unit Unit Base case Option 1
Other resources and waste GJ 52612.95 49990.08 Total Energy (GER) % change with BC 0% -5% primary GJ 52524.90 49901.53 MWh 14601.92 13872.63
of which, electricity
% change with BC 0% -5% kL 3537.35 3363.43 Water (process) % change with BC 0% -5%

ERA Technology Limited ERA Report No. 2012-0230
043122753 ENTR Lot 4 Final Report v6 367 © ERA Technology Ltd
Life-cycle indicators per unit Unit Base case Option 1 kL 140015.31 133015.31 Water (cooling) % change with BC 0% -5% kg 63287.86 60247.56 Waste, non-haz./ landfill % change with BC 0% -5% kg 1233.36 1172.91 Waste, hazardous/ incinerated % change with BC 0% -5%
Emissions (Air) t CO2 eq. 2299.54 2185.10 Greenhouse Gases in GWP100 % change with BC 0% -5% kg SO2 eq. 13565.70 12890.15 Acidification, emissions % change with BC 0% -5% g 20330.82 19342.91 Volatile Organic Compounds (VOC) % change with BC 0% -5% ng i-Teq 376327.85 359142.27 Persistent Organic Pollutants (POP) % change with BC 0% -5% mg Ni eq. 981575.69 936587.92 Heavy Metals % change with BC 0% -5% mg Ni eq. 104720.48 99549.24 PAHs % change with BC 0% -5% kg 350.49 336.18 Particulate Matter (PM, dust) % change with BC 0% -4%
Emissions (Water) mg Hg/20 381786.87 364873.74 Heavy Metals % change with BC 0% -4% gg PO4 2825.86 2745.60 Eutrophication % change with BC 0% -3%
Economic indicators € 285259.18 270996.22 Electricity cost % change with BC 0% -5% € 305665.40 294702.44 Life-cycle cost % change with BC 0% -4%
All environmental impacts are lower with option 1 than with BC2a.
As only one design option is considered, Option 1, it is the only candidate for LLCC and also the BAT option. Option 1 allows GER saving of 5% compared to Base Case, and has a 4% lower LCC compared to the Base Case.

ERA Technology Limited ERA Report No. 2012-0230
043122753 ENTR Lot 4 Final Report v6 368 © ERA Technology Ltd
Figure 32: Base case – LCC and electricity costs
Figure 33: Base case – TEC (total energy costs) and LCC

ERA Technology Limited ERA Report No. 2012-0230
043122753 ENTR Lot 4 Final Report v6 369 © ERA Technology Ltd
6.2.3 Base case 2b: Medium Industrial Batch Oven - gas The main impacts of the improvement options for the medium industrial batch oven (gas) are shown in the Table 147. Four combinations of four individual options each are also analysed.
Table 147: Summary of the cost and benefit effects of implementing individual improvement options for the Base case
Option Option description
Energy savings (%)
Increase of product price compared to Base case %
Payback time (years)
0 Base case Option 1 heat recovery1 40% 40.0% 1.2 Option 2 heat recovery2 15% 120% 9.7 Option 3 insulation 4% 16.5% 5.0 Option 4 gas/air ratio 5% 9.6% 2.3 Scenario A op1+op3+op4 46% 66.1% 1.7 Scenario B op2+op3+op4 21% 146.1% 8.4 Scenario C op1+op4 42% 49.6% 1.4 Scenario D op2+op4 17% 129.6% 9.2

ERAT
echn
ology
Limite
dER
ARep
ortN
o.20
12-0
230
0431
2275
3ENT
RLot
4Fina
lRep
ortv6
370
©ER
ATech
nolog
yLtd
Using
theEc
oRep
orttoo
l,the
econo
mica
nden
viron
menta
limpa
ctof
thedif
feren
tindiv
idual
optio
nsan
dits
comb
inatio
nswa
scalc
ulated
forthe
whole
produ
ctlife
cycle.
Ther
esults
ofthe
sean
alyses
arepre
sented
inthe
table
below
.
Table
148:
Envir
onme
ntal
impa
ctsof
theB
asec
asea
ndits
impr
ovem
ento
ption
sLif
e-cy
cleind
icato
rspe
runit
Unit
Base
case
Optio
n1Op
tion2
Optio
n3Op
tion4
Scen
ario
ASc
enar
ioB
Scen
ario
CSc
enar
ioD
Othe
rres
ource
sand
waste
GJ84
813
5093
372
108
8142
780
578
4585
367
028
5008
670
414
Total
Energ
y(GE
R)%
chan
gewit
hBC
0%-40
%-15
%-4%
-5%-46
%-21
%-41
%-17
%pri
mary
GJ25
2525
2725
2727
2525
MWh
77
77
77
77
7of
which
,elec
tricity
%ch
ange
withB
C0%
0%0%
7%0%
7%7%
0%0%
kL37
3737
3837
3838
3737
Water
(proc
ess)
%ch
ange
withB
C0%
0%0%
3%0%
3%3%
0%0%
kL15
1515
1515
1515
1515
Water
(coolin
g)%
chan
gewit
hBC
0%0%
0%0%
0%0%
0%0%
0%kg
2417
2417
2417
2420
2417
2420
2420
2417
2417
Waste
,non
-haz./
landfi
ll%
chan
gewit
hBC
0%0%
0%0%
0%0%
0%0%
0%kg
2424
2424
2424
2424
24Wa
ste,h
azardo
us/
incine
rated
%ch
ange
withB
C0%
0%0%
0%0%
0%0%
0%0%
Emiss
ions(
Air)
tCO2
eq.
4691
2818
3989
4504
4457
2537
3708
2771
3895
Gree
nhou
seGa
sesin
GWP1
00%
chan
gewit
hBC
0%-40
%-15
%-4%
-5%-46
%-21
%-41
%-17
%kg
SO2e
q.14
1186
512
0613
5713
4378
411
2585
211
79Ac
idifica
tion,
emiss
ions
%ch
ange
withB
C0%
-39%
-15%
-4%-5%
-44%
-20%
-40%
-16%
g62
228
3756
052
978
5976
259
145
3386
149
278
3694
351
744
Volat
ileOr
ganic
Comp
ound
s(VO
C)%
chan
gewit
hBC
0%-40
%-15
%-4%
-5%-46
%-21
%-41
%-17
%

ERAT
echn
ology
Limite
dER
ARep
ortN
o.20
12-0
230
0431
2275
3ENT
RLot
4Fina
lRep
ortv6
371
©ER
ATech
nolog
yLtd
Life-
cycle
indica
tors
peru
nitUn
itBa
seca
seOp
tion1
Optio
n2Op
tion3
Optio
n4Sc
enar
ioA
Scen
ario
BSc
enar
ioC
Scen
ario
D
ngi-T
eq32
212
3221
232
212
3223
232
212
3223
232
232
3221
232
212
Persi
stent
Orga
nicPo
llutan
ts(PO
P)%
chan
gewit
hBC
0%0%
0%0%
0%0%
0%0%
0%mg
Nieq
.80
874
8087
480
874
8092
180
874
8092
180
921
8087
480
874
Heav
yMeta
ls%
chan
gewit
hBC
0%0%
0%0%
0%0%
0%0%
0%mg
Nieq
.36
6627
1733
1035
7135
4725
7531
6826
9432
63PA
Hs%
chan
gewit
hBC
0%-26
%-10
%-3%
-3%-30
%-14
%-27
%-11
%kg
8576
8285
8475
8176
81Pa
rticula
teMa
tter(
PM,
dust)
%ch
ange
withB
C0%
-11%
-4%-1%
-1%-13
%-6%
-11%
-5%Em
ission
s(W
ater
)mg
Hg/20
4328
243
282
4328
243
294
4328
243
294
4329
443
282
4328
2He
avyM
etals
%ch
ange
withB
C0%
0%0%
0%0%
0%0%
0%0%
ggPO
412
1212
1212
1212
1212
1212
1212
1212
1212
12Eu
troph
icatio
n%
chan
gewit
hBC
0%0%
0%0%
0%0%
0%0%
0%Ec
onom
icind
icato
rs€
3750
0022
5000
3187
5036
0000
3562
5020
2500
2962
5022
1250
3112
50Ele
ctricit
ycost
%ch
ange
withB
C0%
-40%
-15%
-4%-5%
-46%
-21%
-41%
-17%
€40
1125
2611
2537
4875
3902
5038
4775
2451
5035
8900
2597
7536
9775
Life-c
yclec
ost%
chan
gewit
hBC
0.0%
-34.9%
-6.5%
-2.7%
-4.1%
-38.9%
-10.5%
-35.2%
-7.8%
Increa
singi
nsula
tiont
hickn
essres
ultsin
ared
uctio
norn
ocha
ngeo
fmost
envir
onme
ntalim
pacts
becau
sethe
seare
domi
nated
byen
ergy
consu
mptio
n.

ERA Technology Limited ERA Report No. 2012-0230
043122753 ENTR Lot 4 Final Report v6 372 © ERA Technology Ltd
Scenario A is the LLCC (as it results in 38.9% lower LCC compared to the Base Case) as well as the BAT option (as it allows GER saving of 46% compared to Base Case)
Figure 34: Base case 2b – LCC and energy costs
'%�$� ����� �$��� '���� '��������� ���$� �$��� �����
��
���
���
���
���
����8�
�������
4����
��
4����
��
4����
�%
4����
��
<���
�����
<���
����8
<���
����5
<���
����!
( 5����� 9����)��������
Figure 35: Base case 2b – TEC and LCC
�
�����
�����
%����
�����
$����
�����
&����
�����
'����
����
$����
������
�$����
������
�$����
%�����
%$����
������
�$����
8������
��
4����
��
4����
��
4����
�%
4����
��
<���
�����
<���
����8
<���
����5
<���
����!
������������� �
�������
(����� ��� )�*+ �, 9����)��������

ERA Technology Limited ERA Report No. 2012-0230
043122753 ENTR Lot 4 Final Report v6 373 © ERA Technology Ltd
6.2.4 Base case 3a: Medium Industrial Continuous Oven - electric The Table 149 indicates the main impacts of the improvement options proposed for the medium industrial continuous oven (electric) Base Case.
Table 149: Summary of the cost and benefit effects of implementing individual improvement options for the Base case
Option Option description
Energy savings (%)
Increase of product price compared to Base case %
Payback time (years)
0 Base case Option 1 insulation 5% 27.4% 7.8
An environmental and economic assessment was carried out for the improvement option, using the EcoReport tool. Outcomes of this assessment, taking into account the whole life cycle, are provided in Table 150 with absolute values (in units) and variations with the Base Case.
Table 150: Environmental impacts of the Base case and its improvement options Life-cycle indicators per
unit Unit Base case Option 1
Other resources and waste GJ 60760.53 57737.56 Total Energy (GER) % change with BC 0% -5% primary GJ 60539.75 57515.75 MWh 16830.05 15989.38
of which, electricity
% change with BC 0% -5% kL 4093.12 3891.52 Water (process) % change with BC 0% -5% kL 161291.64 153227.64 Water (cooling) % change with BC 0% -5% kg 80952.61 77464.85 Waste, non-haz./ landfill % change with BC 0% -4% kg 1418.87 1349.19 Waste, hazardous/
incinerated % change with BC 0% -5% Emissions (Air)
t CO2 eq. 2660.66 2528.77 Greenhouse Gases in GWP100 % change with BC 0% -5%
kg SO2 eq. 15711.20 14932.67 Acidification, emissions % change with BC 0% -5% g 24662.77 23528.10 Volatile Organic Compounds
(VOC) % change with BC 0% -5% ng i-Teq 502346.98 482652.43 Persistent Organic Pollutants
(POP) % change with BC 0% -4%

ERA Technology Limited ERA Report No. 2012-0230
043122753 ENTR Lot 4 Final Report v6 374 © ERA Technology Ltd
Life-cycle indicators per unit
Unit Base case Option 1
mg Ni eq. 1183964.71 1132384.27 Heavy Metals % change with BC 0% -4% mg Ni eq. 122518.01 116560.69 PAHs % change with BC 0% -5% kg 478.28 462.99 Particulate Matter (PM,
dust) % change with BC 0% -3% Emissions (Water)
mg Hg/20 484804.58 465391.88 Heavy Metals % change with BC 0% -4% gg PO4 3962.23 3874.13 Eutrophication % change with BC 0% -2%
Economic indicators € 328618.58 312187.65 Electricity cost % change with BC 0% -5% € 359231.02 351020.09 Life-cycle cost % change with BC 0% -2%
As only one design option is considered, Option 1, it is the only candidate for LLCC and also the BAT option. Option 1 allows GER saving of 5% compared to Base Case, and has a 2% lower LCC compared to the Base Case.
Figure 36: Base case – LCC and electricity costs

ERA Technology Limited ERA Report No. 2012-0230
043122753 ENTR Lot 4 Final Report v6 375 © ERA Technology Ltd
Figure 37: Base case – TEC and LCC
6.2.5 Base case 3b: Medium Industrial Continuous Oven - gas The main impacts of the improvement options for the medium industrial continuous oven (gas) are shown in Table 151. Four combinations of four individual options each are also analysed.
Table 151: Summary of the cost and benefit effects of implementing individual improvement options for the Base case
Option Option description
Energy savings (%)
Increase of product price compared to Base case %
Payback time (years)
0 Base case Option 1 heat
recovery1 40% 28.6% 1.1
Option 2 heat recovery2
15% 85.7% 8.4
Option 3 insulation 4% 27.4% 10.1 Option 4 gas/air ratio 5% 6.86% 2.0 Scenario A op1+op3+op4 46% 62.9% 2.0 Scenario B op2+op3+op4 21% 120.0% 8.4 Scenario C op1+op4 42% 35.5% 1.2 Scenario D op2+op4 17% 92.6% 8.0
Using the EcoReport tool, the economic and environmental impact of the different individual options and its combinations was derived for the whole product life cycle. The results of these analyses are presented in Table 152.

ERAT
echn
ology
Limite
dER
ARep
ortN
o.20
12-02
30
0431
2275
3ENT
RLot
4Fina
lRep
ortv6
376
©ER
ATech
nolog
yLtd
Table
152:
Envir
onme
ntal
impa
ctsof
theB
asec
asea
ndits
impr
ovem
ento
ption
sLif
e-cy
cleind
icato
rspe
runit
Unit
Base
case
Optio
n1Op
tion2
Optio
n3Op
tion4
Scen
ario
ASc
enar
ioB
Scen
ario
CSc
enar
ioD
Othe
rres
ource
sand
waste
GJ97
855
5882
583
219
9395
392
976
5297
277
365
5687
481
267
Total
Energ
y(GE
R)%
chan
gewit
hBC
0%-40
%-15
%-4%
-5%-46
%-21
%-42
%-17
%pri
mary
GJ60
6060
6060
6060
6060
MWh
1717
1717
1717
1717
17of
which
,elec
tricity
%ch
ange
withB
C0%
0%0%
0%0%
0%0%
0%0%
kL61
6161
6161
6161
6161
Water
(proc
ess)
%ch
ange
withB
C0%
0%0%
0%0%
0%0%
0%0%
kL12
1212
1212
1212
1212
Water
(coolin
g)%
chan
gewit
hBC
0%0%
0%0%
0%0%
0%0%
0%kg
1082
910
829
1082
910
848
1082
910
848
1084
810
829
1082
9Wa
ste,n
on-ha
z./lan
dfill
%ch
ange
withB
C0%
0%0%
0%0%
0%0%
0%0%
0.3.1k
g0.3
.225
0.3.32
50.3
.425
0.3.52
50.3
.625
0.3.72
50.3
.825
0.3.92
50.3
.1025
Waste
,haza
rdous
/inc
inerat
ed%
chan
gewit
hBC
0%0%
0%0%
0%0%
0%0%
0%Em
ission
s(Air
)tC
O2eq
.54
1632
5846
0752
0051
4629
3542
8331
5044
99Gr
eenh
ouse
Gases
inGW
P100
%ch
ange
withB
C0%
-40%
-15%
-4%-5%
-46%
-21%
-42%
-17%
kgSO
2eq.
1709
1080
1473
1646
1630
986
1379
1049
1442
Acidif
icatio
n,em
ission
s%
chan
gewit
hBC
0%-37
%-14
%-4%
-5%-42
%-19
%-39
%-16
%
g72
929
4451
162
272
7009
169
376
4025
358
014
4309
060
851
Volat
ileOr
ganic
Comp
ound
s(VO
C)%
chan
gewit
hBC
0%-39
%-15
%-4%
-5%-45
%-20
%-41
%-17
%
Persi
stent
Orga
nicng
i-Teq
1059
2610
5926
1059
2610
6052
1059
2610
6052
1060
5210
5926
1059
26

ERAT
echn
ology
Limite
dER
ARep
ortN
o.20
12-02
30
0431
2275
3ENT
RLot
4Fina
lRep
ortv6
377
©ER
ATech
nolog
yLtd
Life-
cycle
indica
tors
peru
nitUn
itBa
seca
seOp
tion1
Optio
n2Op
tion3
Optio
n4Sc
enar
ioA
Scen
ario
BSc
enar
ioC
Scen
ario
DPo
llutan
ts(PO
P)%
chan
gewit
hBC
0%0%
0%0%
0%0%
0%0%
0%
mgNi
eq.
1463
5614
6356
1463
5614
6656
1463
5614
6656
1466
5614
6356
1463
56He
avyM
etals
%ch
ange
withB
C0%
0%0%
0%0%
0%0%
0%0%
mgNi
eq.
6103
5010
5693
5994
5966
4846
5529
4956
5638
PAHs
%ch
ange
withB
C0%
-18%
-7%-2%
-2%-21
%-9%
-19%
-8%kg
173
162
169
173
172
162
169
161
168
Partic
ulate
Matte
r(PM
,dust
)%
chan
gewit
hBC
0%-6%
-2%0%
-1%-6%
-3%-7%
-3%Em
ission
s(W
ater
)mg
Hg/20
9484
794
847
9484
794
933
9484
794
933
9493
394
847
9484
7He
avyM
etals
%ch
ange
withB
C0%
0%0%
0%0%
0%0%
0%0%
ggPO
421
0321
0321
0321
0821
0321
0821
0821
0321
03Eu
troph
icatio
n%
chan
gewit
hBC
0%0%
0%0%
0%0%
0%0%
0%Ec
onom
icind
icato
rs€
4320
0025
9200
3672
0041
4720
4104
0023
3280
3412
8025
0560
3585
60Ele
ctricit
ycost
%ch
ange
withB
C0%
-40%
-15%
-4%-5%
-46%
-21%
-42%
-17%
€46
8538
3057
4843
3733
4608
4844
9339
2918
3341
9818
2995
2342
7508
Life-c
yclec
ost%
chan
gewit
hBC
0%-35
%-7%
-2%-4%
-38%
-10%
-36%
-9%
Increa
singi
nsula
tiont
hickn
essres
ultsin
ared
uctio
norn
ocha
ngeo
falle
nviro
nmen
talim
pacts
becau
sethe
seare
domi
nated
byen
ergyc
onsu
mptio
n.

ERA Technology Limited ERA Report No. 2012-0230
043122753 ENTR Lot 4 Final Report v6 378 © ERA Technology Ltd
Scenario A is the LLCC (as it results in 38% lower LCC compared to the Base Case) as well as the BAT option (as it allows GER saving of 46% compared to Base Case).
Figure 38: Base case 3b – LCC and energy costs
'��������� ���&� '���� '��%�
&'�'� ���%� �%�&� �%�'�
��
���
���
���
���
����
8��������
4����
��
4����
��
4����
�%
4����
��
<���
�����
<���
����8
<���
����5
<���
����!
( 5����� 9����)��������
Figure 39: Base case 3b – TEC and LCC
�
�����
�����
�����
�����
������
������
����$����
�������$�����������$����%�����%$�����������$����$�����
8��������
4����
��
4����
��
4����
�%
4����
��
<���
�����
<���
����8
<���
����5
<���
����!
������������� �
�������
(����� ��� )�*+ �, 9����)��������

ERA Technology Limited ERA Report No. 2012-0230
043122753 ENTR Lot 4 Final Report v6 379 © ERA Technology Ltd
6.2.6 Base cases 4a: Medium Industrial Batch Furnace - electric Table 153 Table 143indicates the main impacts of the improvement option proposed for the medium industrial batch furnace (electric) Base Case.
Table 153: Summary of the cost and benefit effects of implementing individual improvement options for the Base case
Option Option description
Energy savings (%)
Increase of product price compared to Base case %
Payback time (years)
0 Base case Option 1 insulation 6% 23% 5.3
An environmental and economic assessment was carried out for the improvement option, using the EcoReport tool. Outcomes of this assessment, taking into account the whole life cycle, are provided in Table 154 with absolute values (in units) and variations with the Base Case.
Table 154: Environmental impacts of the Base case and its improvement options Life-cycle indicators per unit Unit Base case Option 1
Other resources and waste GJ 52923.40 49828.91 Total Energy (GER) % change with BC 0% -6% primary GJ 52596.38 49457.30 MWh 14621.79 13749.13
of which, electricity
% change with BC 0% -6% kL 3641.41 3463.31 Water (process) % change with BC 0% -5% kL 140039.67 131643.14 Water (cooling) % change with BC 0% -6% kg 73154.34 71665.80 Waste, non-haz./ landfill % change with BC 0% -2% kg 1218.45 1145.87 Waste, hazardous/ incinerated % change with BC 0% -6%
Emissions (Air) t CO2 eq. 2324.23 2191.04 Greenhouse Gases in GWP100 % change with BC 0% -6% kg SO2 eq. 13677.26 12878.72 Acidification, emissions % change with BC 0% -6% g 21387.80 20383.79 Volatile Organic Compounds
(VOC) % change with BC 0% -5% ng i-Teq 520901.85 533574.37 Persistent Organic Pollutants
(POP) % change with BC 0% 2% Heavy Metals mg Ni eq. 1191613.22 1170835.40

ERA Technology Limited ERA Report No. 2012-0230
043122753 ENTR Lot 4 Final Report v6 380 © ERA Technology Ltd
Life-cycle indicators per unit Unit Base case Option 1 % change with BC 0% -2% mg Ni eq. 104899.84 98695.58 PAHs % change with BC 0% -6% kg 395.27 382.47 Particulate Matter (PM, dust) % change with BC 0% -3%
Emissions (Water) mg Hg/20 481094.88 462740.29 Heavy Metals % change with BC 0% -4% gg PO4 5360.69 5334.83 Eutrophication % change with BC 0% 0%
Economic indicators € 285259.18 268143.63 Electricity cost % change with BC 0% -6% € 310977.89 299612.34 Life-cycle cost % change with BC 0% -4%
As only one design option is considered, Option 1, it is the only candidate for LLCC and also the BAT option. Option 1 allows GER saving of 6% compared to Base Case, and has an 4% lower LCC compared to the Base Case. Option 1 slightly increases POP emissions but all other environmental impacts are reduced or unchanged.
Figure 40: Base case – LCC and electricity costs

ERA Technology Limited ERA Report No. 2012-0230
043122753 ENTR Lot 4 Final Report v6 381 © ERA Technology Ltd
Figure 41: Base case – TEC and LCC
6.2.7 Base case 4b: Medium Industrial Batch Furnace - gas The main impacts of the improvement options for the medium industrial batch furnace (gas) are shown in the Table 155. Four combinations of four individual options each are also analysed.
Table 155: Summary of the cost and benefit effects of implementing individual improvement options for the Base case
Option Option description
Energy savings (%)
Increase of product price compared to Base case %
Payback time (years)
0 Base case Option 1 heat recovery1 40% 33.3% 1.2Option 2 heat recovery2 20% 100.0% 7.3Option 3 insulation 5% 17.7% 5.1Option 4 gas/air ratio 5% 8.00% 2.3Scenario A op1+op3+op4 47% 59.0% 1.8Scenario B op2+op3+op4 27% 125.7% 6.8Scenario C op1+op4 42% 41.3% 1.4Scenario D op2+op4 22% 108.0% 7.1
Using the EcoReport tool, the economic and environmental impact of the different individual options and its combinations was done for the whole product life cycle. The results of these analyses are presented in Table 156.

ERAT
echn
ology
Limite
dER
ARep
ortN
o.20
12-02
30
0431
2275
3ENT
RLot
4Fina
lRep
ortv6
382
©ER
ATech
nolog
yLtd
Table
156:
Envir
onme
ntal
impa
ctsof
theB
asec
asea
ndits
impr
ovem
ento
ption
slife
-cycle
indica
tors
peru
nitun
itBa
seca
seOp
tion1
Optio
n2Op
tion3
Optio
n4Sc
enar
ioA
Scen
ario
BSc
enar
ioC
Scen
ario
D
Othe
rres
ource
sand
waste
GJ85
124
5124
368
184
8094
480
889
4537
062
310
4954
966
490
Total
Energ
y(GE
R)%
chan
gewit
hBC
0%-40
%-20
%-5%
-5%-47
%-27
%-42
%-22
%pri
mary
GJ96
9696
107
9610
710
796
96MW
h27
2727
3027
3030
2727
ofwh
ich,e
lectric
ity
%ch
ange
withB
C0%
0%0%
11%
0%11
%11
%0%
0%kL
141
141
141
173
141
173
173
141
141
Water
(proc
ess)
%ch
ange
withB
C0%
0%0%
23%
0%23
%23
%0%
0%kL
4040
4043
4043
4340
40Wa
ter(co
oling)
%ch
ange
withB
C0%
0%0%
9%0%
9%9%
0%0%
kg12
284
1228
412
284
1444
712
284
1444
714
447
1228
412
284
Waste
,non
-haz./
landfi
ll%
chan
gewit
hBC
0%0%
0%18
%0%
18%
18%
0%0%
kg9
99
99
99
99
Waste
,haza
rdous
/inc
inerat
ed%
chan
gewit
hBC
0%0%
0%0%
0%0%
0%0%
0%Em
ission
s(Air
)tC
O2eq
.47
1628
4337
7944
8644
8225
1934
5627
4936
86Gr
eenh
ouse
Gases
inGW
P100
%ch
ange
withB
C0%
-40%
-20%
-5%-5%
-47%
-27%
-42%
-22%
kgSO
2eq.
1522
977
1250
1467
1454
894
1167
950
1222
Acidif
icatio
n,em
ission
s%
chan
gewit
hBC
0%-36
%-18
%-4%
-4%-41
%-23
%-38
%-20
%g
6328
538
617
5095
160
384
6020
234
483
4681
737
384
4971
8Vo
latile
Orga
nicCo
mpou
nds(
VOC)
%ch
ange
withB
C0%
-39%
-19%
-5%-5%
-46%
-26%
-41%
-21%
ngi-T
eq17
6786
1767
8617
6786
2101
0617
6786
2101
0621
0106
1767
8617
6786
Persi
stent
Orga
nicPo
llutan
ts(PO
P)%
chan
gewit
hBC
0%0%
0%19
%0%
19%
19%
0%0%
Heav
yMeta
lsmg
Nieq
.29
0911
2909
1129
0911
3241
7629
0911
3241
7632
4176
2909
1129
0911

ERAT
echn
ology
Limite
dER
ARep
ortN
o.20
12-02
30
0431
2275
3ENT
RLot
4Fina
lRep
ortv6
383
©ER
ATech
nolog
yLtd
life-cy
cleind
icato
rspe
runit
unit
Base
case
Optio
n1Op
tion2
Optio
n3Op
tion4
Scen
ario
ASc
enar
ioB
Scen
ario
CSc
enar
ioD
%ch
ange
withB
C0%
0%0%
11%
0%11
%11
%0%
0%mg
Nieq
.38
4528
9733
7137
2837
2627
3232
0628
4933
23PA
Hs%
chan
gewit
hBC
0%-25
%-12
%-3%
-3%-29
%-17
%-26
%-14
%kg
130
121
125
134
129
124
128
120
125
Partic
ulate
Matte
r(PM
,dust
)%
chan
gewit
hBC
0%-7%
-4%3%
-1%-5%
-1%-8%
-4%Em
ission
s(W
ater
)mg
Hg/20
1425
9014
2590
1425
9014
4546
1425
9014
4546
1445
4614
2590
1425
90He
avyM
etals
%ch
ange
withB
C0%
0%0%
1%0%
1%1%
0%0%
ggPO
437
4737
4737
4738
1837
4738
1838
1837
4737
47Eu
troph
icatio
n%
chan
gewit
hBC
0%0%
0%2%
0%2%
2%0%
0%Ec
onom
icind
icato
rs€
3750
0022
5000
3000
0035
6250
3562
5019
8750
2737
5021
7500
2925
00Ele
ctricit
ycost
%ch
ange
withB
C0%
-40%
-20%
-5%-5%
-47%
-27%
-42%
-22%
€40
6750
2667
4036
1750
3933
1039
0400
2482
0034
3210
2616
4035
6650
Life-c
yclec
ost%
chan
gewit
hBC
0%-34
%-11
%-3%
-4%-39
%-16
%-36
%-12
%
Optio
n3ins
ulatio
ninc
reases
severa
lenv
ironm
ental
impa
ctsalt
houg
hitr
educ
esen
ergyc
onsu
mptio
nand
globa
lwarm
ingga
semi
ssion
s.

ERA Technology Limited ERA Report No. 2012-0230
043122753 ENTR Lot 4 Final Report v6 384 © ERA Technology Ltd
Scenario A is the LLCC (as it results in 39% lower LCC compared to the Base Case) as well as the BAT option (as it allows GER saving of 47% compared to Base Case)
Figure 42: Base case 4b – LCC and energy costs
'��������� ���'�
'���� '��%������ &'��� �%��� �����
��
���
���
���
���
����
8��������
4����
��
4����
��
4����
�%
4����
��
<���
�����
<���
����8
<���
����5
<���
����!
( 5����� 9����)��������
Figure 43: Base case 4b – TEC and LCC
�
�����
�����
%����
�����
$����
�����
&����
�����
'����
����
$����
������
�$����
������
�$����
%�����
%$����
������
�$����
8��������
4����
��
4����
��
4����
�%
4����
��
<���
�����
<���
����8
<���
����5
<���
����!
������������� �
�������
(����� ��� )�*+ �, 9����)��������
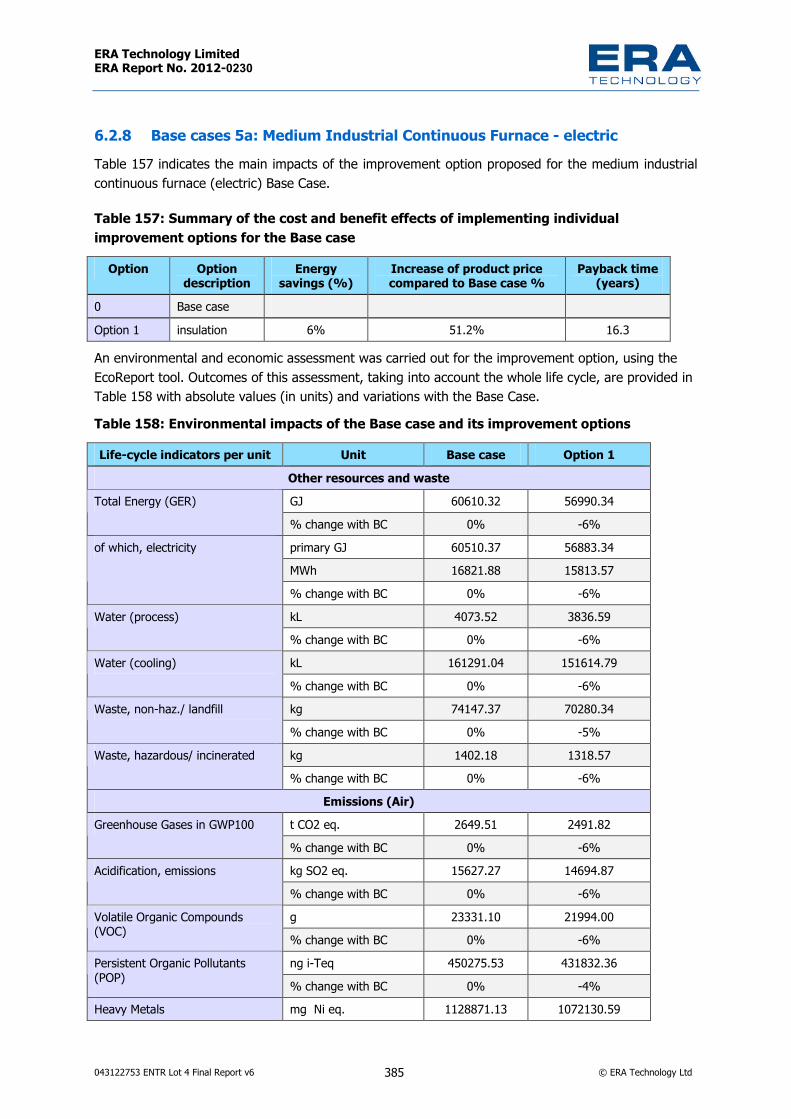
ERA Technology Limited ERA Report No. 2012-0230
043122753 ENTR Lot 4 Final Report v6 385 © ERA Technology Ltd
6.2.8 Base cases 5a: Medium Industrial Continuous Furnace - electric Table 157 indicates the main impacts of the improvement option proposed for the medium industrial continuous furnace (electric) Base Case.
Table 157: Summary of the cost and benefit effects of implementing individual improvement options for the Base case
Option Option description
Energy savings (%)
Increase of product price compared to Base case %
Payback time (years)
0 Base case Option 1 insulation 6% 51.2% 16.3 An environmental and economic assessment was carried out for the improvement option, using the EcoReport tool. Outcomes of this assessment, taking into account the whole life cycle, are provided in Table 158 with absolute values (in units) and variations with the Base Case. Table 158: Environmental impacts of the Base case and its improvement options Life-cycle indicators per unit Unit Base case Option 1
Other resources and waste GJ 60610.32 56990.34 Total Energy (GER) % change with BC 0% -6% primary GJ 60510.37 56883.34 MWh 16821.88 15813.57
of which, electricity
% change with BC 0% -6% kL 4073.52 3836.59 Water (process) % change with BC 0% -6% kL 161291.04 151614.79 Water (cooling) % change with BC 0% -6% kg 74147.37 70280.34 Waste, non-haz./ landfill % change with BC 0% -5% kg 1402.18 1318.57 Waste, hazardous/ incinerated % change with BC 0% -6%
Emissions (Air) t CO2 eq. 2649.51 2491.82 Greenhouse Gases in GWP100 % change with BC 0% -6% kg SO2 eq. 15627.27 14694.87 Acidification, emissions % change with BC 0% -6% g 23331.10 21994.00 Volatile Organic Compounds
(VOC) % change with BC 0% -6% ng i-Teq 450275.53 431832.36 Persistent Organic Pollutants
(POP) % change with BC 0% -4% Heavy Metals mg Ni eq. 1128871.13 1072130.59
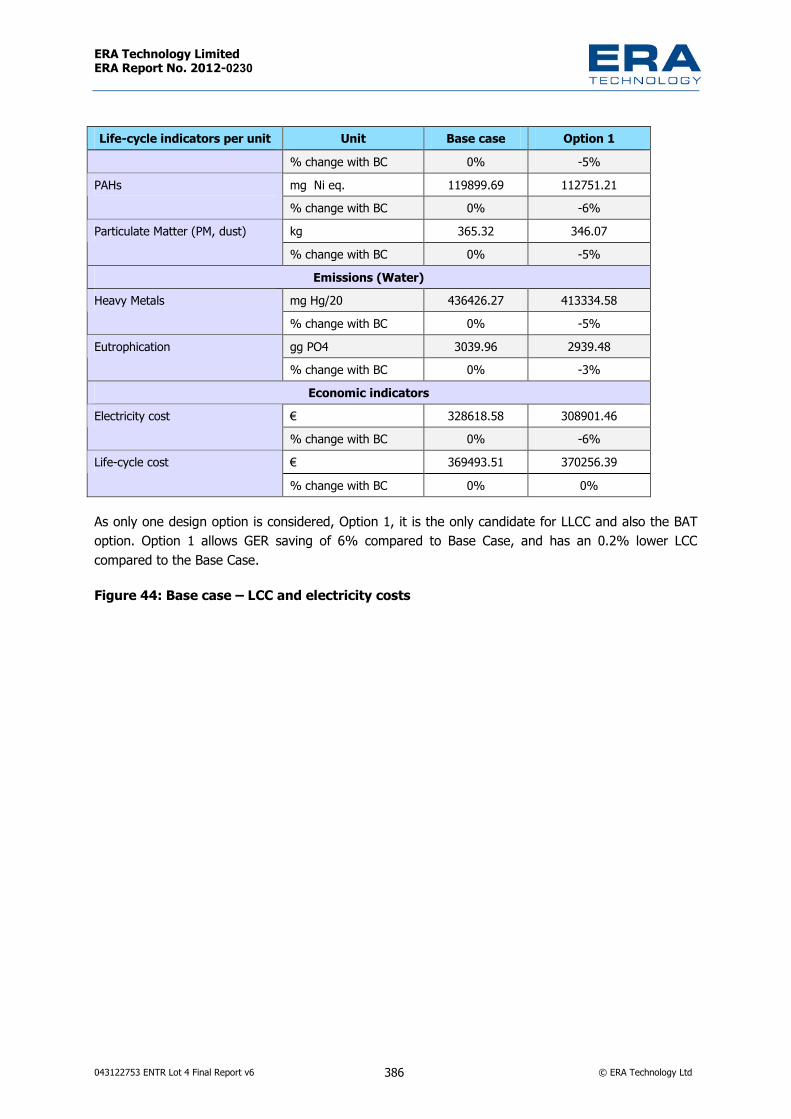
ERA Technology Limited ERA Report No. 2012-0230
043122753 ENTR Lot 4 Final Report v6 386 © ERA Technology Ltd
Life-cycle indicators per unit Unit Base case Option 1 % change with BC 0% -5% mg Ni eq. 119899.69 112751.21 PAHs % change with BC 0% -6% kg 365.32 346.07 Particulate Matter (PM, dust) % change with BC 0% -5%
Emissions (Water) mg Hg/20 436426.27 413334.58 Heavy Metals % change with BC 0% -5% gg PO4 3039.96 2939.48 Eutrophication % change with BC 0% -3%
Economic indicators € 328618.58 308901.46 Electricity cost % change with BC 0% -6% € 369493.51 370256.39 Life-cycle cost % change with BC 0% 0%
As only one design option is considered, Option 1, it is the only candidate for LLCC and also the BAT option. Option 1 allows GER saving of 6% compared to Base Case, and has an 0.2% lower LCC compared to the Base Case.
Figure 44: Base case – LCC and electricity costs
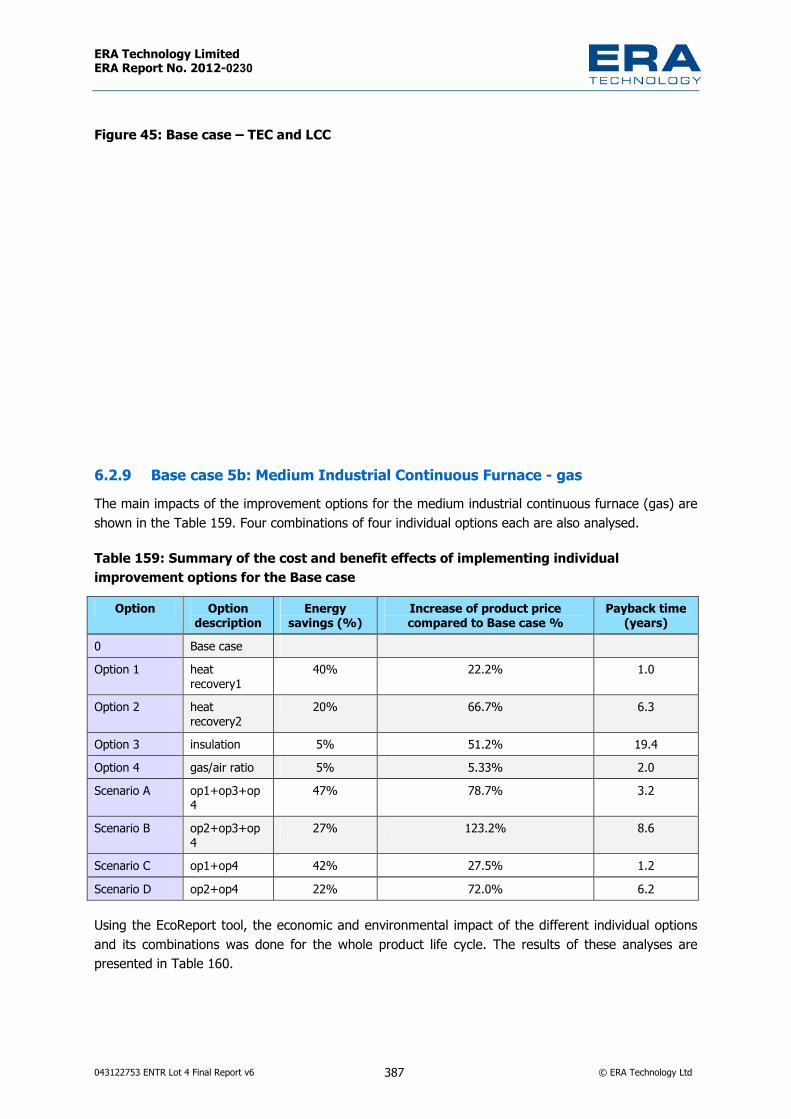
ERA Technology Limited ERA Report No. 2012-0230
043122753 ENTR Lot 4 Final Report v6 387 © ERA Technology Ltd
Figure 45: Base case – TEC and LCC
6.2.9 Base case 5b: Medium Industrial Continuous Furnace - gas The main impacts of the improvement options for the medium industrial continuous furnace (gas) are shown in the Table 159. Four combinations of four individual options each are also analysed.
Table 159: Summary of the cost and benefit effects of implementing individual improvement options for the Base case
Option Option description
Energy savings (%)
Increase of product price compared to Base case %
Payback time (years)
0 Base case Option 1 heat
recovery1 40% 22.2% 1.0
Option 2 heat recovery2
20% 66.7% 6.3
Option 3 insulation 5% 51.2% 19.4 Option 4 gas/air ratio 5% 5.33% 2.0 Scenario A op1+op3+op
447% 78.7% 3.2
Scenario B op2+op3+op4
27% 123.2% 8.6
Scenario C op1+op4 42% 27.5% 1.2 Scenario D op2+op4 22% 72.0% 6.2
Using the EcoReport tool, the economic and environmental impact of the different individual options and its combinations was done for the whole product life cycle. The results of these analyses are presented in Table 160.

ERAT
echn
ology
Limite
dER
ARep
ortN
o.20
12-02
30
0431
2275
3ENT
RLot
4Fina
lRep
ortv6
388
©ER
ATech
nolog
yLtd
Table
160:
Envir
onme
ntal
impa
ctsof
theB
asec
asea
ndits
impr
ovem
ento
ption
sLif
e-cy
cleind
icato
rspe
runit
Unit
Base
case
Optio
n1Op
tion2
Optio
n3Op
tion4
Scen
ario
ASc
enar
ioB
Scen
ario
CSc
enar
ioD
Othe
rres
ource
sand
waste
GJ97
705
5867
578
190
9283
592
826
5185
471
369
5672
476
238
Total
Energ
y(GE
R)%
chan
gewit
hBC
0%-40
%-20
%-5%
-5%-47
%-27
%-42
%-22
%pri
mary
GJ30
3030
3230
3232
3030
MWh
88
89
89
98
8of
which
,elec
tricity
%ch
ange
withB
C0%
0%0%
6%0%
6%6%
0%0%
kL42
4242
4742
4747
4242
Water
(proc
ess)
%ch
ange
withB
C0%
0%0%
12%
0%12
%12
%0%
0%kL
1111
1112
1112
1211
11Wa
ter(co
oling)
%ch
ange
withB
C0%
0%0%
5%0%
5%5%
0%0%
kg40
2440
2440
2443
6540
2443
6543
6540
2440
24Wa
ste,n
on-ha
z./lan
dfill
%ch
ange
withB
C0%
0%0%
8%0%
8%8%
0%0%
kg9
99
99
99
99
Waste
,haza
rdous
/inc
inerat
ed%
chan
gewit
hBC
0%0%
0%0%
0%0%
0%0%
0%Em
ission
s(Air
)tC
O2eq
.54
0532
4743
2651
3651
3528
7039
4931
3942
18Gr
eenh
ouse
Gases
inGW
P100
%ch
ange
withB
C0%
-40%
-20%
-5%-5%
-47%
-27%
-42%
-22%
kgSO
2eq.
1625
996
1311
1548
1546
888
1203
965
1279
Acidif
icatio
n,em
ission
s%
chan
gewit
hBC
0%-39
%-19
%-5%
-5%-45
%-26
%-41
%-21
%g
7159
743
179
5738
868
074
6804
538
236
5244
541
758
5596
7Vo
latile
Orga
nicCo
mpou
nds(
VOC)
%ch
ange
withB
C0%
-40%
-20%
-5%-5%
-47%
-27%
-42%
-22%
ngi-T
eq53
854
5385
453
854
5919
653
854
5919
659
196
5385
453
854
Persi
stent
Orga
nicPo
llutan
ts(PO
P)%
chan
gewit
hBC
0%0%
0%10
%0%
10%
10%
0%0%
Heav
yMeta
lsmg
Nieq
.91
262
9126
291
262
9677
891
262
9677
896
778
9126
291
262

ERAT
echn
ology
Limite
dER
ARep
ortN
o.20
12-02
30
0431
2275
3ENT
RLot
4Fina
lRep
ortv6
389
©ER
ATech
nolog
yLtd
Life-
cycle
indica
tors
peru
nitUn
itBa
seca
seOp
tion1
Optio
n2Op
tion3
Optio
n4Sc
enar
ioA
Scen
ario
BSc
enar
ioC
Scen
ario
D
%ch
ange
withB
C0%
0%0%
6%0%
6%6%
0%0%
mgNi
eq.
3484
2392
2938
3348
3348
2201
2747
2337
2884
PAHs
%ch
ange
withB
C0%
-31%
-16%
-4%-4%
-37%
-21%
-33%
-17%
kg60
4955
5959
4853
4954
Partic
ulate
Matte
r(PM
,dust
)%
chan
gewit
hBC
0%-18
%-9%
-1%-2%
-20%
-11%
-19%
-10%
Emiss
ions(
Wat
er)
mgHg
/2046
469
4646
946
469
4677
546
469
4677
546
775
4646
946
469
Heav
yMeta
ls%
chan
gewit
hBC
0%0%
0%1%
0%1%
1%0%
0%gg
PO4
1180
1180
1180
1192
1180
1192
1192
1180
1180
Eutro
phica
tion
%ch
ange
withB
C0%
0%0%
1%0%
1%1%
0%0%
Econ
omic
indica
tors
€43
2000
2592
0034
5600
4104
0041
0400
2289
6031
5360
2505
6033
6960
Electr
icityc
ost%
chan
gewit
hBC
0%-40
%-20
%-5%
-5%-47
%-27
%-42
%-22
%€
4789
3831
6128
4225
5348
0378
4597
3631
1313
4177
3830
9873
4162
98Lif
e-cycl
ecost
%ch
ange
withB
C0%
-34%
-12%
0%-4%
-35.0%
-13%
-35.3%
-13%

ERA Technology Limited ERA Report No. 2012-0230
043122753 ENTR Lot 4 Final Report v6 390 © ERA Technology Ltd
Scenario C is the LLCC (as it results in 35.3% lower LCC compared to the Base Case) whereas Scenario A is the BAT option (as it allows GER saving of 47% compared to Base Case).
Figure 46: Base case 5b – LCC and energy costs
'��������� ����� �$��� �'�%�
&%�$� &$�$� ���'� ���'�
��
���
���
���
���
����
8��������
4����
��
4����
��
4����
�%
4����
��
<���
�����
<���
����8
<���
����5
<���
����!
( 5����� 9����)�������� Figure 47: Base case 5b – TEC and LCC
�
�����
�����
�����
�����
������
������
����$����
�������$�����������$����%�����%$�����������$����$�����
8��������
4����
��
4����
��
4����
�%
4����
��
<���
�����
<���
����8
<���
����5
<���
����!
������������� �
�������
(����� ��� )�*+ �, 9����)��������

ERA Technology Limited ERA Report No. 2012-0230
043122753 ENTR Lot 4 Final Report v6 391 © ERA Technology Ltd
6.2.10 Base case 6: Large Industrial Furnace - gas The main impacts of the improvement options for the large industrial furnace (gas) are shown in the Table 161. Three combinations of five individual options each are also analysed.
Table 161: Summary of the cost and benefit effects of implementing individual improvement options for the Base case
Option Option description
Energy savings (%)
Increase of product price compared to Base case %
Payback time (years)
0 Base case Option 1 heat recovery1 10% 5% 0.7 Option 2 heat recovery2 15% 12.5% 1.2 Option 3 heat recovery3 10% 75% 11.2 Option 4 insulation 3% 10% 4.8 Option 5 gas/air ratio 5% 0.19% 0.1 Scenario A op1+op5+op4 15% 15% 1.4 Scenario B op2+op5+op4 20.5% 22.3% 1.6 Scenario C op3+op5+op4 15% 85% 8.2 Using the EcoReport tool, the economic and environmental impact of the different individual options and its combinations was done for the whole product life cycle. The results of these analyses are presented in Table 162.

ERAT
echn
ology
Limite
dER
ARep
ortN
o.20
12-02
30
0431
2275
3ENT
RLot
4Fina
lRep
ortv6
392
©ER
ATech
nolog
yLtd
Table
162:
Envir
onme
ntal
impa
ctsof
theB
asec
asea
ndits
impr
ovem
ento
ption
sLif
e-cy
cleind
icato
rspe
run
itUn
itBa
seca
seOp
tion1
Optio
n2Op
tion3
Optio
n4Op
tion5
Scen
ario
ASc
enar
ioB
Scen
ario
C
Othe
rres
ource
sand
waste
GJ15
4828
4413
9485
1613
1813
5213
9485
1614
8299
1414
7156
8013
1421
5312
3749
8913
1421
53To
talEn
ergy
(GER
)%
chan
gewit
hBC
0%-10
%-15
%-10
%-4%
-5%-15
%-20
%-15
%
prima
ryGJ
2774
427
744
2774
427
744
5016
927
744
5016
950
169
5016
9MW
h77
1377
1377
1377
1313
947
7713
1394
713
947
1394
7of
which
,ele
ctricit
y
%ch
ange
withB
C0%
0%0%
0%81
%0%
81%
81%
81%
kL63
294
6329
463
294
6329
412
6531
6329
412
6531
1265
3112
6531
Water
(proc
ess)
%ch
ange
withB
C0%
0%0%
0%10
0%0%
100%
100%
100%
kL86
5786
5786
5786
5715
539
8657
1553
915
539
1553
9Wa
ter(co
oling)
%ch
ange
withB
C0%
0%0%
0%79
%0%
79%
79%
79%
kg50
9455
150
9455
150
9455
150
9455
194
2944
450
9455
194
2944
494
2944
494
2944
4Wa
ste,n
on-
haz./
landfi
ll%
chan
gewit
hBC
0%0%
0%0%
85%
0%85
%85
%85
%kg
7777
7777
115
7711
511
511
5Wa
ste,
hazar
dous
/inc
inerat
ed%
chan
gewit
hBC
0%0%
0%0%
49%
0%49
%49
%49
%Em
ission
s(Air
)tC
O2eq
.85
9026
7741
9673
1781
7741
9682
5515
8166
1173
2202
6897
8873
2202
Gree
nhou
seGa
sesin
GWP1
00%
chan
gewit
hBC
0%-10
%-15
%-10
%-4%
-5%-15
%-20
%-15
%kg
SO2e
q.27
9885
2551
8024
2828
2551
8029
4708
2675
3226
7533
2551
8126
7533
Acidif
icatio
n,em
ission
s%
chan
gewit
hBC
0%-9%
-13%
-9%5%
-4%-4%
-9%-4%
g11
6700
1310
5528
6999
9429
710
5528
6911
4907
8511
1114
4110
2619
2797
0335
410
2619
27Vo
latile
Orga
nicCo
mpou
nds
(VOC)
%ch
ange
withB
C0%
-10%
-14%
-10%
-2%-5%
-12%
-17%
-12%
Persi
stent
ngi-T
eq80
1601
8580
1601
8580
1601
8580
1601
8514
8202
199
8016
0185
1482
0219
914
8202
199
1482
0219
9

ERAT
echn
ology
Limite
dER
ARep
ortN
o.20
12-02
30
0431
2275
3ENT
RLot
4Fina
lRep
ortv6
393
©ER
ATech
nolog
yLtd
Life-
cycle
indica
tors
per
unit
Unit
Base
case
Optio
n1Op
tion2
Optio
n3Op
tion4
Optio
n5Sc
enar
ioA
Scen
ario
BSc
enar
ioC
Orga
nicPo
llutan
ts(PO
P)%
chan
gewit
hBC
0%0%
0%0%
85%
0%85
%85
%85
%
mgNi
eq.
7547
9189
7547
9189
7547
9189
7547
9189
1462
0584
575
4791
8914
6205
845
1462
0584
514
6205
845
Heav
yMeta
ls%
chan
gewit
hBC
0%0%
0%0%
94%
0%94
%94
%94
%mg
Nieq
.57
2566
5296
2150
8148
5296
2155
6882
5510
9350
9642
4881
7050
9642
PAHs
%ch
ange
withB
C0%
-8%-11
%-8%
-3%-4%
-11%
-15%
-11%
kg24
654
2422
424
009
2422
434
713
2443
934
240
3402
634
240
Partic
ulate
Matte
r(PM
,du
st)%
chan
gewit
hBC
0%-2%
-3%-2%
41%
-1%39
%38
%39
%Em
ission
s(W
ater
)mg
Hg/20
5449
897
5449
897
5449
897
5449
897
9405
878
5449
897
9405
878
9405
878
9405
878
Heav
yMeta
ls%
chan
gewit
hBC
0%0%
0%0%
73%
0%73
%73
%73
%gg
PO4
1758
1217
5812
1758
1217
5812
3208
4017
5812
3208
4032
0840
3208
40Eu
troph
icatio
n%
chan
gewit
hBC
0%0%
0%0%
82%
0%82
%82
%82
%Ec
onom
icind
icato
rs€
5797
1948
5217
4753
4927
6155
5217
4753
5507
3350
5507
3350
4869
6436
4579
7839
4869
6436
Electr
icityc
ost%
chan
gewit
hBC
0%-10
%-15
%-10
%-5%
-5%-16
%-21
%-16
%€
6207
7280
5648
0086
5388
1488
5928
0086
5957
8683
5918
6283
5339
3369
5079
4771
5620
1769
Life-c
yclec
ost%
chan
gewit
hBC
0%-9%
-13%
-5%-4%
-5%-14
%-18
%-9%
Optio
n4ins
ulatio
ninc
reases
severa
lenv
ironm
ental
optio
nsbu
tallo
ption
sred
ucee
nergy
cons
umpti
onan
dglob
alwa
rming
gase
missi
ons.

ERA Technology Limited ERA Report No. 2012-0230
043122753 ENTR Lot 4 Final Report v6 394 © ERA Technology Ltd
Scenario B is the LLCC (as it results in 18% lower LCC compared to the Base Case) as well as the BAT option (as it allows GER saving of 20.5% compared to Base Case). This scenario cannot however be used with all types of large furnace due to technical constraints. The three heat recovery options are suitable for different processes.
Figure 48: Base case 6 – LCC and energy costs
'%��� '���� '��$������
'���� '%��� '���� '���������
���
���
����
8��������
4����
��
4����
��
4����
�%
4����
��
4����
�$
<���
�����
<���
����8
<���
����5
( 5����� 9����)��������
Figure 49: Base case 6 – TEC and LCC
�
�������
�������
�������
�������
��������
��������
��������
��������
��������
����
��������
��������
%�������
��������
$�������
��������
&�������
8��������
4����
��
4����
��
4����
�%
4����
��
4����
�$
<���
�����
<���
����8
<���
����5
������������� �
�������
(����� ��� )�*+ �, 9����)��������

ERA Technology Limited ERA Report No. 2012-0230
043122753 ENTR Lot 4 Final Report v6 395 © ERA Technology Ltd
6.2.11 Base case 7: Large Industrial Oven - gas The main impacts of the improvement options for the large industrial oven (gas) are shown in the Table 163. One combination of three individual options each is also analysed.
Table 163: Summary of the cost and benefit effects of implementing individual improvement options for the Base case
Option Option description
Energy savings (%)
Increase of product price compared to Base case %
Payback time (years)
0 Base case Option 1 heat recovery1 15% 36% 11.5 Option 2 Insulation 3% 10.0% 15.9 Option 3 gas / air 5% 0.37% 0.4 Scenario A op1+op3+op4 20% 46.4% 11.1 Using the EcoReport tool, the economic and environmental impact of the different individual options and its combinations was done for the whole product life cycle. The results of these analyses are presented in Table 164.

ERAT
echn
ology
Limite
dER
ARep
ortN
o.20
12-02
30
0431
2275
3ENT
RLot
4Fina
lRep
ortv6
396
©ER
ATech
nolog
yLtd
Table
164:
Envir
onme
ntal
impa
ctsof
theB
asec
asea
ndits
impr
ovem
ento
ption
sLif
e-cy
cleind
icato
rspe
runit
Unit
Base
case
Optio
n1Op
tion2
Optio
n3Sc
enar
ioA
Othe
rres
ource
sand
waste
GJ24
3791
120
7730
223
8217
323
1770
819
7348
3To
talEn
ergy(
GER)
%ch
ange
withB
C0%
-15%
-2%-5%
-19%
prima
ryGJ
4965
4965
7524
4965
7524
MWh
1380
1380
2092
1380
2092
ofwh
ich,e
lectric
ity
%ch
ange
withB
C0%
0%52
%0%
52%
kL72
5672
5614
486
7256
1448
6Wa
ter(pr
ocess
)%
chan
gewit
hBC
0%0%
100%
0%10
0%kL
1584
1584
2369
1584
2369
Water
(coolin
g)%
chan
gewit
hBC
0%0%
50%
0%50
%kg
8637
3186
3731
1382
779
8637
3113
8277
9Wa
ste,n
on-ha
z./lan
dfill
%ch
ange
withB
C0%
0%60
%0%
60%
kg93
9311
093
110
Waste
,haza
rdous
/incin
erated
%ch
ange
withB
C0%
0%19
%0%
19%
Emiss
ions(
Air)
tCO2
eq.
1355
7211
5635
1330
6212
8926
1104
66Gr
eenh
ouse
Gases
inGW
P100
%ch
ange
withB
C0%
-15%
-2%-5%
-19%
kgSO
2eq.
4790
142
095
5227
945
966
4569
9Ac
idifica
tion,
emiss
ions
%ch
ange
withB
C0%
-12%
9%-4%
-5%g
1946
103
1683
544
1942
562
1858
583
1644
995
Volat
ileOr
ganic
Comp
ound
s(VO
C)%
chan
gewit
hBC
0%-13
%0%
-4%-15
%ng
i-Teq
1361
9562
1361
9562
2177
0871
1361
9562
2177
0871
Persi
stent
Orga
nicPo
llutan
ts(PO
P)%
chan
gewit
hBC
0%0%
60%
0%60
%mg
Nieq
.11
4511
0611
4511
0620
6154
0111
4511
0620
6154
01He
avyM
etals
%ch
ange
withB
C0%
0%80
%0%
80%

ERAT
echn
ology
Limite
dER
ARep
ortN
o.20
12-02
30
0431
2275
3ENT
RLot
4Fina
lRep
ortv6
397
©ER
ATech
nolog
yLtd
Life-
cycle
indica
tors
peru
nitUn
itBa
seca
seOp
tion1
Optio
n2Op
tion3
Scen
ario
Amg
Nieq
.33
1155
3210
6233
2736
3277
9132
1297
PAHs
%ch
ange
withB
C0%
-3%0%
-1%-3%
kg23
485
2338
426
434
2345
226
320
Partic
ulate
Matte
r(PM
,dust
)%
chan
gewit
hBC
0%0%
13%
0%12
%Em
ission
s(W
ater
)mg
Hg/20
1241
490
1241
490
1806
266
1241
490
1806
266
Heav
yMeta
ls%
chan
gewit
hBC
0%0%
45%
0%45
%gg
PO4
3676
536
765
5960
436
765
5960
4Eu
troph
icatio
n%
chan
gewit
hBC
0%0%
62%
0%62
%Ec
onom
icind
icato
rs€
9083
319
7720
821
8810
819
8629
153
7266
655
Electr
icityc
ost%
chan
gewit
hBC
0%-15
%-3%
-5%-20
%€
1109
2985
1045
0487
1102
0486
1064
6219
1020
3721
Life-c
yclec
ost%
chan
gewit
hBC
0%-6%
-1%-4%
-8%
Thee
nviro
nmen
talim
pacts
forop
tion1
and3
areeit
heru
ncha
nged
orred
uced
(duet
olow
eren
ergyc
onsum
ption
)but
severa
lare
increa
sedfor
optio
n2du
etot
heuse
ofal
arger
quan
tityof
insula
tion.
.
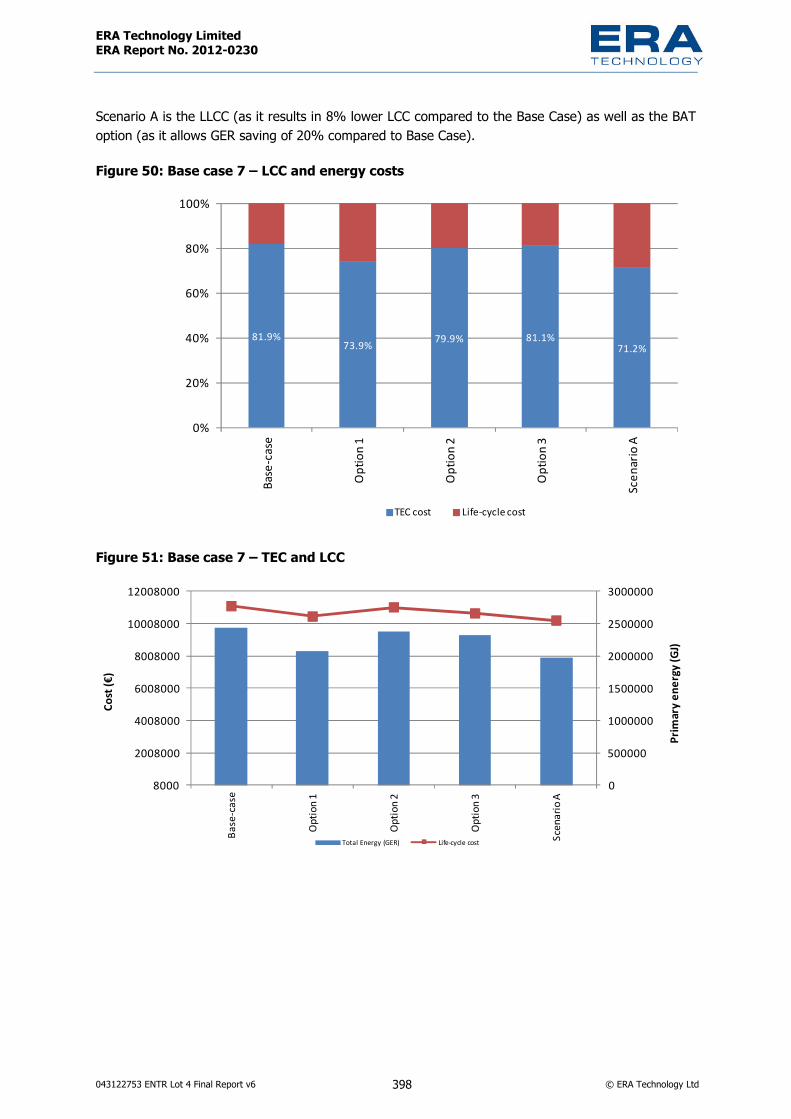
ERA Technology Limited ERA Report No. 2012-0230
043122753 ENTR Lot 4 Final Report v6 398 © ERA Technology Ltd
Scenario A is the LLCC (as it results in 8% lower LCC compared to the Base Case) as well as the BAT option (as it allows GER saving of 20% compared to Base Case).
Figure 50: Base case 7 – LCC and energy costs
���'�&%�'� &'�'� �����
&����
��
���
���
���
���
����
8��������
4����
��
4����
��
4����
�%
<���
�����
( 5����� 9����)��������
Figure 51: Base case 7 – TEC and LCC
�
$�����
�������
�$�����
�������
�$�����
%������
����
�������
�������
�������
�������
��������
��������
8������
��
4����
��
4����
��
4����
�%
<���
�����
������������� �
�������
(����� ��� )�*+ �, 9����)��������

ERA Technology Limited ERA Report No. 2012-0230
043122753 ENTR Lot 4 Final Report v6 399 © ERA Technology Ltd
6.3. Analysis of BNAT BNAT comprises technology type(s) that will be available within 10 years, i.e. before 2022. Thus:
• Not CCS, nor novel steel production, as both have implementation periods of >10 years; • Possible – encourage use of low CO2 emission Mg-based cements (this is not an eco-design
option). Eco-design options utilising BNAT – impact on energy consumption:
Heat recovery Heat recovery to reduce fuel consumption is relatively mature but incremental improvements are being made and are likely to continue in the future. There is no significant new development likely to occur that will result in a significant energy saving in the next ten years. Faster adoption and increased investment in existing new heat recovery technology would, however, give benefits. In some sectors, further research is needed that could give energy savings via using techniques already in use in some (other) types of furnaces. For example, very few glass melters pre-heat the raw material whereas batch pre-heaters are commercially available and are used for glass-fibre manufacture but not flat or container glass in the EU. Pre-heating batch and cullet for flat and container glass melting may be possible within 10 years although more research is needed; however, glass manufacturers are reluctant to be the first to invest in this new technology. Glass batch pre-heaters are available in the EU from several manufacturers.
Insulation and refractories Refractory and insulation manufacturers are carrying out research into new materials but the current status is that there are unlikely to be any new superior materials available within the next 10 years. Refractory and insulation materials were developed over the past over 100 years, and so it is a very mature industry, where only small incremental changes should be expected. There is research ongoing into novel materials such as chemical resistant nanomaterial refractories but this is at an early stage with no certainty that there will be better materials available within 10 years.
Others Industry is constantly looking for ways to economically reduce energy consumption and many options are described in section 4 of this report. Good engineering design has been found in other sectors such as commercial catering ovens, where it can reduce energy consumption by 10% or more (Lot 22 Eco-design study). This is achieved by the expertise and experience of designers, and is not due to any specific eco-design characteristic(s). Competition is a driver to encourage energy savings for larger furnaces and ovens, but is less effective for smaller designs; however, the requirement to provide energy information may be effective in the longer term.
Process-specific considerations The following three types of installation are used in furnaces, but these are integrated with other energy consuming equipment that is not furnaces or ovens. Energy in the form of heat or combustible gases from one furnace or oven is used by other process steps, so that it is difficult to assess individual furnaces and ovens as isolated items.

ERA Technology Limited ERA Report No. 2012-0230
043122753 ENTR Lot 4 Final Report v6 400 © ERA Technology Ltd
Steel production – integrated steel works are one of the biggest industrial energy consumers in the EU accounting for c.2% of EU GHG emission. Furthermore, this does not include the environmental impact of imported steel (as steel alloy and as products such as cars, washing machines, etc.). Furnaces and ovens account for a major proportion of this. It has been claimed that there is little potential for significant energy savings, but this claim is most often based on new equipment. There are opportunities for further savings from replacement of old equipment, as with any type of furnace, but the rate at which this occurs is limited by capital investment. It is probably true however that within the next 10 years, there will be little or no further technological advancements in this sector although longer-term research described in section 5 could reduce GHG emissions (CCS), but may not reduce overall energy consumption to the same extent. Achieving a 20% reduction in GHG emissions by 2020 will not be achievable unless the replacement of older existing installations is accelerated.
Cement – Cement production in the EU also emits c.2% of the EU’s GHGs although unlike steel, imports of cement into the EU are relatively small. Although GHG emission reductions will be possible as older installations are rebuilt, there is little scope for technology developments reducing energy consumption in the next 10 years as described in section 5 except by switching to magnesium-based cements which have clearly demonstrated lower CO2 lifetime emissions. Magnesium-based cements are currently not widely used and so their long-term performance is not as well understood as traditional cement. Also, EU cement manufactures have huge investments in traditional calcium-based cement kilns which they will not want to replace until these reach end of life.
Oil refineries – these are believed to be one of the largest GHG emitters in the EU but only a small proportion of these are furnaces. These furnaces are usually designed and built by users and so are not placed on the EU market. Also, they are part of an integrated process and so cannot easily be considered as separate items of equipment. As a result, it has not been possible to study oil refinery furnaces in this study and so their improvement potential is not known. The European Commission may therefore consider whether to carry out a separate eco-design study of oil refineries per se.
BNAT performance parameter data provided by stakeholders Heat recovery: Most BNAT data was provided as combustion gas temperatures with very little quoted as % heat recovery. Temperature data extracted from table 118 is given in the table below.
Table 165. Heat recovery performance parameters from stakeholders at 3% oxygen and BNAT Improvement potential
Process Current average
°C BAT °C BNAT °C Improvement
potential % for BAT to BNAT
Hot dip galvanising 950°C 600 400 350 c.5% Forging 1250°C 700 350 300 c.5% Bright annealing stainless steel 1200°C n.d. 868 530 c.10% Fluidised bed diffusion for wire (gas) 590 580 @ 9% O2 200 @ 2% O2 c.20%
Improvement potentials above are estimated from the % decrease in combustion gas temperature and values of % of input heat lost in combustion gases, which for these types of furnace was assumed to be c.40%. So a 12% decrease in temperature is 12% of 40% = c.5% improvement potential. As with improvement potentials for BAT designs, values for BNAT also vary depending on the type of process for which the furnace is designed.

ERA Technology Limited ERA Report No. 2012-0230
043122753 ENTR Lot 4 Final Report v6 401 © ERA Technology Ltd
Insulation: As heat lost in W/m2 is a more reliable eco-design option for insulation, this is considered first with data taken from table 121. Improvement potential values given are estimates.
Table 166. Insulation performance parameters as W/m2 from stakeholders and BNAT Improvement potential
Process Current average
BAT W/m2
BNAT W/m2 Improvement potential %
Bright annealing stainless steel gas n.d. 500 400 2% Heat treatment aluminium 365 200 100 2% Aluminium batch heat treatment 175 150 100 2% Aluminium melting holding 450 300 200 1 – 2% Electric furnaces 400 300 250 1% Small electric furnaces n.d. 1500 1250 2%
Improvement potentials are estimated from the % decrease in heat loss achievable and values of % of input heat that is lost through insulation. It is assumed that typical insulation heat losses are c.10% for furnaces and 5% – 10% for ovens. Overall, BNAT furnaces and ovens would consume c.2% less energy than BAT designs according to the limited data available, but furnaces designed for some processes will not achieve these savings due to technical constraints.
Gas/ air ratio: Very few stakeholders provided BNAT performance parameter data. One stakeholder provided λ values of 1.16 as BNAT, whereas another stakeholder claimed that a λof 1.10 was achievable as BAT for a complex furnace design with many burners. Several stakeholders claimed that λ values of >1.15 were BAT, although some applied to single burner systems, which are easier to control. It is clear that with the most advanced and accurate gas/ air controllers, 1.1 can be achieved with single burner furnaces, but that 1.15 is more realistic with multi-burner furnaces. Based on current knowledge, it appears that no further improvement will be possible beyond a λ of 1.15.
6.4. Sensitivity analysis of main parameters This section presents the results of a sensitivity analysis carried out and discussed for each of the base cases for the following parameters:
• Product price • Product lifetime • Annual energy (electricity/natural gas) consumption • Energy (electricity/natural gas) tariff • Discount rate • Product stock (in year 2008) • Installation cost (for Base Case 6 and 7 only) • Quantity of materials used for construction (for Base Case 6 and 7 only).

ERA Technology Limited ERA Report No. 2012-0230
043122753 ENTR Lot 4 Final Report v6 402 © ERA Technology Ltd
The robustness of the outcomes of the study depends on the underlying assumptions. These assumptions have been explicitly mentioned at the relevant steps of the study. In this section, the sensitivity of the environmental and economic results to the most critical parameters and assumptions is tested.
Parameters such as energy price, product purchase price and discount rate have a direct influence on the LCC calculations of the base cases and their improvement options (but not on the environmental impacts of the products), whilst other parameters (annual energy consumption and lifetime) will influence both the environmental impacts of the products and the LCC, via operating costs.
6.4.1 Assumptions related to product price The range of ovens and furnaces covered by each of the product groups (base cases) is very wide. Ovens and furnaces with a variety of characteristics, applications and a wide range of purchase prices exist on the EU market.
Therefore, compared to the estimated average product prices defined for Base Cases, two scenarios are defined, to take into account the fact that on the one hand the price may be underestimated and that on the other hand, it may be overestimated. There is a larger uncertainty with the prices estimated for Base Case 2 to Base Case 7, so a larger range for the variation in the product price of these base cases is considered when compared to Base Case 1.
Variation in product price of Base Case 1:
• An increase of 20% (Max) • A decrease of 20% (Min). Variation in product price of Base Case 2 to Base Case 7:
• An increase of 40% (Max) • A decrease of 20% (Min). The variation of the LCC compared to the Base Case (Base) is provided in Figure 52 for each Base Case. The impact of such a variation is rather negligible for Base Case 2 to Base Case 6, due to the small share of the product price in the LCC (<15%), see Figure 53.

ERA Technology Limited ERA Report No. 2012-0230
043122753 ENTR Lot 4 Final Report v6 403 © ERA Technology Ltd
Figure 52: Product price – variation of LCC compared to base case
������������������������
�����
8�< ��� ��=
Figure 53: Product price - Share of the product price in the LCC
��
$�
���
�$�
���
�$�
%��
%$�
���
�$�
$��
85� 85��� 85��" 85�%� 85�%" 85��� 85��" 85�$� 85�$" 85�� 85�&8�< ��� ��=
The impact of any variation in the product price of the Base Case on its LCC and on one of its improvement options is quite straightforward. Indeed, a constant price (which is the variation with the base) will be added for all options. For instance, for Base Case 6 (large industrial furnace), the scenario Max (increase of 40%) implies an increase of 1.6 million Euros whereas the scenario Min (decrease of 20%) implies a decrease of €800 000 for all the improvement options. Therefore, the ranking of options in terms of LCC remains similar; only absolute values change. Such logic applies to all the Base Cases considered.

ERA Technology Limited ERA Report No. 2012-0230
043122753 ENTR Lot 4 Final Report v6 404 © ERA Technology Ltd
6.4.2 Assumptions related to product lifetime Average lifetimes are used in the EcoReport tool to assess environmental impacts and LCC over the whole life cycle of the Base Cases. However, some products have shorter and some longer lifetimes. Such extreme values are considered for two scenarios (presented below) used in this sensitivity analysis to assess the impact of this parameter on the LCC of the Base Cases and their energy consumption during the use phase.
Variation in product lifetime (in years):
• An increase of 20% (Max) • A decrease of 20% (Min). The variation of the LCC compared to the Base Case (Base) is provided in Figure 54 for each Base Case. The impact on the ratio of cost of energy consumption and LCC compared to the Base Case is presented in Figure 55. The impact of lifetime change on this ratio is small (less than 4% for Base Case 1 and less than 2% for other base cases.
Figure 54: Product lifetime - Variation of the LCC compared to the Base Case
��$�
����
�$�
��
$�
���
�$�
8�< ��� ��=
Figure 55: Product lifetime - Variation of ratio of cost of energy consumption and LCC compared to the Base Case
����
�����
�����
%����
�����
$����
�����
&����
�����
'����
������
85� 85��� 85��" 85�%� 85�%" 85��� 85��" 85�$� 85�$" 85�� 85�&
8�< ��� ��=

ERA Technology Limited ERA Report No. 2012-0230
043122753 ENTR Lot 4 Final Report v6 405 © ERA Technology Ltd
The variation in lifetime does not have any impact on the order of options for BC 1, BC 2a, BC 3a, BC 4a and BC 5a (as only one design option is considered for these base cases). The impact of the variation in lifetime on the design options considered for remaining base cases is presented in the figures below.
Figure 56: Base Case 2b (Medium Industrial Batch Oven – gas) and its improvement options – Impact of lifetime on the LCC (€)
�
$�����
�������
�$�����
�������
�$�����
%������
%$�����
�������
�$�����
8�< >�:? >��@
8��������
4�������
4�������
4������%
4�������
<���������
<��������8
<��������5
<��������!
Figure 57: Base Case 3b (Medium Industrial Continuous Oven – gas) and its improvement options – Impact of lifetime on the LCC (€)
�
$�����
�������
�$�����
�������
�$�����
%������
%$�����
�������
�$�����
$������
8�< >�:? >��@
8��������
4�������
4�������
4������%
4�������
<���������
<��������8
<��������5
<��������!

ERA Technology Limited ERA Report No. 2012-0230
043122753 ENTR Lot 4 Final Report v6 406 © ERA Technology Ltd
Figure 58: Base Case 4b (Medium Industrial Batch Furnace – gas) and its improvement options – Impact of lifetime on the LCC (€)
�
$�����
�������
�$�����
�������
�$�����
%������
%$�����
�������
�$�����
8�< >�:? >��@
8��������4�������
4�������4������%
4�������<���������
<��������8<��������5<��������!
Figure 59: Base Case 5b (Medium Industrial Continuous Furnace – gas) and its improvement options – Impact of lifetime on the LCC (€)
�
$�����
�������
�$�����
�������
�$�����
%������
%$�����
�������
�$�����
$������
8�< >�:? >��@
8��������4�������4�������
4������%4�������<���������
<��������8<��������5<��������!

ERA Technology Limited ERA Report No. 2012-0230
043122753 ENTR Lot 4 Final Report v6 407 © ERA Technology Ltd
Figure 60: Base Case 6 (Large Industrial Furnace – gas) and its improvement options – Impact of lifetime on the LCC (€)
�
����������
����������
%���������
����������
$���������
����������
&���������
8�< >�:? >��@
8��������
4�������
4�������
4������%
4�������
4������$
<���������
<��������8
<��������5
Figure 61: Base Case 7 (Large Industrial Oven – gas) and its improvement options – Impact of lifetime on the LCC (€)
�
� �������
� �������
� �������
� �������
����������
����������
8�< >�:? >��@
8��������4�������
4�������
4������%
<���������
Variation in lifetime has an impact on life cycle cost because with longer lifetimes, more energy is consumed. This means that as lifetime increases, the costs and environmental impacts due to energy increase as a proportion of lifecycle totals. Longer lifetimes should help to justify investment in energy saving improvements as the total value of saved energy is larger but this does not affect payback periods or ROI and so may not be taken into account for investment decisions.

ERA Technology Limited ERA Report No. 2012-0230
043122753 ENTR Lot 4 Final Report v6 408 © ERA Technology Ltd
6.4.3 Assumptions related to the annual energy (electricity/natural gas) consumption
As for all energy-using products, energy consumption is considered as a major impact. In Task 4, average energy consumptions were defined for all Base Cases based on the inputs provided by stakeholders. Nevertheless, as the type of ovens and furnaces covered by each of the base cases is very diverse, it is worthwhile carrying out a sensitivity analysis on this parameter. There is a lower uncertainty with the annual energy consumption estimated for Base Case 2 till Base Case 7, so a smaller range for the variation in the annual energy consumption of these base cases is considered when compared to Base Case 1.
Variation in annual energy consumption of Base Case 1: • An increase of 40% • A decrease of 40%. Variation in annual energy consumption of Base Case 2 to Base Case 7: • An increase of 25% • A decrease of 25%. The variation of the LCC compared to the Base Case (Base) is provided in Figure 62 for each Base Case. The impact on the ratio of cost of energy consumption and LCC compared to the Base Case is presented in Figure 63.
Figure 62: Annual energy consumption - Variation of the LCC compared to the Base Case
�%��
����
����
��
���
���
%��
8�< ��� ��=

ERA Technology Limited ERA Report No. 2012-0230
043122753 ENTR Lot 4 Final Report v6 409 © ERA Technology Ltd
Figure 63: Annual energy consumption - Variation of ratio of cost of energy consumption and LCC compared to the Base Case
����
�����
�����
%����
�����
$����
�����
&����
�����
'����
������
85� 85��� 85��" 85�%� 85�%" 85��� 85��" 85�$� 85�$" 85�� 85�&
8�< ��� ��=
The variation in annual energy consumption does not have any impact on the order of options for BC 1, BC 2a, BC 3a, BC 4a and BC 5a (as only one design option is considered for these base cases). The impact of the variation in annual energy consumption on the design options considered for remaining base cases is presented in the figures below.
Figure 64: Base Case 2b (Medium Industrial Batch Oven – gas) and its improvement options – Impact of annual energy consumption on the LCC (€)
�
�������
�������
%������
�������
$������
�������
&������
8�< >�:? >��@
8��������
4�������
4�������
4������%
4�������
<���������
<��������8
<��������5
<��������!

ERA Technology Limited ERA Report No. 2012-0230
043122753 ENTR Lot 4 Final Report v6 410 © ERA Technology Ltd
Figure 65: Base Case 3b (Medium Industrial Continuous Oven – gas) and its improvement options – Impact of annual energy consumption on the LCC (€)
�
�������
�������
%������
�������
$������
�������
&������
�������
8�< >�:? >��@
8��������
4�������
4�������
4������%
4�������
<���������
<��������8
<��������5
<��������!
Figure 66: Base Case 4b (Medium Industrial Batch Furnace – gas) and its improvement options – Impact of annual energy consumption on the LCC (€)
�
�������
�������
%������
�������
$������
�������
&������
8�< >�:? >��@
8��������
4�������
4�������
4������%
4�������
<���������
<��������8
<��������5
<��������!

ERA Technology Limited ERA Report No. 2012-0230
043122753 ENTR Lot 4 Final Report v6 411 © ERA Technology Ltd
Figure 67: Base Case 5b (Medium Industrial Continuous Furnace – gas) and its improvement options – Impact of annual energy consumption on the LCC (€)
�
�������
�������
%������
�������
$������
�������
&������
�������
8�< >�:? >��@
8��������
4�������
4�������
4������%
4�������
<���������
<��������8
<��������5
<��������!
Figure 68: Base Case 6 (Large Industrial Furnace – gas) and its improvement options – Impact of annual energy consumption on the LCC (€)
���������������������%�������������������$�������������������&�������������������'���������
�����������
8�< >�:? >��@
8��������
4�������
4�������
4������%
4�������
4������$
<���������
<��������8
<��������5

ERA Technology Limited ERA Report No. 2012-0230
043122753 ENTR Lot 4 Final Report v6 412 © ERA Technology Ltd
Figure 69: Base Case 7 (Large Industrial Oven – gas) and its improvement options – Impact of annual energy consumption on the LCC (€)
�
� �������
� �������
� �������
� �������
����������
����������
����������
����������
����������
8�< >�:? >��@
8��������
4�������
4�������
4������%
<���������
It should be noted that increasing energy consumption will increase LCC but could also reduce payback period, as energy efficiency improvements will give larger cost savings. It should also be noted that reduced energy consumption would lengthen payback periods, making investments less attractive, when assessed from a “payback” point of view.
Although the variation in the average energy consumption of a furnace or oven base case is thought to be within ±25% for BC2 – BC7 on a generic “base case” level, the energy consumption of individual furnaces and ovens will vary by a much larger margin. Some furnaces will be used only occasionally, with much lower associated energy costs, whereas the largest furnaces in the EU will use far more energy. This is quite different to any other eco-design category studied previously where annual energy consumption is usually within a relatively small defined range. Increasing energy consumption will increase LCC but could also reduce payback period as any energy efficiency improvements will give larger cost savings. The corollary argument is that reduced energy consumption would lengthen payback periods, making investments less attractive.
6.4.4 Assumptions related to the energy (electricity/natural gas) tariff For all Base Cases and their improvement options, an average EU-27 electricity tariff of 0.0913 €/kWh and an average natural gas tariff of 0.0271 €/kWh was used214. However, the variation of energy tariff across Member States in EU could lead to different LCC for the Base Cases and their improvement options. Such extreme values are considered for the two scenarios presented below:
Variation in energy (electricity/natural gas) tariff: • An increase of 75% • A decrease of 42% 214 Based on the data from Eurostat

ERA Technology Limited ERA Report No. 2012-0230
043122753 ENTR Lot 4 Final Report v6 413 © ERA Technology Ltd
The variation of the LCC compared to the Base Case (Base) is provided in Figure 70 for each Base Case. The impact on the ratio of cost of energy consumption and LCC compared to the Base Case is presented in Figure 71.
Figure 70: Energy tariff - Variation of the LCC compared to the Base Case
����
����
����
��
���
���
���
���
8�< ��� ��= Figure 71: Energy tariff - Variation of ratio of cost of energy consumption and LCC compared to the Base Case
����
�����
�����
�����
�����
������
������
85� 85��� 85��" 85�%� 85�%" 85��� 85��" 85�$� 85�$" 85�� 85�&
8�< ��� ��=
The variation in energy tariff does not have any impact on the order of options for BC 1, BC 2a, BC 3a, BC 4a and BC 5a (as only one design option is considered for these base cases). The impact of the variation in energy tariff on the design options considered for the remaining base cases is presented in the figures below.

ERA Technology Limited ERA Report No. 2012-0230
043122753 ENTR Lot 4 Final Report v6 414 © ERA Technology Ltd
Figure 72: Base Case 2b (Medium Industrial Batch Oven – gas) and its improvement options – Impact of energy tariff on the LCC (€)
�
�������
�������
%������
�������
$������
�������
&������
8�< >�:? >��@
8��������
4�������
4�������
4������%
4�������
<���������
<��������8
<��������5
<��������!
Figure 73: Base Case 3b (Medium Industrial Continuous Oven – gas) and its improvement options – Impact of energy tariff on the LCC (€)
�
�������
�������
%������
�������
$������
�������
&������
�������
8�< >�:? >��@
8��������
4�������
4�������
4������%
4�������
<���������
<��������8
<��������5
<��������!

ERA Technology Limited ERA Report No. 2012-0230
043122753 ENTR Lot 4 Final Report v6 415 © ERA Technology Ltd
Figure 74: Base Case 4b (Medium Industrial Batch Furnace – gas) and its improvement options – Impact of energy tariff on the LCC (€)
�
�������
�������
%������
�������
$������
�������
&������
8�< >�:? >��@
8��������
4�������
4�������
4������%
4�������
<���������
<��������8
<��������5
<��������!
Figure 75: Base Case 5b (Medium Industrial Continuous Furnace – gas) and its improvement options – Impact of energy tariff on the LCC (€)
�
�������
�������
%������
�������
$������
�������
&������
�������
8�< >�:? >��@
8��������
4�������
4�������
4������%
4�������
<���������
<��������8
<��������5
<��������!

ERA Technology Limited ERA Report No. 2012-0230
043122753 ENTR Lot 4 Final Report v6 416 © ERA Technology Ltd
Figure 76: Base Case 6 (Large Industrial Furnace – gas) and its improvement options – Impact of energy tariff on the LCC (€)
�
����������
����������
%���������
����������
$���������
����������
&���������
����������
'���������
�����������
8�< >�:? >��@
8��������
4�������
4�������
4������%
4�������
4������$
<���������
<��������8
<��������5
Figure 77: Base Case 6 (Large Industrial Oven – gas) and its improvement options – Impact of energy tariff on the LCC (€)
�
� �������
� �������
� �������
� �������
����������
����������
����������
����������
����������
8�< >�:? >��@
8��������
4�������
4�������
4������%
<���������
It should be noted that, as alluded to previously in the text, the figures exploring these sensitivity analyses explicitly show that increasing energy prices will increase LCC, but should also reduce payback period, precisely because energy efficiency improvements will give proportionally larger cost savings. Also, reduced energy prices would lengthen payback periods making investments less attractive. Energy prices in some EU Member States are considerably higher than others, and so payback times in more expensive countries will be shorter, making energy efficiency investment more attractive; it should also be noted that higher energy prices could potentially cause manufacturers to relocate to cheaper EU Member States. For this sensitivity analysis, higher rather than lower energy prices will be more likely in the future, because it is anticipated that energy prices will rise in the long term, owing to increased demand and limited supply of fossil fuels.
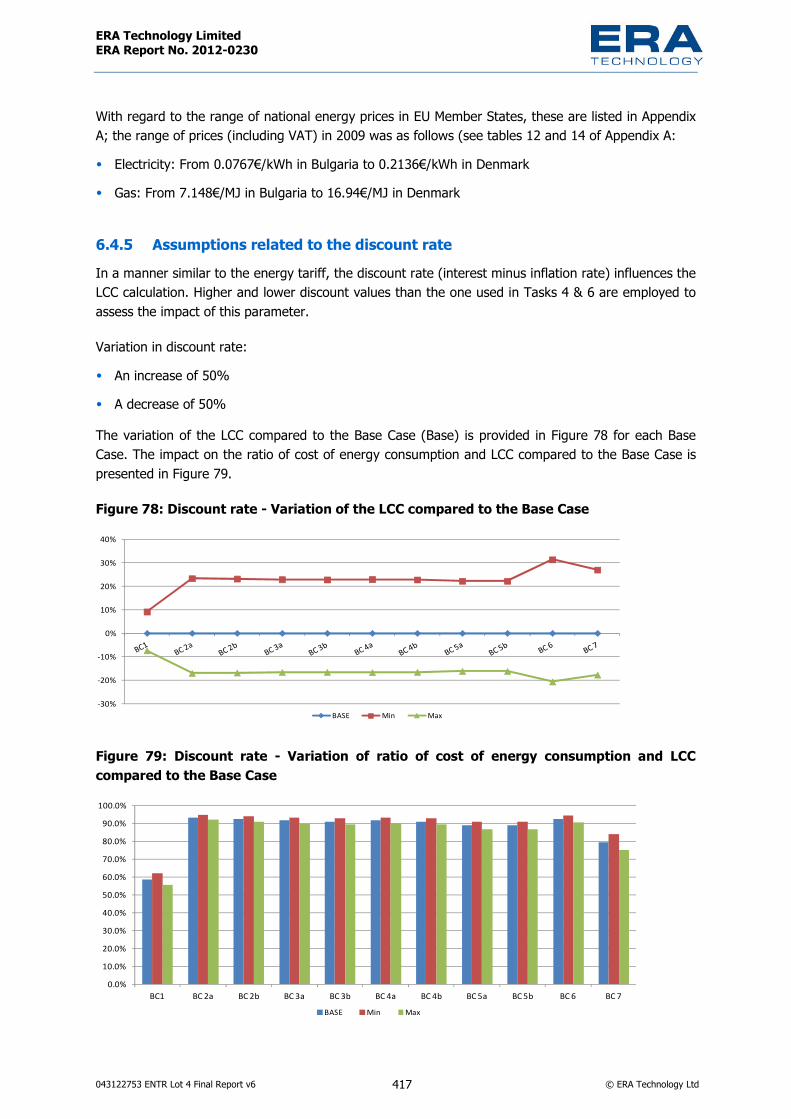
ERA Technology Limited ERA Report No. 2012-0230
043122753 ENTR Lot 4 Final Report v6 417 © ERA Technology Ltd
With regard to the range of national energy prices in EU Member States, these are listed in Appendix A; the range of prices (including VAT) in 2009 was as follows (see tables 12 and 14 of Appendix A: • Electricity: From 0.0767€/kWh in Bulgaria to 0.2136€/kWh in Denmark • Gas: From 7.148€/MJ in Bulgaria to 16.94€/MJ in Denmark
6.4.5 Assumptions related to the discount rate In a manner similar to the energy tariff, the discount rate (interest minus inflation rate) influences the LCC calculation. Higher and lower discount values than the one used in Tasks 4 & 6 are employed to assess the impact of this parameter.
Variation in discount rate: • An increase of 50% • A decrease of 50% The variation of the LCC compared to the Base Case (Base) is provided in Figure 78 for each Base Case. The impact on the ratio of cost of energy consumption and LCC compared to the Base Case is presented in Figure 79.
Figure 78: Discount rate - Variation of the LCC compared to the Base Case
�%��
����
����
��
���
���
%��
���
8�< ��� ��=
Figure 79: Discount rate - Variation of ratio of cost of energy consumption and LCC compared to the Base Case
����
�����
�����
%����
�����
$����
�����
&����
�����
'����
������
85� 85��� 85��" 85�%� 85�%" 85��� 85��" 85�$� 85�$" 85�� 85�&8�< ��� ��=

ERA Technology Limited ERA Report No. 2012-0230
043122753 ENTR Lot 4 Final Report v6 418 © ERA Technology Ltd
The variation in discount rate does not have any impact on the order of options for BC 1, BC 2a, BC 3a, BC 4a and BC 5a (as only one design option is considered for these base cases). The impact of the variation in discount rate on the design options considered for remaining base cases is presented in the figures below.
Figure 80: Base Case 2b (Medium Industrial batch Oven – gas) and its improvement options – Impact of discount rate on the LCC (€)
�
$�����
�������
�$�����
�������
�$�����
%������
%$�����
�������
�$�����
8�< >�:? >��@
8��������
4�������
4�������
4������%
4�������
<���������
<��������8
<��������5
<��������!
Figure 81: Base Case 3b (Medium Industrial Continuous Oven – gas) and its improvement options – Impact of discount rate on the LCC (€)
�
�������
�������
%������
�������
$������
�������
8�< >�:? >��@
8��������
4�������
4�������
4������%
4�������
<���������
<��������8
<��������5
<��������!

ERA Technology Limited ERA Report No. 2012-0230
043122753 ENTR Lot 4 Final Report v6 419 © ERA Technology Ltd
Figure 82: Base Case 4b (Medium Industrial batch Furnace – gas) and its improvement options – Impact of discount rate on the LCC (€)
�
$�����
�������
�$�����
�������
�$�����
%������
%$�����
�������
�$�����
$������
8�< >�:? >��@
8��������
4�������
4�������
4������%
4�������
<���������
<��������8
<��������5
<��������!
Figure 83: Base Case 5b (Medium Industrial Continuous Furnace – gas) and its improvement options – Impact of discount rate on the LCC (€)
�
�������
�������
%������
�������
$������
�������
8�< >�:? >��@
8��������
4�������
4�������
4������%
4�������
<���������
<��������8
<��������5
<��������!

ERA Technology Limited ERA Report No. 2012-0230
043122753 ENTR Lot 4 Final Report v6 420 © ERA Technology Ltd
Figure 84: Base Case 6 (Large Industrial Furnace – gas) and its improvement options – Impact of discount rate on the LCC (€)
�
����������
����������
%���������
����������
$���������
����������
&���������
����������
8�< >�:? >��@
8��������
4�������
4�������
4������%
4�������
4������$
<���������
<��������8
<��������5
Figure 85: Base Case 6 (Large Industrial Oven – gas) and its improvement options – Impact of discount rate on the LCC (€)
�
� �������
� �������
� �������
� �������
����������
����������
����������
8�< >�:? >��@
8��������
4�������
4�������
4������%
<���������
A lower discount rate results in higher costs in later years and so the minimum value of discount rate results in a higher LCC. Discount rate, inflation rate and interest rates all influence investment decisions in diverse ways. Higher interest rates make repayments of loans more expensive whereas high inflation rates can make the apparent future value of these repayments smaller as the value of money declines. The discount rate affects the apparent value of future earnings; therefore, for example with a discount rate of 5%, €1000 earned in one year’s time is only worth €950 today. The further into the future, the lower the value of future earnings for investment decisions. If the discount rates increase, this lowers the apparent value of future earnings extending payback periods, and can even mean that investments can never appear to be paid back although in reality, they will be.

ERA Technology Limited ERA Report No. 2012-0230
043122753 ENTR Lot 4 Final Report v6 421 © ERA Technology Ltd
6.4.6 Assumptions related to product stock Estimating the stock of laboratory and industrial ovens and furnaces in EU is not an easy task due to the fragmented nature of the market and also limited availability of corresponding market data.
In Task 2, stock data for 2008 was defined based on available information and inputs provided by stakeholders. These values were used in Task 4 to assess energy consumption (and other environmental impacts) at EU level. However, the accuracy of these stock data is quite limited and a sensitivity analysis regarding this parameter is therefore desirable.
Variation in stock: • An increase of 10% • A decrease of 10%
The variation of total energy consumption of the EU stock of BC1 to BC5 is presented in Figure 86 and for BC6 and BC7 in Figure 87.
Figure 86: Energy consumption (in TWh) of the EU stock of BC 1 to BC 5
�
$
��
�$
��
�$
%�
%$
��
85�� 85��� 85��" 85�%� 85�%" 85��� 85��" 85�$� 85�$"
8�< �:? ��@ Figure 87: Energy consumption (in TWh) of the EU stock of BC 6 and BC 7
�
���
���
���
���
����
����
����
85�� 85�&8�< �:? ��@
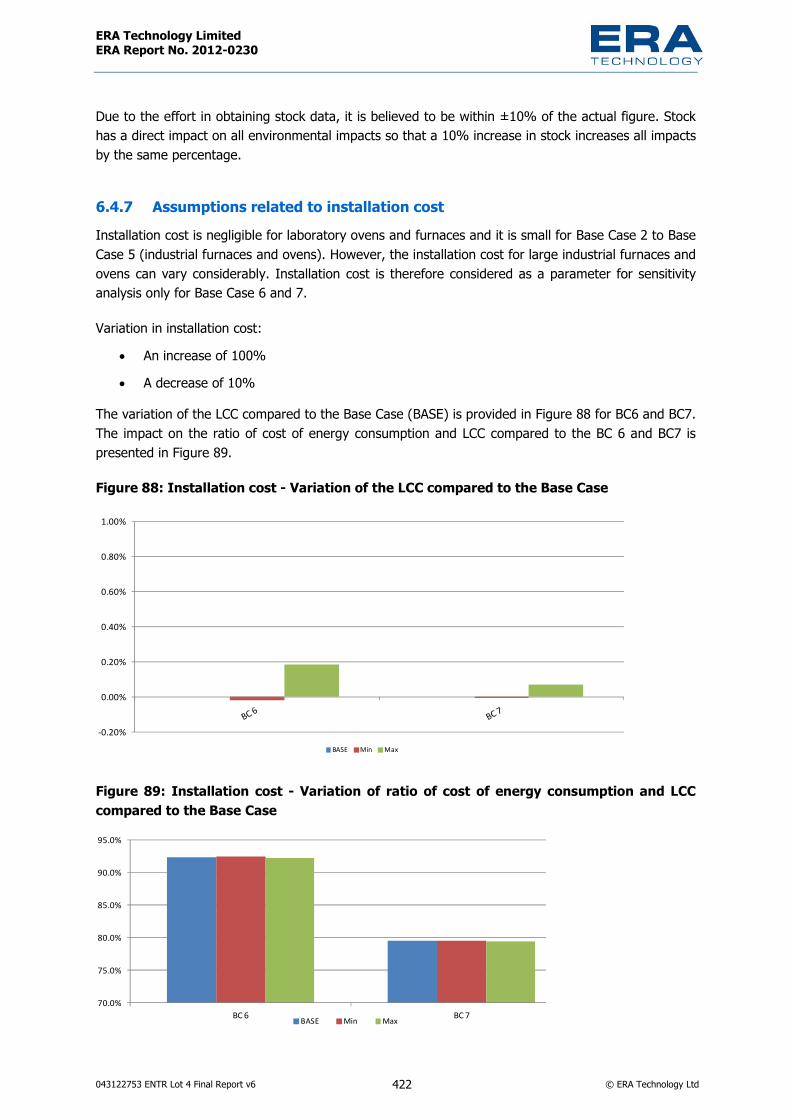
ERA Technology Limited ERA Report No. 2012-0230
043122753 ENTR Lot 4 Final Report v6 422 © ERA Technology Ltd
Due to the effort in obtaining stock data, it is believed to be within ±10% of the actual figure. Stock has a direct impact on all environmental impacts so that a 10% increase in stock increases all impacts by the same percentage.
6.4.7 Assumptions related to installation cost Installation cost is negligible for laboratory ovens and furnaces and it is small for Base Case 2 to Base Case 5 (industrial furnaces and ovens). However, the installation cost for large industrial furnaces and ovens can vary considerably. Installation cost is therefore considered as a parameter for sensitivity analysis only for Base Case 6 and 7.
Variation in installation cost: • An increase of 100% • A decrease of 10%
The variation of the LCC compared to the Base Case (BASE) is provided in Figure 88 for BC6 and BC7. The impact on the ratio of cost of energy consumption and LCC compared to the BC 6 and BC7 is presented in Figure 89.
Figure 88: Installation cost - Variation of the LCC compared to the Base Case
������
�����
�����
�����
�����
�����
�����
8�< ��� ��= Figure 89: Installation cost - Variation of ratio of cost of energy consumption and LCC compared to the Base Case
&����
&$���
�����
�$���
'����
'$���
85�� 85�&8�< ��� ��=

ERA Technology Limited ERA Report No. 2012-0230
043122753 ENTR Lot 4 Final Report v6 423 © ERA Technology Ltd
The impact of the variation in installation cost on the design options considered for BC6 and BC7 is presented in the figures below.
Figure 90: Base Case 6 (Large Industrial Furnace – gas) and its improvement options – Impact of installation cost on the LCC (€)
����������
����������
����������
$���������
$���������
$���������
$���������
$���������
����������
����������
8�< >�:? >��@
8��������
4�������
4�������
4������%
4�������
4������$
<���������
<��������8
<��������5
Figure 91: Base Case 7 (Large Industrial Oven – gas) and its improvement options – Impact of installation cost on the LCC (€)
� �������
� �������
' �������
' �������
' �������
' �������
' �������
����������
����������
����������
����������
8�< >�:? >��@
8��������
4�������
4�������
4������%
<���������
Installation costs for large furnaces and ovens vary considerably, in that installation at a new site requires a new building and services, whereas the replacement of an existing furnace has a much smaller installation cost. Despite this, a 100% increase in average installation costs only has a small effect on LCC. However actual furnaces vary considerably depending on their size complexity and energy consumption.

ERA Technology Limited ERA Report No. 2012-0230
043122753 ENTR Lot 4 Final Report v6 424 © ERA Technology Ltd
6.4.8 Assumptions related to the quantity of materials used for construction The quantity of materials used for construction of large industrial furnaces and ovens can vary substantially. It is therefore considered as a parameter for sensitivity analysis, but solely for Base Cases 6 and 7.
Variation in quantity of materials used for construction:
• An increase of 40% • A decrease of 20%
The variation of the environmental impacts compared to the Base Case (Base) is provided in Figure 92 for BC6 and BC7.
Figure 92: Quantity of materials used for construction – impact on the environmental impacts of BC 6 and BC 7
(����� ��� )�*+ �,
�����-�����������)
0�����*�������,
A
0����-������1�2��������A
0����-��1�����
�2�����������
�A
+���������+�����
���+0����
�����)�� �� �����*��,
3��������4� ��
5�.�������*345,
�����������4� ��
�����������*�4�,
6��7)��������*6�,
��6������������ �������*��-�����,
6��7)��������*6�,
�������������* �,
85������ �� ���� ���� ���� ���� �� ��� ��� ���� ���� ��� ���� ���� ����85�����= �� ��� ��� ��� ��� �� $� �� ��� ��� �� ��� ��� ���85�&���� �� ���� ���� ���� ��� �� �%� ��� ���� ���� ��� �%� ���� ����85�&���= �� ��� ��� ��� '� �� &� �� ��� %'� �� �� ��� ���
�%��
����
����
��
���
���
%��
���
$��
These results show that the quantities of materials used has a negligible impact on total lifecycle energy consumption and greenhouse gas emissions but that this variable will directly affect other environmental impacts.

ERA Technology Limited ERA Report No. 2012-0230
043122753 ENTR Lot 4 Final Report v6 425 © ERA Technology Ltd
6.5. System improvement Improving the system-level ecodesign or environmental performance of furnaces and ovens, and their related interaction/ integration with surrounding processes and products is mainly relevant to large installations. For example:
• Integrated steel production – heat and combustible gases from one furnace are used by other furnaces and processes within the installation including for electricity generation.
• Oil refineries – comprises complex multi-process installations with many thermal processes, of which only some are furnaces. Heat from some processes is, in turn, used by other processes. The ecodesign of oil refineries should be studied for whole installations at a system level, because it is very difficult to assess oil refinery furnaces as isolated equipment. EU oil refinery energy consumption estimated to be within the range of c.330 – 1000 TWh
• Cement production – heat recovered from the kiln is used by other processes which can include steam generation (used for drying), electricity generation (used for ball mills), etc. It is possible to grind raw materials to smaller particles, and this reduces kiln energy consumption, but the energy used for ball mills is increased, resulting in no overall net benefit
• Incinerators – produce heat and electricity used elsewhere • Ceramics installations – heat from combustion gases and hot air from fast cooling is used in other
processes including drying although there are limits on the amount of recovered heat that can be reused.
• Metals processes – heat treatment furnaces emit heat that can be recovered with heat exchangers to form steam or hot water. This can be used elsewhere in the installation and so reduces installation energy consumption, but not the energy consumption specific to the furnace.
6.6. Conclusions of the sensitivity analysis The effect of varying the average input data on six parameters: energy price, discount rate, product purchase price, product lifetime, product stock in EU and annual energy consumption has been determined. The ranking of the Base case and the different improvement options/scenarios is almost unaffected for the 7 different Base cases. For all situations, the LLCC remains the same option that was already identified in section 6.2 of this Task. This observation strengthens the reliability of the outcomes presented in previous Tasks. The results showed that for most variables, the effect of changing parameters was small and predictable but changes in energy tariffs had a very significant impact on LCC. As energy prices are likely to increase in the future, this analysis shows that the financial benefits of reducing energy consumption would be larger than the values calculated using current energy tariffs. Varying discount rate also had a significant cost impact which implies that low or zero interest rate loans may be very effective in encouraging investment in energy efficiency.

ERA Technology Limited ERA Report No. 2012-0230
043122753 ENTR Lot 4 Final Report v6 426 © ERA Technology Ltd
7. Task 7 – Policy and impact analysis Note that the conclusions presented in this chapter represent the views of the consultants and do not necessarily reflect the opinion of the European Commission. Whereas Tasks 1-6 serve as the basis for future work (if any), Task 7 serves as a summary of policy implications as seen by the team responsible for the preparatory study.
Task 5 determined that the main environmental impacts of industrial and laboratory furnaces and ovens are energy consumption and greenhouse gas emissions (GHG), both in the use phase. This study has also shown that energy consumption is very significant, at over 1 000 TWh/year. The table below summarises the potential energy savings (over 25 years) that could be achieved by the three policy options that are explored here in Task 7.
Cumulative primary energy savings 2011 – 2035 from policy options
Energy savings over the period 2011-2035 (in TWh) Policy recommendation scenario compared to BaU 1524 LLCC scenario compared to BAU 2352 BAT scenario compared to BAU 2353
These savings would be achieved using three eco-design options in three tiers, as follows:
Options Tier 1 (from 2014 onwards)
Tier 2 (from 2018 onwards)
Tier3 (from 2024 onwards)
Heat recovery
For BC 6 and BC 7 only – energy saving and cost is half of total difference between BaU and BAT
For all industrial, energy saving and cost is half of total difference between BAU and BAT
BAT
Insulation Same as BaU BAT BAT Gas/ air For BC 2 – BC 7, energy saving and
cost is half of total difference between BaU and BAT
BAT BAT
The projected total energy savings related to the direct fossil fuel combustion (mainly natural gas) between 2011 and 2035 for all the base cases (BC1 – BC7) for the three scenarios are presented in table below.
Natural gas (direct fossil fuel combustion) energy savings over the period 2011-2035 (TWh)
Ecodesign Options
Policy recommendation
scenario
LLCC scenario BAT scenario
BC1 - - -BC2 39 75 75 BC3 3 8 8
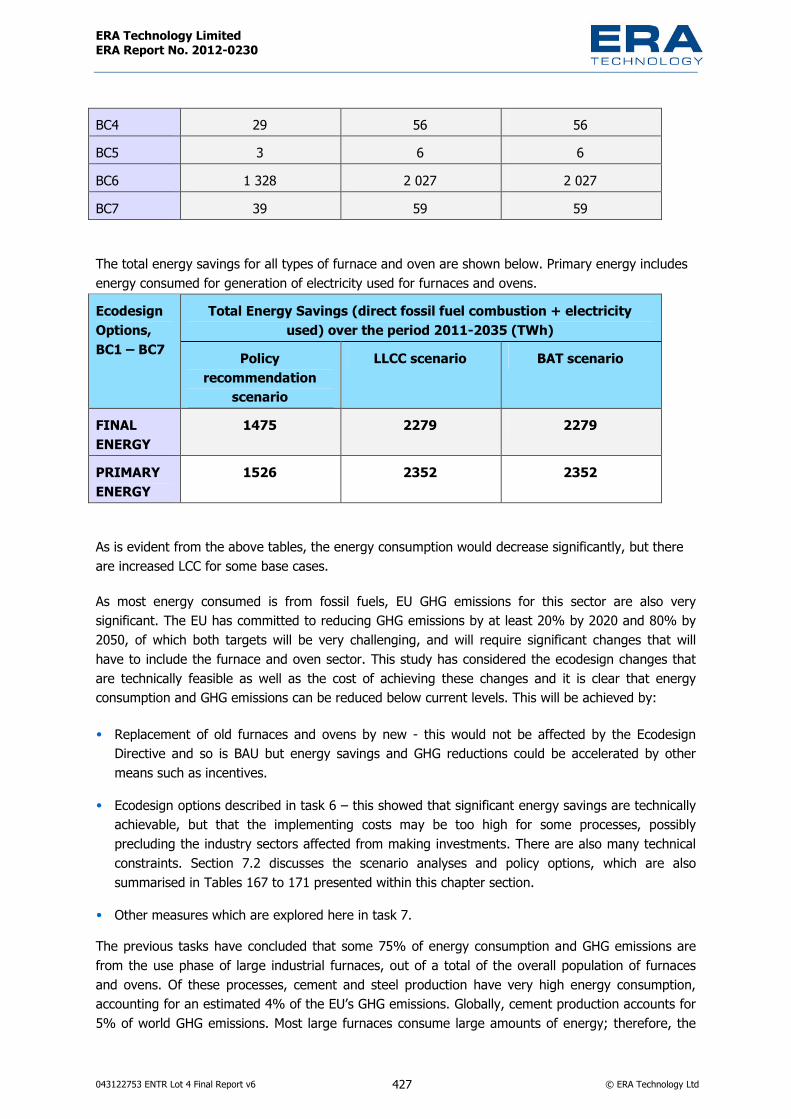
ERA Technology Limited ERA Report No. 2012-0230
043122753 ENTR Lot 4 Final Report v6 427 © ERA Technology Ltd
BC4 29 56 56 BC5 3 6 6BC6 1 328 2 027 2 027 BC7 39 59 59
The total energy savings for all types of furnace and oven are shown below. Primary energy includes energy consumed for generation of electricity used for furnaces and ovens.
Total Energy Savings (direct fossil fuel combustion + electricity used) over the period 2011-2035 (TWh)
Ecodesign Options, BC1 – BC7 Policy
recommendation scenario
LLCC scenario BAT scenario
FINAL ENERGY
1475 2279 2279
PRIMARY ENERGY
1526 2352 2352
As is evident from the above tables, the energy consumption would decrease significantly, but there are increased LCC for some base cases.
As most energy consumed is from fossil fuels, EU GHG emissions for this sector are also very significant. The EU has committed to reducing GHG emissions by at least 20% by 2020 and 80% by 2050, of which both targets will be very challenging, and will require significant changes that will have to include the furnace and oven sector. This study has considered the ecodesign changes that are technically feasible as well as the cost of achieving these changes and it is clear that energy consumption and GHG emissions can be reduced below current levels. This will be achieved by:
• Replacement of old furnaces and ovens by new - this would not be affected by the Ecodesign Directive and so is BAU but energy savings and GHG reductions could be accelerated by other means such as incentives.
• Ecodesign options described in task 6 – this showed that significant energy savings are technically achievable, but that the implementing costs may be too high for some processes, possibly precluding the industry sectors affected from making investments. There are also many technical constraints. Section 7.2 discusses the scenario analyses and policy options, which are also summarised in Tables 167 to 171 presented within this chapter section.
• Other measures which are explored here in task 7. The previous tasks have concluded that some 75% of energy consumption and GHG emissions are from the use phase of large industrial furnaces, out of a total of the overall population of furnaces and ovens. Of these processes, cement and steel production have very high energy consumption, accounting for an estimated 4% of the EU’s GHG emissions. Globally, cement production accounts for 5% of world GHG emissions. Most large furnaces consume large amounts of energy; therefore, the

ERA Technology Limited ERA Report No. 2012-0230
043122753 ENTR Lot 4 Final Report v6 428 © ERA Technology Ltd
cost of energy is very high, and there is already an incentive to minimise energy consumption of new furnaces. However, this is limited by the availability of finance, and the present manner of the attitude of companies - and financial entities – when making their investment analyses, based on ROI.
The overall size of energy and GHG savings that would be achievable using ecodesign BAT for all large furnaces and ovens is less than the overall 20% GHG reduction target by 2020, for the EU as a whole, due to the efficiency savings already made, and the technical constraints that exist. Therefore, a 20% reduction in GHG emissions from industrial and laboratory ovens and furnaces is presently not achievable by ecodesign alone, although accelerating replacement may achieve 20% overall within this sector. An 80% GHGs emissions reduction would be even more difficult to meet, without the adoption of new technologies. A relevant, related option currently being researched - but which is far from commercialisation - is carbon capture and storage (CCS). The use of electric heating, using electricity from sources other than fossil fuels is an alternative way of reducing the EU’s GHG emissions. However, currently most industrial furnace and oven energy use fossil fuels (coal, oil and gas) and there is almost no research into new electric processes that could replace the current technologies that rely on fossil fuel combustion. Furthermore, if it were possible for a significant proportion of the EU’s fossil fuel furnaces to be converted to utilise electric heating, then a very large increase in fossil fuel-free electricity generation would be needed. If fossil fuel processes were to be replaced by newly developed electric processes, total EU electricity production would need to increase. Research will be needed to develop alternative electric furnace processes, however, neither these alternatives nor CCS will be ready and functioning by 2020.
A longer-term 80% GHG emission reduction would not be possible solely through replacement and use of current BAT and BNAT ecodesign only, and therefore other options will need to be considered and several of which are described in Task 7. These options could include incentives, public procurement policy, promoting more recycling and more drastic options such as limiting consumption of energy-intensive materials. The use of biomass is often suggested as a solution, but currently-available biomass is not suitable for some high temperature processes, and the quantity of sustainable biomass that is available is too small to have a significant impact, as discussed in section 4.2.2.
A comprehensive calculation of total GHG emissions for each EU citizen should include emissions outside the EU from manufacturing products that are used within the EU. These emissions would include those from furnace processes that are not regulated in the same way as is performed within the EU. As these emissions from outside the EU also influence climate change, EU policy should not ignore options to limit the impact of these emissions from third (non-EU) countries, and several policy options (described here in task 7) have been considered that could indirectly affect these processes.
7.1. Policy Analysis Several policy options are considered here including those based on the ecodesign options described in task 6 and also other options outside the scope of the Ecodesign Directive.
• Ecodesign options need to be based on exact definitions that are described in task 1 for the following: - Furnace and oven

ERA Technology Limited ERA Report No. 2012-0230
043122753 ENTR Lot 4 Final Report v6 429 © ERA Technology Ltd
- Rebuilt and refurbished furnace and oven - Laboratory. Definitions are also needed for: - Heat recovery - Insulation performance - Gas/ air ratio.
Exclusions from ecodesign requirements should be considered when heating is not the primary function of the equipment or where the environmental impact is very small. This may exclude incinerators, medical devices such as incubators, grain driers and chambers whose maximum temperature is <90°C (see Task 6 for discussion of potential candidates for exclusion).
Definitions of options The three main eco-design options considered in Task 6 are defined as follows:
• Heat recovery and reuse - The total heat recovery and reuse is the sum of the percentage of the heat recovered and reused from the combustion gases that emerge from the main heat zone (i.e. by heat exchangers, recuperators, regenerators, pre-heaters, etc.). This is the definition used by the Japanese legislation which relate to furnaces and ovens. Optionally, heat recovery could also include any other heat recovered from the hot product as a percentage of total input heat.
• Insulation performance – calculated values as W/m2 of heat flow through large area of insulation assuming no heat bridges. The calculation assumes an ambient temperature of 20°C, still air, and the calculation uses characteristics of insulation and refractory materials provided by suppliers, a maximum designed furnace temperature and insulation and refractory thickness. Another assumption is that heat flow is in only one dimension.
• Gas / air ratio – λ-value as described in section 5.3, page 298. The value is the average measured over a day with a permitted tolerance of ±0.05. This option cannot apply where oxidising or reducing conditions are needed for process reasons. This option must also be utilised without prejudice to safety legislation.
Other important definitions include process temperature which is defined as the temperature of the combustion gases, ventilated air or other gases that emerge from the main furnace or oven chamber. Where multi-zone processes are used, the temperature is defined as that of the gases leaving the zone with the highest temperature.
Inappropriateness exclusion Unlike the products considered by most other eco-design studies, industrial furnaces and ovens need to be far more varied in their design. They also have many diverse technical constraints which limit the applicability of some of the eco-design options. This can mean that although a few furnaces already achieve 60% heat recovery and reuse, it is technically not possible for other designs to achieve this level. For some designs, it may be technically feasible, but the payback time may be far too long. These differences are due to the different technical characteristics of the large variety of processes carried out in industrial furnaces and ovens. One option that could be considered, which

ERA Technology Limited ERA Report No. 2012-0230
043122753 ENTR Lot 4 Final Report v6 430 © ERA Technology Ltd
would allow the broadest range of furnaces and ovens to be included within the scope of future eco-design requirements, is to use the approach used by the standby and off-mode Regulation (EC No. 1275/2008). This requires that standby or off-mode are available, and from also 2013 that power management is installed, unless such modes are inappropriate for the intended use of the equipment.For example, auto-off is inappropriate if the equipment must be on continuously, such as a fax machine. The above type of approach could be used for furnaces and ovens, where the designer would describe in the technical file why eco-design measures are inappropriate (and so not adopted). An example might be with batch furnaces with short cycle times, where the energy consumption would be higher if the required W/m2 was achieved than with thinner insulation.
7.2. Scenario Analysis This section presents an analysis of ecodesign options based on minimum requirements for the different base cases. An Excel tool is used to calculate the impacts of different scenarios over the period 2011-2035. The tool uses the following assumptions:
• The scenarios are modelled on a discrete annual basis to match the available data; • Sales and stock projections were taken from Task 2; • Primary energy consumption was used as the most relevant and representative indicator to allow
comparison of environmental impacts with other ecodesign preparatory studies. The tool calculates expenditure in Euros and primary energy in GJ under different policy scenarios. The primary energy results are not limited to the use phase, but also take into account the energy required over the whole lifetime (including the manufacturing, distribution and end-of-life phases). These calculations are based on the results of Task 6;
• Energy consumption is allocated uniformly over the lifetime of the product although in theory this is only true of the use phase. Given the relatively low shares of other life-cycle phases in energy consumption, this assumption is considered reasonable;
• Similar to energy consumption, greenhouse gas (GHG) emissions are allocated uniformly over the lifetime of the product although in theory this is only true of the use phase. Given the relatively low shares of other life-cycle phases in GHG emissions, this assumption is considered reasonable
• Expenditure measures the yearly value of the entire market. It consists of the money spent to buy the product (purchase price), taking into account in the year of purchase, and the operating costs (energy, water, maintenance and repair), which are spread over the lifetime of the furnace.
7.2.1 Base Case 1 (Laboratory ovens) Following two scenarios are assessed for the BC 1:
• Business as Usual (BaU) scenario: assumes that products on the market do not include any new improvement options in future

ERA Technology Limited ERA Report No. 2012-0230
043122753 ENTR Lot 4 Final Report v6 431 © ERA Technology Ltd
• Scenario 1: Assumes that Least Life-Cycle Cost (LLCC) option which is also the Best Available Technology (BAT) option for all product categories of laboratory ovens, is implemented from 2014215.
Figure 96 to Figure 98 show projected total primary energy consumption, expenditure and greenhouse gas emissions between 2011 and 2035 for BC 1 (laboratory ovens), and according to the two scenarios previously described (BAU and scenario 1).
Figure 93: Comparison of total energy consumption (in TWh) for the two scenarios over the period 2011–2035 for BC 1
���
��$
���
��$
���
��$
%��
����
���%
���$
���&
���'
����
���%
���$
���&
���'
��%�
��%%
��%$
���������
���������
8�# <���������
Scenario 1 would result in an energy consumption reduction of 1TW/year from 2030.
215 The BAT and LLCC option candidate in case of laboratory ovens (BC 1) are same as only one design improvement option could be identified for BC 1 whose environmental and economic assessment is provided in Task 6.
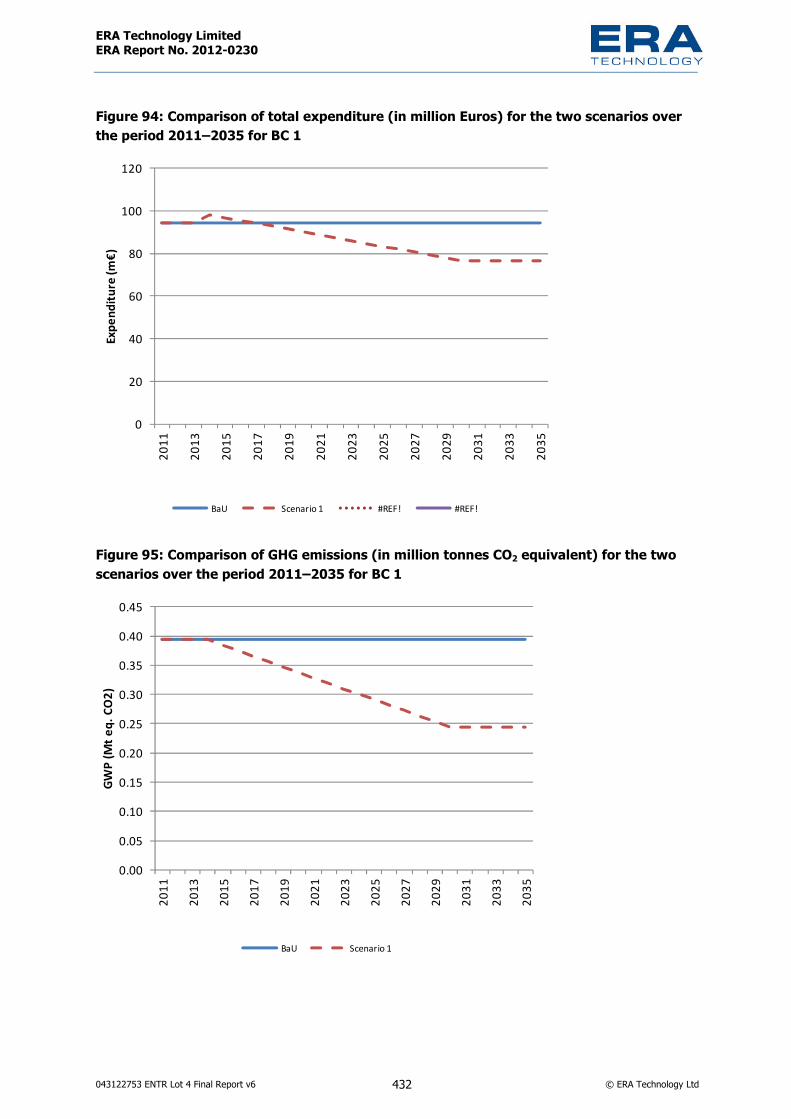
ERA Technology Limited ERA Report No. 2012-0230
043122753 ENTR Lot 4 Final Report v6 432 © ERA Technology Ltd
Figure 94: Comparison of total expenditure (in million Euros) for the two scenarios over the period 2011–2035 for BC 1
�
��
��
��
��
���
�����
��
���%
���$
���&
���'
����
���%
���$
���&
���'
��%�
��%%
��%$
��������������
8�# <��������� B� ;C B� ;C
Figure 95: Comparison of GHG emissions (in million tonnes CO2 equivalent) for the two scenarios over the period 2011–2035 for BC 1
����
���$
����
���$
����
���$
��%�
��%$
����
���$
����
���%
���$
���&
���'
����
���%
���$
���&
���'
��%�
��%%
��%$
���������� !�
8�# <���������
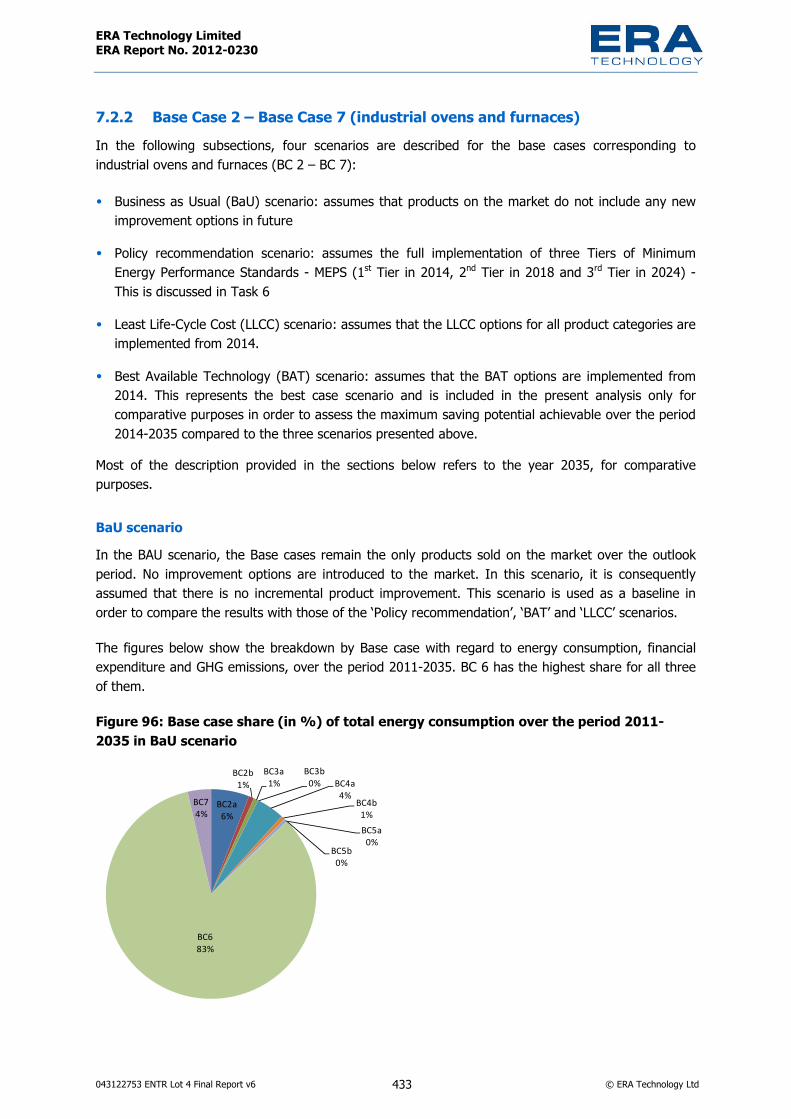
ERA Technology Limited ERA Report No. 2012-0230
043122753 ENTR Lot 4 Final Report v6 433 © ERA Technology Ltd
7.2.2 Base Case 2 – Base Case 7 (industrial ovens and furnaces) In the following subsections, four scenarios are described for the base cases corresponding to industrial ovens and furnaces (BC 2 – BC 7):
• Business as Usual (BaU) scenario: assumes that products on the market do not include any new improvement options in future
• Policy recommendation scenario: assumes the full implementation of three Tiers of Minimum Energy Performance Standards - MEPS (1st Tier in 2014, 2nd Tier in 2018 and 3rd Tier in 2024) - This is discussed in Task 6
• Least Life-Cycle Cost (LLCC) scenario: assumes that the LLCC options for all product categories are implemented from 2014.
• Best Available Technology (BAT) scenario: assumes that the BAT options are implemented from 2014. This represents the best case scenario and is included in the present analysis only for comparative purposes in order to assess the maximum saving potential achievable over the period 2014-2035 compared to the three scenarios presented above.
Most of the description provided in the sections below refers to the year 2035, for comparative purposes.
BaU scenario In the BAU scenario, the Base cases remain the only products sold on the market over the outlook period. No improvement options are introduced to the market. In this scenario, it is consequently assumed that there is no incremental product improvement. This scenario is used as a baseline in order to compare the results with those of the ‘Policy recommendation’, ‘BAT’ and ‘LLCC’ scenarios.
The figures below show the breakdown by Base case with regard to energy consumption, financial expenditure and GHG emissions, over the period 2011-2035. BC 6 has the highest share for all three of them.
Figure 96: Base case share (in %) of total energy consumption over the period 2011-2035 in BaU scenario
85����
85�"��
85%���
85%"�� 85��
��85�"��85$���
85$"��
85��%�
85&��

ERA Technology Limited ERA Report No. 2012-0230
043122753 ENTR Lot 4 Final Report v6 434 © ERA Technology Ltd
Figure 97: Base case share (in %) of total expenditure over the period 2011-2035 in BaU scenario
85��'�
85�"��
85%���
85%"��
85��&�
85�"��85$���
85$"��
85�&&�
85&%�
Figure 98 Base case share (in %) of total GHG emissions over the period 2011-2035 in BaU scenario
85��$�
85�"��
85%���
85%"�� 85��
%� 85�"��85$���
85$"��
85����
85&��
By 2035, it has been modelled that industrial furnaces and ovens covered in this study would require 1648 TWh of primary energy, and that the total primary energy consumption over the period 2011-2035 would be 41188 TWh. Such furnaces and ovens are predicted to result in total emissions of 8025 Mt CO2 eq over the period 2011-2035. Regarding expenditure, 22.5 €bn is projected to be spent on these furnaces and ovens in the year 2035, and the market is projected to represent a cumulative expenditure over the period 2011-2035 of 563 €bn.
Policy recommendation scenario In this scenario, the performance of products sold on the market over the outlook period correspond to the criteria’s set by the policy recommendation as presented in table below.

ERA Technology Limited ERA Report No. 2012-0230
043122753 ENTR Lot 4 Final Report v6 435 © ERA Technology Ltd
Table 167. Dates for implementation of eco-design option tiers Options Tier 1
(from 2014 onwards) Tier 2 (from 2018 onwards)
Tier3 (from 2024 onwards)
Heat recovery
For BC 6 and BC 7 only – energy saving and cost is half of total difference between BaU and BAT
For all industrial, energy saving and cost is half of total difference between BAU and BAT
BAT
Insulation Same as BaU BAT BAT Gas / air For BC 2 – BC 7, energy saving
and cost is half of total difference between BaU and BAT
BAT BAT
Estimated energy saving values were obtained from performance parameter data provided by stakeholders. “Average” values were used as intermediate tiers and were typically half way between “worst” and “BAT” values. Therefore, if the BAT option(s) postulated were to reduce energy consumption by 40%, then the intermediate saving would be half of this, i.e., 20%. Too little data was provided by stakeholders to know the actual costs of intermediate options, and we have only a few values for BAT options. The best estimates achievable under these circumstances were by assuming that the additional cost of achieving intermediate tiers was half of the cost of achieving the BAT tiers, although this is probably inaccurate, to a larger or smaller extent. Tier 2 should be achievable by 2018, although BAT insulation may be achievable earlier, possibly by 2016
The figures below show the breakdown by Base case of energy consumption, expenditure and GHG emissions over the period 2011-2035. BC 6 has the highest share for all three of them.
Figure 99: Base case share (in %) of total energy consumption over the period 2011-2035 in ‘Policy recommendation’ scenario
85����
85�"��
85%���
85%"�� 85��
��85�"��85$���
85$"��
85��%�
85&��

ERA Technology Limited ERA Report No. 2012-0230
043122753 ENTR Lot 4 Final Report v6 436 © ERA Technology Ltd
Figure 100: Base case share (in %) of total expenditure over the period 2011-2035 in ‘Policy recommendation’ scenario
85��'�
85�"��
85%���
85%"��
85��&�
85�"��85$���
85$"��
85�&&�
85&��
Figure 101: Base case share (in %) of total GHG emissions over the period 2011-2035 in ‘Policy recommendation’ scenario
85��$�
85�"��
85%���
85%"�� 85��
%� 85�"��85$���
85$"��
85��$�
85&��
In 2035, industrial furnaces and ovens covered in this study would require 1482 TWh of primary energy, and total consumption over the period 2011-2035 would be 39664 TWh. The furnaces covered in the study would result in total emissions of 7725 Mt CO2 eq over the period of 2011-2035. Regarding expenditure, 21 €bn is projected to be spent on these furnaces and ovens in 2035, and the market is projected to represent a cumulative 553 €bn over the period 2011-2035.
LLCC scenario The LLCC scenario considers that the LLCC improvement option as described in Task 6 is implemented for each Base Case. From 2014, all products sold include these LLCC options and no more Base Cases are sold (the market shift takes place from one year to the next). Table 8-4 summarises the LLCC options for each Base Case identified in Task 7.
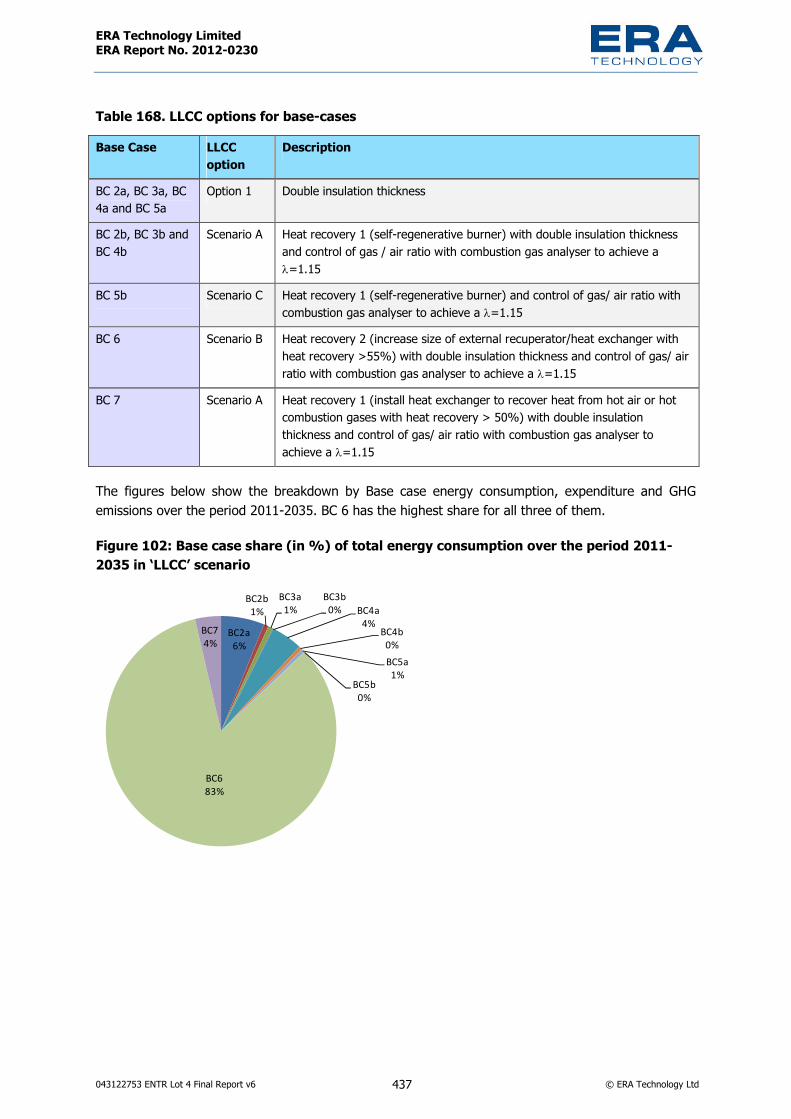
ERA Technology Limited ERA Report No. 2012-0230
043122753 ENTR Lot 4 Final Report v6 437 © ERA Technology Ltd
Table 168. LLCC options for base-cases Base Case LLCC
option Description
BC 2a, BC 3a, BC 4a and BC 5a
Option 1 Double insulation thickness
BC 2b, BC 3b and BC 4b
Scenario A Heat recovery 1 (self-regenerative burner) with double insulation thickness and control of gas / air ratio with combustion gas analyser to achieve a λ=1.15
BC 5b Scenario C Heat recovery 1 (self-regenerative burner) and control of gas/ air ratio with combustion gas analyser to achieve a λ=1.15
BC 6 Scenario B Heat recovery 2 (increase size of external recuperator/heat exchanger with heat recovery >55%) with double insulation thickness and control of gas/ air ratio with combustion gas analyser to achieve a λ=1.15
BC 7 Scenario A Heat recovery 1 (install heat exchanger to recover heat from hot air or hot combustion gases with heat recovery > 50%) with double insulation thickness and control of gas/ air ratio with combustion gas analyser to achieve a λ=1.15
The figures below show the breakdown by Base case energy consumption, expenditure and GHG emissions over the period 2011-2035. BC 6 has the highest share for all three of them.
Figure 102: Base case share (in %) of total energy consumption over the period 2011-2035 in ‘LLCC’ scenario
85����
85�"��
85%���
85%"�� 85��
��85�"��85$���
85$"��
85��%�
85&��

ERA Technology Limited ERA Report No. 2012-0230
043122753 ENTR Lot 4 Final Report v6 438 © ERA Technology Ltd
Figure 103: Base case share (in %) of total expenditure over the period 2011-2035 in ‘LLCC’ scenario
85��'�
85�"��
85%���
85%"��
85��&�
85�"��85$���
85$"��
85�&��
85&��
Figure 104: Base case share (in %) of total GHG emissions over the period 2011-2035 in ‘LLCC’ scenario
85��$�
85�"��
85%���
85%"�� 85��
�� 85�"��85$���
85$"��
85��$�
85&��
By 2035, industrial furnaces and ovens covered by this study would require 1436 TWh of primary energy, and total consumption over the period 2011-2035 would be 38836 TWh. They will result in total emissions of 7561 Mt CO2 e.q. over the period of 2011-2035. Regarding expenditure, 20.4 €bn is projected to be spent on these furnaces and ovens in the year 2035, and the market is projected to represent a cumulative expenditure of 545.1 €bn during the 25 year period between 2011 and 2035.
BAT scenario The BAT scenario considers that the BAT option as described in Task 6 is implemented from 2014 for each Base Case. From 2014, all products sold include these options. The table below is a reminder of the BAT options identified in Task 6.

ERA Technology Limited ERA Report No. 2012-0230
043122753 ENTR Lot 4 Final Report v6 439 © ERA Technology Ltd
Table 169 BAT improvement options by Base Case Base Case BAT option Description BC 2a, BC 3a, BC 4a and BC 5a
Option 1 Double insulation thickness
BC 2b, BC 3b, BC 4b and BC 5b
Scenario A Heat recovery 1 (self-regenerative burner) with double insulation thickness and control of gas/ air ratio with combustion gas analyser to achieve a λ=1.15
BC 6 Scenario B Heat recovery 2 (increase size of external recuperator/heat exchanger with heat recovery >55%) with double insulation thickness and control of gas/ air ratio with combustion gas analyser to achieve a λ=1.15
BC 7 Scenario A Heat recovery 1 (install heat exchanger to recover heat from hot air or hot combustion gases with heat recovery > 50%) with double insulation thickness and control of gas/ air ratio with combustion gas analyser to achieve a λ=1.15
The figures below show the breakdown by Base case of energy consumption, expenditure and GHG emissions over the period 2011-2035. BC 6 has the highest share for all three parameters.
Figure 105: Base case share (in %) of total energy consumption over the period 2011-2035 in ‘BAT’ scenario
85����
85�"��
85%���
85%"�� 85��
��85�"��85$���
85$"��
85��%�
85&��

ERA Technology Limited ERA Report No. 2012-0230
043122753 ENTR Lot 4 Final Report v6 440 © ERA Technology Ltd
Figure 106: Base case share (in %) of total expenditure over the period 2011-2035 in ‘BAT’ scenario
85��'�
85�"��
85%���
85%"��
85��&�
85�"��85$���
85$"��
85�&��
85&��
Figure 107: Base case share (in %) of total GHG emissions over the period 2011-2035 in ‘BAT’ scenario
85��$�
85�"��
85%���
85%"�� 85��
�� 85�"��85$���
85$"��
85��$�
85&��
By 2035, industrial furnaces and ovens covered in this study would require 1436 TWh of primary energy, and total consumption over the period 2011-2035 would be 38835 TWh. They will result in total emissions of 7561 Mt CO2 eq over the period of 2011-2035. Regarding expenditure, 20.4 €bn is projected to be spent on these furnaces and ovens in 2035, and the market is projected to represent a cumulative 545.2 €bn over the period 2011-2035.
Comparison of the scenarios This comparison is made in terms of electricity consumption, GHG emissions and consumer expenditure. As expected, the BAT scenario enables the largest primary energy savings (both annually and over the period 2011-2035) while the LLCC scenario results in the smallest annual expenditure.

ERA Technology Limited ERA Report No. 2012-0230
043122753 ENTR Lot 4 Final Report v6 441 © ERA Technology Ltd
However, looking at the overall results, the LLCC and BAT scenarios overlap, in terms of energy consumption, GHG emissions and expenditure, except for Base case 5b. It can also be seen that the improvement options have an insignificant overall impact on expenditure since higher product prices are offset by lower operating costs.
The table below shows that there are large cumulative savings (around 1520 TWh) from the ‘Policy recommendation’ scenario. However, there is a greater savings potential (around 2350 TWh) from moving to the LLCC or BAT scenarios.
Table 170. Cumulative primary energy savings 2011 – 2035 from policy options Energy savings over the period 2011-2035 (in TWh)
Policy recommendation scenario compared to BaU 1524 LLCC scenario compared to BAU 2352 BAT scenario compared to BAU 2353
Figures 103 to Figure 117 show projected total primary energy consumption between 2011 and 2035 by Base case and according to the four scenarios previously described.
Figure 108: Comparison of total energy consumption (in TWh) for the four scenarios over the period 2011–2035 for BC 2a
�'��
'���
'���
'���
'%��
'���
'$��
'���
'&��
����
����
���%
����
���$
����
���&
����
���'
����
����
����
���%
����
���$
����
���&
����
���'
��%�
��%�
��%�
��%%
��%�
��%$
���������
���������
8�# �����)�����..�������� 9955 8�(

ERA Technology Limited ERA Report No. 2012-0230
043122753 ENTR Lot 4 Final Report v6 442 © ERA Technology Ltd
Figure 109: Comparison of total energy consumption (in TWh) for the four scenarios over the period 2011–2035 for BC 2b
���
���
���
���
���
����
����
����
����
����
����
���%
����
���$
����
���&
����
���'
����
����
����
���%
����
���$
����
���&
����
���'
��%�
��%�
��%�
��%%
��%�
��%$
���������
���������
8�# �����)�����..�������� 9955 8�( Figure 110: Comparison of total energy consumption (in TWh) for the four scenarios over the period 2011–2035 for BC 3a
����
����
����
���%
����
���$
����
���&
����
���'
����
����
����
���%
����
���$
����
���&
����
���'
����
����
����
���%
����
���$
����
���&
����
���'
��%�
��%�
��%�
��%%
��%�
��%$
���������
���������
8�# �����)�����..�������� 9955 8�(
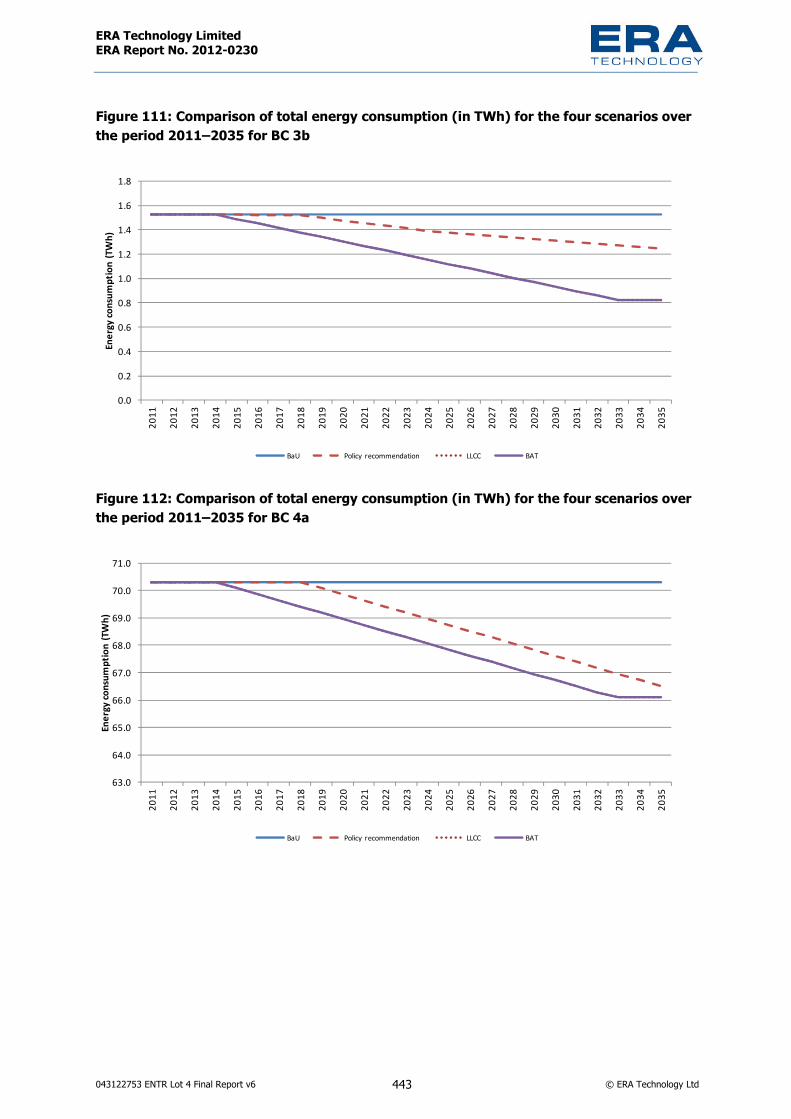
ERA Technology Limited ERA Report No. 2012-0230
043122753 ENTR Lot 4 Final Report v6 443 © ERA Technology Ltd
Figure 111: Comparison of total energy consumption (in TWh) for the four scenarios over the period 2011–2035 for BC 3b
���
���
���
���
���
���
���
���
���
���
����
����
���%
����
���$
����
���&
����
���'
����
����
����
���%
����
���$
����
���&
����
���'
��%�
��%�
��%�
��%%
��%�
��%$
���������
���������
8�# �����)�����..�������� 9955 8�( Figure 112: Comparison of total energy consumption (in TWh) for the four scenarios over the period 2011–2035 for BC 4a
�%��
����
�$��
����
�&��
����
�'��
&���
&���
����
����
���%
����
���$
����
���&
����
���'
����
����
����
���%
����
���$
����
���&
����
���'
��%�
��%�
��%�
��%%
��%�
��%$
���������
���������
8�# �����)�����..�������� 9955 8�(
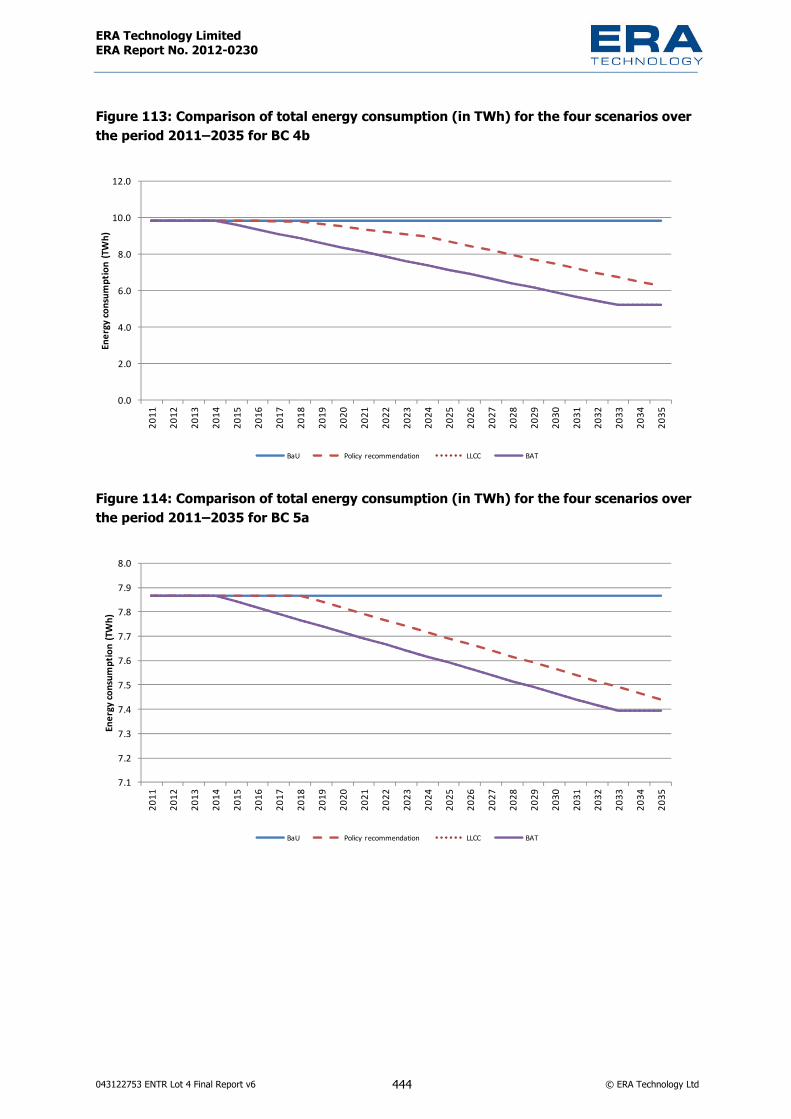
ERA Technology Limited ERA Report No. 2012-0230
043122753 ENTR Lot 4 Final Report v6 444 © ERA Technology Ltd
Figure 113: Comparison of total energy consumption (in TWh) for the four scenarios over the period 2011–2035 for BC 4b
���
���
���
���
���
����
����
����
����
���%
����
���$
����
���&
����
���'
����
����
����
���%
����
���$
����
���&
����
���'
��%�
��%�
��%�
��%%
��%�
��%$
���������
���������
8�# �����)�����..�������� 9955 8�( Figure 114: Comparison of total energy consumption (in TWh) for the four scenarios over the period 2011–2035 for BC 5a
&��
&��
&�%
&��
&�$
&��
&�&
&��
&�'
���
����
����
���%
����
���$
����
���&
����
���'
����
����
����
���%
����
���$
����
���&
����
���'
��%�
��%�
��%�
��%%
��%�
��%$
���������
���������
8�# �����)�����..�������� 9955 8�(

ERA Technology Limited ERA Report No. 2012-0230
043122753 ENTR Lot 4 Final Report v6 445 © ERA Technology Ltd
Figure 115: Comparison of total energy consumption (in TWh) for the four scenarios over the period 2011–2035 for BC 5b
���
���
���
���
���
���
���
����
����
���%
����
���$
����
���&
����
���'
����
����
����
���%
����
���$
����
���&
����
���'
��%�
��%�
��%�
��%%
��%�
��%$
���������
���������
8�# �����)�����..�������� 9955 8�( Figure 116: Comparison of total energy consumption (in TWh) for the four scenarios over the period 2011–2035 for BC 6
������
��$���
������
��$���
�%����
�%$���
������
����
����
���%
����
���$
����
���&
����
���'
����
����
����
���%
����
���$
����
���&
����
���'
��%�
��%�
��%�
��%%
��%�
��%$
���������
���������
8�# �����)�����..�������� 9955 8�(
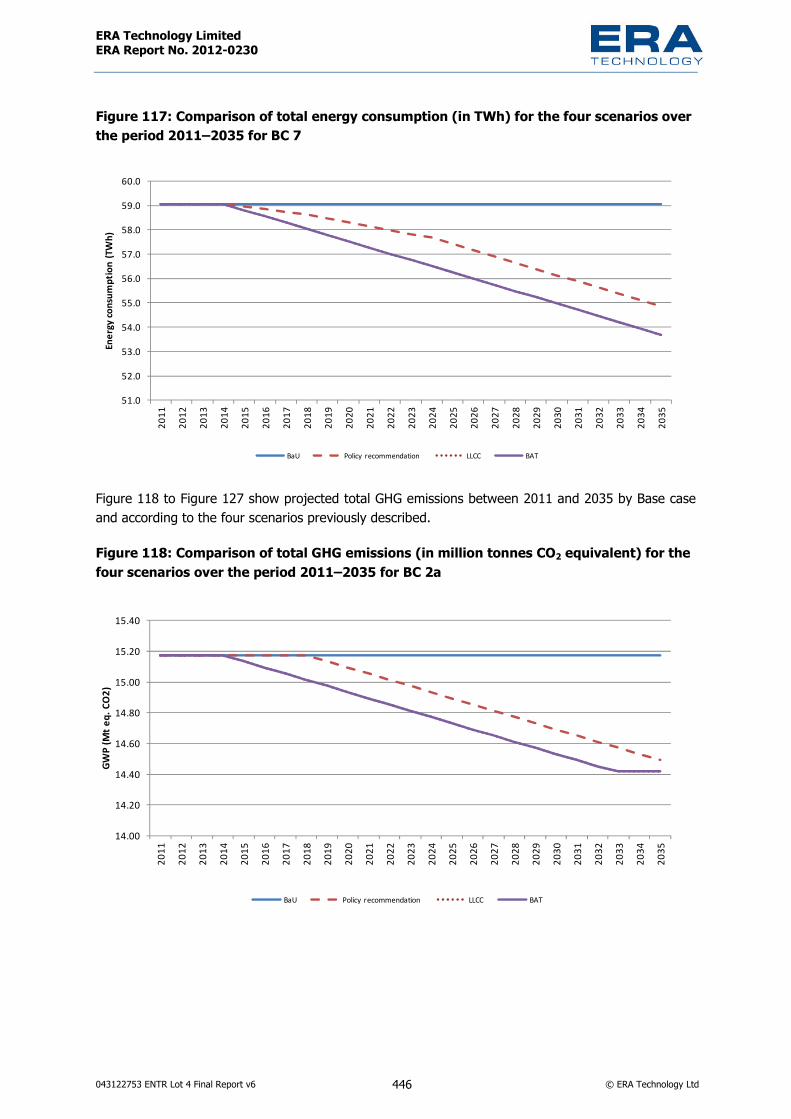
ERA Technology Limited ERA Report No. 2012-0230
043122753 ENTR Lot 4 Final Report v6 446 © ERA Technology Ltd
Figure 117: Comparison of total energy consumption (in TWh) for the four scenarios over the period 2011–2035 for BC 7
$���
$���
$%��
$���
$$��
$���
$&��
$���
$'��
����
����
����
���%
����
���$
����
���&
����
���'
����
����
����
���%
����
���$
����
���&
����
���'
��%�
��%�
��%�
��%%
��%�
��%$
���������
���������
8�# �����)�����..�������� 9955 8�( Figure 118 to Figure 127 show projected total GHG emissions between 2011 and 2035 by Base case and according to the four scenarios previously described.
Figure 118: Comparison of total GHG emissions (in million tonnes CO2 equivalent) for the four scenarios over the period 2011–2035 for BC 2a
�����
�����
�����
�����
�����
�$���
�$���
�$���
����
����
���%
����
���$
����
���&
����
���'
����
����
����
���%
����
���$
����
���&
����
���'
��%�
��%�
��%�
��%%
��%�
��%$
���������� !�
8�# �����)�����..�������� 9955 8�(

ERA Technology Limited ERA Report No. 2012-0230
043122753 ENTR Lot 4 Final Report v6 447 © ERA Technology Ltd
Figure 119: Comparison of total GHG emissions (in million tonnes CO2 equivalent) for the four scenarios over the period 2011–2035 for BC 2b
����
��$�
����
��$�
����
��$�
%���
����
����
���%
����
���$
����
���&
����
���'
����
����
����
���%
����
���$
����
���&
����
���'
��%�
��%�
��%�
��%%
��%�
��%$
���������� !�
8�# �����)�����..�������� 9955 8�( Figure 120: Comparison of total GHG emissions (in million tonnes CO2 equivalent) for the four scenarios over the period 2011–2035 for BC 3a
��$�
����
����
����
����
����
��&�
��&�
��&�
����
����
���%
����
���$
����
���&
����
���'
����
����
����
���%
����
���$
����
���&
����
���'
��%�
��%�
��%�
��%%
��%�
��%$
���������� !�
8�# �����)�����..�������� 9955 8�(
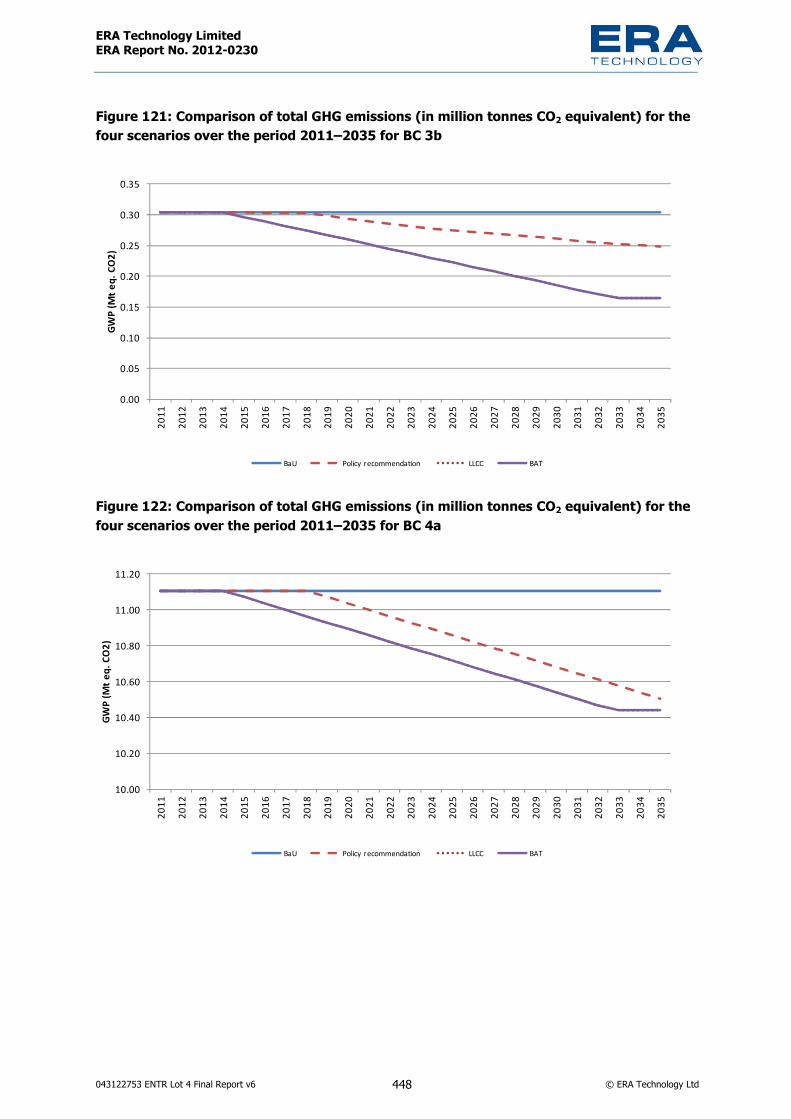
ERA Technology Limited ERA Report No. 2012-0230
043122753 ENTR Lot 4 Final Report v6 448 © ERA Technology Ltd
Figure 121: Comparison of total GHG emissions (in million tonnes CO2 equivalent) for the four scenarios over the period 2011–2035 for BC 3b
����
���$
����
���$
����
���$
��%�
��%$
����
����
���%
����
���$
����
���&
����
���'
����
����
����
���%
����
���$
����
���&
����
���'
��%�
��%�
��%�
��%%
��%�
��%$
���������� !�
8�# �����)�����..�������� 9955 8�( Figure 122: Comparison of total GHG emissions (in million tonnes CO2 equivalent) for the four scenarios over the period 2011–2035 for BC 4a
�����
�����
�����
�����
�����
�����
�����
����
����
���%
����
���$
����
���&
����
���'
����
����
����
���%
����
���$
����
���&
����
���'
��%�
��%�
��%�
��%%
��%�
��%$
���������� !�
8�# �����)�����..�������� 9955 8�(

ERA Technology Limited ERA Report No. 2012-0230
043122753 ENTR Lot 4 Final Report v6 449 © ERA Technology Ltd
Figure 123: Comparison of total GHG emissions (in million tonnes CO2 equivalent) for the four scenarios over the period 2011–2035 for BC 4b
����
��$�
����
��$�
����
��$�
����
����
���%
����
���$
����
���&
����
���'
����
����
����
���%
����
���$
����
���&
����
���'
��%�
��%�
��%�
��%%
��%�
��%$
���������� !�
8�# �����)�����..�������� 9955 8�( Figure 124: Comparison of total GHG emissions (in million tonnes CO2 equivalent) for the four scenarios over the period 2011–2035 for BC 5a
����
����
����
����
����
����
����
����
����
����
���%
����
���$
����
���&
����
���'
����
����
����
���%
����
���$
����
���&
����
���'
��%�
��%�
��%�
��%%
��%�
��%$
���������� !�
8�# �����)�����..�������� 9955 8�(

ERA Technology Limited ERA Report No. 2012-0230
043122753 ENTR Lot 4 Final Report v6 450 © ERA Technology Ltd
Figure 125: Comparison of total GHG emissions (in million tonnes CO2 equivalent) for the four scenarios over the period 2011–2035 for BC 5b
����
���$
����
���$
����
���$
����
����
���%
����
���$
����
���&
����
���'
����
����
����
���%
����
���$
����
���&
����
���'
��%�
��%�
��%�
��%%
��%�
��%$
���������� !�
8�# �����)�����..�������� 9955 8�( Figure 126: Comparison of total GHG emissions (in million tonnes CO2 equivalent) for the four scenarios over the period 2011–2035 for BC 6
���
���
�%�
���
�$�
���
�&�
���
����
����
���%
����
���$
����
���&
����
���'
����
����
����
���%
����
���$
����
���&
����
���'
��%�
��%�
��%�
��%%
��%�
��%$
���������� !�
8�# �����)�����..�������� 9955 8�(

ERA Technology Limited ERA Report No. 2012-0230
043122753 ENTR Lot 4 Final Report v6 451 © ERA Technology Ltd
Figure 127: Comparison of total GHG emissions (in million tonnes CO2 equivalent) for the four scenarios over the period 2011–2035 for BC 7
�����
�����
�����
�����
�����
�����
�����
�����
�����
�����
����
����
���%
����
���$
����
���&
����
���'
����
����
����
���%
����
���$
����
���&
����
���'
��%�
��%�
��%�
��%%
��%�
��%$
���������� !�
8�# �����)�����..�������� 9955 8�( Figure 128 to Figure 137 show projected total expenditure between 2011 and 2035 by Base case and according to the four scenarios previously described.
Figure 128: Comparison of total expenditure (in million Euros) for the four scenarios over the period 2011–2035 for BC 2a
�'��
�'��
�'��
����
����
����
����
����
����
����
����
���%
����
���$
����
���&
����
���'
����
����
����
���%
����
���$
����
���&
����
���'
��%�
��%�
��%�
��%%
��%�
��%$
��������������
8�# �����)�����..�������� 9955 8�(

ERA Technology Limited ERA Report No. 2012-0230
043122753 ENTR Lot 4 Final Report v6 452 © ERA Technology Ltd
Figure 129: Comparison of total expenditure (in million Euros) for the four scenarios over the period 2011–2035 for BC 2b
�
$�
���
�$�
���
�$�
����
����
���%
����
���$
����
���&
����
���'
����
����
����
���%
����
���$
����
���&
����
���'
��%�
��%�
��%�
��%%
��%�
��%$
��������������
8�# �����)�����..�������� 9955 8�( Figure 130: Comparison of total expenditure (in million Euros) for the four scenarios over the period 2011–2035 for BC 3a
���
�%�
�%�
�%�
�%�
�%�
���
���
���
���
����
����
���%
����
���$
����
���&
����
���'
����
����
����
���%
����
���$
����
���&
����
���'
��%�
��%�
��%�
��%%
��%�
��%$
��������������
8�# �����)�����..�������� 9955 8�(

ERA Technology Limited ERA Report No. 2012-0230
043122753 ENTR Lot 4 Final Report v6 453 © ERA Technology Ltd
Figure 131: Comparison of total expenditure (in million Euros) for the four scenarios over the period 2011–2035 for BC 3b
�
$
��
�$
��
�$
%�
����
����
���%
����
���$
����
���&
����
���'
����
����
����
���%
����
���$
����
���&
����
���'
��%�
��%�
��%�
��%%
��%�
��%$
��������������
8�# �����)�����..�������� 9955 8�( Figure 132: Comparison of total expenditure (in million Euros) for the four scenarios over the period 2011–2035 for BC 4a
�%��
����
����
����
����
����
�$��
�$��
�$��
����
����
���%
����
���$
����
���&
����
���'
����
����
����
���%
����
���$
����
���&
����
���'
��%�
��%�
��%�
��%%
��%�
��%$
��������������
8�# �����)�����..�������� 9955 8�(

ERA Technology Limited ERA Report No. 2012-0230
043122753 ENTR Lot 4 Final Report v6 454 © ERA Technology Ltd
Figure 133: Comparison of total expenditure (in million Euros) for the four scenarios over the period 2011–2035 for BC 4b
Figure 134: Comparison of total expenditure (in million Euros) for the four scenarios over the period 2011–2035 for BC 5a
�&��&��&��&��&�����������������'��'�
����
����
���%
����
���$
����
���&
����
���'
����
����
����
���%
����
���$
����
���&
����
���'
��%�
��%�
��%�
��%%
��%�
��%$
��������������
8�# �����)�����..�������� 9955 8�(
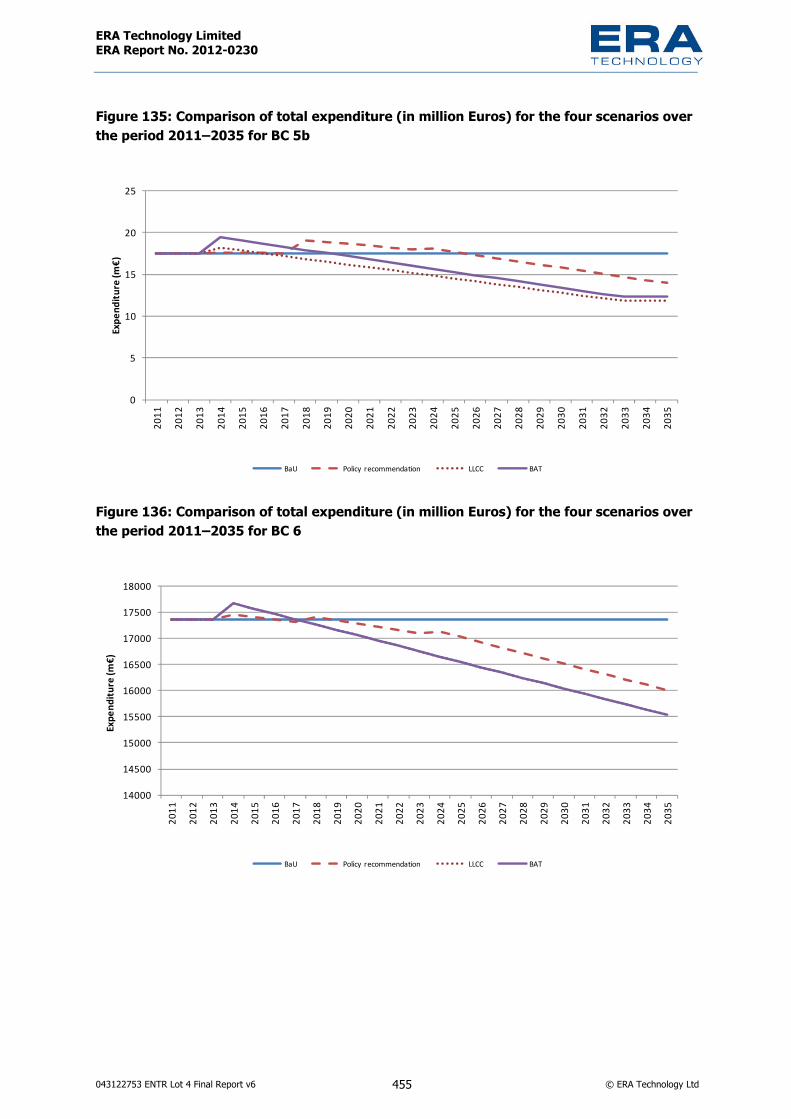
ERA Technology Limited ERA Report No. 2012-0230
043122753 ENTR Lot 4 Final Report v6 455 © ERA Technology Ltd
Figure 135: Comparison of total expenditure (in million Euros) for the four scenarios over the period 2011–2035 for BC 5b
�
$
��
�$
��
�$
����
����
���%
����
���$
����
���&
����
���'
����
����
����
���%
����
���$
����
���&
����
���'
��%�
��%�
��%�
��%%
��%�
��%$
��������������
8�# �����)�����..�������� 9955 8�( Figure 136: Comparison of total expenditure (in million Euros) for the four scenarios over the period 2011–2035 for BC 6
�����
��$��
�$���
�$$��
�����
��$��
�&���
�&$��
�����
����
����
���%
����
���$
����
���&
����
���'
����
����
����
���%
����
���$
����
���&
����
���'
��%�
��%�
��%�
��%%
��%�
��%$
��������������
8�# �����)�����..�������� 9955 8�(

ERA Technology Limited ERA Report No. 2012-0230
043122753 ENTR Lot 4 Final Report v6 456 © ERA Technology Ltd
Figure 137: Comparison of total expenditure (in million Euros) for the four scenarios over the period 2011–2035 for BC 7
&��
&'�
���
���
���
�%�
���
�$�
���
�&�
���
����
����
���%
����
���$
����
���&
����
���'
����
����
����
���%
����
���$
����
���&
����
���'
��%�
��%�
��%�
��%%
��%�
��%$
��������������
8�# �����)�����..�������� 9955 8�(
Conclusions from analysis of policy options The above results show that in the long term, large reductions in energy consumption and GHG emissions are achievable in the EU, and there are also significant financial savings resulting from lower energy consumption by 2035 for most base cases, although not for BC5a or BC7. However, these conclusions are based on several assumptions that may not be correct for all types of furnace and oven processes. These limitations and assumptions are outlined below:
• Industrial furnaces are mostly custom-designed for specific processes, all of which have particular requirements, limitations and constraints. Therefore, the maximum energy efficiency that is achievable - as defined in section 0.3 - is very varied. For example, the maximum achievable % heat recovery by a regenerative burner of a flat glass melting furnace is lower than the maximum achievable with a container glass melting furnace, because the container glass feedstock is available with a much higher proportion of recycled glass. These large differences are difficult to capture by the methodology used for eco-design preparatory studies, based on representative base cases, as there is so much variation in the designs available or implemented. As a result, the additional costs and potential energy savings values used for policy and impact analysis may be reasonable estimates of “average” values, but the particular costs and energy reductions achievable for some process designs will be very different to others. Costs will be higher for some process types and may be lower for others. The energy saving achievable is also very varied, and depends on the extent to which improvements have already been made to minimise energy consumption. In general, with very large furnaces, if the cost of energy is a significant proportion of production costs, there is already a significant financial incentive to reduce energy consumption and hence there will be less scope for further reductions. This is the situation with new furnaces for steel, cement, lime and large-scale glass manufacture, which are also the largest energy consuming furnaces in the EU.

ERA Technology Limited ERA Report No. 2012-0230
043122753 ENTR Lot 4 Final Report v6 457 © ERA Technology Ltd
• Another limitation of this approach is to consider BAT and LLCC for eco-design impact calculations. Due to technical constraints, not all designs can utilise the LLCC options which have been described in Tasks 5 and 6. Some designs cannot use heat recovery options resulting in the LLCC, due to technical constraints; this therefore means that a proportion of the market will only be able to achieve a smaller reduction in energy consumption, and that therefore the cost to achieve it will be larger. As a result of these limitations in methodology, the EU energy consumption and GHG emission reductions figures estimated in Task 7 may be smaller than those indicated in figures 114 and 124, and financial savings may also be smaller, if we assume no increase in energy tariffs.
• The financial savings due to reduced energy consumption may, however, be larger than estimated, because no increase in energy prices is assumed. This seems unlikely; significant increases are more likely, due to increasing global energy demand that is not matched by increases in supply of fossil fuels.
• The calculations for medium-size ovens (BC2) include batch bakery ovens. These would, however, be better regulated with commercial bakery ovens, which are very similar in design, and which were studied in Eco-design Lot 22.
7.2.3 Other policy options Other policy options that are not within the scope of the Ecodesign Directive may be considered, in order to reduce EU GHG emissions and energy consumption that are due to furnaces and ovens. Options could include:
Benchmarking is used in a few countries outside the EU including China and Malaysia; however, note that it may be difficult to implement, as described in the Unido report209.
Mandatory audits are used in several Asian countries, including China and India, although they are not currently used in the EU. This approach can be effective, but does not guarantee that improvements will be made, especially with SMEs.
Incentives – The analyses presented in this report indicate that there are technical measures that generate a return on investment, but which may have too long a payback period, given present commercial perspectives, for industry to act. Furthermore, the long lifetimes of furnaces and ovens result in less efficient models being used into the medium- and long-term future. However, the rapid replacement of such furnaces and ovens would result in significant energy savings. As Ecodesign only applies to new furnaces, it would be worth looking at a variety of other options, in order to promote market transformation via a significant proportion of furnace and oven replacements:
• Schemes such as the UK Climate Change Levy tax on fuel for energy (with large discount given, if energy reduction targets are met).
• Low / zero interest loans and financing schemes are available in some countries such as the UK216 • Free advice: The USA and Canada217 governments both provide free advice to users. The US DoE
provides funding for research (to both large and small enterprises), training and energy 216 http://www.carbontrust.co.uk/cut-carbon-reduce-costs/products-services/financing/business-financing/pages/finance-overview.aspx 217 http://oee.nrcan.gc.ca/industrial/cipec/13673
ERA Technology Limited ERA Report No. 2012-0230
043122753 ENTR Lot 4 Final Report v6 458 © ERA Technology Ltd
assessments 218 . The USA also has an “Energy Star for Industry” program that assists manufacturers to develop more energy efficient technologies219. In the EU, this is available, for example in the UK220.
• The Netherlands and several other EU Member State governments have had a voluntary agreement with their industries, including users of furnaces. The Dutch scheme has operated since 1989, and involves 90% of Dutch industrial energy consumption, with the participation of some 900 companies. Savings of 22.3% were achieved in 2000. The Dutch government provided tax rebates, subsidies and energy audits, and a third programme is currently running which will end by 2020. Evidence from some countries indicates that voluntary agreements (with furnace users) are more difficult to implement with SME companies.
• Encouraging research, either by funding government research or subsidising private sector research. Such research should be used to develop new technology, and to identify existing technologies that could be used by specific sectors, or implementing a technology that is already used, but only in other sectors. Funding full-scale demonstrators is useful, as it removes the uncertainty over new technologies which often discourages investment in these, even with short payback periods.
Public procurement: this would be effective where significant public expenditure occurs and so could influence design. • Some laboratory/ industrial ovens and furnaces are procured by public bodies (e.g. sterilisers in
hospitals, small numbers of laboratory ovens and furnaces in government laboratories). Government contracts could require suppliers to have policies that promote the purchase of energy-efficient furnaces and ovens (and other equipment), which could be tied in to the measures recommended in this study. Note that public procurement of industrial furnaces and ovens, especially large and medium-size, is extremely uncommon in the EU.
• Public procurement of products made with furnaces and ovens could be considered, as governments and public authorities buy large quantities of some energy intensive materials such as cement, steel and bricks for construction projects. Green procurement is already encouraged by the European Commission221, although only a few EU Member States manage large amounts of green procurement 222 . Ireland, for example specifies “environmentally friendly cements” in publically funded construction projects, where Portland cement is partially replaced by existing waste materials 223 . Energy savings would be achieved by such measures promoting a more environmentally-aware production phase) in the life cycle of the utilised products, via introducing greener public procurement of products that are made in the most energy efficient furnaces and processes. This would be most beneficial where there are alternative lower energy consumption process options available, compared to others that consume larger amounts of energy per tonne. Is also applicable to materials whose energy consumed per tonne is dependent on furnace age and ecodesign, although GHG emissions from transporting the products produced with furnaces must also be considered, from the point of production to the point of use.
218 http://www1.eere.energy.gov/manufacturing/tech_deployment/training_process_heating.html,http://www1.eere.energy.gov/manufacturing/rd/index.html and http://www1.eere.energy.gov/manufacturing/tech_deployment/energy_assessment.html 219 http://www.energystar.gov/index.cfm?c=industry.bus_industry 220 http://www.carbontrust.co.uk/cut-carbon-reduce-costs/products-services/carbon-surveys/pages/carbon-surveys.aspx 221 http://ec.europa.eu/environment/gpp/index_en.htm 222 http://www.ecocem.ie/index.php?p=environmental&q=international_perspective 223 Under EC directive 2004/18/EC environmental performance is permitted to be used as a contract awarding criteria.

ERA Technology Limited ERA Report No. 2012-0230
043122753 ENTR Lot 4 Final Report v6 459 © ERA Technology Ltd
• Materials purchased in significant quantities by public bodies, where green procurement policies could encourage better ecodesign of furnaces in the EU, could include the following; in each case, some best practice examples are cited: - Cement – as in Ireland, specify a proportion of waste material to be used. Even larger energy
savings could be achievable by specifying magnesium-based cements that use magnesium silicate as raw material and so do not emit fossil CO2 from carbonates but adsorb CO2 during the cement curing process (one example is Novacem but procurers would need to ensure that the types specified do indeed emit less CO2 as described in section 5.4.1). There are many types of traditional cement used, but little published data to show where magnesium-based cements are suitable as alternatives, therefore, further research may be needed. With regard to cement production and use at construction sites, road transport GHG emissions can be a significant proportion of total emissions, therefore, locally produced material may be preferable to a material made a large distance away, even if the local production emits more GHG/tonne of product.
- Bricks and tiles (in public buildings) – which could be made using the most efficient furnaces in the EU. New kilns typically consume half the energy per tonne of 30-year-old kilns. Note, however that brick and tile energy consumption depends on the clay used, its size, shape and colour, and that transport-derived GHG so needs to be taken into account. For many products, GHG emissions from road transport can be as much or more than the emissions from production processes.
- Glassware and ceramic tableware - made using the most efficient furnaces in the EU. Significant amounts are also made outside the EU and sometimes from less efficient kilns. Also transport-derived GHG and other emissions, both environmentally-related, and related to health and safety of workers involved, are not regulated by EU legislation.
- Window glass for public buildings. - Metal production – melting, foundry and heat treatment – metals are used in military
equipment, aircraft, trains, vehicles, some in public buildings (steel reinforcement, copper water pipes, etc.).
In order to utilise public procurement to encourage use of products made using energy-efficient furnace and oven designs, a method will be needed to show that products have been made using energy-efficient processes. Assessment and minimum performance standards via the European Commission’s Green Public Procurement (GPP) process224 or the granting of an EU Ecolabel225 would be suitable options, enabling a procedure by which labels could be awarded to products that are made using the most efficient furnaces. This option would encourage eco-design of furnaces globally, not only in the EU, and is an option for bricks, tiles, glass bottles and any other product where furnace energy consumption is significant. However, note that transport emissions should also be taken into account, during this GPP award process (i.e. products made locally in a slightly less efficient furnace may be preferable overall to products made much further away in a more efficient furnace design.
224 http://ec.europa.eu/environment/gpp/gpp_criteria_process.htm 225 http://ec.europa.eu/environment/ecolabel/

ERA Technology Limited ERA Report No. 2012-0230
043122753 ENTR Lot 4 Final Report v6 460 © ERA Technology Ltd
Self-regulation initiative (SRI) option (or Voluntary Agreement, VA) – The SRI option should always be considered, as it is completely in line (actually favoured) by the Ecodesign (ErP) Directive. However, the recommendation of a VA is presently unpopular with furnace and oven manufacturers, partly because there are a very large number of manufacturers, many of which are SMEs. In addition, there are an increasing number of lower quality imports of furnaces and ovens from Asia that would not comply with a VA. This might therefore not be an option for most industry sectors, but could be an option for types of product where the environmental impact is too small to warrant legislation, e.g., such as for laboratory furnaces. A voluntary energy label based on a standard energy measurement method could be used, that would encourage ecodesign, especially if public procurement also encouraged lower energy consumption designs. Self-regulation by users (as opposed to manufacturers) may be acceptable to some industry sectors. This is already used fairly effectively in the Netherlands.
Installation requirements and user information – energy consumption information should be available to all users before they purchase. For standard designs that are used in laboratories, a standard energy consumption measurement method could be used, but note that this first needs to be written. This method must be representative of the way in which the furnaces or ovens are used. For large-size custom designs, measurement of consumption is not feasible because this information will be needed for potential customers who wish to compare products from several suppliers before they purchase, and this will be before the furnace or oven has been built. It is possible to calculate energy consumption before construction, and although this is not as accurate as measurement of the actual energy consumption this can be reasonably accurate. Where a furnace or oven is intended for a specific process, it would need to be stipulated that the energy consumption information provided was specifically only for the cited process. For multipurpose furnaces and ovens, typical uses, or a selection of processes, could be used to calculate the energy consumption associated with its use. Furnace and oven manufacturers are able to calculate process energy consumption with reasonable accuracy. Modelling of very large installations is complex but can be quite accurate. The methods used for small and medium size are simpler and may have an accuracy of only 20% (±10%). Other policy options to reduce GHG emissions related to furnaces but not based on ecodesign could include the following:
• Optimising energy efficiency throughout a furnace’s lifetime, via maintenance requirements. Several stakeholders have claimed that it is common for users to fail to invest adequately in maintaining their processes so that energy consumption increases faster than necessary. Ecodesign options only affect the design of new equipment, but cannot force users to maintain their equipment; therefore, an alternative policy option would be needed. Where an installation is within the scope of the IED, permit renewals – and associated inspections - would be an opportunity to ensure that sufficient maintenance has been carried out, so that the furnace energy consumption was not deteriorating. Note that this measure may not be possible for the large number of smaller furnaces and ovens outside the scope of the IED.
• Reducing the energy intensity (and associated emissions, resources used, etc) of materials used for furnace/ oven manufacture. A number of materials made using furnaces require very large amounts of energy for their production. These include, in particular, most metals, cement and glass. As shown in section 5.3.8, the reuse of recycled materials consumes far less energy than production of virgin materials; thus, policies that further encourage recycling will reduce energy consumption. This is not possible with cement or concrete, which cannot be
ERA Technology Limited ERA Report No. 2012-0230
043122753 ENTR Lot 4 Final Report v6 461 © ERA Technology Ltd
recycled to make new cement but research has shown that the refurbishment of buildings may consume far less energy than rebuilding, even when the higher heating energy consumption of the refurbished older buildings is included in the calculation226.
• Another option to reduce GHG emissions is to consume smaller quantities of energy intensive materials, by improved design, reduction of yield losses, scrap diversion and reuse. As an illustrative example, the amount of steel used in a private car varies considerably. Limiting the total weight of new private cars would reduce global GHG emissions from steel production as well as reducing the vehicles’ fuel consumption (fuel consumption for acceleration is proportional to weight as energy = mass x acceleration squared)227. Extending the lifetimes of the products that furnaces and ovens are used to produce could also be a way to reduce GHG emissions but the picture is a complex one, particularly in the context of products that are themselves becoming more energy efficient. The rate of energy efficiency improvement, and the amount of energy embodied in the product, would be the conflicting factors that would determine the overall effect. Upgrades and refurbishment could be more effective.
• For electric ovens and furnaces, decarbonising the electricity mix would reduce GHG emissions. For example, in direct reduction steel-making, if electric arc furnaces used renewable energy sources, emissions would be greatly reduced. The same principle applies to electrolysis technologies. Nuclear, CCS and energy efficiency in power generation are also important options to be examined.
• An EU carbon tax for products imported into the EU that were manufactured outside the EU has been proposed by the European Parliament228. This has also been proposed in the United States but may229 be ineffective for small lightweight products as the carbon tax could be insignificant.
• As discussed in section 5.6.2, the composition of piped natural gas can vary, as suppliers switch from one source to another. When this occurs, the flow of air to the burner needs to be adjusted, to avoid carbon monoxide formation and also to optimise energy efficiency, taking into account the altered combustion circumstances. It is necessary for suppliers to be able to switch sources of gas, as there is insufficient of any one source for the EU’s needs. As there is a safety risk, if carbon monoxide were to be formed, users of furnaces adjust the gas/ air ratio with more excess air than is needed in order to prevent the formation of carbon monoxide. Users would, however, be less likely to use a higher proportion of air over the stoichiometric amount needed if they knew that piped gas composition would not change unexpectedly, and that suppliers would provide advance warning of changes to allow users time to make adjustments. This might involve using more air during the changeover period as a safety measure but overall, lower excess air could be used, and this in turn would reduce gas consumption, additionally giving cost savings to EU users.
Modification of the IED - An alternative to eco-design for larger industrial furnaces and ovens is to use the Industrial Emissions Directive to regulate energy consumption and GHG emissions. At present, enhanced energy efficiency, with lower associated emissions is an aspiration of the IED, but 226 M. Berners-Lee, “How bad are bananas”, Profile Books, ISBN 1846688911, 2010. See p 149. 227 For further discussion, see for example Allwood,Cullen et al. (2012) Sustainable Materials with both eyes open, UIT Cambridge, available at www.withbotheyesopen.com 228 http://www.europarl.europa.eu/meetdocs/2009_2014/documents/econ/pr/834/834408/834408en.pdf See paragraphs 23 – 27 Note also that paragraph 26 recommends taxation of imported products to reduce the competitive disadvantage to EU manufacturers from carbon taxes. 229 http://www.carbontax.org/issues/border-adjustments/
ERA Technology Limited ERA Report No. 2012-0230
043122753 ENTR Lot 4 Final Report v6 462 © ERA Technology Ltd
it is currently not effective; therefore, changes will be required to the relevant BREFs, in which furnaces and ovens form part of the processes used. These are described in section 6.1.3.
Further eco-design studies - The Commission could consider carrying out eco-design studies in the following related areas:
• Furnaces and ovens are used in steel production and in oil refineries, but both are integrated processes where it is difficult to assess individual parts of the process. Furthermore, very little data could be obtained from stakeholders in these sectors. Both sectors are very significant energy consumers, and most furnaces are built by users in these sectors. However, it does not seem likely that any new installations will be built in the EU during the period considered by this study. It should be explicitly noted that both types of the above types of installation include many energy-consuming process steps that are not related to either furnaces or ovens.
• There are many types of driers used including drying ovens although the choice of design depends on the process, properties of material being dried, form of end product, etc. Many designs of dryers are not ovens (e.g. freeze driers, belt driers, etc.) but overall energy consumption of this sector could be significant. The energy consumption of many types of larger driers could however be regulated by IED.
• Paper production is a large energy consumer and has been considered during this study. However, it was found that most pulp drying does not use enclosed chambers and so therefore could not be defined as ovens.
• Chemical manufacture includes a variety of ovens and furnaces and these have been included in this study as far as possible although no stakeholders from this sector could be persuaded to provide data. There are, however, many chemical processes which use heating of enclosed chambers but heating is only one function. These would be referred to as chemical reactors and not as ovens and so they have been excluded from the Lot 4 study.
7.2.4 Qualitative hazardous substance policy options • There are three types of hazardous substance the furnaces and ovens sector, used for, or emitted
during, the following purposes: 1. Used as construction materials 2. Emitted directly from the furnace equipment itself 3. Emitted as a result of the process carried out inside the furnace (or oven).
1. The main hazardous construction material is aluminosilicate (and zirconia aluminosilicate) high temperature insulating wool (HTIW) insulation, which is classified as a carcinogen. This is used only if non-hazardous Alkaline Earth Silicate (AES) cannot be used for technical reasons. Alternatives include alumina HTIW insulation which is c. 15 times more expensive, and which would cause at least a doubling of the cost per furnace, thus risking making EU industry uncompetitive. Another alternative to aluminosilicate HTIW would be to use higher density rigid insulating bricks. However, if these bricks were used to replace aluminosilicate fibres, there would be a very large increase in EU energy consumption due to their much higher thermal mass. As the use of this aluminosilicate HTIW is well controlled in the EU, no restrictions on its use are necessary. As the quantity of these types of aluminosilicate and zirconia aluminosilicate HTIW used are not large, the cost to industry of having to

ERA Technology Limited ERA Report No. 2012-0230
043122753 ENTR Lot 4 Final Report v6 463 © ERA Technology Ltd
apply for authorisation for use if these are included in Annex XIV of REACH230 could be prohibitively high so that users may be forced to use types of insulation that increase energy consumption. Aluminosilicate and zirconia aluminosilicate fibres are classified as a REACH Substances of Very High Concern (SVHC), but before they are considered for inclusion in Annex XIV, it is recommended that the Commission review the hazard classification, because some of the test results on which this classification is based appear to be from unrealistic test methods(see section 4.3.1 and reference 127).
2. The hazardous gases that may be emitted from operating furnace equipment are products from combustion of fuels which are NOx (mainly from gas), CO (sometimes intentional) and SO2 (mainly from coal and some oils). These are already effectively regulated from installations in scope of the IED, but smaller installations are less well regulated. In some countries such as Germany, these gases are regulated fairly effectively, but this is not the case in some other EU Member States. The amounts of these gases emitted from non-IED installations are not known, as no measurements are presently required from manufacturers; therefore, it would first be necessary to monitor emissions across the EU. In order to determine whether it is necessary and beneficial to consider the type of legislation operating in Germany as an EU-wide requirement, more research is needed. An EU study has found that136 NOx emissions from industry are many thousands of tonnes annually, and are a significant quantity; however, note that this is only c.2% of the EU’s total. 41% of EU NOx is emitted by transport; therefore, efforts to reduce NOx emissions from transport, potentially such as switching to electric cars, limiting vehicle weight, size and fuel consumption, etc. could give a larger reduction in NOx than could be achieved from a large percentage reduction by industry (i.e. a 50% reduction would reduce EU emissions by only 1%). Eco-design is probably not the most effective method of reducing emissions of NOX, etc. Instead, IED and legislation such as TA-Luft would be more effective. Technically it is possible to reduce NOx emissions, because several manufacturers of gas burners have developed innovative designs that emit less NOx. These are described in Task 4.3.
3. Process emissions are process-dependent, and often are inevitable functions of the process, and therefore cannot be avoided. These emissions are already regulated by the IED, for those installations in its scope. Usually, furnace design does not influence process emissions except in a few cases which have been described in this report. These technical constraints can limit energy efficiency, such as in the example of electric arc melting of scrap steel. The use of preheating would reduce energy consumption, but it results in emissions of some very toxic dioxins and furans, and so is not an option that can be utilised. Process emissions from smaller-scale processes outside the scope of IED are not well regulated in the EU, but there is very little data available on the quantities of these emissions. They are likely; however, to be relatively small because the processes that emit the most hazardous process emissions such as metal smelting, glass manufacture, brick and tile manufacture, cement and lime are all in scope of IED and so are controlled. Most smaller-scale processes, such as heat treatment, curing and drying, release relatively small amounts of process emissions. The best option for further reductions in process emissions is by IED for larger-scale processes as this directive already imposes limits for all hazardous emissions. For smaller processes outside the scope of IED, there is no data to show whether these emissions are significant, but if a EU-wide study were to find large quantities of toxic emissions, then EU-wide legislation similar to the German TA-Luft may be an option, or at least variations could be considered along the lines of a lighter, reduced form of IED.
230 Registration, Evaluation, Authorisation of Chemicals Regulation 1907/2006/EC, see section 1.5.1

ERA Technology Limited ERA Report No. 2012-0230
043122753 ENTR Lot 4 Final Report v6 464 © ERA Technology Ltd
7.3. Impact Analysis For each of the policy options described in 7.1, the costs and benefits should be assessed. This will be performed in more detail in an Impact Assessment by the European Commission at a later stage in the policy-making process but a first analysis is provided here. In particular, any ecodesign requirements should not entail excessive costs nor undermine the competitiveness of European businesses nor have a significant negative impact on consumers or other users. This brief review encompasses the assessment of the following impacts:
• Impacts on manufacturers of furnaces and ovens • Impacts on the market, competitiveness and SMEs • Monetary impacts on particular categories of users • Impacts on functionality • Impacts on innovation and R&D • Social impacts
Impact on manufacturers of furnaces and ovens The technologies described in this study and proposed as improvement options are already available on the market, and no proprietary technology is considered as a BAT in Task 6. As a result, the implementation of the policy options is technically achievable by all manufacturers, although limited by technical constraints and it would require investment. This would include a small administrative burden, R&D costs, product redesign, testing, etc. It can be assumed that many products already comply with the Tier 1 minimum requirements proposed earlier in this Task, as they are based on stakeholder inputs regarding existing products. The incumbent EU industry should even have an advantage or head-start in meeting these ecodesign requirements and so there may be a market opportunity relative to potential new entrants (manufacturers or operators) from outside the EU looking to locate in Europe. In some cases there will be a large additional cost to users which may inhibit investment in the EU, even though life cycle costs are reduced. This is because many EU businesses have policies of limiting pay-back times from investments to less than 3 years, although for larger investment, ROI is calculated and longer pay-back times are acceptable. The timeline on which Eco-design measures are implemented takes into account the time necessary to adapt products and production lines and so three tiers have been suggested with options in 2014, 2018 and 2024. The Tier 2 eco-design option for insulation could, however start earlier in 2016. This redesign time varies according to the type of change to be achieved with additional insulation being fairly easy to implement whereas the implementation of new heat recovery designs will take considerably longer. Some furnace manufacturers could find a few design options difficult to implement: for example, designs using regenerative burners require advanced skills that are not currently available to all manufacturers (many use recuperative burners). Also, there appears to be only one supplier of aerogel insulation today, although that could be expected to change if ecodesign regulation results in

ERA Technology Limited ERA Report No. 2012-0230
043122753 ENTR Lot 4 Final Report v6 465 © ERA Technology Ltd
a higher demand. Apart from this, the improvement options presented do not require any specific material that might be difficult to obtain within the EU, and consequently the supply chain would not be unduly affected, nor EU industries disadvantaged. The only exception would be if aluminosilicate and zirconia aluminosilicate were added to Annex XIV of REACH. This could limit or stop supplies meaning that improving insulation performance of some types of furnace would be very difficult or too expensive. Some burner designs are proprietary, and so furnace designers may have a more limited choice of suppliers, at least initially, to achieve high heat recovery rates, although this will depend on the type of process. The effect of ecodesign on the volume of investment in new furnaces would depend on the extent (if any) to which furnace prices increase and the extent (if any) to which that has a chilling effect on investment. The total amount for investment available to each user can be considered to be fixed. In that case, higher equipment prices would result in less new equipment being purchased. Companies must also invest in safety equipment and repairs, therefore finance for new equipment often amounts to whatever is left over. As technology already exists, no additional R&D should be needed to achieve the eco-design options. However, this may not be correct in all sectors. For example, pre-heating is common with metal re-heating and ceramics furnaces and is used in some types of glass melting However, pre-heating is not yet used for flat or container glass melting in the EU. Although theoretically possible, glass manufacturers are reluctant to install new technology until it has been proven by a full-size demonstrator. This type of research is very expensive, and consequently EC funding may be required, as necessary, to implement such research, development and implementation/ technology uptake.
Impact on the market and on EU industry competitiveness Most new and recently rebuilt industrial and laboratory furnaces and ovens are not eco-design BAT, and only a small proportion meet the BAT eco-design options. New large furnaces should be BAT as defined by IED, but this is not the same as eco-design BAT. Those furnaces and ovens that are the largest energy consumers are closest to eco-design BAT, because of the high cost of energy, but only a few types could not be technically improved further, if investment were not limited. Larger industrial furnaces and ovens should be BAT, as defined by IPPC/ IED, in order to qualify for a permit. However, as recounted previously, this BAT requirement is not the same as eco-design BAT, and there can be long periods between permit renewals. For users, there is a complex interplay involving new furnace lifetime, the impact of increased investment and repayment of debt, and reduced energy costs. The annual running costs of new furnaces will be lower but loans are likely to be amortised over the first 2-5 years. Therefore, during at least part of this time, costs may appear to be higher than without additional energy saving measures. In the medium term, the ecodesign options presented in this report result in lower life-cycle costs for furnace and oven users. However, businesses in the EU make investment decisions based on what will give the best return; therefore higher furnace prices will affect ROI, if profits are not calculated over the full lifetime of the new furnace, and this is usually not the case. Instead, calculations are made over only 5-10 years, as it is taken into account that there is a risk that markets for the products made with the furnace may shift, and consequently 10 years is often taken as the upper bound, for commercial/ market-based reasons.

ERA Technology Limited ERA Report No. 2012-0230
043122753 ENTR Lot 4 Final Report v6 466 © ERA Technology Ltd
Heat recovery designs vary considerably depending on process design so that relatively small percentage investments may be needed to achieve the 55% heat recovery eco-design option with some process designs but much higher cost increases will be needed for other designs. The percentage cost increase for heat recovery by recuperators depends on their complexity which is proportional to their cost but is less size-dependent. A simple 3-pass recuperator may recover 20% – 30% of heat whereas a larger and much more complex design could recover 55%. As a percentage of furnace price, the cost of a 3-pass recuperator is typically some 40% of a small / medium-size furnace whereas the cost for a large complex design that recovers >45% heat may be only 15% – 20% of a very large furnace. This same complex design could however cost 200% or more of the price of a medium-size furnace. Therefore, although 55% heat recovery may be technically achievable, for some processes - and especially for smaller sizes - it may be too costly. This difference will not, however, apply to all technologies. For example, self-regenerative burner investment costs are less furnace-size dependent, but these cannot be used in all furnace designs.
Although pay-back periods of less than 7 years may be acceptable, frequently, shorter payback period limits are imposed as company policy. This is a short-term policy used to limit the borrowing but can be a short-sighted policy. It is clear that energy prices will increase in the long term and so any investment in energy-saving technology today will give future financial benefit, which will, in turn, improve long-term competitiveness. The eco-design options, even if payback periods are relatively long, will assist EU industry in the long-term if users can be persuaded to increase investment, and not to relocate outside the EU to avoid complying with EU legislation.
The size of investment in new furnaces will need to increase in the EU, as all of the eco-design options entail additional new equipment costs. However, furnace-related industry sectors outside of the EU will have no such eco-design obligations to fulfil, which will temporarily disadvantage these EU furnace-related industry sectors. In the long term, however, EU users subject to eco-design obligations should benefit from lower energy costs, which will give them a competitive advantage. The total investment available to each manufacturer is, however, fixed by lenders, and so unless additional sources of funding are available, they will not be able to continue to invest at the same level in new equipment. Higher equipment prices will result in less new equipment being purchased, which will not only affect users in the EU, but may also affect EU furnace manufacturers. All users must first invest in safety equipment and repairs so finance for new energy efficiency-related equipment usually must utilise whatever funds are left. ROI calculations may also show that investment in cheaper new furnaces outside the EU gives better short-term ROI, because labour costs are lower in many countries, and few of these third countries have an ETS or similar, and fuel subsidies are available in many countries, in addition.
If further analysis reveals any significant negative impacts to be likely, they could be mitigated by other measures. A range of policy options are described in the previous section but an example that can be mentioned here is a tax on extra-EU imports proportional to the greenhouse gases emitted during manufacturing. The aim would be to create a more level playing field for EU-based industry, compared to markets with less strict energy and environmental regulation (see section 7.1).
ERA Technology Limited ERA Report No. 2012-0230
043122753 ENTR Lot 4 Final Report v6 467 © ERA Technology Ltd
The impact of measures which cause users to relocate new installations outside the EU is that the EU’s internal emissions appear to be reduced, but there is – overall - no reduction in global GHG emissions. EU emissions are unchanged if “embodied” emissions from imported goods are included in the EU’s total GHG emissions. In reality, GHG and toxic emissions are likely to increase, because the energy efficiency of furnaces in many countries is worse than in EU, and the regulation of emissions of hazardous emissions is less stringent than in EU. There are also additional emissions for shipping goods to the EU, which means that; overall, it is likely that there should be clear environmental benefits as well as social benefits in measures to encourage users to invest in the EU.
Impact on SMEs The ecodesign-derived benefits may be less accessible to SMEs than to larger businesses. The capital cost of a new furnace represents a more significant investment for an SME, so SMEs will be more sensitive to any increase in product price. SMEs may also face a financial obstacle, in that finance for the investment might be more difficult to obtain. SMEs are often less able to adapt to new eco-design obligations, as they have limited resources for R&D, and for investment in new equipment. In addition, SMEs may lack the necessary advanced skills needed. For example, several SME furnace manufacturers stated that they experience difficulties when using HTIW insulation with poor long term performance, whereas HTIW manufacturers have said that these materials should give good long term performance, as long as the correct type is chosen, and that they are correctly designed and installed. This technical knowledge is available, but is least accessible to SMEs, who have limited time and resources to develop these skills. When new eco-design options are imposed, SMEs will probably take the longest time to be able to meet future requirements, and so relatively long timescales between successive Eco-design Tiers have been proposed. SME users could also be affected more than larger enterprises, as obtaining higher levels of investment to pay for improved eco-design tends to be more difficult for SMEs, since some lenders may view SMEs as a larger risk. This issue could be overcome by Member States' governments, or the EU, providing zero or low interest loans for investment in energy saving equipment. Large enterprises also have limits on investment consequently; many will be affected, if equipment prices increase significantly as a result of eco-design requirements.
Eco-design options should not affect choice by users or impact one region more than another unless the option of Member States providing incentives is adopted but is then not subsequently implemented uniformly on the ground, across all Member States. Several type of incentives are described in Task 6, which could potentially be provided by Member States (or by the EU directly). The financial status of Member States is varied, such that some would be in a better position to offer incentives than others, and this may also vary for political reasons. This variation would therefore put furnace manufacturers and users in some States at a competitive disadvantage over those in other States with more generous governments. This would be avoided if funding was from the EU, or if the level of provision of funding could be harmonised by European legislation.
The policy instrument of audits of installations, to provide free advice on energy-saving measures, is already available to some extent in USA, Canada, India, Japan, and in some EU countries; as an option, such a policy instrument may be more beneficial to SMEs than to larger enterprises, and this could help to minimise the relative disadvantages incurred by SMEs compared to larger companies via eco-design.

ERA Technology Limited ERA Report No. 2012-0230
043122753 ENTR Lot 4 Final Report v6 468 © ERA Technology Ltd
Monetary impact on particular categories of users This issue concerns the affordability and the LCC of the product (see also the results obtained in Task 6). The implementation of Ecodesign requirements could require manufacturers to invest more in technology and product development, but the life-cycle costs would be a benefit in the long term. Also, this additional investment due to Ecodesign should be compared to the usual development investments made in a given year, and manufacturers could try to pass some of the additional up-front cost on to customers. Money for investment is always limited. SME manufacturers, in particular, try to avoid incurring large debts. It is common for users to avoid replacing furnaces for as long as possible and higher prices would only serve to further delay furnace replacement. However, it is also important to bear in mind that there can be non-energy benefits of Ecodesign for users. Furnaces with better environmental performance should also promote better safety, increased productivity, optimised processes, etc. These additional benefits need to be better taken into account into investment decisions231.
Again, measures could be introduced at EU or Member State levels to mitigate the risk of negative impact on users of furnaces, e.g., the provision of low or 0% interest loans for furnaces or ovens with improved ecodesign, as discussed previously. Such low or zero interest loans are not available to larger firms in the EU, unlike in some countries outside the EU, such as the United States. Also, the total amount of money available is limited, especially as most EU Member States are trying to reduce their debts. In addition, funding is not uniform across the EU, with companies in some countries having access to more favourable conditions. Action at EU level might therefore be considered in order to promote the common market.
Impacts on the functionality of the product, from a user perspective In any Ecodesign regulation, there must be no trade-off in terms of function as a result of the increased energy efficiency, and this holds for most of the eco-design options described in this report. For the improvement options presented, the functional unit and the quality of the service provided remain the same as the Base Case (a necessary condition for a comparative LCA). Although this is the case, there are exceptions due to technical constraints. For example, improved insulation for batch furnaces could slow the process, reducing throughput, increase energy consumption and also affect the quality of the product made in the furnace. Another limitation is that there must be a use for any recovered heat and this will not always be possible. Ideally, heat is reused within the furnace or oven to reduce fuel consumption, but there are limits to how much can be reused in this way. Batch furnaces generate heat intermittently which may not be useful for other processes that need heat continuously or at different times. In some of these cases, there will be design solutions to avoid the trade-off; others may be excluded from the regulation either on a sectoral or case-by-case basis, depending on the Ecodesign measures finally chosen. Overall, the policy options presented do not affect functionality. so they should not restrict consumer choice. There will still be a huge variety of furnaces and ovens on the market, often custom-designed. No major furnace type or technology will be excluded from the market.
231 For a discussion of non-energy benefits in relation to energy management in industry, see IEA (2012) Policy Pathways – Energy Management Programmes for Industry, OECD/IEA, Paris. Available at www.iea.org/papers/pathways/industry.pdf
ERA Technology Limited ERA Report No. 2012-0230
043122753 ENTR Lot 4 Final Report v6 469 © ERA Technology Ltd
At industry level, investment in cheaper new furnaces located outside the EU may give better short-term ROI. However, other factors are usually more significant in such decisions, e.g. lower labour costs, a more favourable regulatory or fiscal environment, the existence of large domestic markets, and cheaper energy; subsidised energy is available in some countries such as China, Russia and India, although the trend is towards phasing out such energy subsidies, as they are increasingly costly.
Impact on innovation and R&D BNAT and cutting-edge research in ovens and furnaces was not examined in great detail in this study, owing to the lack of data. Such information is obviously sensitive from a manufacturer’s point of view, and it is understandable that most manufacturers have not been willing to disclose any such data. Nevertheless, the Ecodesign measures proposed can be seen as an opportunity for furnace manufacturers to research innovative efficient technological solutions. As Europe has a large engineering base and tradition, this should create several market opportunities. As mentioned, it seems that, based on current R&D trends, it ought to be feasible for EU firms to meet the proposed requirements. Some users may see this differently, due to the perceived uncertainty of the long-term reliability and performance of new technology. EU funding for full-size trial plants could be one way to encourage or facilitate the adoption of innovation.
Social impact Social impacts include any significant impact on employment or labour conditions, health and safety or equality of treatment and opportunity. Performance standards ought not to have a negative effect on the number of jobs or working conditions. Upgrading or changing production lines is sometimes seen as an opportunity to consider relocating the activity. There would be a significant loss of jobs and increase in imports into the EU if users decided to relocate outside the EU, in order to avoid higher investment costs. However, as mentioned earlier, EU manufacturers already face higher costs in the EU than some non-EU countries due to lower labour costs, fuel subsidies, etc. and so any additional effect of Ecodesign would be hard to distinguish. It must be recognised, however, that if prices were to increase significantly, this would be an added incentive for the users of furnaces and ovens to relocate. For example, although not considered in detail in this study, oil refining is a sector in which the situation is already one of old installations facing mature local markets and large investment requirements to meet environmental standards. Excess capacity is expected to persist for many years, which may lead to further job losses. According to recent information, seven refineries have already closed in Europe, and the future of five more is in question232. Government assistance and incentives such as those described earlier in this chapter could help to avoid such a possibility. Also as mentioned earlier, improved furnaces and ovens could have social benefits if they are designed in such a way as to improve safety, indoor air quality and other working conditions, and could also improve long-term competitiveness by reducing energy costs.
232 Bosoni, T. (2012) “Oil refining: a tale of two markets” in IEA Energy, volume 2.