low temperature and reduced length scale behavior of shape
TRANSCRIPT

University of Central Florida University of Central Florida
STARS STARS
Electronic Theses and Dissertations, 2004-2019
2009
Low Temperature And Reduced Length Scale Behavior Of Shape Low Temperature And Reduced Length Scale Behavior Of Shape
Memory And Superelastic Niti And Nitife Alloys Memory And Superelastic Niti And Nitife Alloys
Radhakrishnan Manjeri University of Central Florida
Part of the Engineering Commons
Find similar works at: https://stars.library.ucf.edu/etd
University of Central Florida Libraries http://library.ucf.edu
This Masters Thesis (Open Access) is brought to you for free and open access by STARS. It has been accepted for
inclusion in Electronic Theses and Dissertations, 2004-2019 by an authorized administrator of STARS. For more
information, please contact [email protected].
STARS Citation STARS Citation Manjeri, Radhakrishnan, "Low Temperature And Reduced Length Scale Behavior Of Shape Memory And Superelastic Niti And Nitife Alloys" (2009). Electronic Theses and Dissertations, 2004-2019. 1510. https://stars.library.ucf.edu/etd/1510
LOW TEMPERATURE AND REDUCED LENGTH
SCALE BEHAVIOR OF SHAPE MEMORY AND
SUPERELASTIC NiTi AND NiTiFe ALLOYS
by
RADHAKRISHNAN MAHADEVAN MANJERI
B.E. National Institute of Technology, 2002
M.S. University of Central Florida, 2007
A dissertation submitted in partial fulfillment of the requirements
for the degree of Doctor of Philosophy
in the Department of Mechanical, Materials and Aerospace Engineering
in the College of Engineering and Computer Science
at the University of Central Florida
Orlando, Florida
Summer Term
2009
Major Professor: Raj Vaidyanathan

ii
© Radhakrishnan Mahadevan Manjeri

iii
ABSTRACT
Shape memory and superelastic applications of NiTi based alloys have typically been limited to
near room temperature or to bulk length scales. The objective of this work is two-fold: first, to
investigate shape memory behavior at low temperatures in the context of the R-phase
transformation in NiTiFe alloys by recourse to arc-melting, differential scanning calorimetry
(DSC), transmission electron microscopy (TEM) and mechanical testing at low temperatures;
and second, to investigate superelasticity and two-way shape memory behavior at reduced length
scales in the context of NiTi by recourse to micro-compression, micro-indentation and TEM
studies.
Selected compositions of ternary NiTiFe shape memory alloys were arc-melted and thermo-
mechanically processed to investigate the influence of composition and processing parameters on
the formation of the R-phase. The methodology used for the processing and characterization of
the alloys was established and included microprobe analysis, DSC, TEM and mechanical testing.
No phase transformation was observed in alloys with Fe content in excess of 4 at.%. Thermo-
mechanical treatments facilitated the formation of the R-phase in Ni-rich alloys. The range of the
transformation between the R-phase and austenite, and the hysteresis associated with it were
influenced by the distribution and size of metastable Ni4Ti3 precipitates. The investigation of the
microstructural, thermal and mechanical properties of the R-phase transformation in NiTiFe
alloys revealed a complex dependence of these properties on processing parameters. The present
work also highlighted the hitherto unexplored competition between the two inelastic deformation
modes operating in the R-phase (detwinning and stress-induced transformation) and established
the preference of one mode over the other in stress-temperature space.
iv
The complete micromechanical response of superelastic NiTi was examined by performing
careful micro-compression experiments on single crystal pillars of known orientations using a
nanoindenter tip. Specifically, the orientation dependence of the elastic deformation of austenite,
the onset of its transformation to martensite, the gradient and the hysteresis in the stress-strain
response during transformation, the elastic modulus of the stress-induced martensite and the
onset of plasticity of the stress-induced martensite were analyzed in separate experiments. A
majority of the results were explained by recourse to a quantitative determination of strains
associated with austenite grains transforming to martensite variants or twinning in martensite.
Microstructural studies were also performed on a micro-indentation trained NiTi shape memory
alloy specimen to understand the mechanisms governing the two-way shape memory effect. In
situ TEM studies at temperature on specimens obtained at different depths below the indent
showed the presence of retained martensite along with the R-phase. Previously, while such two-
way shape memory behavior has typically been associated with large dislocation densities, this
work provides evidence of the role of retained martensite and the R-phase in cases with reduced
dislocation densities. Funding support for this work from NSF (CAREER DMR-0239512),
NASA (NAG3-2751) and SRI is acknowledged.

v
Dedicated to my Parents
vi
ACKNOWLEDGMENTS
I would like to thank my advisor Prof. Raj Vaidyanathan for providing me with an opportunity to
work on shape memory alloys. I am truly indebted to him and sincerely thank him for the
patience, guidance and support that he has provided in many ways.
Prof. C. Suryanarayana for serving on my thesis committee and for his patience and readiness to
help.
I would also like to extend my sincerest gratitude to Dr. Heinrich for all the support and helpful
discussions.
Prof. Seal and Dr. Sudhir Rajagopalan for agreeing to serve on my committee and for their
readiness to help.
I also thank Dr. A. Misra, Dr. N. Mara and Dr. H. Li of the Center for Integrated
Nanotechnology (CINT), Los Alamos National Laboratory (LANL) for helping me in
performing the micro-compression studies.
The help and support from Karen Glidewell, Waheeda Illasarie, Cynthia Harle, Kari Stilles, Kirk
Scammon, Mikhail Klimov and Dr. Qi Zhang is gratefully acknowledged. I am also thankful to
Dr. Brian Kempshall and Dr. Stephen Schwarcz for helping me learn more on the FIB.
I would like to extend my sincere thanks to Shipeng Qiu for his contribution on the neutron
diffraction results presented in Chapter Five. I also thank P. Prakash for his help in
electropolishing the NiTi specimen, in obtaining the profilometry results and in preparing the
TEM specimens used in Chapter Five and Chapter Seven in this study. I also thank M. Mistretta
for his help in arc-melting some alloys and also in helping with the two-way shape memory
experiments. My colleagues Subha, Vinu, Diwakar, Jen, Madhavi, Jagat, Matt, Catherine and
Othmane for their support and help at work. My friends Satyajeet, Satya, Chaitali, Vikas,
Mohanty, Prabhakar, Ashley, Ajay, Vinod, Parveen and Arun for their care and support.
Last but not the least my father and mother and my wife Sandhya for their endless love and
support. My dear sister and brother-in-law for being a constant source of encouragement and
support and the love from my dear nephew. I would also like to thank my father-in-law, mother-
in-law and my sister-in-law for their love and support. Above all my salutations to the Almighty
for guiding me forever.

vii
TABLE OF CONTENTS
LIST OF FIGURES ....................................................................................................................... ix
LIST OF TABLES ....................................................................................................................... xiii
LIST OF ABBREVIATIONS ...................................................................................................... xiv
CHAPTER ONE: MOTIVATION AND ORGANIZATION ........................................................ 1
1.1 Motivation ............................................................................................................................. 1
1.2 Organization .......................................................................................................................... 3
CHAPTER TWO: INTRODUCTION ............................................................................................ 5
2.1 NiTi Shape Memory Alloys .................................................................................................. 5
2.1.1 Shape Memory Effect ..................................................................................................... 5
2.1.2 Superelastic or Pseudoelastic Effect .............................................................................. 6
2.2 Phase Transformations in NiTi Shape Memory Alloys ........................................................ 6
2.2.1 Transformation Characteristics of NiTi......................................................................... 8
2.2.2 Hysteresis ....................................................................................................................... 8
2.2.3 Transformation Temperature Range .............................................................................. 9
2.3 Mechanical Behavior of NiTi Shape Memory Alloys ........................................................ 11
CHAPTER THREE: ON THE FORMATION OF R-PHASE IN NiTiFe SHAPE MEMORY
ALLOYS ....................................................................................................................................... 13
3.1 Introduction ......................................................................................................................... 13
3.2 Experimental Procedure ...................................................................................................... 17
3.3 Results and Discussion ....................................................................................................... 18
3.3.1 Homogeneity in the NiTiFe Alloys Fabricated by Arc Melting ................................... 18
3.3.2 Ni:Ti < 0.96 ................................................................................................................. 26
3.3.3 Ni:Ti > 1 ...................................................................................................................... 28
3.3.4 Effect of cold working on the R-phase transformation ................................................ 41
3.4 Conclusions ......................................................................................................................... 43
CHAPTER FOUR: DEFORMATION STUDIES IN NiTiFe SHAPE MEMORY ALLOYS ..... 45
4.1 Introduction ......................................................................................................................... 45
4.2 Experimental Procedure ...................................................................................................... 48
4.3 Results and Discussion ....................................................................................................... 50
4.3.1 B2 to R-phase transformation ...................................................................................... 53
4.3.2 Detwinning/reorientation of R-phase .......................................................................... 57
4.4 Conclusions ......................................................................................................................... 66
CHAPTER FIVE: SUPERELASTIC RESPONSE OF [111] AND [101] ORIENTED NiTi
MICRO-PILLARS ........................................................................................................................ 67
5.1 Introduction ......................................................................................................................... 67
5.2 Experimental Procedure ...................................................................................................... 69
5.3 Results and Discussion ....................................................................................................... 71
5.4 Conclusions ......................................................................................................................... 85
CHAPTER SIX: METHODOLOGY TO CALCULATE THE VARIANT STRAIN ................. 86
6.1 Methodology ....................................................................................................................... 86
CHAPTER SEVEN: MICROSTRUCTURAL INVESTIGATION OF INDENTATION
TRAINED TWO-WAY SHAPE MEMORY EFFECT IN NiTi SHAPE MEMORY ALLOY ... 97
viii
7.1 Introduction ......................................................................................................................... 97
7.2 Experimental Procedure ...................................................................................................... 99
7.3 Results and Discussion ..................................................................................................... 103
7.4 Conclusions ....................................................................................................................... 116
CHAPTER EIGHT: CONCLUSIONS ....................................................................................... 117
8.1 Conclusions ....................................................................................................................... 117
REFERENCES ........................................................................................................................... 120

ix
LIST OF FIGURES
Figure 1. Transformation pathways in NiTi-based alloys. ............................................................. 7
Figure 2. Schematic of the differential scanning calorimetry response of a NiTi-based shape
memory alloy. ............................................................................................................................... 10
Figure 3. Schematic of the phase dependent stress-strain response of NiTi-based alloys. ........... 12
Figure 4. Averaged results from microprobe analysis of (a) Ni47.5Ti49.5Fe3 and (b) Ni50.5Ti48.5Fe1.
Both the alloys were flipped 15 times, solutionized at 1173 K for 24 hours. While the
Ni47.5Ti49.5Fe3 was furnace cooled, the Ni50.5Ti48.5Fe1 alloy was quenched in ice cold water, cold
worked 15% and annealed at 773 K for 1 hour and furnace cooled. ............................................ 21
Figure 5. Differential scanning calorimetry results of (a) Ni47.5Ti49.5Fe3 alloy and (b)
Ni50.5Ti48.5Fe1. Both the alloys were flipped 15 times, solutionized at 1173 K for 24 hours. While
the Ni47.5Ti49.5Fe3 was furnace cooled, the Ni50.5Ti48.5Fe1 alloy was quenched in ice cold water,
cold worked 15% and annealed at 773 K for 1 hour and furnace cooled. The specimens in (a) and
(b) were taken from diametrically opposite ends (25 mm apart) of the button sample. ............... 22
Figure 6. Schematic of the transformation sequence and the transformation temperatures as seen
in a differential scanning calorimeter for a NiTiFe shape memory alloy. The start and finish of
the transformations are denoted by the subscript “s” and “f” with A, M and R corresponding to
the austenite, martensite and the R-phase respectively. ................................................................ 23
Figure 7. Bright field micrograph and the corresponding diffraction pattern showing (a) austenite
at room temperature, (b) R-phase at 270K and (c) B19' martensite at 173K in Ni48Ti50Fe2. The
zone axis corresponding to the diffraction patterns of austenite and R-phase is [111] while that of
martensite is [001]. ........................................................................................................................ 24
Figure 8. Differential scanning calorimetry response of Ti-rich NiTiFe shape memory alloys with
increasing Fe content. The Ni/Ti ratio was kept constant at 0.96 (at%). ...................................... 25
Figure 9. Differential scanning calorimetry results from Ni-rich NiTiFe alloys with increasing Fe
content. The Ni/Ti ratio was kept constant at 1.04 (at%). ............................................................ 29
Figure 10. Representative bright field images of (a) Ni50.5Ti48.5Fe1 and (b) Ni50Ti48Fe2 alloys
showing relatively wider inter-precipitate spacing of the metastable Ni4Ti3 precipitates. ........... 32
Figure 11. Representative bright field images of (a) Ni49.5Ti47.5Fe3 and (b) Ni49Ti47Fe4 alloys
showing relatively narrower inter-precipitate spacing of the metastable Ni4Ti3 precipitates. ...... 33
Figure 12. Comparison of precipitate size as a function of Fe concentration in Ni-rich NiTiFe
alloys. The bright field micrographs are from (a) Ni50.5Ti48.5Fe1 and (b) Ni50Ti48Fe2. ................. 34
Figure 13. Comparison of precipitate size as a function of Fe concentration in Ni-rich NiTiFe
alloys. The bright field micrographs are from (a) Ni49.5Ti47.5Fe3 and (b) Ni49Ti47Fe4. ................. 35
Figure 14. Comparison of dislocation densities as a function of annealing temperature in the
Ni49Ti47Fe4 alloy with samples annealed for 1 hr at (a) 673 K (b) 873 K and (c) 1073 K. The
dislocation density is seen to reduce with increasing annealing temperature. .............................. 37
Figure 15. Bright field micrographs of Ni49Ti47Fe4 alloy annealed for 1 hr at (a) 673 K and (b)
873 K showing the dissolution of precipitates with increasing annealing temperature. ............... 38
Figure 16. Representative micrograph from the Ni49Ti47Fe4 alloy subjected to annealing at 873 K
for 1 hour following multiple thermo-mechanical treatments, showing the presence of Ni3Ti
precipitates. The precipitate composition was confirmed through EDX analysis. ....................... 40
x
Figure 17. Comparison of the R-phase start transformation temperature between previous studies
and the present work. .................................................................................................................... 42
Figure 18. (a) Transformation temperatures of Ni46.8Ti50Fe3.2 cold worked by 30% and annealed
at 873 K for 30 minutes (b) Comparison of start and finish of R- and austenite phase
transformation temperatures for varying degrees of cold working. .............................................. 51
Figure 19. Bright field micrograph of the Ni46.8Ti50Fe3.2 sample (a) cold worked by 30% and (b)
annealed at 873 K for 30 minutes after cold working. The streaks in the diffraction spots in the
inset in (a) confirm the dense distribution of dislocations. The annealed sample has a relatively
lower dislocation density. ............................................................................................................. 52
Figure 20. Stress induced transformation of the R-phase from the austenite phase in
Ni46.8Ti50Fe3.2. The onset stress required to induce the transformation increased with increasing
temperature. The stress induced transformation was not observed at temperatures higher than .. 54
Figure 21 . Load-bias response for the R to B2 phase transformation at different stresses. ......... 54
Figure 22. Stress-temperature equivalence of the B2 to R-phase transformation under isothermal
and isobaric conditions. The stress-temperature equivalence was analyzed with in the framework
of the Clausius-Clapeyron relation. .............................................................................................. 56
Figure 23. (a) Representative stress-strain response of detwinning in the R-phase at 216 K and
183 K and (b) the stress-strain response at 153 K showing the two inelastic deformation modes in
the R-phase. The onset stress for the reorientation of R-phase variants increased with decreasing
temperature. .................................................................................................................................. 58
Figure 24. (a) Stress induced transformation of the B19' phase from the R-phase in
Ni46.8Ti50Fe3.2. The onset stress required to induce the transformation increased with increasing
temperature. The residual strains were recovered upon heating the sample to temperatures above
the austenite finish (Af) and (b) Complete recovery could be observed in all the cases on heating
to temperatures above austenite finish (Af). ................................................................................. 60
Figure 25. Load-bias response for the B19' to B2 phase transformation at different stress levels.
The transformation temperatures of the forward transformation increases with increasing stress.
....................................................................................................................................................... 62
Figure 26. Stress-temperature equivalence of the R-phase to B19' stress induced transformation.
The stress-temperature equivalence was analyzed with in the framework of the Clausius-
Clapeyron relation. The lower value of the slope is a consequence of the large strain
accommodated in this transformation and also due to the influence of detwinning of the R-phase
at higher temperatures. .................................................................................................................. 62
Figure 27. Summary of the elastic and inelastic deformations in Ni46.8Ti50Fe3.2. The starting
phase for each case is indicated. ................................................................................................... 64
Figure 28. Deformation mechanism map in stress-temperature space for Ni46.8Ti50Fe3.2. ...... 65
Figure 29. [101] oriented austenite NiTi pillar (a) before and (b) after deformation. The
magnifcations are appropriately selected to show adequate clearance for the nanoindenter tip in
(a) and slip lines associated with plasticity and surface relief lines associated with stabilized
martensite in (b). ........................................................................................................................... 72
Figure 30. Micro-compression stress-strain response of (a) [111] oriented NiTi pillar mechanical
cycled to 570 MPa, (b) 1480 MPa and (c) [101] oriented NiTi pillar. ......................................... 73
Figure 31. Sections of neutron diffraction spectra at various stresses acquired from NiTi during
compression loading. The spectra shown here are from diffracting grains oriented with their

xi
(111) and (101) plane normals parallel to the loading direction. The entire spectra were
normalized so that (111) peaks have the same peak intensity. ..................................................... 76
Figure 32. Yielding of stress-induced martensite in (a) [111] and (b) [101] oriented NiTi pillars.
....................................................................................................................................................... 83
Figure 33. Section of neutron diffraction spectra acquired in the nominally unloaded condition
before and after 50 mechanical cycles (i.e., at the start of cycle 1 and cycle 51). The spectra
shown here are from diffracting grains oriented with their (111) and (101) plane normals along
the loading direction. The entire spectra were normalized so that (101) peaks have the same peak
intensity. The peak at 1.765 Å is due to the steel from the extensometer knife edge and does not
influence the analysis since the normalization considered peak heights and not areas. ............... 84
Figure 34 . Schematic of the lattice correspondence between austenite and martensite for variants
1 and 1'. ......................................................................................................................................... 91
Figure 35. Schematic of the lattice correspondence between austenite and martensite for variants
2 and 2'. ......................................................................................................................................... 92
Figure 36. Schematic of the lattice correspondence between austenite and martensite for variants
3 and 3'. ......................................................................................................................................... 93
Figure 37. Schematic of the lattice correspondence between austenite and martensite for variants
4 and 4'. ......................................................................................................................................... 94
Figure 38. Schematic of the lattice correspondence between austenite and martensite for variants
5 and 5'. ......................................................................................................................................... 95
Figure 39. Schematic of the lattice correspondence between austenite and martensite for variants
6 and 6'. ......................................................................................................................................... 96
Figure 40. Differential scanning calorimetry results from Ni49.4Ti50.6. The sample is in a fully
martensitic state at room temperature. ........................................................................................ 101
Figure 41. Cross-section profile of the indent in the martensite (cooling) and austenite (heating)
phases (see text for more details). The inset shows representative optical micrographs of the
indent upon heating and cooling. ................................................................................................ 105
Figure 42. Bright field micrographs at a depth of 75 µm below the indent at (a) room temperature
with the inset showing a selected area diffraction pattern of the monoclinic phase oriented along
..................................................................................................................................................... 107
Figure 43. Bright field micrographs at a depth of 150 µm below the indent at room temperature
with R-phase and the inset showing the selected area diffraction pattern along the [111]B2 axis.
..................................................................................................................................................... 109
Figure 44. Bright field micrographs at a depth of 150 µm below the indent showing (a)
martensite at room temperature and the corresponding diffraction pattern oriented along [-6-53]
axis and (b) retained martensite at 423 K. .................................................................................. 111
Figure 45. Bright field micrographs at a depth of 150 µm below the indent showing dislocations
around the region of maximum theoretical stress with the corresponding diffraction pattern
exhibiting streaked spots. ............................................................................................................ 113
Figure 46. Bright field micrographs from an untrained region of the sample at room temperature
with (a) showing the martensite twins and the inset representing the diffraction pattern along
[ 101 ] axis and (b) showing the austenite phase at 423 K and the inset representing the diffraction
pattern along [111] axis. No martensite was observed at 423 K, which is above Af. ................. 115

xii

xiii
LIST OF TABLES
Table 1. Nominal composition of arc melted NiTiFe shape memory alloys. The transformation
temperatures shown here were measured using a differential scanning calorimeter. ................... 20
Table 2. Austenite to martensite transformation and martensite variant conversion strains ........ 78
Table 3: Lattice correspondence between the 12 variants of martensite and parent austenite
phase. The martensite is represented as M while the austenite is represented as B2. .................. 88

xiv
LIST OF ABBREVIATIONS
SMA Shape memory alloy
As Austenite start
Af Austenite finish
Rs R-phase start
Rf R-phase finish
Ms Martensite start
Mf Martensite finish
TWSME Two-way shape memory effect
SIM Stress induced martensite
TEM Transmission electron microscopy
DSC Differential scanning calorimetry
DMA Dynamic mechanical analysis
EPMA Electron probe micro analysis
EDM Electrical discharge machining

xv

1
CHAPTER ONE: MOTIVATION AND ORGANIZATION
1.1 Motivation
The exploitation of NiTi-based shape memory alloys for an ever-increasing diversity of
applications with stringent operating conditions necessitates a thorough understanding of their
functional properties and their dependence on various parameters. Binary NiTi alloys are
generally limited to ambient operating conditions and there has been a growing interest in the use
of these alloys for low and high temperature actuation applications [1, 2]. In this regard a
processing-structure-property correlation study is required in developing new alloy systems with
desired material properties. The use of NiTi-based alloys as actuators demands the material to
have superior fatigue life in the operational temperature range and better work output, among
others, relative to existing actuators based on piezoelectric, pneumatic and hydraulic
mechanisms. The focus of the present study is two-fold, firstly to develop new alloy
compositions for low temperature actuation and understand the phase dependent mechanical
behavior in stress-strain-temperature space and secondly to develop a thorough understanding of
martensitic phase transformations at reduced length scales with the objective of extending the
shape memory and superelastic effects for micro- and nano- based device applications.
The R-phase transformation in NiTi-based alloys offers reduced hysteresis and superior
fatigue life relative to the B19' martensitic transformation thereby making them potential
candidates for numerous applications. However, the R-phase transformation in binary NiTi
alloys is restricted to ambient temperatures and thus there is a need to develop alloys exhibiting
the transformation at sub-ambient/low temperatures in order to facilitate their use in low
2
temperature thermal conduction/convection switches, cryogenic seal, valves etc.,. In this regard,
ternary NiTiFe alloys were selected for investigation as previous studies have shown that the
addition of Fe introduces the R-phase and additionally lowers phase transformation temperatures
[3]. However, no systematic study investigating the influence of composition and thermo-
mechanical processing parameters on the R-phase transformation has been carried out. Thus the
objective of this study is to develop such an understanding to enable the tailoring of these alloys
for applications requiring the use of the R-phase transformation at varying temperatures. Further,
given the interdependence of stress and temperature on the martensitic phase transformation in
the NiTiFe system, a phase dependent mechanical behavior analysis was additionally conducted
in stress-strain-temperature space. This is especially significant given the conditions in which the
actuators function such as variable stress and/or temperature. By quantifying stresses and strains,
identifying temperatures associated with various deformation mechanisms and understanding the
compositional dependence of R-phase transformation temperatures in NiTiFe alloys, this work
has practical implications for developing and using NiTiFe alloys in applications that require
low-temperature, low-hysteresis actuators with superior fatigue behavior such as thermal
conduction/convection switches.
With the objective of extending the use of the shape memory and superelastic effects to
micro- and nano- device applications, micromechanical studies were performed at reduced length
scales. There is a lack of consistency from the previous experimental studies reported on NiTi
micro pillars [4-6]. Thus the focus of the present research is to unambiguously establish the
micromechanical behavior at the length scales considered and to develop a better understanding
of martensitic transformations at reduced length scales. The micro-compression studies involved
3
the fabrication and testing of single crystal NiTi micro pillars of different orientations.
Microstructural investigations underneath a micro indent exhibiting the two-way shape memory
effect have largely been unexplored and the mechanisms underlying the effect are presently not
clear. To address this issue, in situ phase transformation studies using transmission electron
microscopy were undertaken at different temperatures. The results from these studies will help
present a clear understanding of the mechanisms driving the two-way shape memory effect at
reduced length scales.
1.2 Organization
The research work carried in the present study is organized as follows:
Chapter 2 provides a brief introduction to NiTi shape memory alloys elucidating the dependence
of the phase transformation sequence on processing parameters. The characteristic features
associated with the phase transformation along with the mechanical behavior associated with the
different phases are described.
Chapter 3 is devoted to understanding the influence of composition and thermo-mechanical
processing parameters on the formation of the R-phase in ternary NiTiFe shape memory alloys.
Chapter 4 reports on phase dependent deformation mechanisms associated with the R-phase
transformation.
Chapter 5 and 6 comprise of the results obtained from micro-compression studies on NiTi micro
pillars. This research work was carried in collaboration with the Center for Integrated
Nanotechnologies (CINT), Los Alamos National Laboratory (LANL) Los Alamos.

4
Chapter 7 presents work on the underlying mechanisms that influence the two-way shape
memory effect in shape memory NiTi. The conclusions from the present research work are
summarized in Chapter 8.

5
CHAPTER TWO: INTRODUCTION
Shape memory alloys are novel materials that have the ability to remember and return to a
preset shape, upon heating, even after substantial deformation. The ability of the material to
recover such significant amount of deformation is a result of a solid state martensitic phase
transformation. In NiTi, the transformation occurs from a high temperature cubic austenite
phase to a low temperature monoclinic martensite phase and under certain conditions through
an intermediate trigonal R-phase. The martensitic phase transformation manifests in shape
memory alloys as the shape memory and pseudoelastic effect.
2.1 NiTi Shape Memory Alloys
The shape memory effect in NiTi alloys were discovered by Buehler et al. [7] in 1963 at the
Naval Ordinance Laboratory (NOL) and hence came to be commonly known as “NITINOL”.
Although different classes of alloys such as Cu-Zn-Al, Fe-Mn-Ni exhibit the shape memory
effect, NiTi-based alloys are the most widely used in commercial applications due to their
superior mechanical properties and the ability of the material to (i) generate very high recovery
stresses in the range of 500-600 MPa and (ii) accommodate large elastic strains up to 8%.
2.1.1 Shape Memory Effect
The shape memory effect in NiTi is related to the materials ability to return to a preset shape,
upon heating from the low temperature phase to the high temperature phase, even after
substantial deformation [8]. This effect is made possible by a reversible martensitic phase
transformation and is primarily driven by temperature changes. The shape memory effect can be
classified into two categories: (i) one-way shape memory effect, where only the preset shape of

6
the parent phase is remembered and (ii) two-way shape memory effect, where the material
remembers the preset shape of both the parent and the product phases. While the one-way effect
is an inherent material property, the two-way effect is developed in the material by thermo-
mechanical cycling procedures referred to as „training‟ [9].
2.1.2 Superelastic or Pseudoelastic Effect
The superelastic effect is driven by changes in stress and can only occur when the starting
material is in the austenitic phase and the test temperature is below the martensite desist
temperature (Md) [2]. Upon loading, the austenite undergoes a stress induced phase
transformation to the martensite phase which reverts back to the parent austenite phase upon
unloading.
2.2 Phase Transformations in NiTi Shape Memory Alloys
The solid state phase transformation in NiTi occurs from a high temperature austenite phase,
having a cubic (B2) structure to a low temperature martensite phase with a (B19') monoclinic
structure. However, under certain conditions [9], the transformation proceeds through an
intermediate phase, known as the R-phase, having a trigonal crystal structure. In general, the
transformation sequence can be altered by (i) thermo-mechanical treatments, which includes
solutionizing, precipitation and annealing or by (ii) the addition of ternary elements. Figure 1
represents the transformation paths under specific conditions in NiTi-based alloys. While the
forward transformation from B2 to R to B19' occurs upon cooling, the reverse transformation
from B19' to R to B2 takes place upon heating.

7
R-phase B19'
B2
21
2
Phase transformation
paths in NiTi-based alloys
1 – Solutionized NiTi
2 – Aged, cold worked/annealed
and ternary addition of Fe
R-phase B19'
B2
21
2
Phase transformation
paths in NiTi-based alloys
1 – Solutionized NiTi
2 – Aged, cold worked/annealed
and ternary addition of Fe
1 – Solutionized NiTi
2 – Aged, cold worked/annealed
and ternary addition of Fe
Figure 1. Transformation pathways in NiTi-based alloys.

8
2.2.1 Transformation Characteristics of NiTi
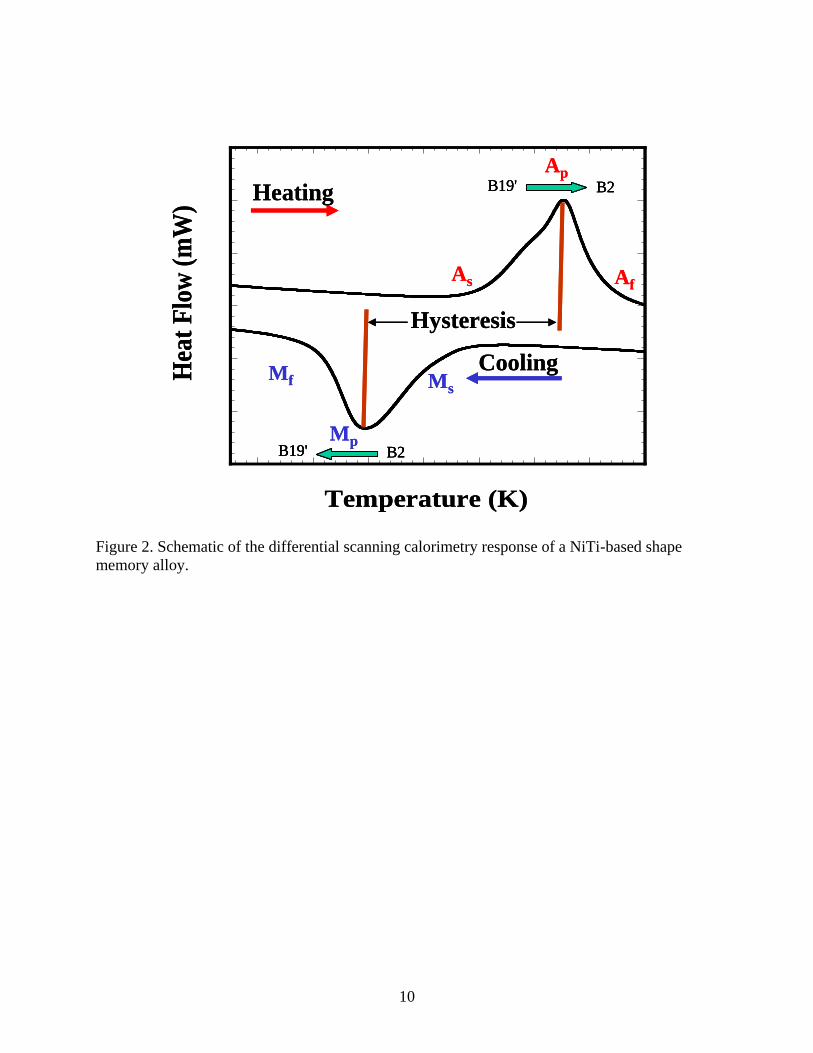
The phase transformation is characterized with respect to the transformation temperatures. Each
phase transition is associated with a start, peak and finish temperature denoted as “s”, “p” and “f”
respectively in the subscript. The phases are represented as follows:
Austenite (A)
R-phase (R)
Martensite (M)
2.2.2 Hysteresis
The forward and reverse transformations do not take place at the same temperature but exhibit a
hysteresis. The hysteresis between the forward transformation and the reverse transformation is
defined in one of the following ways: For example, in an austenite to martensite transformation,
(Ap-Mp) or
(Af-Ms) or
(As-Mf)
As refers to the temperature at which austenite starts forming from the product phase while Af
corresponds to the temperature at which the phase transformation to austenite is completed. Ap
signifies the peak transformation temperature. In a similar way, Ms is associated with the
temperature at which martensite starts forming from the parent phase and Mf, the temperature at
which the transformation is complete. Mp corresponds to the peak transformation temperature.
Hysteresis arises because of (i) the friction associated with the movement of twin related
martensite boundaries, (ii) barriers against interface movements in the course of the
9
transformation and (iii) variation in crystallographic orientation in a polycrystalline material
[10]. Typical hysteresis for the B2 to B19' transformation ranges from 20 K to 40 K. The R-
phase, on the other hand, exhibits hysteresis as low as 2 K [2]. Several factors influence the
hysteresis and they include, but are not limited to, compositional variation, addition of a ternary
element and thermo-mechanical treatments.
2.2.3 Transformation Temperature Range
The transformation temperature range in a phase transformation is defined as the difference
between the start and finish temperatures of a transformation. For e.g., (As-Af) represents the
transformation temperature range associated with the austenite phase. A wider transformation
temperature range is a result of high stored elastic energy during the forward transformation
while the converse is true for smaller transformation intervals. In general, the elastic strain
energy opposes the forward transformation and favors the reverse transformation. The
transformation temperature range is influenced by defects such as dislocations and precipitates
and thus can be tailored based on the processing route [10]. A schematic of the aforementioned
parameters are shown in Figure 2 which is the calorimetric response of a NiTi-based shape
memory alloy from a differential scanning calorimeter.
10
Hea
t F
low
(m
W)
Temperature (K)
B2 B19'
B2 B19'
Cooling
Heating
As Af
MsMf
Hysteresis
Mp
ApH
eat
Flo
w (
mW
)
Temperature (K)
B2 B19' B2 B19'
B2 B19' B2 B19'
Cooling
Heating
As Af
MsMf
Hysteresis
Mp
Ap
Figure 2. Schematic of the differential scanning calorimetry response of a NiTi-based shape
memory alloy.

11
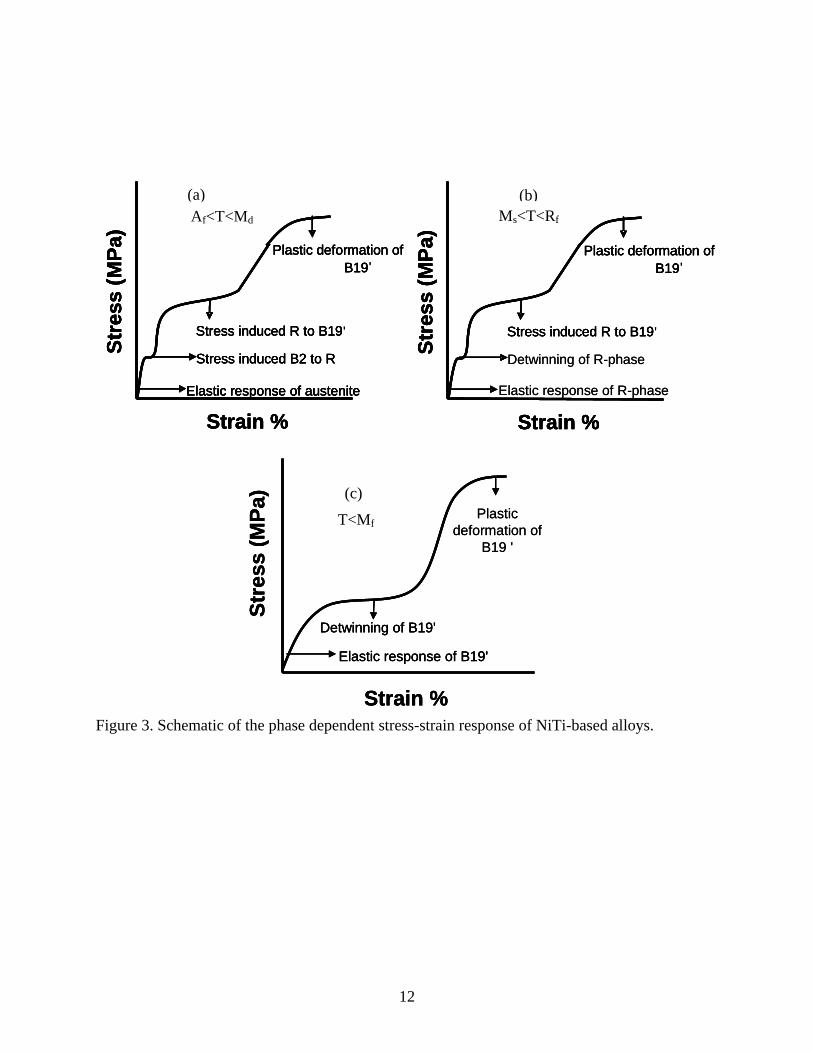
2.3 Mechanical Behavior of NiTi Shape Memory Alloys
The phase dependent mechanical behavior of NiTi is shown in Figure 3. At T>Af, the stress-
strain response is characterized by an initial elastic response of the austenite, a stress induced B2
to R-phase transformation followed by stress induced R-phase to B19' transformation and the
plastic deformation of the B19' phase. At temperatures where the R-phase exists without external
applied stress (Ms<T<Rf), the stress-strain response indicates the detwinning of the R-phase
followed by a stress induced R to B19' phase transformation, apart from elastic and plastic
deformation. Detwinning involves the conversion of multiple twin variants of the R-phase or
B19' martensite to the most favorable one. In the martensitic phase (T<Mf), the mechanical
response shows detwinning and variant reorientation associated with the B19' phase along with
the elastic and plastic response of the martensite [3].
12
Figure 3. Schematic of the phase dependent stress-strain response of NiTi-based alloys.
Elastic response of austenite
Stress induced B2 to R
Stress induced R to B19
Strain %
Str
ess (
MP
a)
Plastic deformation of
B19
Elastic response of austenite
Stress induced B2 to R
Stress induced R to B19'
Strain %
Str
ess (
MP
a)
Plastic deformation of
B19 '
Elastic response of austenite
Stress induced B2 to R
Stress induced R to B19
Strain %
Str
ess (
MP
a)
Plastic deformation of
B19
Elastic response of austenite
Stress induced B2 to R
Stress induced R to B19'
Strain %
Str
ess (
MP
a)
Plastic deformation of
B19 '
(a)
Af<T<Md
Plastic
deformation of
B19 '
Strain %
Str
es
s (
MP
a)
Detwinning of B19'
Elastic response of B19'
Plastic
deformation of
B19 '
Strain %
Str
es
s (
MP
a)
Detwinning of B19'
Elastic response of B19'
Strain %
Str
es
s (
MP
a)
Detwinning of B19'
Elastic response of B19'
(c)
T<Mf
Elastic response of R-phase
Detwinning of R-phase
Stress induced R to B19
Strain %S
tress (
MP
a)
Plastic deformation of
B19
Stress induced R to B19'
Strain %S
tress (
MP
a)
Plastic deformation of
B19 '
Elastic response of R-phase
Detwinning of R-phase
Stress induced R to B19
Strain %S
tress (
MP
a)
Plastic deformation of
B19
Stress induced R to B19'
Strain %S
tress (
MP
a)
Plastic deformation of
B19 '
(b)
Ms<T<Rf

13
CHAPTER THREE: ON THE FORMATION OF R-PHASE IN NiTiFe SHAPE
MEMORY ALLOYS
The influence of composition and thermo-mechanical treatments on the formation of the R-phase
in ternary NiTiFe shape memory alloys were studied. Selected compositions of both Ni-rich and
Ti-rich alloys were arc-melted and subsequently thermo-mechanically processed. The effect of
Fe addition on the NiTiFe alloys processed in the aforementioned manner was systematically
investigated. Additionally, the influence of precipitates and dislocations on the R-phase was
studied using differential scanning calorimetry (DSC) and transmission electron microscopy
(TEM). The results indicated that the transformation temperatures decreased with increasing Fe
content in both Ti-rich and Ni-rich NiTiFe alloys. However no phase transformation was
observed in the alloys containing 4 at% Fe. Thermo-mechanical treatments facilitated the
formation of the R-phase in Ni-rich alloys. Further, the formation of the R-phase in Ni-rich
NiTiFe alloys was dependent on the distribution and density of defects. The alloys fabricated as
part of this work have potential application in cryogenic switches, valves and seals.
3.1 Introduction
Shape memory behavior in metallic alloys is generally associated with a reversible, thermo-
elastic, martensitic phase transformation from a high temperature austenite phase to a low
temperature martensite phase. The solid state phase transformation in these alloys could be
brought about by changes in temperature and/or stress. The shape memory effect resulting in
large strain recovery can occur against forces as high as 500 MPa, upon heating, enabling their

14
use as actuators, couplings and fasteners, amongst others [3, 8, 9]. Among the different alloy
systems exhibiting shape memory behavior, nickel-titanium (NiTi) based alloys are
commercially successful and most commonly used owing to a favorable combination of material
properties coupled with substantial strain recovery and large actuation forces. The phase
transformation in NiTi usually exhibits a one-step transformation from the cubic (B2) austenite
phase to the monoclinic (B19') martensite phase or vice versa. However, the phase
transformation can be suppressed to lower temperatures and can proceed through an intermediate
trigonal phase known as the R-phase. The R-phase transformation has attracted wide attention
for actuation applications owing to its superior fatigue life and smaller hysteresis despite its low
transformation strain. The formation of R-phase and the subsequent suppression/delay in the
formation of the monoclinic martensite phase (while cooling or on the application of stress) is
attributed to the presence of defects in the form of dislocations, precipitates and/or alloying
elements [11]. In NiTi, the R-phase can be introduced by: (i) annealing below the
recrystallization temperature after cold-working resulting in a high density of rearranged
dislocations [12, 13], (ii) ageing at lower temperatures (573-773 K) in Ni-rich NiTi alloys to
form coherent/semi-coherent Ni4Ti3 precipitates which facilitate the formation of R-phase due to
the internal stress of the precipitates [12-14], (iii) addition of ternary alloying elements, such as
Fe, Co, Al [12, 15] and (iv) by thermal cycling [16-18]. Among the aforementioned routes, the
addition of ternary alloying elements is a preferred and effective way to introduce the R-phase.
This is because addition of Fe strongly suppresses the B19' phase to lower temperatures and
additionally stabilizes the R-phase over a wide temperature range [19]. On the other hand,
alternative routes such as ageing Ni-rich binary NiTi introduces complex multi-stage
15
transformations [20-22] thereby making the exclusive study of the R-phase related phenomenon
difficult. An additional advantage of using ternary alloying elements is in extending the
operational temperature range of the R-phase transformations for actuation applications, e.g., in
low temperature thermal conduction or convection switches requiring low stroke/high cycle
capability [23, 24]. The small transformation strain associated with the R-phase transformation
can be circumvented by using the shape memory element in the form of a spring [23]. The
widespread use of NiTiFe alloys as fasteners for coupling applications, at cryogenic
temperatures, additionally validates the reliability and manufacturability of these alloys [3].
Previous studies [25-29] involving the R-phase mainly focused on the crystallography of the R-
phase, anomalies associated with the sequence of the martensitic phase transformation and the
influence of thermo-mechanical treatments on the transformation characteristics. For instance,
the ambiguity associated with the space group of the R-phase was addressed in [27] and the role
of thermo-mechanical treatments on the R-phase transformation were studied in [25]. Although
few studies [3, 30, 31] have addressed the role of composition on the R-phase, primarily in Ni50-
xTi50Fex alloys, no systematic investigation has been carried to understand the influence of
composition on the phase transformation characteristics of the R-phase, for instance the effect of
Fe addition in NiTiFe alloys have not been quantified as has been done with other systems [32].
In this regard, an understanding of the preferential substitution of the alloying element is
required to facilitate the aforementioned systematic investigation. It is therefore important to
understand the site preference of Fe in NiTi. Although previous experimental studies indicate
the preferential substitution of the Fe atoms in Ni-sites, there is no clear confirmation in this
regard as factors apart from electronic configuration and atomic size are believed to influence the

16
substitutional preference of the ternary alloying element [33]. The modeling studies carried out
by Bozzolo et al. [34] indicate that when substituted for Ni, Fe exhibits a strong tendency to
remain in Ni-sites, however when substituted for Ti, it is equally probable for Fe to substitute
either for Ni or Ti. Further, from an energetics view point, the amount of energy required for Fe
to occupy Ni-sites is very low compared to Fe occupying Ti-sites. Thus it is expected that when
Fe is added to a Ni-rich stoichiometry, Fe substitutes for Ni and Ni goes into Ti sites. Bozzolo et
al. [34] conclude that Fe has a strong but not an absolute preference for Ni sites. Analogous to
Fe, Co has a strong tendency to substitute for Ni. However, Hosoda et al. [32] observed that the
transformation temperatures of NiTiCo alloys were different for Ni-rich and Ti-rich NiTiCo
alloys. They attributed the difference in the transformation temperatures to the Ni-rich
precipitates which alter the internal stress field and composition of the surrounding matrix. Thus
the objective of the present work is to understand the influence of composition on the R-phase
transformation by varying the Fe concentration in Ni-rich and Ti-rich ternary NiTiFe alloys and
additionally to quantify the shift in the start and finish temperatures of the R-phase
transformation as a function of Fe concentration. Such an investigation will enable tailoring the
transformation temperatures, transformation ranges and the associated hysteresis in NiTiFe
alloys for low temperature applications, e.g., in thermal switches for cryogenic liquefaction,
densification and zero boil-off systems, self-healing gaskets, seals, fluid line repairs, etc.,. While
the influence of composition on the R-phase transformation is studied in the present work, the
deformation behavior/mechanisms associated with the R-phase transformation is studied in
Chapter 4. Given the interdependence of stress and temperature in martensitic transformations it
becomes imperative to quantify the influence of the aforementioned variables on the phase

17
transformation characteristics. A clear understanding of the role of composition, thermo-
mechanical treatments, influence of stress and temperature on the phase transformation in
NiTiFe alloys will enable in optimizing material properties such as hysteresis, transformation
temperature range, transformation temperature, etc., and further provide guidelines in selecting
the preferred phase for specific applications, e.g., employing the B19' to R phase transformation
for one-time/high stroke applications such as release mechanisms and B2 to R phase
transformation for cyclic/low-stroke actuations.
3.2 Experimental Procedure
The starting materials for the fabrication of NiTiFe alloys included high purity slugs of Ni, Ti
(99.999% pure) and high purity Fe (99.99% pure) rod. Button shaped ingots weighing 30 g and
approximately 30 mm in diameter with an average thickness of 5 mm were arc melted using a
non consumable tungsten electrode in a chamber backfilled with ultra high purity argon. The
alloys were flipped and re-melted 15 times to ensure homogeneity in the ingot. The Ni:Ti ratio
was maintained at 0.96, 1.04, 1.13 and 1.30 while the Fe content was varied between 0, 1, 2, 3
and 4 at%. The alloys were further solutionized at different temperatures depending on the Ni:Ti
ratio. Alloys with Ni:Ti ratios < 1 (also referred to as Ti-rich subsequently in this work) were
solutionized at 1173 K for 24 hours and were furnace cooled while those with Ni:Ti ratios > 1
(also referred to as Ni-rich subsequently in this work) were solutionized at 1173 K and 1373 K
for 24 hours and quenched in ice cold water. The solutionized alloys were subsequently cold
worked by different degrees (10%, 15% and 30%) and annealed at 773 K for 1 hour. The exact
heat treatment can be found in column 3 of Table 1. The heat treatment was carried out using an
encapsulation setup wherein vacuum of the order of 10-6
torr was created in a quartz tube in
18
which the specimen was kept and the tube was sealed using an oxyacetylene torch. The
encapsulated quartz tube containing the NiTiFe specimen was subjected to varying heat
treatments in a muffle furnace. The phase transformation temperatures of the alloys were studied
using a Perkin Elmer Diamond differential scanning calorimeter (DSC). The DSC samples were
cut using a slow speed diamond saw. The samples were heated and cooled at a rate of 20 K/min.
Microstructural analysis was carried using a Philips Tecnai F30 300 kV transmission electron
microscope (TEM). The TEM samples were prepared using a FEI200TEM focused ion beam
(FIB) station. JEOL 733 Super Probe electron probe microanalysis (EPMA) was used to analyze
the chemical composition.
3.3 Results and Discussion
3.3.1 Homogeneity in the NiTiFe Alloys Fabricated by Arc Melting
The melting conditions were carefully monitored and controlled during the fabrication process
due to the sensitivity of the melt to impurity elements such as oxygen, carbon etc., and issues
pertaining to segregation wherein changes in the Ni concentration by 1 at. % leads to shifts of up
to 100 K in the phase transformation temperatures [33]. While arc melting has several
advantages such as 1) facilitates melting of small quantities of alloys with different compositions
2) is economical and 3) does not cause carbon contamination, as is the case with induction
melting, it was important to ensure that the melted samples were homogeneous throughout the
bulk specimen. Compositional homogeneity in the button samples was ensured by optimizing the
number of flips/remelts and by controlling the subsequent solutionizing time. The compositional
homogeneity of the samples was examined by an electron microprobe and additionally by
19
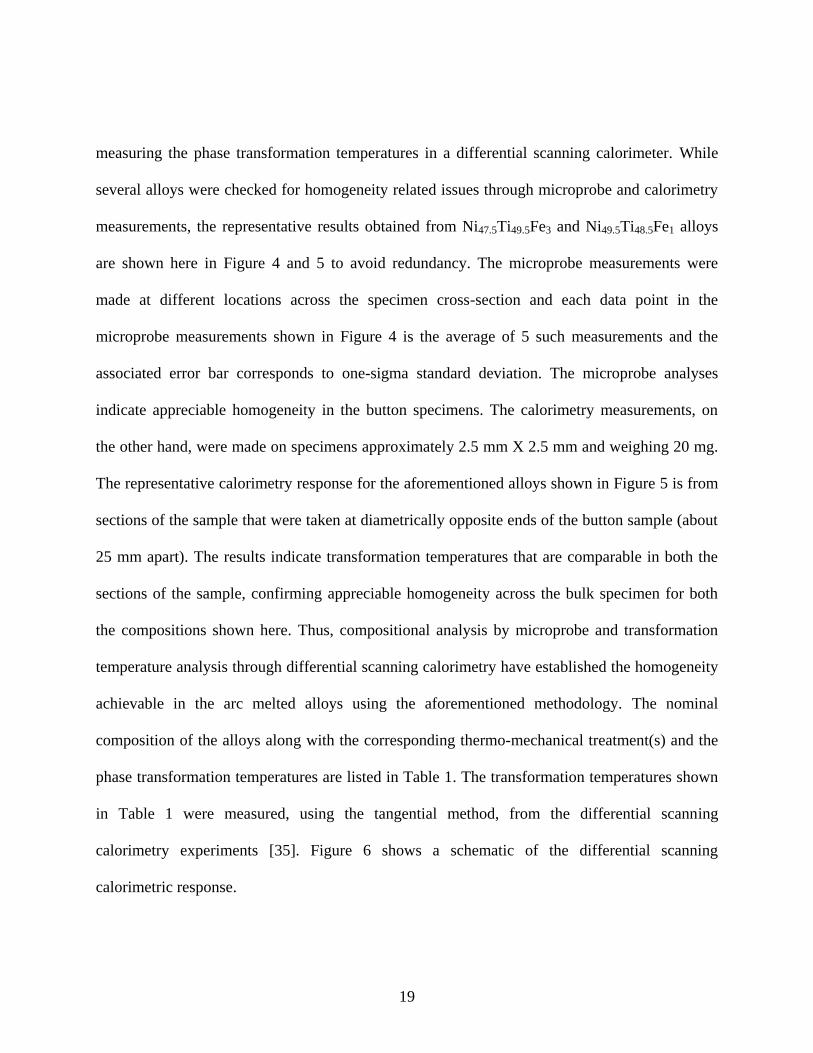
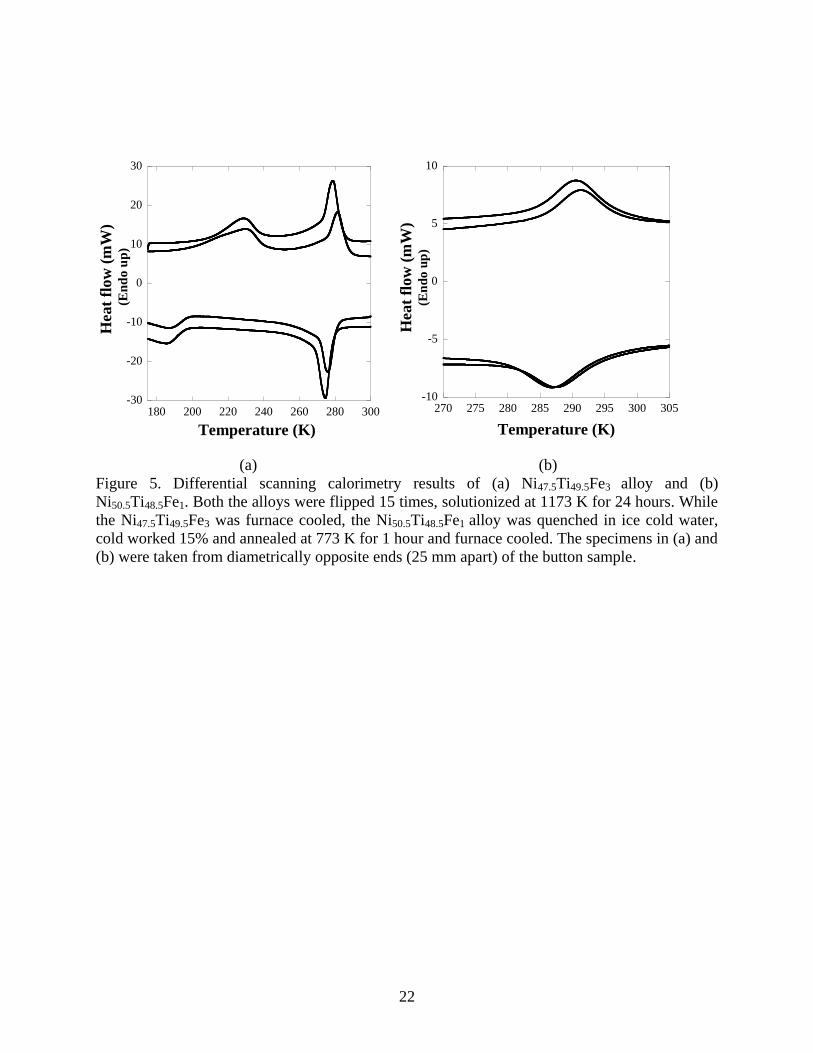
measuring the phase transformation temperatures in a differential scanning calorimeter. While
several alloys were checked for homogeneity related issues through microprobe and calorimetry
measurements, the representative results obtained from Ni47.5Ti49.5Fe3 and Ni49.5Ti48.5Fe1 alloys
are shown here in Figure 4 and 5 to avoid redundancy. The microprobe measurements were
made at different locations across the specimen cross-section and each data point in the
microprobe measurements shown in Figure 4 is the average of 5 such measurements and the
associated error bar corresponds to one-sigma standard deviation. The microprobe analyses
indicate appreciable homogeneity in the button specimens. The calorimetry measurements, on
the other hand, were made on specimens approximately 2.5 mm X 2.5 mm and weighing 20 mg.
The representative calorimetry response for the aforementioned alloys shown in Figure 5 is from
sections of the sample that were taken at diametrically opposite ends of the button sample (about
25 mm apart). The results indicate transformation temperatures that are comparable in both the
sections of the sample, confirming appreciable homogeneity across the bulk specimen for both
the compositions shown here. Thus, compositional analysis by microprobe and transformation
temperature analysis through differential scanning calorimetry have established the homogeneity
achievable in the arc melted alloys using the aforementioned methodology. The nominal
composition of the alloys along with the corresponding thermo-mechanical treatment(s) and the
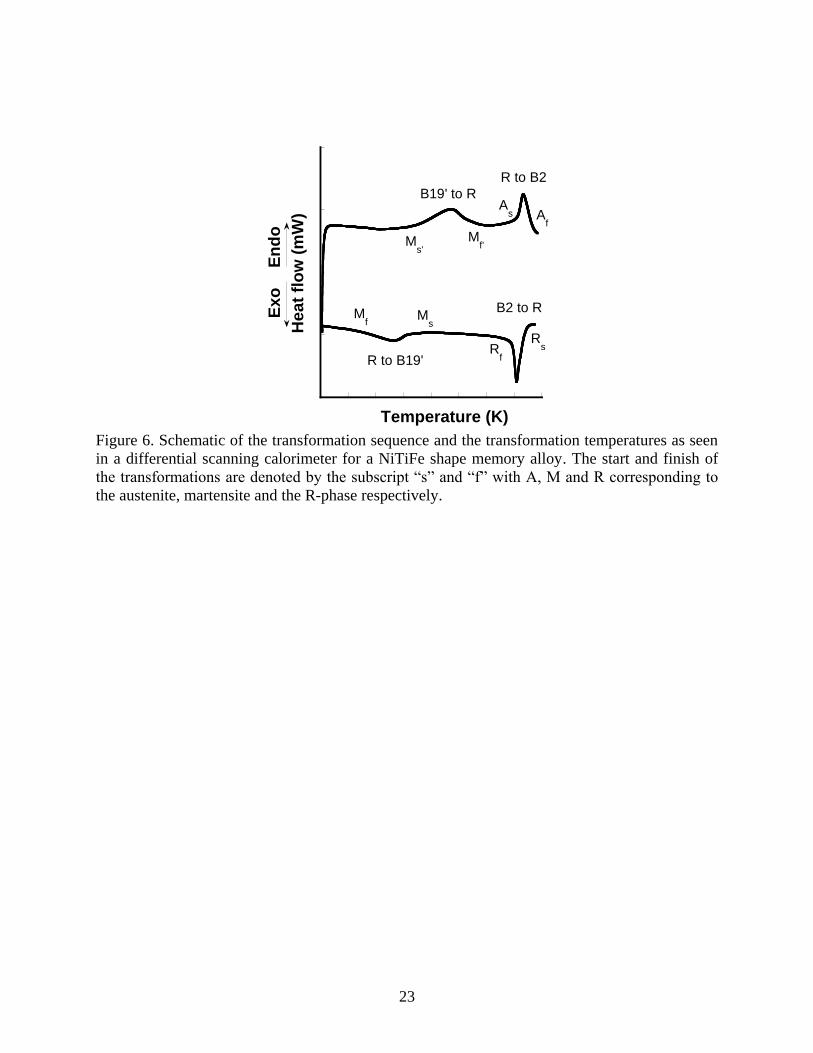
phase transformation temperatures are listed in Table 1. The transformation temperatures shown
in Table 1 were measured, using the tangential method, from the differential scanning
calorimetry experiments [35]. Figure 6 shows a schematic of the differential scanning
calorimetric response.

20
Composition Ni/Ti
(at%)
Heat
Treatment
Transformation Temperatures (K)
Ms Mf Rs Rf As Af
Ni45Ti50Fe5 0.90
Sol. -1173 K for 24 hrs
and furnace cooled
<120 <120 235 196 199 238
Ni46Ti50Fe4 0.92 <120 <120 248 235 245 252
Ni47Ti50Fe3 0.94 134 <120 234 215 226 239
Ni49Ti51Fe0 0.96 357 334 - - 368 386
Ni48.5Ti50.5Fe1 0.96 297 278 320 310 324 338
Ni48Ti50Fe2 0.96 246 199 292 279 284 298
Ni47.5Ti49.5Fe3 0.96 199 164 279 275 275 291
Ni47Ti49Fe4 0.96 No phase transformation
Ni50.5Ti48.5Fe1 1.04 Sol. -1173 K for 24 hrs
and ice water quenched;
CW 15 % annealed 773
K for 1 hr. (A)
<120 <120 296 278 284 291
Ni50Ti48Fe2 1.04 <120 <120 271 249 255 264
Ni49.5Ti47.5Fe3 1.04 <120 <120 250 203 214 255
Ni49Ti47Fe4 1.04 No phase transformation
Ni49Ti47Fe4 1.04 (A) + CW 15 %
annealed 673 K for 1 hr. <120 <120 230 181 197 242
Ni49Ti47Fe4 1.04 (A) + CW 15 %
annealed 873 K for 1 hr. <120 <120 222 161 173 228
Ni49Ti47Fe4 1.04
(A) + CW 15 %
annealed 1073 K for 1
hr.
No phase transformation
Ni52Ti46Fe2 1.13 Sol. -1373 K for 24 hrs
and ice water quenched;
CW 10 % annealed 773
K for 1 hr.
<120 <120 261 249 246 267
Ni55.4Ti42.6Fe2 1.30 <120 <120 250 215 205 241
Sol. = Solutionized; CW = Cold Worked
Table 1. Nominal composition of arc melted NiTiFe shape memory alloys. The transformation
temperatures shown here were measured using a differential scanning calorimeter.

21
(a)
(b)
Figure 4. Averaged results from microprobe analysis of (a) Ni47.5Ti49.5Fe3 and (b) Ni50.5Ti48.5Fe1.
Both the alloys were flipped 15 times, solutionized at 1173 K for 24 hours. While the
Ni47.5Ti49.5Fe3 was furnace cooled, the Ni50.5Ti48.5Fe1 alloy was quenched in ice cold water, cold
worked 15% and annealed at 773 K for 1 hour and furnace cooled.
2
2.5
3
3.5
4
45
46
47
48
49
50
51
52
0 500 1000 1500 2000 2500
Fe
(a
t%)
Ti (a
t%), N
i (at%
)
Distance ( X 10-6
m )
Fe
Ti
Ni
0.8
0.85
0.9
0.95
1
1.05
1.1
1.15
1.2
47.5
48
48.5
49
49.5
50
50.5
51
0 500 1000 1500 2000 2500
Fe
(at%
)T
i (at%), N
i (at%)
Distance (X 10-6
m)
Ti
Ni
Fe
22
(a) (b)
Figure 5. Differential scanning calorimetry results of (a) Ni47.5Ti49.5Fe3 alloy and (b)
Ni50.5Ti48.5Fe1. Both the alloys were flipped 15 times, solutionized at 1173 K for 24 hours. While
the Ni47.5Ti49.5Fe3 was furnace cooled, the Ni50.5Ti48.5Fe1 alloy was quenched in ice cold water,
cold worked 15% and annealed at 773 K for 1 hour and furnace cooled. The specimens in (a) and
(b) were taken from diametrically opposite ends (25 mm apart) of the button sample.
-30
-20
-10
0
10
20
30
180 200 220 240 260 280 300
Heat
flo
w (
mW
) (E
nd
o u
p)
Temperature (K)
-10
-5
0
5
10
270 275 280 285 290 295 300 305H
ea
t fl
ow
(m
W)
(En
do u
p)
Temperature (K)
23
Heat
flo
w (
mW
)
Temperature (K)
As
Ms
Rs
Af
Rf
Mf
B2 to R
R to B2
R to B19'
B19' to R
Ms'
Mf'
En
do
Exo
Figure 6. Schematic of the transformation sequence and the transformation temperatures as seen
in a differential scanning calorimeter for a NiTiFe shape memory alloy. The start and finish of
the transformations are denoted by the subscript “s” and “f” with A, M and R corresponding to
the austenite, martensite and the R-phase respectively.

24
Figure 7. Bright field micrograph and the corresponding diffraction pattern showing (a) austenite
at room temperature, (b) R-phase at 270K and (c) B19' martensite at 173K in Ni48Ti50Fe2. The
zone axis corresponding to the diffraction patterns of austenite and R-phase is [111] while that of
martensite is [001].
0.5 µm0.5 µm
10 1/nm10 1/nm
0.2 µm0.2 µm
5 1/nm5 1/nm
(a) (b)
100 nm
10 1/nm10 1/nm
(c)

25
100 150 200 250 300 350 400 450
He
at
flo
w (
mW
)
Temperature (K)
Ni49
Ti51
Ni47.5
Ti49.5
Fe3
Ni48
Ti50
Fe2
Ni48.5
Ti50.5
Fe1
Ni47
Ti49
Fe4
Figure 8. Differential scanning calorimetry response of Ti-rich NiTiFe shape memory alloys with
increasing Fe content. The Ni/Ti ratio was kept constant at 0.96 (at%).

26
Microstructural investigations using in situ transmission electron microscopy further substantiate
the calorimetry observations of the martensitic phase transformations in the NiTiFe alloys.
Figure 7 shows a representative micrograph of the austenite, the R and the monoclinic martensite
phase in a Ni48Ti50Fe2 alloy. The inset shows the diffraction pattern of the corresponding
phases. The phase transformation observations through multiple analytical techniques along with
the compositional analyses through microprobe validate the methodology in the processing and
characterization of the button ingots studied in the present work.
3.3.2 Ni:Ti < 0.96
The transformation temperatures measured from the calorimetry measurements are shown in
Table 1 and for ease in qualitative comparison the calorimetric response is additionally shown in
Figure 8. The solutionized alloys were not quenched in ice cold water as the boundary of the
primary phase field of NiTi on the Ti-rich side of the phase diagram is almost vertical and hence
ageing the alloy is expected to have no significant effect in controlling the phase transformations
[33]. Calorimetry results show that addition of Fe helps in the formation of an intermediate
trigonal R-phase in NiTi and further the transformation temperatures decrease with increasing Fe
content. However, the alloy containing 4 at% Fe did not exhibit any phase transformation down
to temperatures as low as 120 K. Although the incommensurate-commensurate transition in
NiTiFe alloys has been a subject of controversy, recent studies [30, 36] on Ti-rich NiTiFe alloys
of stoichiometry Ni50-xTi50Fex have shown that the R-phase transformation does not occur in
alloys with Fe content of 6 at% and above, instead a second order like incommensurate-
commensurate transition, involving no latent heat and discontinuity in lattice parameters, occurs.
It is probable that the absence of phase transformation in the alloy containing 4 at% Fe could be
27
due to the non-observable nature of the second order phase transition, in a differential scanning
calorimeter resulting from the incommensurate-commensurate transition. A comparison of the
start (s) and finish (f) temperatures of austenite (A), R-phase (R) and B19' martensite (M) from
Table 1 reveal that the martensite start (Ms) and finish (Mf) are shifted to lower temperatures
more effectively as opposed to the other transformation temperatures. The high sensitivity of
B19' martensite phase to the ternary Fe addition can be explained based on the elastic constant
measurements by Ren et al. [37]. Accordingly, they suggested that the addition of Fe results in
an increase in the stiffness constant C44, equivalent to the shear resistance along 110}001{
which is critical in the formation of B19'. Thus the hardening of C44 results in the B19' phase
becoming unstable and shifting to lower temperatures resulting in the parent phase transforming
first to an intermediate phase with a smaller transformation strain before transforming to the final
product phase. In general, the phase transformation characteristics in Ti-rich binary NiTi alloys
is identical to equi-atomic NiTi in that the Ms temperature remains almost constant on the Ti-rich
side [33]. However, the results for Ti-rich NiTiFe alloys show a continuous decrease in the B19'
transformation temperatures (Ms and Mf). The R-phase (Rs and Rf) and austenite (As and Af)
transformation temperatures decrease till 2 at% Fe and flatten out thereafter. On comparing the
binary NiTi and ternary NiTiFe alloys, it is established that the introduction of the R-phase and
the strong composition dependence of Ms and Mf are explicitly caused by the ternary addition of
Fe.
Due to the indifference of the R-phase transformation in Ti-rich alloys to varying thermo-
mechanical treatments and the absence of Ni-rich precipitates, such as Ni4Ti3, the influence of
28
transformation temperatures upon ageing and electron microscopy studies discussed in the
present work is limited to the Ni-rich alloys.
3.3.3 Ni:Ti > 1
The solutionizing treatment of Ni-rich NiTiFe alloys was selected to ensure that single phase
NiTi was obtained at room temperature. This was achieved by quenching the solutionized sample
in ice-cold water. These alloys did not exhibit phase transformation in the as melted or
solutionized condition when tested to temperatures as low as 120 K. Hence the alloys having
Ni:Ti > 1 were thermo-mechanically processed to precipitate the Ni4Ti3 metastable phase.

29
100 150 200 250 300 350
He
at
flo
w (
mW
)
Temperature (K)
Ni50
Ti48
Fe2
Ni49
Ti47
Fe4
annealed 673 K, 1hr.
Ni50.5
Ti48.5
Fe1
Ni49.5
Ti47.5
Fe3
Ni49
Ti47
Fe4
annealed 873 K, 1hr.
Ni49
Ti47
Fe4
annealed 1073 K, 1hr.
Ni49
Ti47
Fe4
Figure 9. Differential scanning calorimetry results from Ni-rich NiTiFe alloys with increasing Fe
content. The Ni/Ti ratio was kept constant at 1.04 (at%).
30
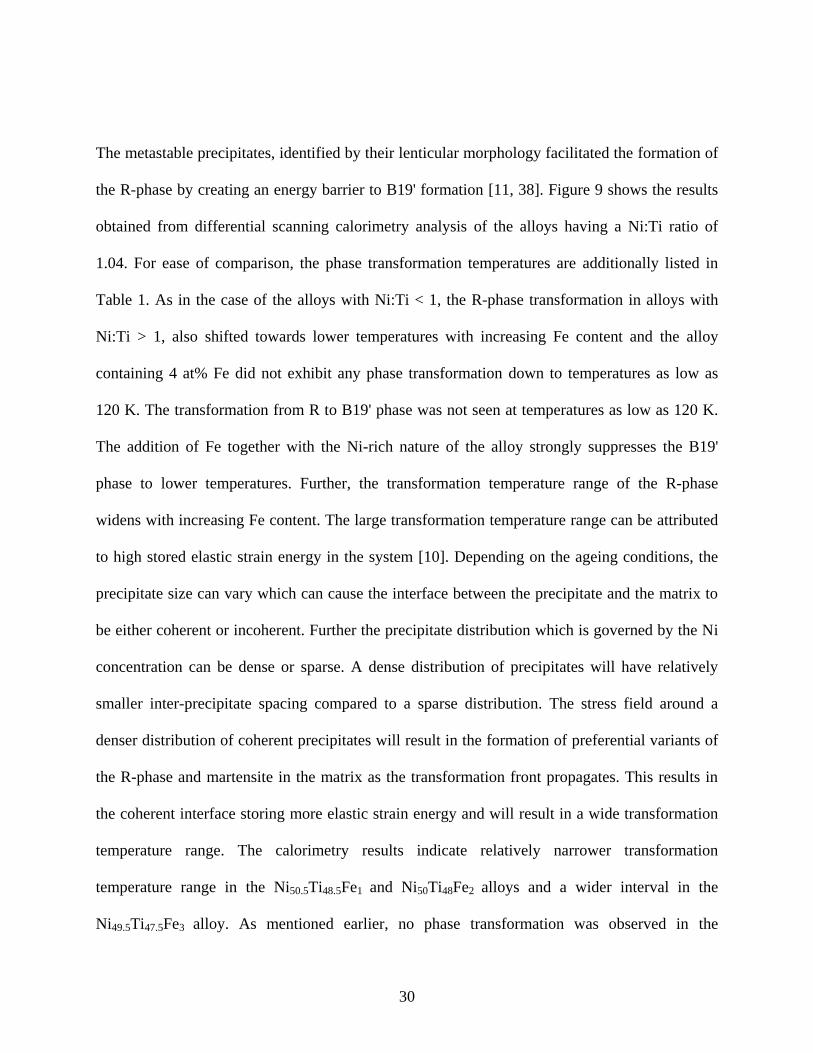
The metastable precipitates, identified by their lenticular morphology facilitated the formation of
the R-phase by creating an energy barrier to B19' formation [11, 38]. Figure 9 shows the results
obtained from differential scanning calorimetry analysis of the alloys having a Ni:Ti ratio of
1.04. For ease of comparison, the phase transformation temperatures are additionally listed in
Table 1. As in the case of the alloys with Ni:Ti < 1, the R-phase transformation in alloys with
Ni:Ti > 1, also shifted towards lower temperatures with increasing Fe content and the alloy
containing 4 at% Fe did not exhibit any phase transformation down to temperatures as low as
120 K. The transformation from R to B19' phase was not seen at temperatures as low as 120 K.
The addition of Fe together with the Ni-rich nature of the alloy strongly suppresses the B19'
phase to lower temperatures. Further, the transformation temperature range of the R-phase
widens with increasing Fe content. The large transformation temperature range can be attributed
to high stored elastic strain energy in the system [10]. Depending on the ageing conditions, the
precipitate size can vary which can cause the interface between the precipitate and the matrix to
be either coherent or incoherent. Further the precipitate distribution which is governed by the Ni
concentration can be dense or sparse. A dense distribution of precipitates will have relatively
smaller inter-precipitate spacing compared to a sparse distribution. The stress field around a
denser distribution of coherent precipitates will result in the formation of preferential variants of
the R-phase and martensite in the matrix as the transformation front propagates. This results in
the coherent interface storing more elastic strain energy and will result in a wide transformation
temperature range. The calorimetry results indicate relatively narrower transformation
temperature range in the Ni50.5Ti48.5Fe1 and Ni50Ti48Fe2 alloys and a wider interval in the
Ni49.5Ti47.5Fe3 alloy. As mentioned earlier, no phase transformation was observed in the

31
Ni49Ti47Fe4 alloy. Thus it is expected that the precipitate distribution should get denser with
increasing Fe concentration. Microstructural analysis of the ternary Ni-rich NiTiFe alloys
through transmission electron microscopy confirm the aforementioned trend. Figure 10a and 10b
representing the microstructures of Ni50.5Ti48.5Fe1 and Ni50Ti48Fe2 alloys, respectively, show a
less denser distribution of precipitates while a denser distribution is observed in Ni49.5Ti47.5Fe3
and Ni49Ti47Fe4 alloys represented by Figure 11a and 11b. Figure 12 represents the magnified
bright field micrographs of the precipitates. The precipitate size in the Ni50.5Ti48.5Fe1 and
Ni50Ti48Fe2 alloys estimated from Figure 12a and 12b is in the range of 100-150 nm while that of
Ni49.5Ti47.5Fe3 shown in Figure 13a is estimated to be in the range of 50-100 nm. Further, in
Figure 13b, a dense distribution of relatively small (< 50 nm) Ni4Ti3 precipitates has been shown
to impede the phase transformation in the Ni49Ti47Fe4 system. The micrographs indicate that the
size of the precipitates decrease with increasing Fe content. Zel‟dovich et al. [39] observed that
as the precipitates grow in size the stress field around the precipitates also increase. The stress
field vanishes beyond a certain point when the interface between the precipitates and the matrix
becomes incoherent. Stress field around precipitates favor the nucleation of R-phase, which
becomes difficult when the precipitates are very small. This could explain the absence of R-
phase in the alloy containing 4 at% Fe although the reason behind the decrease in precipitate size
is not clear. The above discussed microstructural and calorimetry observations imply that the R-
phase transformation can be initiated and influenced by altering the distribution and size of the
metastable Ni4Ti3 precipitates. To substantiate this observation, the alloy containing 4 at% Fe,
which showed the absence of R-phase, was subjected to additional thermo-mechanical
treatments.

32
Figure 10. Representative bright field images of (a) Ni50.5Ti48.5Fe1 and (b) Ni50Ti48Fe2 alloys
showing relatively wider inter-precipitate spacing of the metastable Ni4Ti3 precipitates.
0.2 µm0.2 µm0.2 µm0.2 µm
(a)
0.2 µm0.2 µm0.2 µm0.2 µm
(b)

33
Figure 11. Representative bright field images of (a) Ni49.5Ti47.5Fe3 and (b) Ni49Ti47Fe4 alloys
showing relatively narrower inter-precipitate spacing of the metastable Ni4Ti3 precipitates.
0.2 µm0.2 µm0.2 µm0.2 µm
0.2 µm0.2 µm0.2 µm0.2 µm
(a)
(b)
34
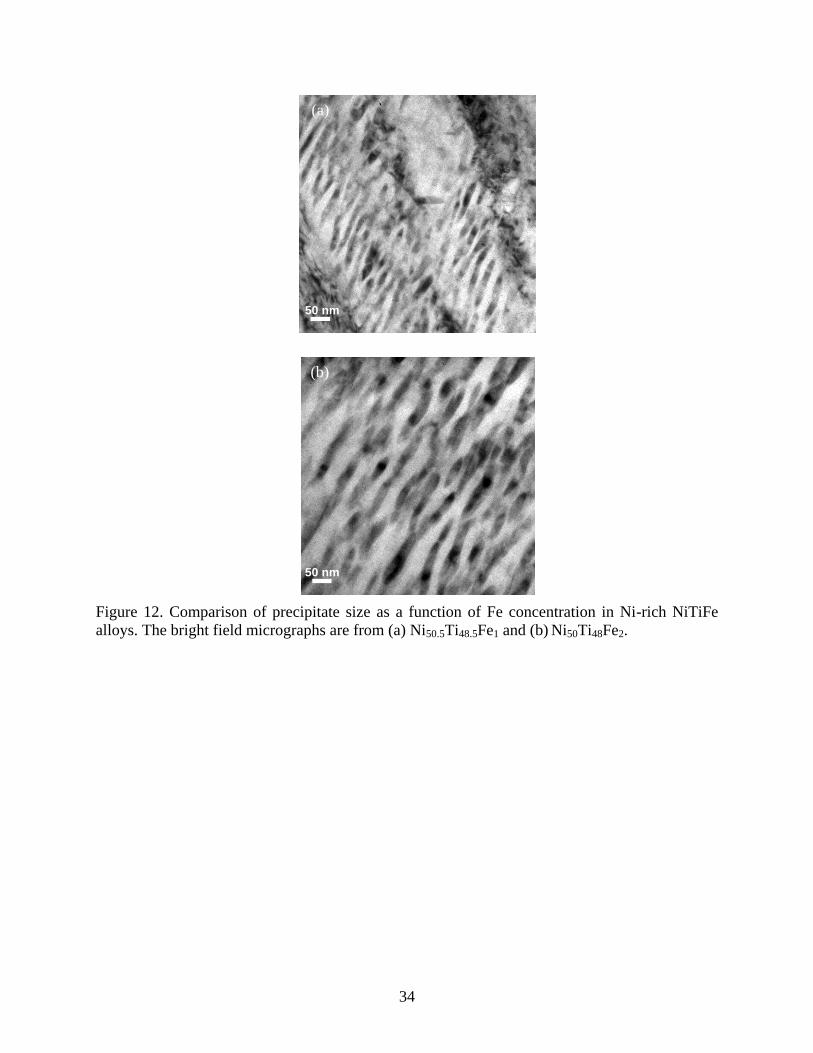
Figure 12. Comparison of precipitate size as a function of Fe concentration in Ni-rich NiTiFe
alloys. The bright field micrographs are from (a) Ni50.5Ti48.5Fe1 and (b) Ni50Ti48Fe2.
50 nm50 nm50 nm50 nm
(a)
50 nm50 nm50 nm50 nm
(b)

35
Figure 13. Comparison of precipitate size as a function of Fe concentration in Ni-rich NiTiFe
alloys. The bright field micrographs are from (a) Ni49.5Ti47.5Fe3 and (b) Ni49Ti47Fe4.
50 nm50 nm50 nm50 nm
50 nm50 nm50 nm50 nm
(a)
(b)

36
Following the solutionizing treatment and initial cold working by 15% and subsequent annealing
at 773 K for 1 hour, the Ni49Ti47Fe4 alloy was additionally cold worked by 15% and annealed at
673 K, 873 K and 1073 K. The annealing time was kept constant at 1 hr. The details of the
thermo-mechanical treatments are given in column 2 of Table 1. The results from the calorimetry
analysis on Ni49Ti47Fe4 annealed at different temperatures after additional thermo-mechanical
processing are shown in Figure 9. The samples annealed at 673 K and 873 K showed the R-phase
transformation but with wider transformation intervals. However, no phase transformation was
observed in the specimen annealed at 1073 K. Further, the phase transformation occurred at
lower temperatures in the sample annealed at 873 K as opposed to the sample annealed at 673 K.
This is in agreement with an earlier study [29] where a decrease in the R-phase transformation
temperatures with increasing ageing temperature was observed in Ni-rich NiTi alloys. Figure 14a
representing the microstructure of the alloy annealed at 673 K shows dense distribution of
dislocations in the samples while Figure 14b representing the micrograph of the sample
annealed at 873 K shows a relatively lesser dislocation density. This decrease in the dislocation
density is a direct consequence of the annealing temperature, i.e., higher the annealing
temperature, lower the dislocation density. The sample annealed at 1073 K, seen in Figure 14c,
shows the absence of defects and thus did not exhibit any phase transformation. In addition to the
dislocations, the microstructural investigation of the aforementioned specimens also indicated
the presence of metastable Ni4Ti3 precipitates as confirmed by energy dispersive X-ray
spectroscopy (EDX) analysis. The precipitate size and distribution in the specimens annealed at
673 K and 873 K are shown in Figure 15a and 15b respectively. The microscopy observations

37
Figure 14. Comparison of dislocation densities as a function of annealing temperature in the
Ni49Ti47Fe4 alloy with samples annealed for 1 hr at (a) 673 K (b) 873 K and (c) 1073 K. The
dislocation density is seen to reduce with increasing annealing temperature.
200 nm200 nm200 nm200 nm
200 nm200 nm200 nm200 nm200 nm200 nm200 nm200 nm
(a) (b)
(c)

38
Figure 15. Bright field micrographs of Ni49Ti47Fe4 alloy annealed for 1 hr at (a) 673 K and (b)
873 K showing the dissolution of precipitates with increasing annealing temperature.
0.5 µm0.5 µm0.5 µm0.5 µm
0.5 µm0.5 µm0.5 µm0.5 µm
(a)
(b)
39
indicate that the additional thermo-mechanical treatment on the Ni49Ti47Fe4 alloy resulted in a
different microstructure with the precipitate size greater than 500 nm. This can be contrasted
with the micrograph shown in Figure 13b where the precipitate size is < 50 nm. Further, coarser
precipitates are observed in the specimens subjected to additional thermo-mechanical treatment.
A comparison of the microstructures of the specimens annealed at 673 K and 873 K reveal that
with increasing annealing temperatures the precipitates start dissolving in the matrix thereby
enriching the Ni concentration in the matrix. Thus the sample annealed at 873 K has a lower
transformation temperature relative to the sample annealed at 673 K. The wide transformation
range is a consequence of the dislocations as it has been observed [40] that dislocations more
strongly prevent the interface movements in the R-phase and martensite. Thus with additional
thermo-mechanical treatments dislocations and relatively larger precipitates with wider inter-
precipitate spacing facilitate the formation of the R-phase. The energy dispersive X-ray
spectroscopy (EDX) analysis on the above specimens further revealed the presence of stable
Ni3Ti phase. A representative microstructure of the Ni3Ti precipitate is shown in Figure 16 for
the sample annealed at 873 K. From the above results, it can be seen that with increasing Fe
content, varying thermo-mechanical treatments are required to induce the R-phase
transformation. However, the transformation temperature range for the formation of the R-phase
is very large. In extremely Ni-rich binary NiTi alloys, Wocjik [41] observed that ageing at longer
times results in smaller transformation temperature ranges resulting in sharper transformation.
The shift in the transformation temperatures after ageing at longer times was also found to be
relatively smaller. Thus it is believed that the wider transformation temperature ranges in the

40
200 nm
Ni 3Ti
200 nm
Ni 3Ti
Figure 16. Representative micrograph from the Ni49Ti47Fe4 alloy subjected to annealing at 873 K
for 1 hour following multiple thermo-mechanical treatments, showing the presence of Ni3Ti
precipitates. The precipitate composition was confirmed through EDX analysis.

41
NiTiFe alloys considered in the present study could be appreciably reduced by annealing at
longer times. Alloys with Ni:Ti ratio of 1.13 and 1.3 having 2 at% Fe were difficult to cold work
due to excess Ni in the matrix, as a result of the solutionizing treatment. The transformation
temperatures of these alloys are shown in Table 1. As with the other Ni-rich alloys, these alloys
also did not exhibit any phase transformation in the as fabricated state. Thermo-mechanical
treatment enabled the formation of the R-phase in these alloys and the samples with higher Ni:Ti
ratios had the transformation occurring at lower temperature. A comparison of the start
temperature of R-phase transformation from previous studies [25, 27, 31, 38, 42-47] with the
present work is shown in Figure 17. Although the Ni:Ti ratio is different for the alloys shown
here, it is commonly observed that the Rs decreases with increasing Fe concentration. Further,
from Table 1 it can be established that the transformation temperatures for the formation of the
R-phase decrease with increasing Ni:Ti ratio, when Fe is kept constant. Thus there are two ways
in which the R-phase transformation could be realized at lower temperatures in Ni-rich NiTiFe
alloys: 1) by increasing the Fe content and 2) by increasing the Ni/Ti ratio, keeping the Fe
content constant. In both the cases thermo-mechanical treatments are necessary to induce the R-
phase transformation.
3.3.4 Effect of cold working on the R-phase transformation
The effect of varying the amount of cold working on the R-phase transformation in both the Ti-
rich and Ni-rich NiTiFe alloys were additionally investigated in the present work. Although the
degree of cold working varied, the annealing conditions were kept constant. While Ti-rich alloys
were annealed at 873 K for 30 minutes, Ni-rich alloys were annealed at 773 K for 1 hr. The
calorimetry observations showed no appreciable changes in the phase transformation temperature

42
150
200
250
300
350
0 1 2 3 4 5
Ti-rich present study
Ni-rich present study
Hwang et al. [Ref 28]
Fukuda et al. [Ref 32]
Hara et al. [Ref 21]
Frenzel et al. [Ref 23]
Tamiya et al. [Ref 48]
Murakami et al. [Ref 45]
Canales et al. [Ref 43]
Nishida et al. [Ref 46]
Pushin et al. [Ref 47]
Jiang et al. [Ref 44]
Te
mp
era
ture
(K
)
Fe (at%)
Figure 17. Comparison of the R-phase start transformation temperature between previous studies
and the present work.
43
of the R-phase in both the categories of alloys studied, implying above certain saturation levels,
dislocation densities do not play a major role. However, as mentioned earlier, in the case of
Ni49Ti47Fe4 alloy subjected to varying annealing conditions, a shift in the R-phase transformation
temperatures was observed.
3.4 Conclusions
The R-phase transformation in NiTiFe alloys have been studied as a function of composition.
The results and observations from the present study involving ternary NiTiFe shape memory
alloys can be summarized as follows:
The arc melted samples fabricated in this study have been shown to be homogeneous
through out the bulk of the sample. The compositional analysis through microprobe and
the transformation temperature measurements through differential scanning calorimetry
analysis establish the homogeneity observed in the samples.
The results show that R-phase transformation temperatures decrease with increasing
Ni/Ti ratios. Alternatively, increasing the Fe concentration can also lower the
transformation temperatures of the R-phase.
The addition of Fe as a ternary alloying element introduces the R-phase in Ti-rich alloys.
No phase transformation was observed in the Ti-rich alloys having 4 at% Fe.
Ni-rich alloys exhibit the R-phase transformation only after thermo-mechanical
treatments. This is because of the influence of Ni-rich precipitates, as seen from the TEM
images.

44
Specimens with larger precipitate size and wider inter-precipitate spacing of metastable
Ni4Ti3 precipitates results in a narrower transformation temperature range while the
converse is true for alloys with smaller precipitate size and dense distribution.
It has also been shown that small additions of Fe can help eliminate the complex multiple
phase transformation in Ni-rich binary NiTi alloys.
As the Fe content increases, thermo-mechanical treatments facilitate the nucleation of the
R-phase in Ni-rich NiTiFe alloys.
A comparison of the transformation temperatures of the R-phase in Ni-rich (Ni/Ti = 1.04)
and Ti-rich (Ni/Ti = 0.96) alloys as a function of Fe content showed that the Ni-rich
alloys are able to lower the transformation temperatures of the R-phase more efficiently
than the Ti-rich alloys. In Ni-rich alloys the peak transformation temperature of the R-
phase (Rp) decreases at the rate of 30 K per at.% of Fe while in Ti-rich alloys it was 20 K
per at.%.

45
CHAPTER FOUR: DEFORMATION STUDIES IN NiTiFe SHAPE MEMORY ALLOYS
The use of binary NiTi shape memory alloys in certain actuator applications is limited by
specific requirements associated with hysteresis, fatigue and temperature of operation, among
others. Addition of Fe to NiTi introduces an intermediate trigonal R-phase and lowers the
monoclinic B19' martensitic transformation temperature. The presence of an intermediate R-
phase further complicates an already convoluted selection of deformation mechanisms in stress-
temperature space. This study focuses on examining two competing mechanisms, i.e., detwinning
and stress-induced transformation that govern inelastic deformation in the R-phase in the stress-
temperature domain. The propensity of the R-phase to detwin decreases with decreasing
temperature and further at very low temperatures the R-phase underwent a direct stress induced
transformation to the B19' phase. The B2 to R-phase and the R-phase to B19' reversible stress
induced phase transformations were analyzed within the framework of the Clausius-Clapeyron
relation. Regions in stress-temperature space are identified based on detwinning in the R-phase
followed by a stress-induced transformation to B19' martensite and a region where the onset of
stress induced transformation occur without any prior detwinning.
4.1 Introduction
The shape memory effect in NiTi-based alloys make them a strong candidate for actuator
applications due to the inherent combination of sensing and actuating functions along with their
ability to offer high energy density. The use of these alloys in numerous applications is governed
by the operational temperature, applied load, and the associated hysteresis, among others. The R-

46
phase transformation in ternary NiTiFe alloys is uniquely suited for low temperature applications
such as actuation based thermal conduction/convection switches, coupling, seals and valves due
to their superior fatigue life and reduced hysteresis [23, 24, 48]. In Chapter 3, we reported on a
systematic investigation of the influence of composition and thermo-mechanical treatment on the
R-phase transformation in NiTiFe shape memory alloys. The transformation temperatures
decreased with increasing Ni and Fe content and thermo-mechanical treatments involving cold
working and annealing were necessary to facilitate the formation of the R-phase in Ni-rich
alloys. Reduced hysteresis and narrower transformation temperature range in Ni-rich alloys were
achieved by controlling the distribution, spacing and size of the precipitates. Ni-rich alloys were
able to lower the transformation temperatures further than the Ti-rich alloys. Given the
equivalence of stress and temperature on the phase transformations in the NiTiFe system it is
important to qualitatively as well as quantitatively understand the interdependence of the
aforementioned variables. This is particularly important in applications which involve changes in
stress and temperature, such as an actuator. In light of the above discussion, the experimental
investigations in the present study were tailored to further our understanding on the multiple
deformation modes available in NiTiFe and study the potential application of these alloys for
one-time/high stroke or cyclic/low stroke low temperature applications. In general, the
deformation mechanisms in NiTiFe alloys involve inelastic modes such as detwinning (and/or
martensite reorientation) and stress induced transformation, apart from the elastic and plastic
deformations [3, 49-51]. A number of recent studies [52, 53] investigated the interdependence of
the deformation modes available in the system, for instance the macroscopic elastic modulus of
the martensitic phases are influenced by the relative tendency of the aforementioned inelastic
47
deformation modes [53]. The presence of an intermediate R-phase further complicates an already
convoluted selection of deformation mechanisms in stress-temperature space. Extensive studies
[40, 49, 51, 52, 54-57] have been performed in understanding the deformation
sequence/mechanisms of the R-phase. It is presently understood that in the temperature range in
which the R-phase is stable, the deformation sequence involves elasticity,
detwinning/reorientation, stress induced B19' transformation and plasticity. While most of the
earlier studies focused on understanding the rationale behind the deformation and the preferred
sequence, no attempt was made to study exclusively the competition between the two inelastic
deformation modes available in the R-phase in the stress-temperature space and their
implications in designing and selecting the operational range of the alloys for low temperature
based actuation applications. The results from these studies along with the quantification of the
processing influence on the R-phase transformation from Chapter 3 enable in optimizing the R-
phase transformation in NiTiFe shape memory alloys for low temperature actuation applications.
The deformation studies in the present work were based on a recently established test
methodology in which micron sized NiTiFe wires fabricated by electrical discharge machining
(EDM) were used as test specimens. Electrical discharge machining is a technique used in the
fabrication of NiTi-based alloys for a variety of applications ranging from
biomedical/bioengineering to micro-system devices such as micro-actuators [58]. In general,
components fabricated by electrical discharge machining are subsequently subjected to
electropolishing so as to remove the surface damage associated with the machining process. The
mechanical behavior of the micron sized wires obtained from the aforementioned process are
comparable to more conventional bulk specimens. By investigating the phase dependent

48
deformation characteristics at varying temperatures such as stress induced transformations from
B2 to R and R to B19' and detwinning in the martensite phases, a stress-temperature phase
diagram is constructed. The stress-temperature map will serve as a guide in understanding the
interdependence of the available deformation modes in the ternary NiTiFe system and enable in
selecting the operational range of stress/temperature for different applications. Additionally,
stress induced transformations in the parent austenite phase were also investigated. By
quantifying stresses and strains and identifying the temperatures associated with various
deformation mechanisms in NiTiFe alloys, this work has practical implications for using NiTiFe
alloys in applications that require low-temperature, low-hysteresis actuators with superior fatigue
behavior.
4.2 Experimental Procedure
A Ni46.8Ti50Fe3.2 billet (nominal composition), fabricated by vacuum-induction-melting and
vacuum-arc-remelting, was procured from Special Metals, NY. Rectangular strips 13 mm x 60
mm were cut from the billet by wire electrical discharge machining (EDM). The influence of
thermo-mechanical treatments on Ni46.8Ti50Fe3.2 were studied by cold working the strips by 20%,
30%, 50% and 60%. The 20% and 30% cold worked samples underwent a one-step annealing at
873 K for 30 minutes. The 50% and 60% cold worked samples were subjected to intermediate
annealing at 673 K for 30 minutes to remove strain hardening to facilitate cold working and were
subsequently annealed at 873 K for 30 minutes. Previous work established a testing methodology
in which results from wires having micron sized cross-sectional area were compared to
conventional bulk specimens. In the present work, micron sized wires of rectangular cross
section of approximately 130 x 125 microns and a gauge length of 20 mm were obtained from
49
the 30% cold worked sample by wire electrical discharge machining. Electrical discharge
machining was carried at an operating voltage of 50 V and a working current of 2.5 A. A 100 μm
diameter brass wire was used as the electrode at room temperature with de-ionized water as the
dielectric fluid. The post-EDM wires were chemically etched using a mixture of 120 mL H2O, 15
mL HCl, 15g Na2SO3 and 2g NH4HF2. Subsequently the chemically etched wires were
electropolished in a 3 mol·dm-3
methanolic sulfuric acid electrolyte [15] held at 297 K in an
ESMA model E1085-1S electropolisher. The electropolished samples were subjected to
mechanical testing in a Perkin Elmer Diamond dynamic mechanical analyzer (DMA). The
calibration process included the stress-strain response of stainless steel wire and the coefficient
of thermal expansion (CTE) response of stainless steel wire through a temperature range that
covered the range where the NiTiFe wires were to be tested. The temperature calibration was
based on the glass transition temperature of a poly-methyl methacrylate (PMMA). Differential
scanning calorimetry at a rate of 20 Ks-1
under nitrogen cover gas was used to determine the start
and finish of the R-phase from austenite and the corresponding reverse transformation to
austenite from the R-phase. These temperatures were determined to be 234 K, 219 K, 224 K and
240 K ± 2K, respectively. The transformation of R-phase to B19' martensite was not seen till
temperatures as low as 120 K. Monotonic tensile tests and load-bias experiments were performed
on Ni46.8Ti50Fe3.2 wires with 20 mm as the gauge length and rectangular cross-sections, with
averaged dimensions of 95 (±2 μm) x 90 (±2 μm). The tests were carried in the load control
mode with a loading rate of 150 mN/minute. The thermal scanning for the load-bias tests were
carried at a rate of 5 K min-1
. The B2 to R stress induced phase transformation was studied

50
between 234 K and 240 K at intervals of 2 K, while the stress induced R to B19' phase
transformation was studied between 110 K and 160 K at intervals of 10 K.
4.3 Results and Discussion
An alloy of nominal composition Ni46.8Ti50Fe3.2 was used in the present study due to the stability
of the R-phase over a wide temperature range. Figure 18a shows the differential scanning
calorimetry analysis from Ni46.8Ti50Fe3.2 alloy that was cold worked by 30% and subsequently
annealed at 873 K for 30 minutes The start and finish temperatures of the austenite and the R-
phase are represented as As, Af, Rs and Rf respectively. The hysteresis of the R-phase
transformation measured from the calorimetric response is around 4 K and the R to B19' phase
transformation was not seen till temperatures as low as 120 K. A comparison of the start and
finish of the transformation temperatures in the R and austenite phases of Ni46.8Ti50Fe3.2
subjected to varying degrees of cold working is shown in Figure 18b. The results do not signify
any appreciable shift in the transformation temperature of the R-phase implying dislocation
density does not play a major role above certain saturation levels. The 30% cold worked sample
was selected to provide representative insights of the deformation mechanisms in thermo-
mechanically treated NiTiFe alloys. To avoid complexities arising from intermediate annealing,
the 50% and the 60% cold worked samples were not used. Figure 19 represents the
microstructures of the sample after cold working by 30% followed by annealing at 873 K for 30
minutes. Figure 19a representing the bright field micrograph of the cold worked specimen shows
a high density of dislocations and the inset in Figure 19a shows a diffraction pattern with
streaked spots indicating the presence of dense dislocations.
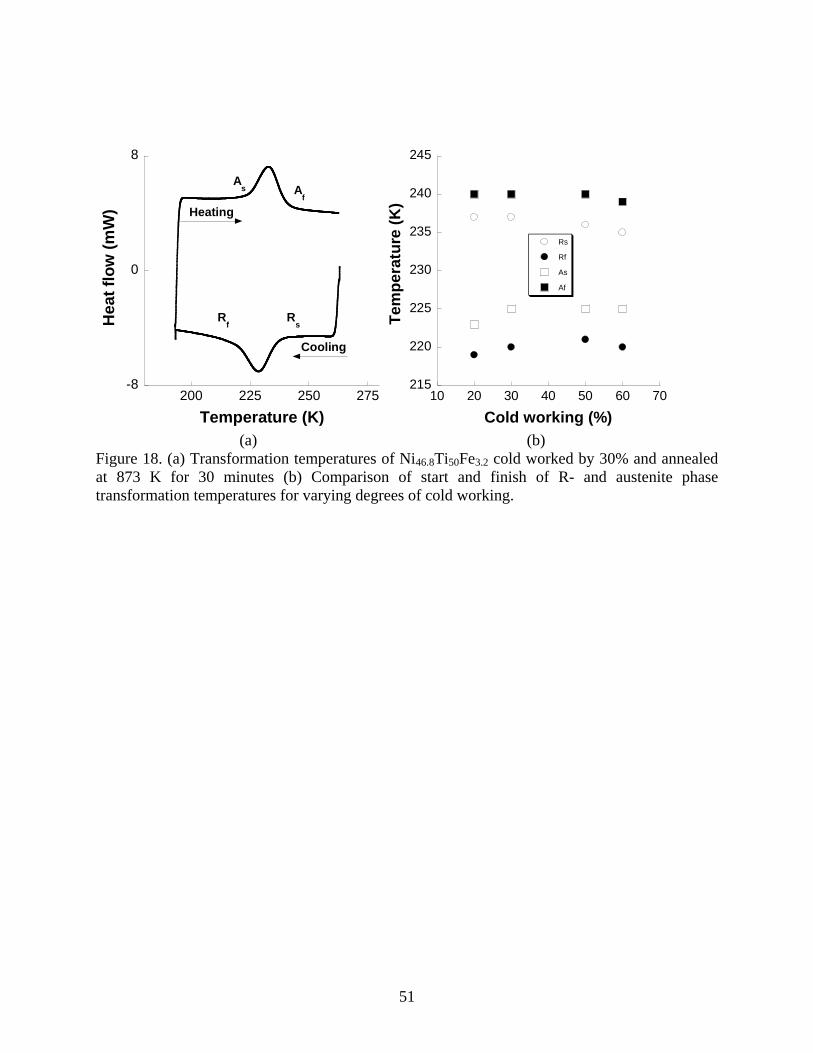
51
-8
0
8
200 225 250 275
Heat
flo
w (
mW
)
Temperature (K)
Heating
Cooling
As A
f
Rs
Rf
215
220
225
230
235
240
245
10 20 30 40 50 60 70
Rs
Rf
As
Af
Te
mp
era
ture
(K
)
Cold working (%)
(a) (b)
Figure 18. (a) Transformation temperatures of Ni46.8Ti50Fe3.2 cold worked by 30% and annealed
at 873 K for 30 minutes (b) Comparison of start and finish of R- and austenite phase
transformation temperatures for varying degrees of cold working.

52
Figure 19. Bright field micrograph of the Ni46.8Ti50Fe3.2 sample (a) cold worked by 30% and (b)
annealed at 873 K for 30 minutes after cold working. The streaks in the diffraction spots in the
inset in (a) confirm the dense distribution of dislocations. The annealed sample has a relatively
lower dislocation density.
(a) (b)
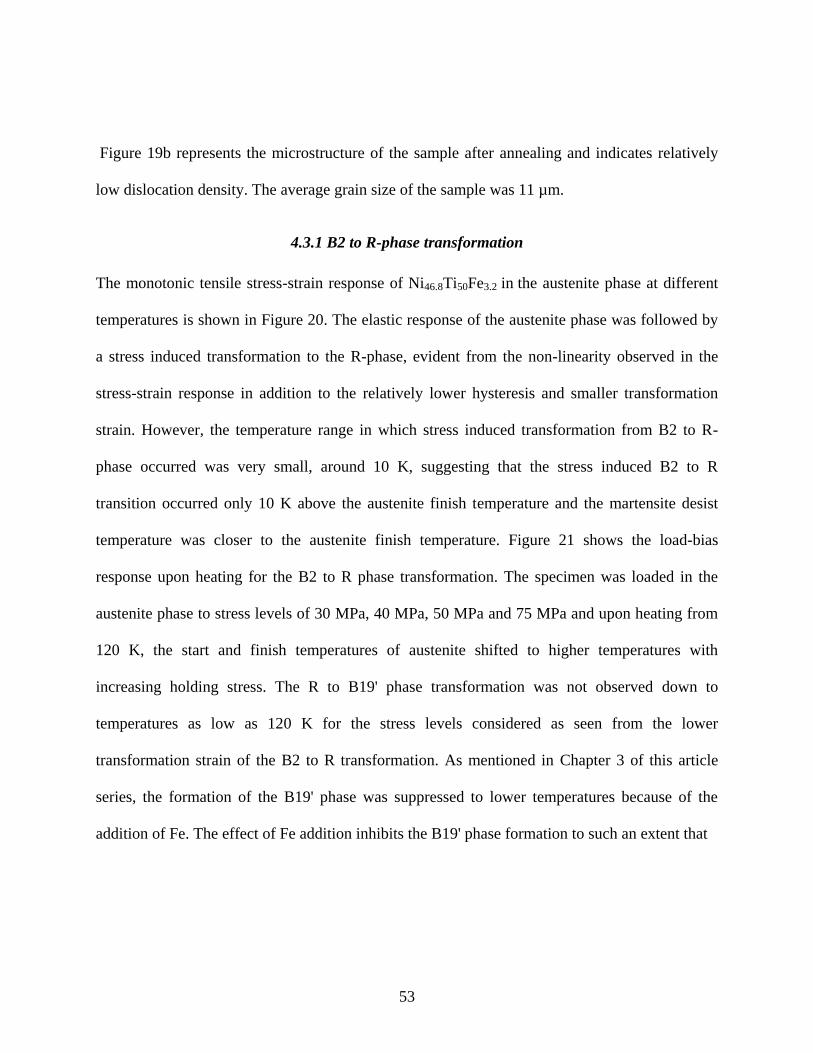
53
Figure 19b represents the microstructure of the sample after annealing and indicates relatively
low dislocation density. The average grain size of the sample was 11 µm.
4.3.1 B2 to R-phase transformation
The monotonic tensile stress-strain response of Ni46.8Ti50Fe3.2 in the austenite phase at different
temperatures is shown in Figure 20. The elastic response of the austenite phase was followed by
a stress induced transformation to the R-phase, evident from the non-linearity observed in the
stress-strain response in addition to the relatively lower hysteresis and smaller transformation
strain. However, the temperature range in which stress induced transformation from B2 to R-
phase occurred was very small, around 10 K, suggesting that the stress induced B2 to R
transition occurred only 10 K above the austenite finish temperature and the martensite desist
temperature was closer to the austenite finish temperature. Figure 21 shows the load-bias
response upon heating for the B2 to R phase transformation. The specimen was loaded in the
austenite phase to stress levels of 30 MPa, 40 MPa, 50 MPa and 75 MPa and upon heating from
120 K, the start and finish temperatures of austenite shifted to higher temperatures with
increasing holding stress. The R to B19' phase transformation was not observed down to
temperatures as low as 120 K for the stress levels considered as seen from the lower
transformation strain of the B2 to R transformation. As mentioned in Chapter 3 of this article
series, the formation of the B19' phase was suppressed to lower temperatures because of the
addition of Fe. The effect of Fe addition inhibits the B19' phase formation to such an extent that
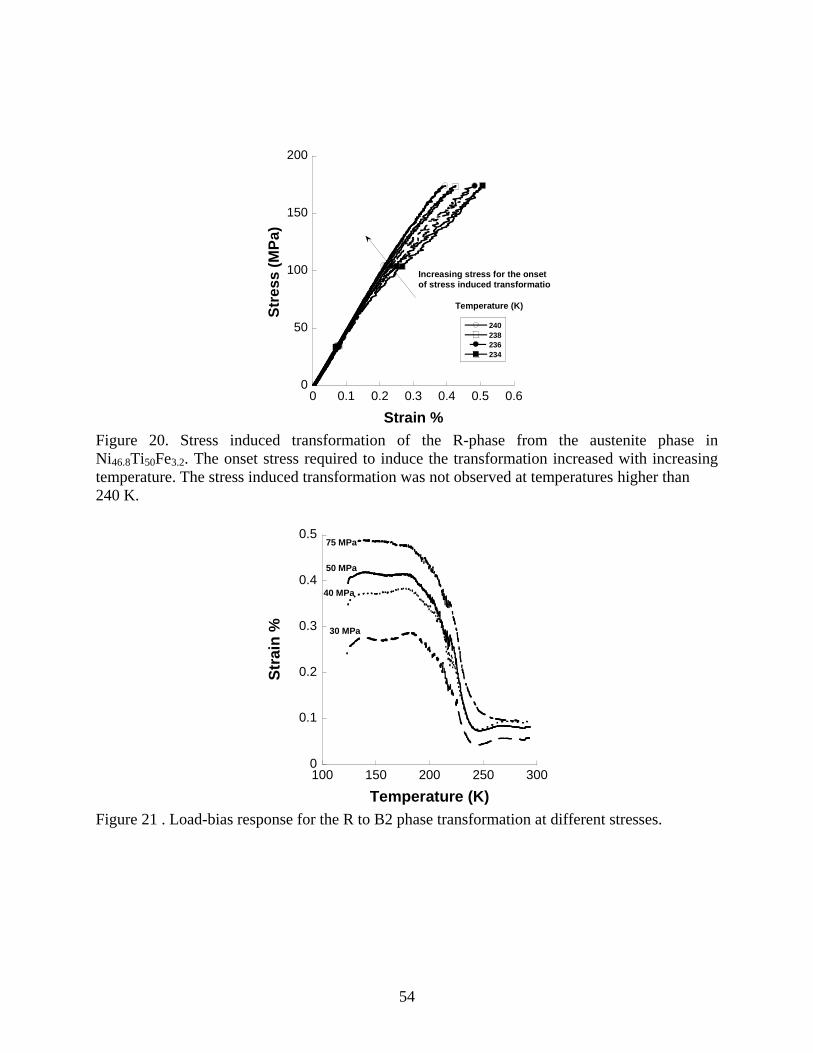
54
0
50
100
150
200
0 0.1 0.2 0.3 0.4 0.5 0.6
240
238
236
234
Str
es
s (
MP
a)
Strain %
Temperature (K)
Increasing stress for the onset
of stress induced transformation
Figure 20. Stress induced transformation of the R-phase from the austenite phase in
Ni46.8Ti50Fe3.2. The onset stress required to induce the transformation increased with increasing
temperature. The stress induced transformation was not observed at temperatures higher than
240 K.
0
0.1
0.2
0.3
0.4
0.5
100 150 200 250 300
Str
ain
%
Temperature (K)
30 MPa
40 MPa
50 MPa
75 MPa
Figure 21 . Load-bias response for the R to B2 phase transformation at different stresses.

55
the R to B19' phase transformation did not occur with in the test range considered here. The
effect of stress and temperature on the thermo-elastic martensitic phase transformation in shape
memory alloys were analyzed within the thermodynamic framework of the Clausius-Clapeyron
relation [59]. The stress-temperature equivalence based on the aforementioned relation is
expressed as
tt T
HS
dT
d
0
(i)
where is the density of the shape memory alloy (g/cc), H and S are the changes in the
enthalpy and entropy associated with the phase transformation, 0T is the equilibrium temperature
of the transformation (K) and t is the transformation strain along the direction of uniaxial
stress.
The onset stress for the B2 to R stress induced phase transformation increased with increasing
temperature. In a similar manner, the transformation temperatures also increased with increasing
holding stress in the load-bias experiments. The transformation temperatures were measured by a
tangent intersection method in which tangents were drawn to the curve along the initial heating
region, the transformation temperature range and the region that followed the completion of the
transformation to the austenite phase. The intersection of the tangents between the first two
regions gave the As temperature while the intersection between the later two regions gave the Af
temperature. These observations are in agreement with the stress-temperature equivalence given
by equation (i). The equivalence between stress and temperature for the isothermal and isobaric
conditions is shown in Figure 22. Isothermal testing represents the case where the temperature
was held constant and the stress was increased progressively and isobaric testing refers to the
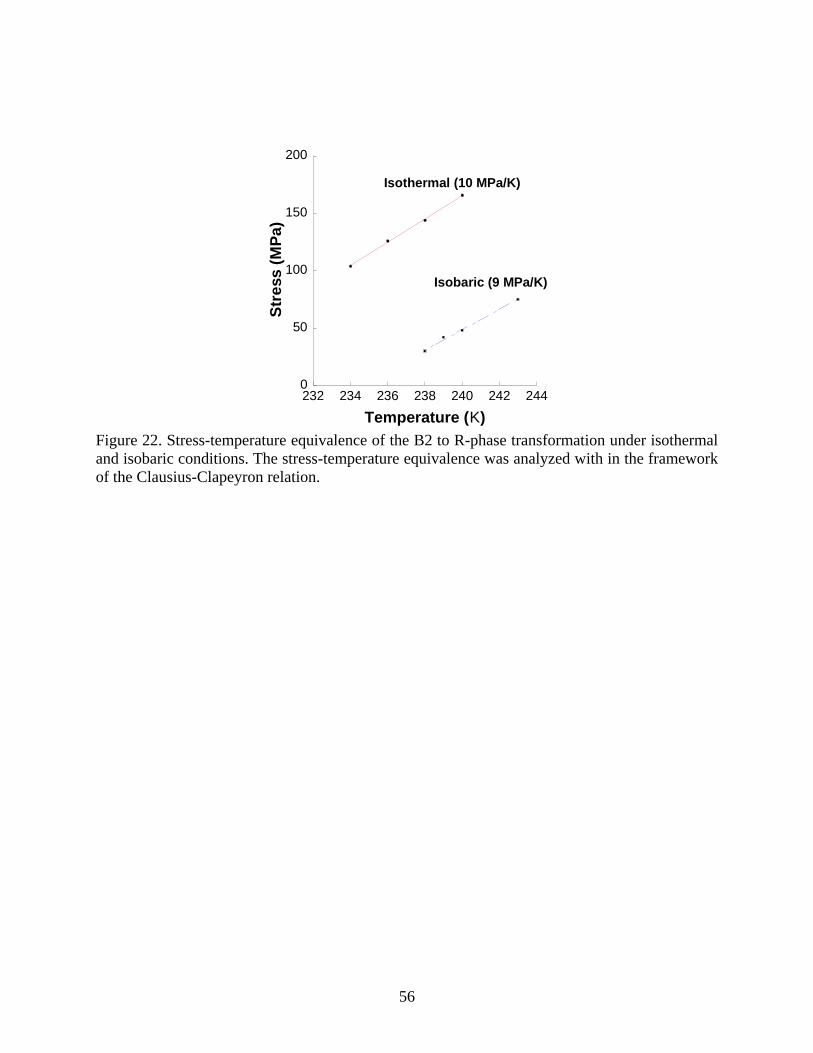
56
0
50
100
150
200
232 234 236 238 240 242 244
Str
ess
(M
Pa
)
Temperature (K)
Isothermal (10 MPa/K)
Isobaric (9 MPa/K)
Figure 22. Stress-temperature equivalence of the B2 to R-phase transformation under isothermal
and isobaric conditions. The stress-temperature equivalence was analyzed with in the framework
of the Clausius-Clapeyron relation.
57
condition where the stress was held constant and the sample was thermally cycled. The slope of
the stress-temperature equivalence for the isobaric and isothermal transformation from the plot in
Figure 22 was 9 MPa K-1
and 10 MPa K-1
respectively. These values are slightly lower than the
previously reported value of 16 MPa K-1
[55] and the difference can be attributed to the influence
of composition and processing.
4.3.2 Detwinning/reorientation of R-phase
The mechanical response of the R-phase below the R-phase finish (Rf) temperatures, shown in
Figure 23a, represents detwinning of the R-phase. The thermally induced transformation from B2
to R results in the self accommodation of the R-phase [60]. In the polycrystalline alloy
considered in this study the self accommodation is brought about by the formation of multiple
variants. Under the influence of applied stress, the most favorably oriented variant(s) grow(s) at
the expense of others. The remnant strain upon unloading is due to the presence of thermally
stabilized R-phase as the tests were conducted at temperatures below Rf. This remnant strain was
recovered on heating the sample to temperatures above austenite finish (Af). The onset stress for
detwinning increased with decreasing temperature [54]. The energy barrier required to overcome
the twin movement associated with the R-phase variant re-orientation increased with decreasing
temperature. This is due to the fact that thermal energy facilitates twin movement at higher
temperature and as a result reduces the stress required for re-orientation [61]; thereby implying
detwinning is not a thermodynamically favorable deformation mechanism at lower temperatures.
After accommodating the maximum possible strain by the twin re-orientation process, the R-
phase undergoes a stress induced transformation to B19' martensite and accommodates more
strain thereby reducing the strain energy in the system. On further cooling the sample to lower
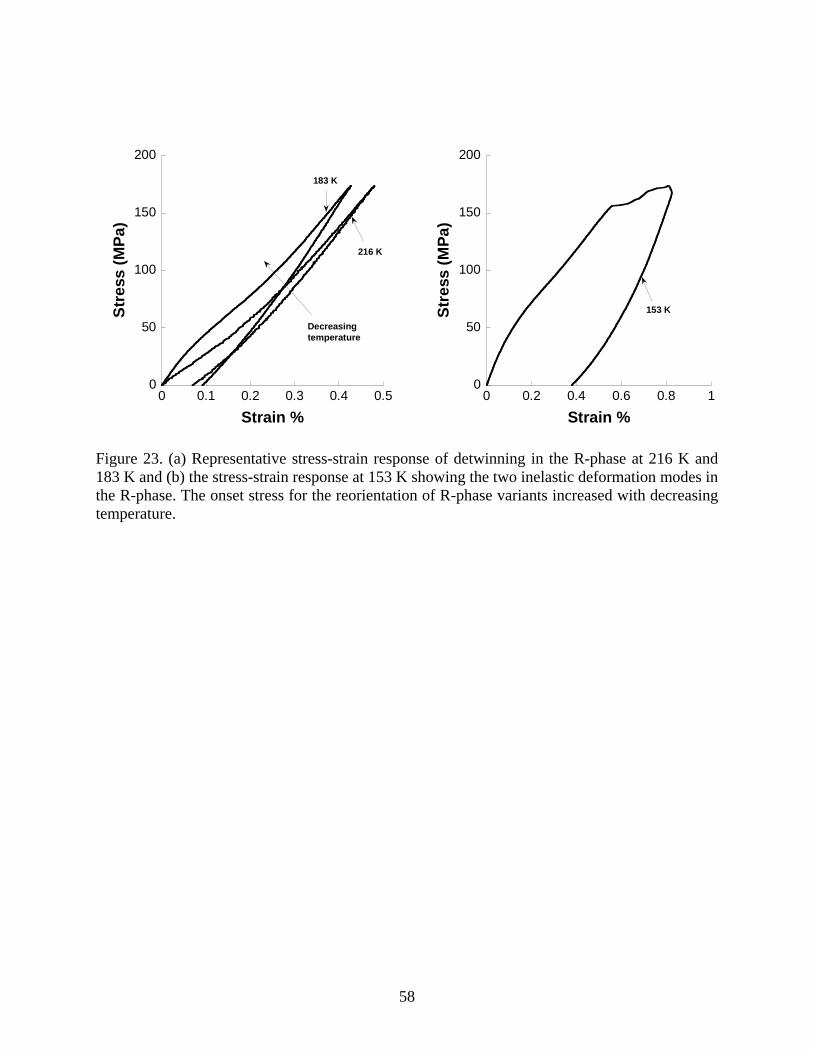
58
0
50
100
150
200
0 0.1 0.2 0.3 0.4 0.5
Decreasing
temperature
216 K
183 K
Str
ess
(M
Pa
)
Strain %
0
50
100
150
200
0 0.2 0.4 0.6 0.8 1
Str
ess
(M
Pa
)
Strain %
153 K
Figure 23. (a) Representative stress-strain response of detwinning in the R-phase at 216 K and
183 K and (b) the stress-strain response at 153 K showing the two inelastic deformation modes in
the R-phase. The onset stress for the reorientation of R-phase variants increased with decreasing
temperature.

59
temperatures, two inelastic deformation modes involving (i) detwinning of the R-phase and (ii)
the stress induced R to B19' phase transformation were observed. Figure 23b shows the specimen
undergoing variant re-orientation in the R-phase followed by the stress induced R to B19' phase
transformation.
4.3.3 Detwinning of the R-phase and Stress Induced R-phase to B19' phase transformation
Figure 24a shows the stress-strain behavior of the alloy at temperatures below 153 K. In all the
cases shown, the starting phase in the unstressed condition is the R-phase. The stress-strain
response shown in Figure 24a indicate that the propensity of the R-phase to detwin reduced with
decreasing temperature and at very low temperatures the R-phase underwent a direct stress
induced transformation to the B19' phase. As the sample is cooled the onset stress for detwinning
increased and at very low temperatures, the stress required for detwinning of the R-phase
matched the stress required to induce the R to B19' phase transformation. Beyond a certain
temperature, the onset stress for detwinning will exceed the stress required to induce the R to
B19' phase transformation and hence the specimen will undergo a direct stress induced phase
transformation at very low temperatures. More details on the crystallography associated with the
R to B19' phase transformation can be found in [62]. Residual strain is observed upon unloading
the stress induced martensite because the test temperature is below the finish temperatures of
austenite and the R-phase. The residual strain can be recovered by heating the specimen to
temperatures above austenite finish (Af). The recoverable strain upon heating the specimen is
shown in Figure 24b. At very low temperatures due to the high stress required for the detwinning
of R-phase relative to the stress induced phase transition, the strain energy reduction with
increasing stress occurs by the specimen undergoing a direct stress induced transformation to the
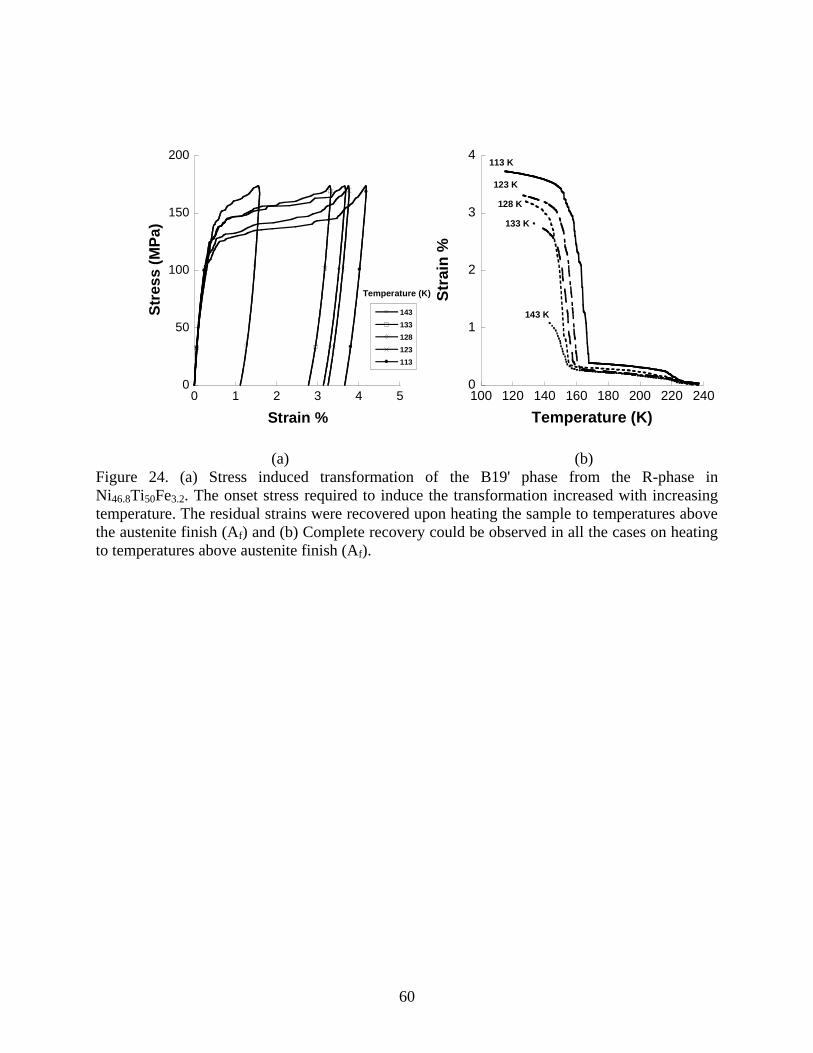
60
0
50
100
150
200
0 1 2 3 4 5
143
133
128
123
113
Str
es
s (
MP
a)
Strain %
Temperature (K)
0
1
2
3
4
100 120 140 160 180 200 220 240
Str
ain
%
Temperature (K)
113 K
123 K
128 K
133 K
143 K
(a) (b)
Figure 24. (a) Stress induced transformation of the B19' phase from the R-phase in
Ni46.8Ti50Fe3.2. The onset stress required to induce the transformation increased with increasing
temperature. The residual strains were recovered upon heating the sample to temperatures above
the austenite finish (Af) and (b) Complete recovery could be observed in all the cases on heating
to temperatures above austenite finish (Af).
61
B19' phase. Thus with decreasing temperatures, the R-phase undergoes a direct stress induced R-
B19' phase transformation. While the above tests were carried out isothermally, isobaric tests
were also performed to understand the R-B19' phase transformation. The formation of B19'
phase under isobaric conditions could only be realized after loading the sample in the R-phase.
The sample was loaded to stresses of 160 MPa, 170 MPa, 180 MPa and 190 MPa in the R-phase
at 216 K. The stress-strain response of the R-phase shows no stress induced transformation when
subjected to stresses as high as 190 MPa at 216 K. Upon heating the phase transformation from
B19' to R-phase was observed. Figure 25 shows the shift in the transformation temperatures of
the reverse B19' martensite to R phase transition with increasing stress. A comparison of the
stress-temperature equivalence of the R-B19' phase transformation analyzed within the
framework of the Clausius-Clapeyron relation, given in eq. (i), for the isobaric and isothermal
conditions is shown in Figure 26. The stress-temperature plot validates the direct proportionality
that exists between the two variables. The slope of the stress-temperature equivalence for the
stress induced R to B19' phase transformation corresponding to the isothermal condition was 1
MPa K-1
. The slope corresponding to the isobaric condition was 3 MPa K-1
. The low value
obtained from the slope of the stress-temperature equivalence for the isothermal condition is due
to the influence of detwinning of the R-phase. The value corresponding to the isobaric condition
is more in agreement with previously reported values of around 3-5 MPa K-1
[54, 55]. The B2-R
slope in the stress-temperature equivalence is steeper than that of the R-B19' phase
transformation. This is a direct consequence of the transformation strain associated with the
individual phase transformations (lower the transformation strain, higher the slope) [33].

62
0
0.5
1
1.5
2
2.5
3
100 120 140 160 180 200 220 240
Str
es
s (
MP
a)
Temperature (K)
160 MPa
170 MPa
180 MPa
190 MPa
Figure 25. Load-bias response for the B19' to B2 phase transformation at different stress levels.
The transformation temperatures of the forward transformation increases with increasing stress.
140
150
160
170
180
190
200
100 120 140 160 180 200
Str
es
s (
MP
a)
Temperature (K)
Isothermal 1 MPa/K
Isobaric 3 MPa/K
Figure 26. Stress-temperature equivalence of the R-phase to B19' stress induced transformation.
The stress-temperature equivalence was analyzed with in the framework of the Clausius-
Clapeyron relation. The lower value of the slope is a consequence of the large strain
accommodated in this transformation and also due to the influence of detwinning of the R-phase
at higher temperatures.
63
A summary of the phase dependent elastic and inelastic deformation mechanisms
associated with the mechanical response of a Ni46.8Ti50Fe3.2 is shown in Figure 27. The stress-
strain response at 243 K shows the elastic response of austenite. As the sample is cooled to lower
temperatures, stress induced R-phase transformation from austenite sets in. When the starting
phase is the R-phase the elastic response is followed by the reorientation of the R-phase variants
and as the test temperature reaches 143 K the variant reorientation in the R-phase is followed by
the stress induced R to B19' phase transformation. At further lower temperatures the propensity
of the R-phase to detwin decreases and a competition sets in between the detwinning of the R-
phase and the stress induced R to B19' phase transformation. Based on the above results a
deformation mechanism map, shown in Figure 28, in the stress-temperature space for
Ni46.8Ti50Fe3.2 shape memory alloy is constructed. The austenite phase undergoes stress induced
transformations at temperatures slightly above the R-phase start (Rs) but the temperature range of
this transformation is very narrow. On comparing the slopes of the B2 to R and the R to B19'
stress induced phase transformation, the former is steeper than the later indicating that the B2 to
R phase transition is stable relative to the R to B19' transition. This implies that the B2 to R
phase transformation can be used in applications requiring cyclic low stroke actuation and the R
to B19' transformation could be used in one-time high stroke release mechanisms. Further,
regions in stress-temperature space are identified based on detwinning in the R-phase followed
by a stress-induced transformation to B19' martensite and a region where the onset of stress
induced transformation occurs without any prior detwinning.

64
Figure 27. Summary of the elastic and inelastic deformations in Ni46.8Ti50Fe3.2. The starting
phase for each case is indicated.
0
50
100
150
200
0 1 2 3 4 5 6
Str
ess
(M
Pa
)
Strain %
0
50
100
150
200
0 0.5 1 1.5 2 2.5
Str
es
s (
MP
a)
Strain %
0
50
100
150
200
0 0.1 0.2 0.3 0.4 0.5 0.6
Str
es
s (
MP
a)
Strain %
0
50
100
150
200
0 0.1 0.2 0.3 0.4 0.5 0.6 0.7
Str
es
s (
MP
a)
Strain %
0
50
100
150
200
0 0.1 0.2 0.3 0.4
Str
es
s (
MP
a)
Strain %
Elastic response of austenite at 243 K
Stress induced R-phase
to B19'at 113 K. Starting
phase: R-phase
Detwinning in R-phase
followed by stress induced
R-phase to B19'at 143 K
Starting phase: R-phase
Martensite reorientation and
detwinning in R-phase at 183 K
Starting phase: R-phase
Stress induced B2 to R-
phase at 234 K
Starting phase: austenite
Tem
pera
ture
(°C
)
0 °C
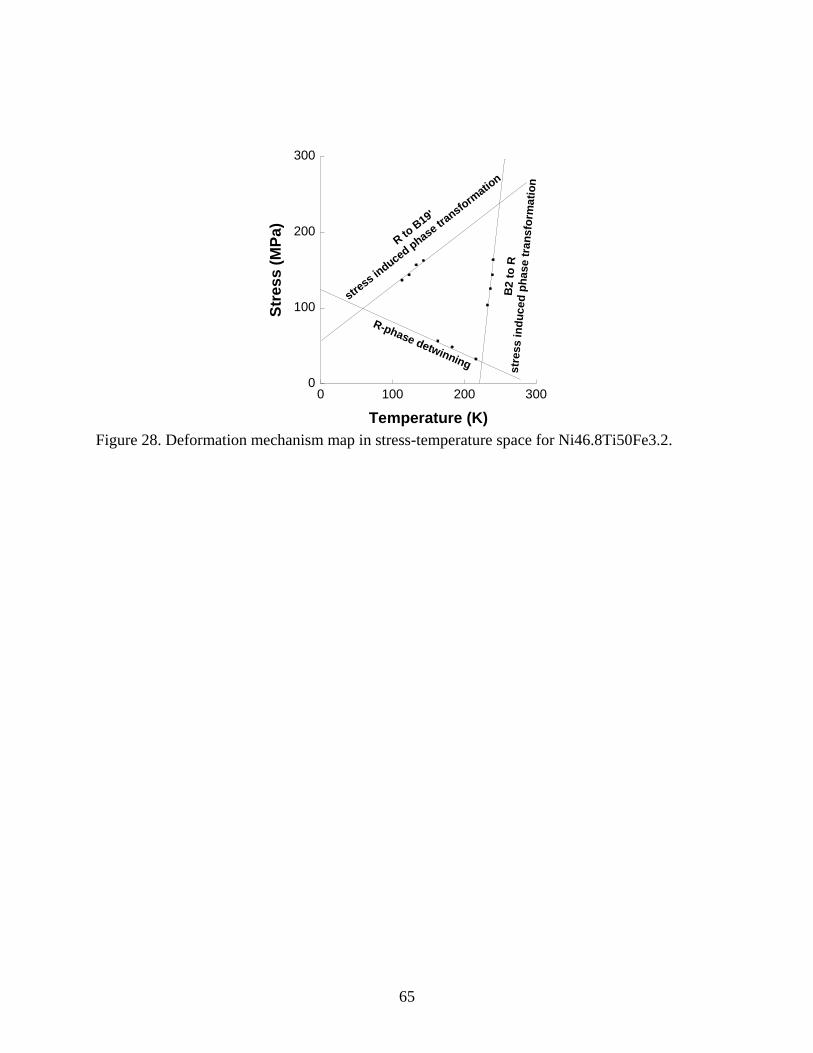
65
0
100
200
300
0 100 200 300
Str
es
s (
MP
a)
Temperature (K)
R to B
19'
stress in
duced phase tr
ansform
ation
B2 t
o R
str
ess in
du
ced
ph
ase t
ran
sfo
rmati
on
R-phase detwinning
Figure 28. Deformation mechanism map in stress-temperature space for Ni46.8Ti50Fe3.2.
66
4.4 Conclusions
The phase dependent deformation behavior in a Ni46.8Ti50Fe3.2 shape memory alloy,
summarized in Figure 27, has been studied in this work. In the austenite phase, above the R-
phase start temperature (Rs), the specimen undergoes a B2 to R stress induced phase
transformation. In the R-phase, slightly below the Rf temperature detwinning in the R-phase is
observed. Further, at very low temperatures below the R-phase finish (Rf), the propensity of the
R-phase to detwin decreases and the R-phase undergoes a direct stress induced transformation to
B19' martensite. The stress-temperature correlation for the stress induced B2 to R and R to B19'
phase transformations were established within the framework of the Clausius-Clapeyron
equivalence. Based on the above results, a stress-temperature phase diagram is constructed which
identifies the significant deformation mode in stress-temperature space. By quantifying stresses
and strains and identifying temperatures associated with various deformation mechanisms in
NiTiFe alloys, the stress-temperature map will provide an understanding of the interdependence
of the available deformation modes in the ternary NiTiFe system and enable in selecting the
operational range of stress/temperature for different low temperature applications that require
low-hysteresis and superior fatigue life. Further a comprehensive study of the compositional
influence on the R-phase transformation from Chapter 3 and the results obtained from the present
investigations on Ni46.8Ti50Fe3.2 in the stress-temperature domain will enable tailoring shape
memory alloys for low temperature actuation applications.

67
CHAPTER FIVE: SUPERELASTIC RESPONSE OF [111] AND [101] ORIENTED NiTi
MICRO-PILLARS
Micromechanical response of single crystal micron-scaled pillars of NiTi of known orientations
and macromechanical response from in situ neutron diffraction during loading of the same NiTi
but in bulk, polycrystalline form are compared, to understand the stress-induced transformation
associated with superelasticity at reduced length scales.
5.1 Introduction
Near equi-atomic NiTi can exhibit a stress-induced or temperature-induced, reversible,
thermoelastic, martensitic phase transformation between a cubic B2, so called austenite phase
and a monoclinic B19', so called martensite phase. The shape memory effect associated with the
thermally induced phase transformation results in shape changes occurring against external
stresses upon heating, while superelasticity, associated with the stress induced transformation,
accommodates large deformation that is mechanically reversible [1]. Existing NiTi based
microdevices have employed the shape memory effect for small scale actuation [63, 64], while
the use of superelasticity has remained limited even though nano- and micro-, structures and
devices can utilize the large reversible strain accommodation and energy absorption attributes of
the effect. A possible reason for the limited application is the lack of a clear understanding of
superelasticity at these reduced length scales that would enable their incorporation into new
fields of use and more importantly, the lack of consistency in the results reported. For example,
while the loss of superelasticity along with an orientation independent critical stress for inducing

68
the phase transformation was reported in some experimental studies [4, 65], others report no such
loss of superelasticity [6]. Thus, the need for unambiguously establishing the mechanical
behavior of these alloys at the length scales considered is two-fold – first, to enhance our
fundamental understanding of superelasticity in order to extend the range of applications that
specifically use the stress-induced transformation at reduced length scales and second, to
enhance our fundamental understanding of martensitic transformations at reduced length scales.
While previous studies have used nanoindentation [5, 53, 66], nano- and micro-compression [4-
6, 65, 66] to investigate these alloys, there has been no effort to completely characterize the
micromechanical response of superelastic NiTi at the reduced length scales investigated.
Furthermore, there has been no emphasis placed on comparing the behavior of isolated micron-
sized single crystals with their behavior when consolidated in bulk polycrystalline form, where
the individual grain is constrained by surrounding material. By recourse to careful micro-
compression experiments and in situ neutron diffraction during loading at a spallation neutron
source, we report here on work that addresses the aforementioned shortcomings.
A previously developed test methodology in which pillars were subjected to uniaxial
compression at the micron/sub-micron scale [67] has been employed here to mechanically
characterize single crystal superelastic NiTi micron-scale pillars of known orientations. A
uniaxial stress state acting on the sample of known geometry helps in a simplified conversion of
the measured load-displacement response from an instrumented nanoindenter to the stress-strain
response of the sample. In situ neutron diffraction studies during loading have previously been
used to study the texture, strain and phase fraction evolution in bulk polycrystalline NiTi [53, 68-
70]. When compared to (low energy) X-rays, the increased penetration of neutrons is more

69
representative of bulk polycrystalline behavior and is typically free of surface effects. The
technique is used here to acquire diffraction spectra associated with a polychromatic neutron
beam with fixed detectors at a spallation neutron source from bulk polycrystalline NiTi. Such
spectra is analyzed to obtain information from grains of a specific orientation relative to the
loading direction and corresponds to atomic scale measurements of individual grains randomly
distributed in a polycrystalline matrix (when the sample has no strong starting texture). The
objective of this communication is to thus use a combination of micro-compression experiments
on single crystal micron-scaled pillars of NiTi of known orientations and in situ neutron
diffraction during loading of the same NiTi but in bulk, polycrystalline form, to understand the
stress-induced transformation associated with superelasticity at reduced length scales.
5.2 Experimental Procedure
The NiTi (nominal composition 55.94 wt.% Ni) alloy used in this study was fabricated using
vacuum induction melting and vacuum arc re-melting. The alloy was first solutionized at 1273 K
for 1 hour, oil quenched, and then aged at 673 K for 1 hour followed by an ice water quench. The
martensite start, martensite finish, austenite start and austenite finish temperatures were 243 K,
213 K, 272 K and 283 K, respectively. Large (70 µm) grains in the sample (average grain size
approx. 30 µm) with [101] and [111] orientations in the parent austenitic state were identified
using electron back scattered diffraction (EBSD). Cylindrical micro pillars were fabricated using
an FEI 200 TEM Focused Ion Beam (FIB) instrument. The [101] oriented pillar was 12.6 µm in
diameter and 26.4 µm in height and the [111] oriented pillar was 9.4 µm in diameter and 31.4
µm in height. The micro-compression studies were performed using an instrumented Hysitron
Triboindenter at the Center for Integrated Nanotechnologies (CINT) at Los Alamos National
70
Laboratory (LANL). A review of the factors influencing micro-compression studies is available
[71, 72] and was appropriately considered. The uniaxial compression studies on the pillars were
carried out in displacement control at a constant displacement rate between 13 and 17 nm s-1
.
This corresponds to an initial strain rate of 5 x 10⁻⁴
s-1
. A 30 µm diameter flat diamond punch
was used as the compression platen. The pillars were mechanically cycled (10 load-unload cycles
with each cycle going to higher loads up to the loads reported in this work) to homogenize and
remove any instabilities associated with the transformation while ensuring that the
nonrecoverable strain was minimal [73]. Additionally, cylindrical compressive specimens (6.35
mm in diameter and 19.05 mm in gauge length) with threaded ends were fabricated by electrical
discharge and conventional machining. In situ neutron diffraction measurements were performed
in “time-of-flight” mode on the Spectrometer for MAterials Research at Temperature and Stress
(SMARTS) at Los Alamos National Laboratory (LANL). SMARTS, a third generation neutron
diffractometer, using a pulsed polychromatic neutron source, has two banks of detectors
positioned opposite to each other. The loading axis of the sample formed an angle of 45° with
the incident neutron beams, allowing measurements of the spacing of lattice planes in directions
both along and normal to the loading axis of the sample. Additional information on the
diffraction setup can be found elsewhere [74]. A total of 51 load-unload compressive cycles were
completed at ambient temperature, each between 0% to -4.0% in strain, with neutron spectra
obtained at various strain levels during selected cycles. For intermediate cycles where no neutron
data were collected, the crosshead displacement rate was 6 mm min-1
, while for neutron
diffraction cycles, it was 0.2 mm min-1
. Optical microscopy showed an average grain size of 30

71
m, which ensured that there were a sufficiently large number of grains in the gauge and
diffracting volumes for measurements representative of bulk polycrystalline behavior.
5.3 Results and Discussion
A representative [101] oriented pillar used in this study is shown in Figure 29a and the same
pillar, following plastic deformation, is shown in Figure 29b. Figure 29a is appropriately
magnified to show regions around the pillar that have been removed in order to apply large
compressive strains to the pillar without the nanoindenter tip making contact with the material
surrounding the pillar. Figure 29b, on the other hand, is appropriately magnified to show the
absence of buckling, brooming or otherwise local deformation [67, 75] in the pillar following
plastic deformation and is indicative of the uniaxiality of the stress applied by the nanoindenter
tip. Furthermore, slip lines as well as surface relief lines from retained or stabilized martensite
are also evident in the deformed pillar in Figure 29b. The stress-strain response of the [111]
oriented pillar is shown in Figure 30a and Figure 30b while the stress-strain response of the [101]
oriented pillar is shown in Figure 30c. Figure 30a and Figure 30b represent different maximum
loads to which the [111] oriented pillar was loaded up to and unloaded and are separated here for
clarity. Figure 30a is more representative of stress-strain responses previously reported in the
literature [6] and does not represent a complete transformation of austenite to martensite during
loading as observed in the stress-strain response corresponding to higher applied loads in Figure
30b. Similar to previously reported behavior in superelastic NiTi [70], while some irrecoverable
strain remained upon unloading in the initial cycles, it was absent in the subsequent stress-strain
responses reported here.

72
Figure 29. [101] oriented austenite NiTi pillar (a) before and (b) after deformation. The
magnifcations are appropriately selected to show adequate clearance for the nanoindenter tip in
(a) and slip lines associated with plasticity and surface relief lines associated with stabilized
martensite in (b).
(a)
(b)
5 µm

73
0
100
200
300
400
500
600
0 0.5 1 1.5 2 2.5
Str
ess
(M
Pa
)
Strain %
[111]
0
500
1000
1500
0 1 2 3 4 5 6 7
Str
ess
(M
Pa
)
Strain %
[111]
0
100
200
300
400
500
600
700
0 1 2 3 4 5
Str
ess
(M
Pa
)
Strain %
[101]
Figure 30. Micro-compression stress-strain response of (a) [111] oriented NiTi pillar mechanical
cycled to 570 MPa, (b) 1480 MPa and (c) [101] oriented NiTi pillar.
(a) (b)
(c)
74
In order to compensate for potential compliance issues associated with the nanoindenter tip
making initial contact with the top of the pillar, we do not report individual moduli for the two
orientations but report their ratios. The ratio of the elastic moduli in the [111] and [101]
directions from Figure 30b and Figure 30c is 1.20. The plane specific elastic modulus [76], using
single crystal stiffness constants C11 = 162 GPa, C12 = 129 GPa and C44 = 35 GPa, [77] was 97
GPa in the [111] direction and 77 GPa in the [101] direction. Alternatively, the plane specific
elastic modulus using single crystal stiffness constants C11 = 137 GPa, C12 = 103 GPa and C44 =
34 GPa, [78] was 95 GPa in the [111] direction and 78 GPa in the [101] direction. Thus the ratios
of the moduli are 1.25 and 1.21, respectively, and agree well with the value of 1.20 determined in
this work.
The stress for inducing the martensite phase from austenite, σSIM, for the [111] oriented
pillar is determined to be 502 MPa using an arbitrarily selected 0.2% strain offset from the
austenite elastic response, while it is 206 MPa for the [101] oriented pillar. The 0.2% offset
method is adopted given the gradual transition of the stress-strain response from elastic to stress-
induced phase transformation behavior that is macroscopically similar to elastic to plastic
transitions in metallic alloys. The results from the micro-compression experiments indicate a
strong orientation dependence of the critical stress required for the onset of the phase
transformation as the [101] oriented pillar exhibits a lower σSIM when compared to the [111]
orientation. This difference in σSIM can be attributed to the preferential selection and formation of
martensite correspondent variant pairs (CVPs) along the individual orientations, [79] which are
additionally influenced by the distribution and size of the Ni4Ti3 precipitates which arise from
the aging treatment used in this work [80]. Previous experimental studies [80-82], have

75
established the [111] direction to be a hard orientation in compression for the austenite to
martensite phase transformation, implying a higher σSIM. This is observed despite the role of
Ni4Ti3 precipitates in assisting the phase transformation along the [111] orientation [83]. For the
[101] oriented pillar, this is not the case as no significant differences were observed in σSIM in
samples that were peak aged and over aged [79]. Furthermore, due to the presence of Ni4Ti3
precipitates, the [111] oriented pillar is expected to exhibit a sharper transition from elastic
deformation to the onset of the phase transformation when compared to the [101] orientation, as
observed in this work [84, 85]. While we note reasonable agreement between values for σSIM
between this work and others for the [101] oriented pillar [79] and for the [111] oriented pillar,
[80] and disagreement between this work and others [6] (which can be attributed to the lack of
precipitates given the absence of an aging treatment in the latter case), we urge caution in these
kinds of comparisons. This is due to the sensitivity of transformation temperatures to
stoichiometry and residual stresses which directly impacts the determination of σSIM across
samples with different processing histories given the Clausius-Clapyeron stress-temperature
equivalence [1] in martensitic phase transformations. The aforementioned discussion is
supported by neutron diffraction results presented in Figure 31, obtained from the same bulk
polycrystalline alloy. The texture evolution in the austenite phase during the phase
transformation is captured by comparing the relative intensities of (111) and (101) peaks with
increasing stress. These peaks correspond to two sets of diffracting grains, one oriented with
their [111] directions along the loading axis and the other oriented with their [101] directions
along the loading axis, in uniaxial compression. The spectra are normalized so that (111) peaks

76
1.71 1.72 1.73 1.74 1.75 1.76
- 230 MPa- 380 MPa- 440 MPa- 480 MPa
no
rma
lize
d i
nte
nsit
y
d-spacing (Å)
austenite (111)
2.08 2.09 2.1 2.11 2.12 2.13 2.14 2.15 2.16
- 230 MPa- 380 MPa- 440 MPa- 480 MPa
no
rma
lized
in
ten
sit
y
d-spacing (Å)
austenite (101)
Figure 31. Sections of neutron diffraction spectra at various stresses acquired from NiTi during
compression loading. The spectra shown here are from diffracting grains oriented with their
(111) and (101) plane normals parallel to the loading direction. The entire spectra were
normalized so that (111) peaks have the same peak intensity.

77
have the same maximum intensities at various stresses. Thus the reduction in intensity of the
(101) peaks with increasing stress implies a preferential transformation of [101] oriented grains
compared to [111] oriented grains for the same stress state. The diffracting intensity ratios for
these two grain orientations with stress (MPa) are 0.73 (at -230 MPa), 0.64 (at -380 MPa), 0.61
(at -440 MPa) and 0.55 (at -480 MPa) and is a direct measure of this preference when relative
changes are compared. This is consistent with σSIM being lower for [101] when compared to
[111] from the micro-compression results.
Adapting from literature, [86] and using a previously established convention for labeling
CVPs, [87] the transformation strains associated with austenite transforming to martensite as
well as martensite variant conversion strains along <111> and <101> (austenite basis) are
calculated and reported in Table 2.

78
Variant Transformation
Strain
<111>B2
Transformation
Strain
<101>B2
Variant
Conversion
Variant
Conversion
Strain
<111>B2
Variant
Conversion
Strain
<101>B2
1 -2.8 -3.9 3' → 1 -10.3 -11.1
1' -2.8 2.4 6' → 1 0 0
2 7.5 2.4 5' → 1' -10.3 0
2' -0.5 -3.9 4 → 1' 0 4.5
3 -0.5 7.2 6 → 2 10.3 0
3' 7.5 7.2 4 → 2 10.3 4.5
4 -2.8 -2.1 3 → 2' 0 -11.1
4' -2.8 -2.1 5 → 2' 0 0
5 -0.5 -3.9 5 → 3 0 11.1
5' 7.5 2.4 6' → 3' 10.3 11.1
6 -2.8 2.4 5' → 4 -10.3 -4.5
6' -2.8 -3.9 6 → 4' 0 -4.5
Table 2. Austenite to martensite transformation and martensite variant conversion strains
(%) calculated along <111> and <101> directions of the parent cubic, B2,
austenite phase.

79
The strains are calculated using a=3.0010 Å for austenite, and a = 2.8759 Å, b = 4.5515 Å, c =
4.1531 Å and = 94.91 for martensite, as determined from Rietveld refinement of neutron
spectra obtained in this work. The variant conversion strains are only shown for possible variant
conversions associated with )1(11 type I twinning. As done previously for other NiTi alloys,
[70, 87] analysis of neutron spectra acquired here is also indicative of martensite forming with a
)1(11 type I twinned structure. We particularly note the absence of any martensite
corresponding to a )1 1 (0.7205 type II twinned structure [70, 87] in our neutron spectra.
Recognizing that the neutron spectra are representative of grains under different stress states
arising from intergranular interactions, anisotropy and stress-strain compatibility, and still only
observing a )1(11 type I twinned martensitic structure in the spectra, we proceed in the
following to only consider possible variant conversions associated with )1(11 type I twinning in
our analyses of data from the NiTi pillars. The combinations are thus limited to conversions to
variants 1, 1', 2, 2', 3, 3', 4 and 4' as shown in Table 2. Since the strains reported in Table 2 use
the cubic austenite as their basis, compressive strains arising in a [111] oriented pillar would
favor conversion to variants 1, 1' and 4. While other variants can form and exist, the complete
transformation of austenite to martensite due to the high applied loads and the development of
strong texture, as observed from analyses of the neutron spectra, suggests that this is extremely
unlikely. From Table 2, we now consider the strains associated with austenite transforming to
martensite variants 1, 1' and 4 and note that all variants are associated with -2.9% strain. From
Figure 30a, the strain that can be attributed to phase transformation of the [111] oriented pillar is
-2.1% (as determined by again using a 0.2% strain offset from the elastic stress-strain responses

80
of austenite and martensite). The difference can be attributed to Ni4Ti3 precipitates that do not
generate recoverable strains as well as not accounting for the non-orthogonal angle of the
monoclinic martensite crystal in reporting strains with respect to a cubic basis. A similar
determination for the [101] oriented pillar results in conversion to variants 1, 2', 4 and 4' that
generate strains of -3.9%, -3.9%, -2.1% and -2.1%, respectively. The larger number of possible
variants for the [101] oriented pillar when compared to the [111] oriented pillar is consistent with
a larger hysteresis in the stress-strain response for the [101] oriented pillar since the hysteresis
typically arises from energy dissipative processes associated with increased interface area (in this
case variant boundaries) [88]. From Figure 30c, the strain that can be attributed to phase
transformation of the [101] oriented pillar is 0.9%. This is lower than the strains associated with
any of the martensite variants that can be expected to form and points to the existence of a
criterion for the compatibility of individual CVPs that involves analyses at a smaller scale,
perhaps involving habit plane variants [86]. The difference between the predicted strains and the
measured strains would necessarily imply that the martensite variants formed in the [101]
oriented pillars can still reorient with additional stress. This is indeed the case as evidenced by
larger differences between subsequent stress-strain cycles for the [101] oriented pillar when
compared to the [111] oriented pillar in Figure 30c and Figure 30b, respectively.
On examining the lattice correspondence between the austenite and martensite phases,
martensite variants 1, 1' and 4 that are expected to form during compression loading of the [111]
oriented pillar form with normals to the martensite (110) planes nearly (the deviation arises due
to the non-orthogonal monoclinic angle) aligned with the loading axis. The plane specific elastic
modulus, [76] using the single crystal stiffness constants determined from ab initio calculations
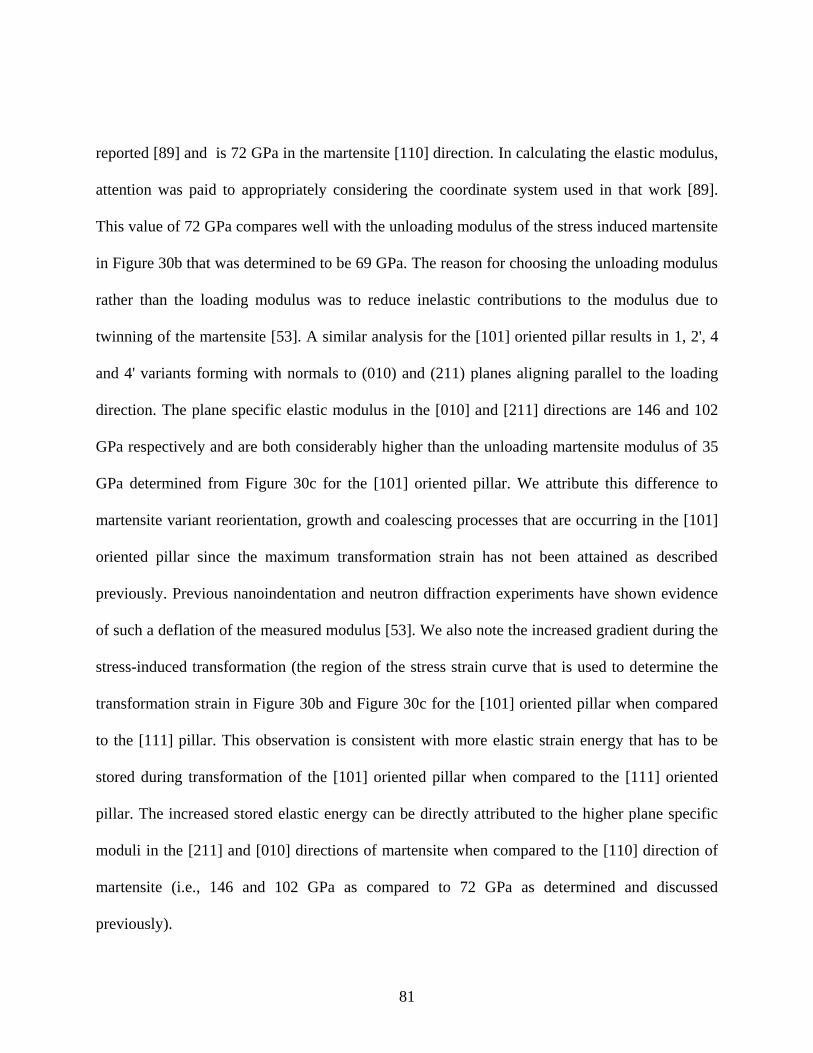
81
reported [89] and is 72 GPa in the martensite [110] direction. In calculating the elastic modulus,
attention was paid to appropriately considering the coordinate system used in that work [89].
This value of 72 GPa compares well with the unloading modulus of the stress induced martensite
in Figure 30b that was determined to be 69 GPa. The reason for choosing the unloading modulus
rather than the loading modulus was to reduce inelastic contributions to the modulus due to
twinning of the martensite [53]. A similar analysis for the [101] oriented pillar results in 1, 2', 4
and 4' variants forming with normals to (010) and (211) planes aligning parallel to the loading
direction. The plane specific elastic modulus in the [010] and [211] directions are 146 and 102
GPa respectively and are both considerably higher than the unloading martensite modulus of 35
GPa determined from Figure 30c for the [101] oriented pillar. We attribute this difference to
martensite variant reorientation, growth and coalescing processes that are occurring in the [101]
oriented pillar since the maximum transformation strain has not been attained as described
previously. Previous nanoindentation and neutron diffraction experiments have shown evidence
of such a deflation of the measured modulus [53]. We also note the increased gradient during the
stress-induced transformation (the region of the stress strain curve that is used to determine the
transformation strain in Figure 30b and Figure 30c for the [101] oriented pillar when compared
to the [111] pillar. This observation is consistent with more elastic strain energy that has to be
stored during transformation of the [101] oriented pillar when compared to the [111] oriented
pillar. The increased stored elastic energy can be directly attributed to the higher plane specific
moduli in the [211] and [010] directions of martensite when compared to the [110] direction of
martensite (i.e., 146 and 102 GPa as compared to 72 GPa as determined and discussed
previously).
82
Figure 32a and Figure 32b show the respective stress-strain responses of the [111] and
[101] oriented pillars loaded beyond the onset of plasticity in the stress-induced martensite. The
yield stress in Figure 32a was determined to be 1670 MPa for the [111] oriented pillar and 1140
MPa for the [101] oriented pillar in Figure 32b using a 0.2% offset strain from the elastic stress-
strain response of the stress-induced martensite. The difference in yield stresses for the two
pillars is not exactly clear. A possible reason is the variant reorientation that occurs during
loading of martensite in the [101] oriented pillar and is responsible for a lower apparent elastic
modulus may produce favorable orientations of the martensite variants for slip. Another possible
reason is stress that may develop due to the larger number of variant boundaries in the [101]
oriented pillar compared to the [111] pillar. Nevertheless this orientation dependent difference in
the yield stress has implications for the generation of irrecoverable strain during mechanical
cycling in bulk polycrystalline samples. On comparing normalized austenitic neutron spectra at
the start of the stress-induced transformation before and after 50 cycles in the nominally
unloaded condition in Figure 33, we note a reduction in intensity in the (111) peaks when
compared to the (101) peaks. This implies that there are fewer austenite grains oriented with the
(111) planes normal to the loading direction when compared to the (101) planes. This is
surprising given that the single crystal pillar experiments point to higher stresses for both the
onset of the transformation and plasticity for the [111] oriented pillar. The reduction in the (111)
peak intensity thus implies [111] oriented grains yielding or forming retained martensite and
either of these processes are not dictated by only a stress criterion but by the inability of [111]
83
0
500
1000
1500
2000
0 2 4 6 8 10
[111]Str
es
s (
MP
a)
Strain %
0
200
400
600
800
1000
1200
1400
0 2 4 6 8 10
[101]Str
es
s (
MP
a)
Strain %
Figure 32. Yielding of stress-induced martensite in (a) [111] and (b) [101] oriented NiTi pillars.
(a)
(b)

84
1.72 1.73 1.74 1.75 1.76 1.77 1.78
start of cycle 1start of cycle 51
no
rma
lize
d i
nte
nsit
y
d-spacing (Å)
austenite (111)
2.1 2.12 2.14 2.16 2.18
start of cycle 1start of cycle 51
no
rma
lize
d i
nte
nsit
y
d-spacing (Å)
austenite (101)
Figure 33. Section of neutron diffraction spectra acquired in the nominally unloaded condition
before and after 50 mechanical cycles (i.e., at the start of cycle 1 and cycle 51). The spectra
shown here are from diffracting grains oriented with their (111) and (101) plane normals along
the loading direction. The entire spectra were normalized so that (101) peaks have the same peak
intensity. The peak at 1.765 Å is due to the steel from the extensometer knife edge and does not
influence the analysis since the normalization considered peak heights and not areas.
85
oriented grains to generate large strains or reorient when compared to the [101] oriented grains
(even though the former was not observed in our [101] oriented pillar experiments due to the
early onset of plasticity).
5.4 Conclusions
Thus for the first time the complete micromechanical response of superelastic NiTi is examined
by performing careful micro-compression experiments on single crystal pillars of known
orientations. Specifically, the orientation dependence of elastic deformation of austenite, the
onset of its transformation to martensite, the gradient and the hysteresis in the stress-strain
response during transformation, the elastic modulus of the stress-induced martensite and the
onset of plasticity of the stress-induced martensite are analyzed in separate experiments. A
majority of the results were explained by recourse to a quantitative determination of strains
associated with austenite grains transforming to martensite CVPs or twinning in martensite.
Comparison is also made with neutron diffraction experiments on a bulk polycrystalline
superelastic sample in order to justify calculation of the strains and examine the role of
intergranular interactions on superelastic behavior. At the length scales investigated, there is
evidence through this work for a fully reversible stress-induced transformation from austenite to
martensite (that does not involve additional dislocation activity). Such use of a reversible
martensitic phase transformation can thus be made to accommodate mismatch in material micro-
and nanostructures (e.g., composites or multi-layered materials) or superelasticity in structures
and devices at reduced length scales (e.g., grippers, medical implants etc).

86
CHAPTER SIX: METHODOLOGY TO CALCULATE THE VARIANT STRAIN
The methodology adopted in the calculation of variant strains discussed in the preceding chapter
is presented here. The crystallography of the martensitic phase transformation involving rotation
(R), distortion (D) and shear (S) are explained.
6.1 Methodology
The phase transformation from austenite to martensite occurs by a self accommodating process.
The plane along which shear during the phase transformation occurs is defined as the habit plane.
There are 24 habit plane variants in NiTi. The habit plane is composed of units with lattice
correspondence with the parent phase. These are termed as correspondent variant pairs (CVPs)
and for NiTi, there exists 12 CVPs, as shown in Table 3. A schematic of the correspondence
between the parent and the product phase is given Figure 34 for variants 1 and 1'. Figures 35-39
provide a schematic of all the variants listed in Table 3. Each CVP has twin related martensite
variant which form alongside during the phase transformation. From the CVPs the coordinate
transformation from the parent phase to austenite phase can be established. An example to derive
the lattice correspondence matrix for the variant listed in Figure 34 is listed below.
The unit cell of martensite (without distortion and shear) is shown in red. A combination of 4
unit cells of austenite, represented in black, is used to obtain a unit cell of martensite. From this
figure, the transformation of coordinate axes from austenite to martensite can be expressed in the
following matrix.

87
W
V
U
w
v
u
110
110
001
(i)
where, [UVW] is an arbitrary vector in the parent phase and the corresponding vector in the
product phase is given by [uvw].

88
Table 3: Lattice correspondence between the 12 variants of martensite and parent austenite
phase. The martensite is represented as M while the austenite is represented as B2.
Variant [100]M [010]M [001]M
1 [100]B2 [011]B2 [0-11]B2
1' [-100]B2 [0-1-1]B2 [0-11]B2
2 [100]B2 [0-11]B2 [0-1-1]B2
2' [-100]B2 [01-1]B2 [0-1-1]B2
3 [010]B2 [-101]B2 [101]B2
3' [0-10]B2 [10-1]B2 [101]B2
4 [010]B2 [101]B2 [10-1]B2
4' [0-10]B2 [-10-1]B2 [10-1]B2
5 [001]B2 [1-10]B2 [110]B2
5' [00-1]B2 [-110]B2 [110]B2
6 [001]B2 [110]B2 [-110]B2
6' [00-1]B2 [-1-10]B2 [-110]B2

89
The martensite transformation in NiTi can be described as a combination of Rotation (R),
Distortion (D) and shear (S). Thus mathematically the transformation strain for a particular
variant along a specific direction (parent basis) can be estimated. The rotation matrix enables the
transformation of an arbitrary vector in the parent phase to the product phase by using the
coordinate transformation. The deformation matrix (G) defined as the product of distortion (D)
and shear (S) is obtained based on the geometry of the unit cell transformation from the cubic to
the monoclinic structure and is given by:
2B,110
2B,110
2B,1102B,100
ij
d2
cosc00
0d2
b0
d2
sinc0
d
a
G (ii)
The lattice parameters of the product martensite phase are represented as a, b and c with being
the difference in the angle from 90°. The interplanar spacing along the <100> and <110> planes
in the parent austenite basis are represented by d100B2 and d110B2.
Thus the transformation strain along an arbitrary direction defined by <UVW> in the parent
phase for a variant whose lattice correspondence matrix is defined from one of the 12 possible
CVPs is given by:
v
vRGRhkl
1
var (iii)
where R-1
is the transpose of the rotation matrix R.

90
In this way the transformation strain along individual variants and along specific direction could
be estimated.

91
Figure 34 . Schematic of the lattice correspondence between austenite and martensite for variants
1 and 1'.
[-100]P
[00-1]P
[0-10]P
[100]M
[001]M
[010]M
[-100]P
[00-1]P
[0-10]P
[100]M
[001]M
[010]M
[100]P
[010]P
[001]P
[100]M
[001]M
[010]M
[100]P
[010]P
[001]P
[100]M
[001]M
[010]M
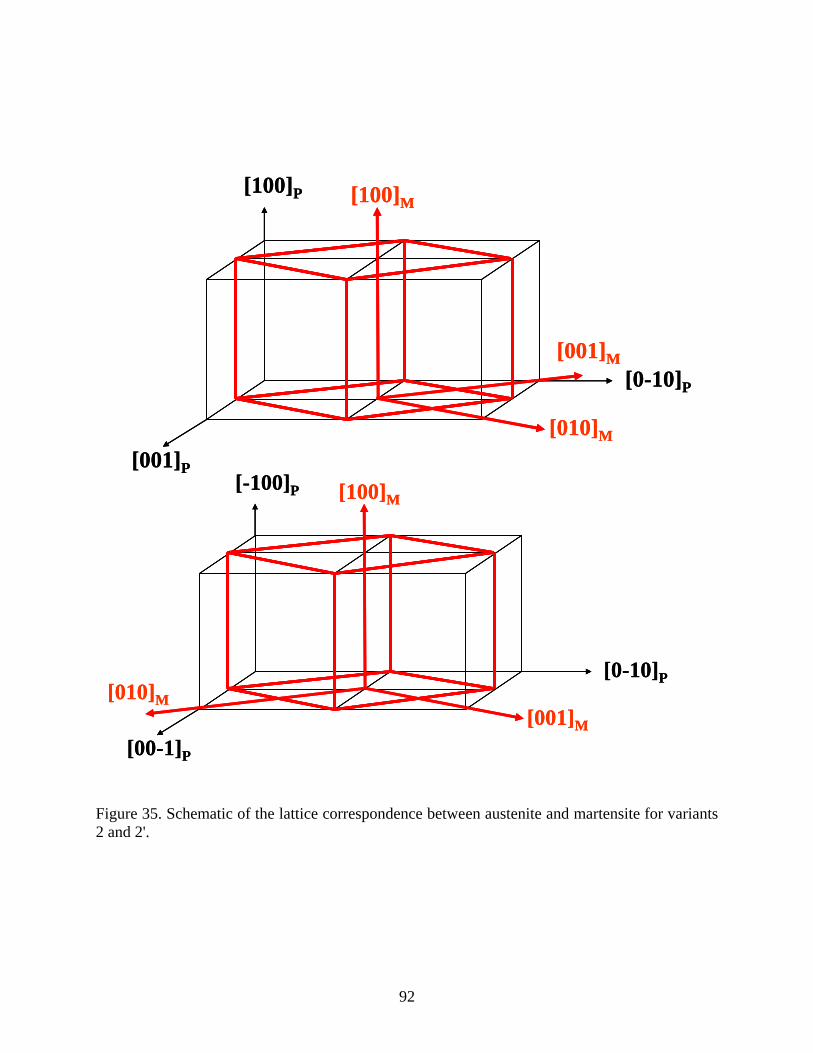
92
Figure 35. Schematic of the lattice correspondence between austenite and martensite for variants
2 and 2'.
[-100]P
[00-1]P
[0-10]P
[100]M
[001]M
[010]M
[-100]P
[00-1]P
[0-10]P
[100]M
[001]M
[010]M
[100]P
[001]P
[0-10]P
[100]M
[001]M
[010]M
[100]P
[001]P
[0-10]P
[100]M
[001]M
[010]M

93
Figure 36. Schematic of the lattice correspondence between austenite and martensite for variants
3 and 3'.
[010]P
[001]P
[100]P
[100]M
[001]M
[010]M
[010]P
[001]P
[100]P
[100]M
[001]M
[010]M
[0-10]P
[-100]P
[00-1]P
[100]M
[010]M[001]M
[0-10]P
[-100]P
[00-1]P
[100]M
[010]M[001]M

94
Figure 37. Schematic of the lattice correspondence between austenite and martensite for variants
4 and 4'.
[010]P
[001]P
[100]P
[100]M
[010]M
[001]M
[010]P
[001]P
[100]P
[100]M
[010]M
[001]M
[0-10]P
[001]P
[-100]P
[100]M
[010]M[001]M
[0-10]P
[001]P
[-100]P
[100]M
[010]M[001]M

95
Figure 38. Schematic of the lattice correspondence between austenite and martensite for variants
5 and 5'.
[001]P
[100]P
[010]P
[100]M
[010]M
[001]M
[001]P
[100]P
[010]P
[100]M
[010]M
[001]M
[00-1]P
[0-10]P
[-100]P
[100]M
[010]M[001]M
[00-1]P
[0-10]P
[-100]P
[100]M
[010]M[001]M
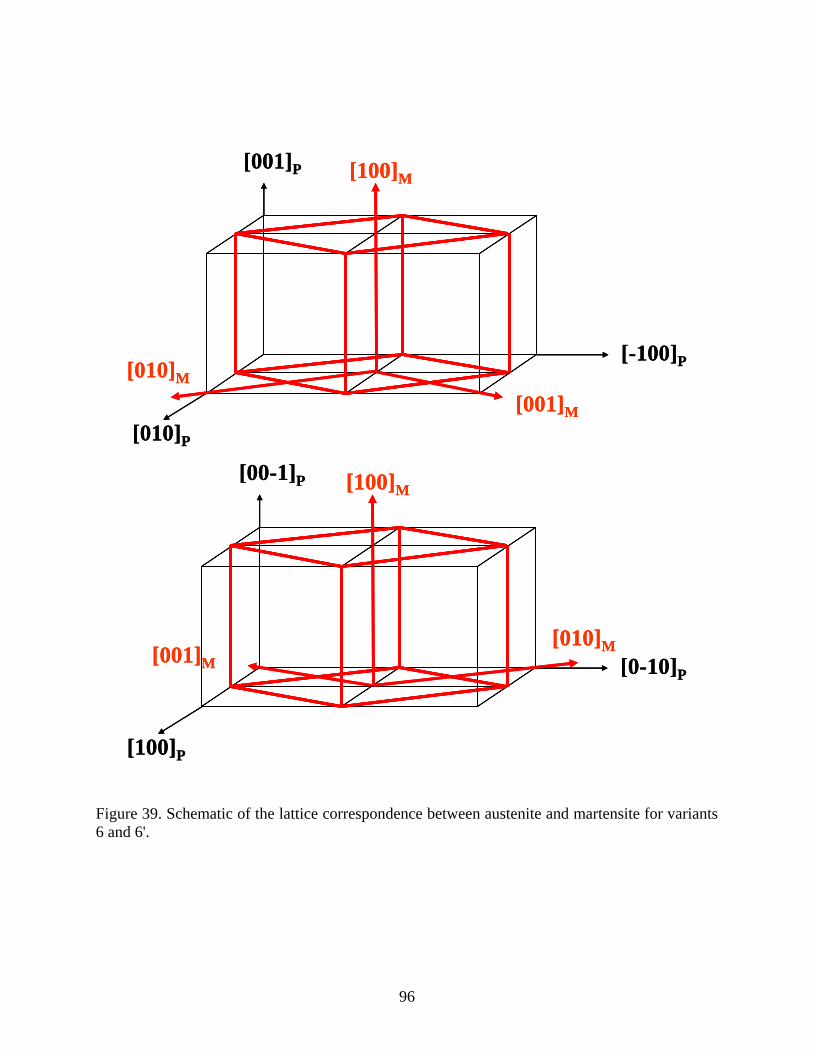
96
Figure 39. Schematic of the lattice correspondence between austenite and martensite for variants
6 and 6'.
[001]P
[010]P
[-100]P
[100]M
[001]M
[010]M
[001]P
[010]P
[-100]P
[100]M
[001]M
[010]M
[00-1]P
[100]P
[0-10]P
[100]M
[010]M[001]M
[00-1]P
[100]P
[0-10]P
[100]M
[010]M[001]M
97
CHAPTER SEVEN: MICROSTRUCTURAL INVESTIGATION OF INDENTATION
TRAINED TWO-WAY SHAPE MEMORY EFFECT IN NiTi SHAPE MEMORY ALLOY
The mechanism governing the two way shape memory effect, trained and observed under multi-
axial loading conditions, is studied. The presence of retained martensite is confirmed from the in
situ phase transformation studies at temperature, in a transmission electron microscope, from
specimens prepared in different regions under the indent. Additionally, the in situ phase
transformation studies also indicated the presence of R-phase upon heating in certain regions
below the indent.
7.1 Introduction
The shape memory effect in binary NiTi alloys involves a reversible thermo-elastic martensitic
phase transformation from a high temperature cubic (B2) austenite phase to a low temperature
monoclinic (B19') martensite phase. The phase change upon heating from the martensite phase to
the austenite phase enables the material to return to a predetermined shape. This phenomenon
known as the one-way shape memory effect is an inherent material property associated with the
crystallography. The origin of the one-way shape memory effect, in NiTi, is well understood and
documented [2, 3, 8, 33]. Complementing the (one-way) shape memory effect is the two-way
shape memory effect (TWSME) wherein the material spontaneously remembers the preset shape
in both the hot state, associated with the austenite phase, and the cold state, associated with the
martensite phase. The TWSME is not an inherent characteristic of the shape memory alloy and
can only be induced after certain thermomechanical procedures referred to as “training” [90].

98
Training, at the microstructural level, results in the introduction of localized stresses that bias the
formation of preferentially oriented variants of the martensite phase, upon cooling. The strong
interaction between martensite variants and the localized stress enables the preferential selection
of variants, arising from the training procedure, thereby lowering the energy of the system. The
biasing of the nucleation and growth of preferential variants results in the material exhibiting
two-way shape memory effect. Common training procedures include thermomechanical cycling
[91], deformation of the martensite or austenite phase [3, 92, 93] or aging under external stress
[94]. Although the mechanism governing the origin of TWSME has been attributed to the
presence of microstresses, there is ambiguity with regards to their origin. It is believed that the
TWSME could be due to residual stress fields which give rise to microstructural anisotropy
resulting in the formation of thermodynamically favorable martensitic variants [95, 96] or the
complex dislocation arrays, as a result of cycling, favoring nucleation of preferential martensite
variants [97, 98] or by thermally stabilized martensite which could influence the nucleation and
growth of martensite variants upon cooling [97, 99-101]. The aforementioned methods of
training were based on uniaxial tensile, bending or shearing loading conditions. Further, previous
studies [102] have indicated that the mechanism behind the two-way shape memory effect and
the observed properties such as work done, reversible strain achieved, stability etc., is largely
influenced by the training procedure, number of training cycles and prior heat treatment
However, no direct relationship was found between applied stress and two-way strain [10].
Recently, Zhang et al. [103] showed that TWSME could also be obtained under multi-axial
loading conditions, such as by indentation. Through an indentation-planarization method [104]
they were able to develop reversible surface protrusions on a NiTi shape memory alloy surface in

99
which thermally reversible flat to bumpy surface changes were observed. This phenomenon was
termed as surface form memory (SFM). The reversible surface protrusions were easily controlled
by indentation position, indenter shape and applied load. Constrained recovery experiments were
performed on a binary NiTi alloy exhibiting surface form memory by Fei et al. [105] and
considerable work output was observed from the energy density measurements. This is because
complex loading conditions are more effective in introducing microstresses in the specimen as
opposed to simple loading conditions such as tension and compression [106, 107]. It is
imperative to understand the microstructure responsible for the surface form memory associated
with the TWSME as such an investigation would enable us to further our understanding on the
origin of the mechanism(s) governing TWSME and also provide insights on the phase
transformation activity underneath the indent. Further, there has not been any microstructural
investigation on the subsurface deformation underneath a micro-indent despite numerous studies
[103, 108-110] on the TWSME related to micro-indents. A clear understanding of the
mechanism is significant given the fact that the reversible surface protrusion finds immense
potential in MEMS (actuator applications) [111] and can be used to address wear and erosion
issues in tribological applications [112, 113]. In addition to the aforementioned problem, an
attempt has been made to address the prevailing uncertainity on the origin of stresses leading to
variant biasing which results in the TWSME.
7.2 Experimental Procedure
The NiTi shape memory alloy (49.4at% Ni) studied in this work was fabricated from pre-alloyed
NiTi powders by hot isostatic pressing. The specimen was subsequently solutionized at 1203 K
for 1 hour in the presence of argon and titanium as gettering agent and furnace cooled to room

100
temperature. The transformation temperatures were determined by differential scanning
calorimetry and the results are shown in Figure 40. The austenite finish, austenite start,
martensite start, and martensite finish were found to be 359, 339, 308 and 322 K ± 2 K
respectively. Thus, the alloy was martensitic at room temperature.
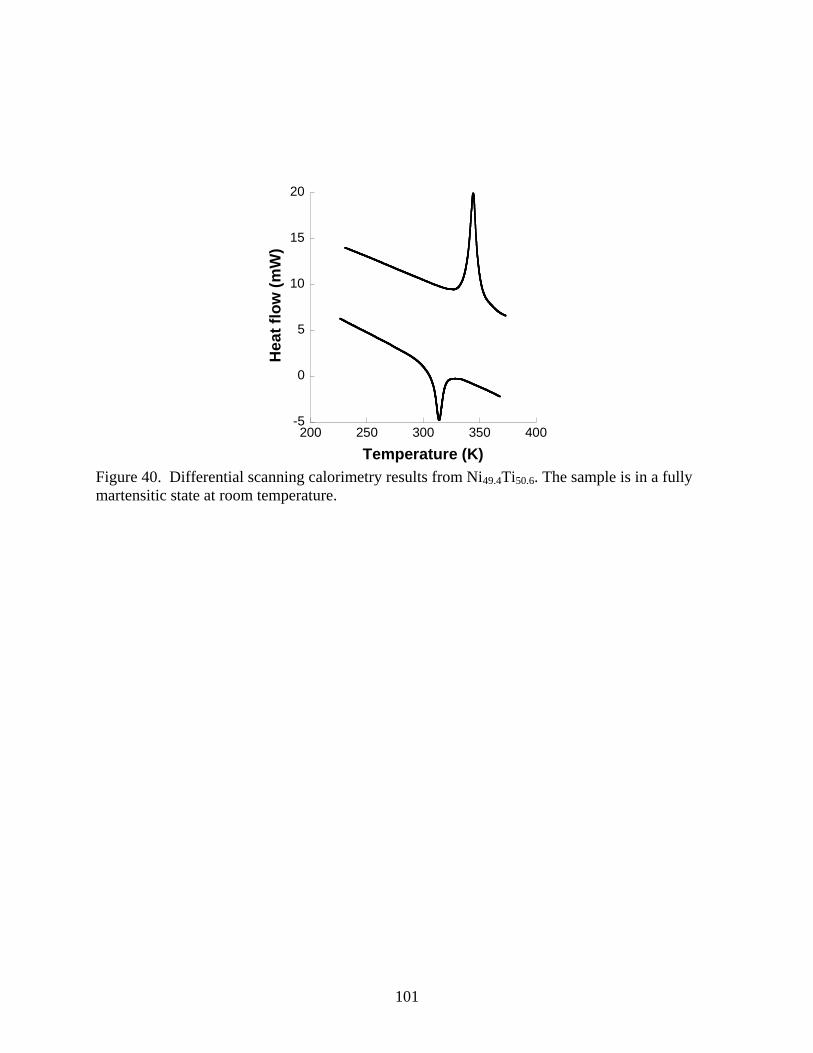
101
-5
0
5
10
15
20
200 250 300 350 400
He
at
flo
w (
mW
)
Temperature (K)
Figure 40. Differential scanning calorimetry results from Ni49.4Ti50.6. The sample is in a fully
martensitic state at room temperature.
102
The sample surface was fine polished using 0.5 µm diamond paste. The sample was embedded in
an epoxy mold for easy access, and a sample holder was fabricated to fit the indenter stage. The
holder allowed for repeatability so that the indent would occur at the same spot every time. The
training procedure, to obtain TWSME, involved cooling the specimen in ice-cold water, for 3
minutes, to ensure that the sample is predominantly in the martensitic state and subsequently
indenting with a steel ball of known diameter (3.175 mm) using a Rockwell hardness tester at a
load of about 1470 N. Following this, the specimen was heated to 373 K in a muffle furnace, for
2 minutes, and furnace cooled, before further cooling in ice-cold water. This marked the
completion of a complete thermomechanical cycle. The specimen was cycled 100 times in a
similar fashion. Cross-sectional profile of the indent depth change upon phase transformation
from austenite to martensite or vice-versa was measured using a Tencor Alpha-Step 500 surface
profiler. The specimen was, then, carefully sectioned on either side of the indent using a low
speed saw. A combination of focused ion beam (FIB) and ion milling techniques were used to
prepare the samples for electron microscopy observation. This was done to ensure that no
artifacts arose in the sample preparation process. In all cases the images observed were in good
agreement and for the purpose of discussion in this paper, the better image was selected. While
the FIB specimens were prepared using FEI 200 TEM focused ion beam machine the ion milling
specimens were prepared using a Fischione Ion Milling system. The specimens for electron
microscopy analysis were prepared at depths of 75 µm and 150 µm below the indent as justified
later. Additionally specimens from an untrained sample were also prepared using the
aforementioned techniques. In situ phase transformation studies were performed on both the
focused ion beam specimens and the ion milled samples. A Tecnai F30 transmission electron

103
microscope operating at 300 kV was used in this study. A Gatan Model 901 hot stage was used
for in situ phase transformation studies in the transmission electron microscope.
7.3 Results and Discussion
Adapting from [114], the contact radius, a , of the indent was calculated from the expression:
E
PRa
4
33 (i)
where, P is the load applied (N)
R is the radius of the indenter (m) and
E is the reduced elastic modulus (N/m2)
The reduced elastic modulus inturn is obtained from the expression:
2
2
2
1
2
1 111
EEE (ii)
where, 1 and 1E are the Poisson‟s ratio (0.3) and elastic modulus (210 GPa) of the steel
indenter and 2 and 2E are the Poisson‟s ratio (0.35) and elastic modulus (69 GPa) of the
martensitic phase of NiTi [53].
The contact radius obtained using the above expression was found to be 310 µm. The maximum
shear stress based on Hertzian contact mechanics was estimated from the following expression:
3/1
23max
631.0
R
PE (iii)
and was found to be 354 MPa. The maximum shear stress was estimated to be at a depth of 0.48a
(a, being the contact radius) which was around 150 µm below the surface. By scaling the
indenter radius and using the results from the modeling of indentation response in shape memory

104
alloys by Muir et al. [115], the depth at which the maximum shear stress occurred for an indenter
of radius used in this study was estimated to be around 165 µm which is very close to the depth
of 150 µm at which the specimen for electron microscopy studies were prepared. Although the
maximum shear stress was estimated to be at a depth of 150 µm, due to the non-homogeneous
nature of the stress field underneath the indent [116], the microstructural activity at half the depth
of maximum shear stress, corresponding to 75 µm where the shear stress was estimated to be 236
MPa, was also investigated to provide insights on the phase transformation activity.
The cross sectional profile of the reversible indent depth change upon heating and
cooling, following thermo-mechanical cycling, is shown in Figure 41. The inset shows
representative optical micrographs of the indent before and after heating. The profile of the
martensitic phase is deeper than the austenitic phase and is associated with the TWSME
observed due to the thermo-mechanical training. From Figure 41, the reversible depth change
was found to be 1.9±0.2 µm. This is approximately 14% of the total indent depth.
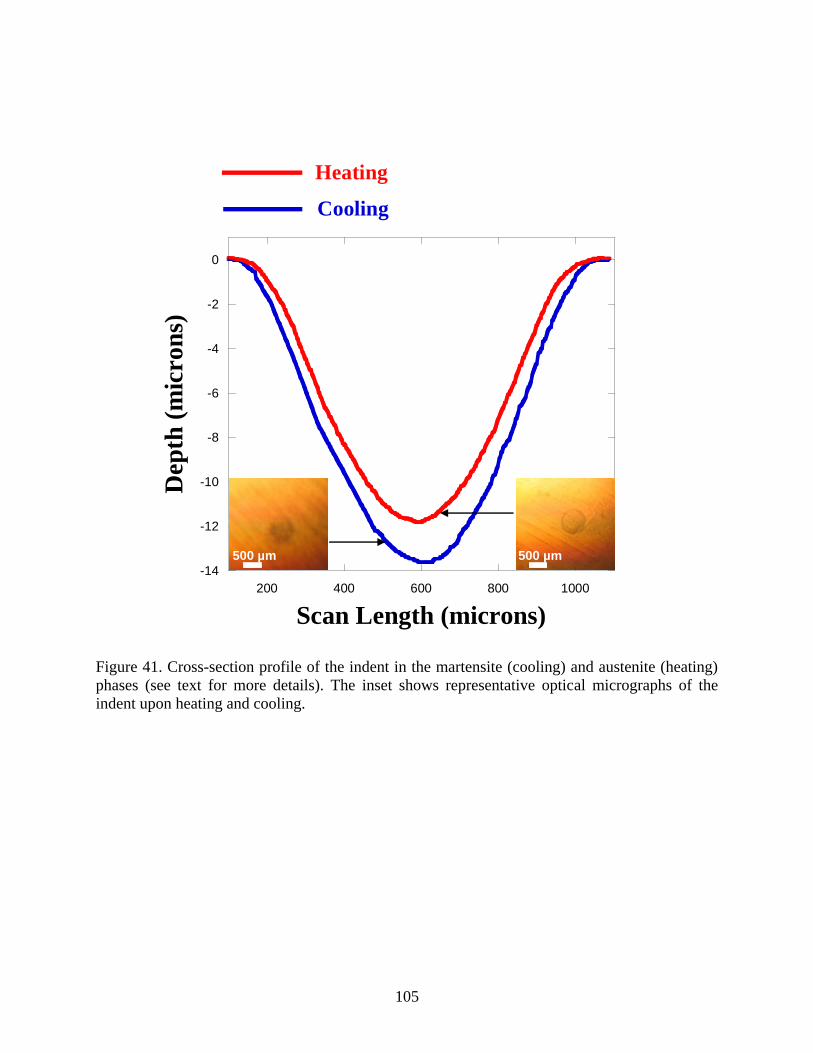
105
Figure 41. Cross-section profile of the indent in the martensite (cooling) and austenite (heating)
phases (see text for more details). The inset shows representative optical micrographs of the
indent upon heating and cooling.
-14
-12
-10
-8
-6
-4
-2
0
200 400 600 800 1000
Dep
th (
mic
ro
ns)
Scan Length (microns)
Heating
Cooling
500 µm500 µm500 µm500 µm

106
Figure 42a shows the transmission electron microscopy observations of the sample prepared at a
depth of 75 µm below the indent surface. The microstructure reveals internally twinned
martensite plates at room temperature. Figure 42b represents the internally twinned
microstructure of the martensite after heating the sample to 423 K. This specimen is from the
region closest to the indent surface. Stabilization of the martensite observed at temperatures well
above the Af could be due to the dislocation introduced during the indentation based thermo-
mechanical training process. This is in agreement with previous observations [110, 117] as
dislocations introduced by cycling during the training process might have prevented the phase
boundary movement during the reverse transformation thereby resulting in the stabilization of
martensite in this region. Although it has been previously shown that the stabilized martensite is
a one-time effect and overheating the specimen above Af could result in the restoration of the
thermally stabilized martensite [95, 118], no such effect was observed in this region even after
heating to temperatures as high as 423 K. The specimens for electron microscopy analysis were
prepared from the bulk sample after it was heated to temperatures well above Af to ensure that
retained martensite, if any, gets completely transformed to austenite [96]. This implies that the
martensite observed here corresponds to the retained martensite in this region.
Figure 43 representing the microstructure of the specimen obtained at a depth of 150 µm
below the indent shows the R-phase at room temperature. The differential scanning calorimetry
analysis of the bulk specimen did not show the occurrence of an intermediate R-phase. The
generation of defects such as dislocations during the thermo-mechanical cycling results in the
formation and stabilization of the intermediate R-phase [3, 119, 120] which was only observed
around the region that underwent maximum deformation.

107
Figure 42. Bright field micrographs at a depth of 75 µm below the indent at (a) room temperature
with the inset showing a selected area diffraction pattern of the monoclinic phase oriented along
[-934] and (b) at 423 K showing retained martensite.
0.5 µm0.5 µm
(b)
0.5 µm0.5 µm
(a)
10 1/nm10 1/nm
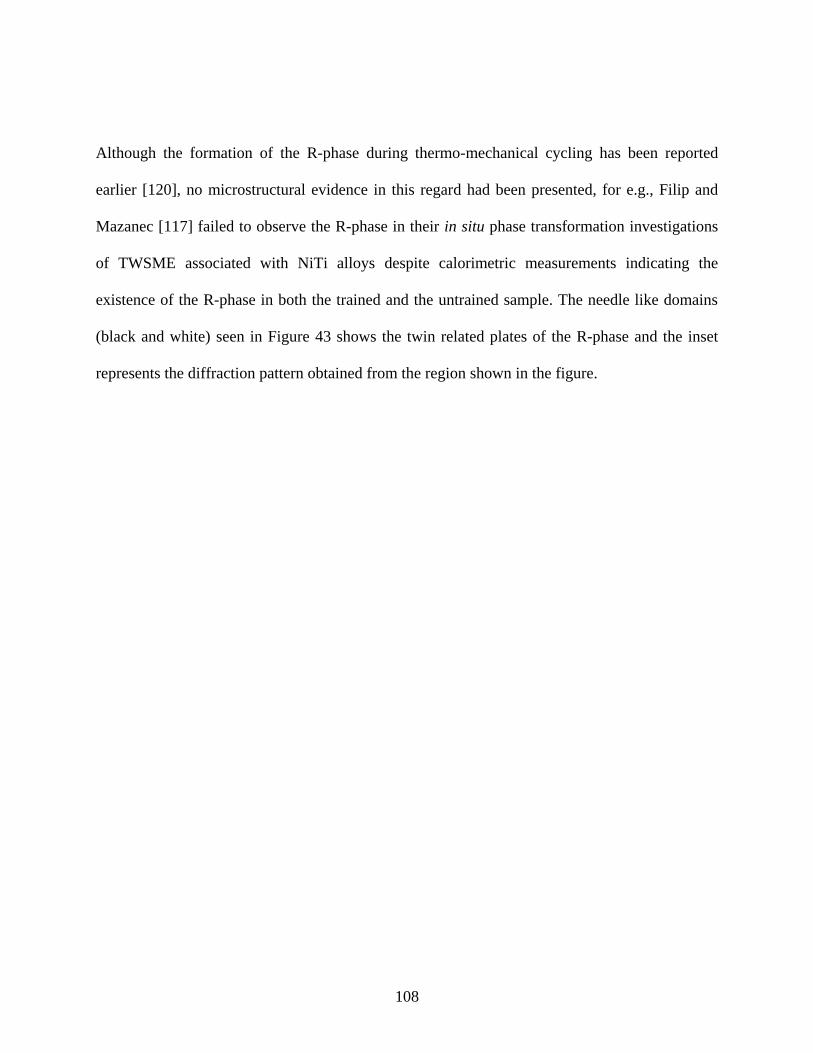
108
Although the formation of the R-phase during thermo-mechanical cycling has been reported
earlier [120], no microstructural evidence in this regard had been presented, for e.g., Filip and
Mazanec [117] failed to observe the R-phase in their in situ phase transformation investigations
of TWSME associated with NiTi alloys despite calorimetric measurements indicating the
existence of the R-phase in both the trained and the untrained sample. The needle like domains
(black and white) seen in Figure 43 shows the twin related plates of the R-phase and the inset
represents the diffraction pattern obtained from the region shown in the figure.

109
Figure 43. Bright field micrographs at a depth of 150 µm below the indent at room temperature
with R-phase and the inset showing the selected area diffraction pattern along the [111]B2 axis.
0.2 µm0.2 µm
10 1/nm10 1/nm
110
The role of the R-phase associated with TWSME has been investigated in earlier studies [95,
102, 121]. While Chang et al. [121] observed a positive influence of R-phase on TWSME, other
investigations [102, 122] observed a negative influence. The former observed improved stability
and excellent reversible strain of the two-way transformation due to the preferentially oriented
R-phase variants facilitating the biasing of B19' martensite variants during the forward
transformation while the later observed that introduction of R-phase makes it difficult to
introduce localized internal stresses, such as dislocations which are essential in obtaining good
two-way transformation behavior. However, the results from the present study indicate that the
R-phase enhances the efficiency and stability of the observed TWSME. Figure 44a shows the
microstructure of the monoclinic martensite phase present at room temperature around the region
corresponding to the maximum shear stress. In situ phase transformation studies indicated
martensite and R-phase even as the sample was heated to 423 K. Figure 44b reveals the
martensite observed after heating the sample to 423 K. This suggests that the martensite
observed in this region is retained martensite which did not transform even after heating to
higher temperatures. Thus it is believed that the retained martensite is an influencing factor in
establishing the TWSME observed in specimens exhibiting surface form memory.

111
Figure 44. Bright field micrographs at a depth of 150 µm below the indent showing (a)
martensite at room temperature and the corresponding diffraction pattern oriented along [-6-53]
axis and (b) retained martensite at 423 K.
0.2 µm0.2 µm
10 1/nm10 1/nm
0.2 µm0.2 µm

112
Further, dislocations generated during cycling can restrict the movement of the martensite-
austenite interface in this region during the reverse phase transformation leading to the stability
of martensite at higher temperatures. The macroscopic stress-strain response for the martensite
phase of the NiTi alloy [123] considered in the present work, indicates the onset stress for
detwinning at around 125 MPa. Using an approximation wherein the theoretical shear stress is
half the uniaxial stress, the uniaxial stress during the indentation training process is estimated to
be around 680 MPa which is above the stress required for detwinning but below the tensile and
the compressive yield stress of 900 MPa and 1300 MPa, respectively of the martensite phase.
Thus it is believed that the dislocation based activity in inducing the TWSME in the specimen is
minimal and the low dislocation density observed in the sample could be due to the thermal
cycling during the training process. Figure 45 shows localized dislocation pile ups in regions
associated with maximum shear stress in the sample.
113
Figure 45. Bright field micrographs at a depth of 150 µm below the indent showing dislocations
around the region of maximum theoretical stress with the corresponding diffraction pattern
exhibiting streaked spots.
0.5 µm0.5 µm
5 1/nm5 1/nm

114
The localized plasticity is a result of the complex multi-axial stress state underneath the indent
and results in a non-homogeneous distribution of strain field [115, 116]. Thus it is believed that
the role played by dislocations is minimal and localized. Localized plasticity has been observed
in micro-compression studies on micro crystal pillars. In order to confirm the aforementioned
observations of stabilized martensite at depths of 75 µm and 150 µm below the indent surface
and at 423 K which is well above the Af, in situ phase transformation studies were additionally
performed on a specimen prepared from the untrained sample. Figure 46a represents the bright
field micrograph of the martensite twins observed at room temperature. However upon heating
the sample to 423 K, the transformation of martensite to austenite was observed and Figure 46b
represents the microstructure of the austenite phase from the same location. While Zhang et al.
[103] suggested that internal stress field generated by the dislocations, rather than retained
martensite, was primarily responsible for the surface form memory effect, our observations
indicate that the occurrence of reversible surface protrusions on the shape memory alloy surface
is primarily influenced by the retained martensite. Although dislocations, due to thermal cycling,
stabilize the martensite phase, the role of dislocations in inducing the TWSME has been minimal
due to the localized plasticity observed underneath the indent. Additionally, the maximum
uniaxial stress estimated underneath the indent is below the macroscopic yield stress of the
martensitic phase, implying the diminished influence of the dislocations in inducing the observed
TWSME. Further, the higher stiffness of the retained martensite phase is believed to have a
greater influence in the preferential selection of martensite variants during the forward
transformation. Retained B19' martensite is also known to influence the formation of martensite
variants in stress induced phase transformation in superelastic NiTi [50].
115
Figure 46. Bright field micrographs from an untrained region of the sample at room temperature
with (a) showing the martensite twins and the inset representing the diffraction pattern along
[ 101 ] axis and (b) showing the austenite phase at 423 K and the inset representing the diffraction
pattern along [111] axis. No martensite was observed at 423 K, which is above Af.
50 nm
10 1/nm10 1/nm
100 nm100 nm
10 1/nm10 1/nm
(a)
(b)

116
Miller et al. [124] studied the development of two-way strain in NiTi under different loading
paths. Accordingly, maximum two-way strain attainable was observed by loading the specimen
in single phase martensite and their results indicated the highest amount of retained martensite in
the martensitic loading path. Thus the large reversible strain observed in the surface form
memory could be attributed to training the sample by loading in the martensitic phase.
7.4 Conclusions
Training under complex multi-axial loading conditions is more effective in introducing
microstresses, due to the non-homogeneous nature of the stress field, which give rise to two-way
shape memory effect with large reversible depth changes. The introduction of effective
microstresses during multi-axial loading/training sequence could be attributed to the presence of
stabilized martensite in the subsurface region beneath the indenter as seen from the
microstructural analysis in the present study. Stabilized martensite having higher stiffness and
dislocations could have assisted in the formation of preferentially oriented martensite, during
cooling, resulting in a stable and efficient TWSME in the form of reversible surface protrusions.
Thus it can be clearly established that retained martensite is primarily responsible for the
observed TWSME, obtained under complex loading conditions, in the form of reversible surface
protrusions. Further, the role of dislocation in the observed TWSME has been shown to be
minimal. This research work additionally substantiates the presence of R-phase, in the subsurface
underneath a micro-indent, through microstructural investigations.

117
CHAPTER EIGHT: CONCLUSIONS
8.1 Conclusions
The results obtained from the present research work are summarized here in addition to the
individual conclusions presented at the end of each chapter. The studies on the R-phase
transformation in ternary NiTiFe alloys provided a systematic understanding on the influence of
processing and compositional parameters on characteristic features of the R-phase
transformation. The transformation temperatures of R-phase decreased with increasing Ni and Fe
concentration and no phase transformation was observed in alloys with more than 4 at%. The
shift in the transformation temperatures of R-phase in Ni-rich and Ti-rich NiTiFe alloys were
compared and quantified. For identical Fe concentrations, Ni-rich alloys were more effective in
suppressing the R-phase transformation to lower temperatures. Thermo-mechanical treatments
facilitated the formation of R-phase in Ni-rich alloys and the transformation characteristics
associated with the R-phase was influenced by defects such as dislocations and precipitates. A
larger precipitate size and wider inter-precipitate spacing resulted in a narrow transformation
temperature range while the converse was true for wider transformation intervals. Further
addition of small concentrations of Fe was shown to eliminate the complex multiple phase
transformations occurring in the system. The deformation studies in ternary NiTiFe alloys
signified the interdependence of the available deformation modes in the system in the stress-
strain-temperature space. The stress induced phase transformations from B2 to R and R to B19'
were studied within the framework of the Clausius-Clapeyron stress-temperature equivalence.
The propensity of the R-phase to detwin decreased with decreasing temperatures and at very low

118
temperatures, the R-phase underwent a direct stress induced transformation to the B19' phase. A
deformation mechanism map was constructed to identify the preferred deformation mode in the
stress-temperature space. The micro-compression studies established, for the first time, the
complete micromechanical response of superelastic NiTi. Orientation dependent superelastic
behavior in NiTi was observed at the length scales considered disproving the previous work that
reported the absence of the same. Further the transformation strains, onset stress for stress
induced transformation and the yield stress obtained from the micro-compression studies were
compared and evaluated with the results from in situ neutron diffraction investigations on the
same sample in bulk polycrystalline form and additionally with macromechanical results on bulk
single crystal alloys from previous studies thereby unambiguously validating the results from the
micromechanical experiments. The in situ phase transformation studies in shape memory NiTi,
exhibiting two-way shape memory effect, underneath a micro indent provided microstructural
evidence for the presence of retained martensite and R-phase. Retained martensite was shown to
primarily influence the two-way shape memory effect in cases with reduced dislocation density.
The implications from the results obtained in the present research work are summarized
below. The processing-structure-property correlation studies on the R-phase transformation
helped establish a new cost effective methodology in processing and characterization of shape
memory alloys with regards to alloy development. Further, the results from these studies have
provided a clear understanding on the influence of compositional and processing parameters on
the R-phase transformation thereby enabling the possibility to tailor new alloys based on specific
application requirements. The deformation map, in stress-temperature space, constructed based
on the deformation studies on R-phase has practical implications for using NiTiFe alloys in

119
applications that require low-temperature, low-hysteresis actuators with superior fatigue behavior
such as thermal conduction/convection switches. Additionally, regions in stress-temperature
space are identified where the B19' to R-phase transformation can be used for one time/high
stroke applications such as release mechanisms. The micro-compression studies have
unambiguously established the micromechanical behavior at reduced length scales. The results
from the micro-compression studies have potential implications in advancing the use of
superelastic NiTi for micro- and nano- based functional devices such as micro actuators, micro
grippers, medical implants etc.,. A clearer understanding of the mechanisms underlying the two-
way shape memory effect from the micro indentation studies will enable in promoting the use of
NiTi based alloys for tribological and MEMS based applications.

120
REFERENCES
[1] K. Otsuka and X. Ren, Prog. Mat. Sci. 50, 2005, 511.
[2] T. W. Duerig, K. N. Melton, D. Stöckel and C. M. Wayman, Engineering Aspects of
Shape Memory Alloys, Butterworth-Heinemann, London 1990.
[3] H. Funakubo, Shape Memory Alloys, Gordon and Breach Science Publishers, 1987.
[4] C. P. Frick, B. G. Clark, S. Orso, P. Sonnweber-Ribic and E. Arzt, Scr. Mater. 59, 2008,
7.
[5] C. P. Frick, T. W. Lang, K. Spark and K. Gall, Acta Mater. 54, 2006, 2223.
[6] D. M. Norfleet, P. M. Sarosi, S. Manchiraju, M. F. Wagner, M. D. Uchic, P. M. Anderson
and M. J. Mills, Acta Mater. 57, 2009, 3549.
[7] W. J. Buehler, J. W. Gilfrich and R. C. Wiley, J. Appl. Phys. 34, 1963.
[8] K. Otsuka and C. M. Wayman, Shape Memory Materials, Cambridge University Press,
1998.
[9] M. Fremond and S. Miyazaki, Shape Memory Alloys, Springer Wien, New York 1996.
[10] R. F. Hamilton, H. Sehitoglu, Y. Chumlyakov and H. J. Maier, Acta Mater. 52, 2004,
3383.
[11] M. C. Carroll, C. Somsen and G. Eggeler, Scripta Mater. 50, 2004, 187.
[12] W. B. Cross, A. H. Kariotis and F. J. Stimler, September 1969, CR-1433.
[13] S. Miyazaki, Y. Ohmi, K. Otsuka and Y. Suzuki, J. De Phys. 43, 1982.
[14] T. Saburi, T. Tatsumi and S. Nenno, J. De Phys. 43, 1982.
[15] M. Matsumoto and T. Honma, presented at Proc. 1st JIM Int Symp on New Aspects of
Martensitic Transformations (ICOMAT-76), Sendai, 1976.
[16] T. Tadaki, Y. Nakata and K. Shimizu, Mater. Trans. JIM 28, 1987.
[17] F. E. Wang, B. F. DeSavage, W. J. Buehler and W. R. Hosler, J. Appl. Phys. 39, 1968,
2166.
[18] C. M. Wayman, I. Cornelis and K. Shimizu, Scripta Metall. 6, 1972, 115.
[19] M. Matsumoto and T. Honma, presented at JIM International symposium, Kobe, 1976.
[20] L. Bataillard, Phil. Mag. A 78, 1998, 327.
[21] G. Fan, W. Chen, S. Yang, J. Zhu, X. Ren and K. Otsuka, Acta Mater.52, 2004, 4351.
[22] J. Khalil Allafi, X. Ren and G. Eggeler, Acta Mater. 50, 2002, 793.
[23] V. B. Krishnan, C. Bewerse, W. U. Notardonato and R. Vaidyanathan, AIP Conf. Proc.
986, 2008, 3.
[24] J. L. Lemanski, V. B. Krishnan, R. M. Manjeri, W. U. Notardonato and R. Vaidyanathan,
AIP Conf. Proc. 824, 2006, 3.
[25] J. Frenzel, J. Pfetzing, K. Neuking and G. Eggeler, Mater. Sci. Eng. A 481-482, 2008,
635.
[26] T. Goryczka and H. Morawiec, J. Alloys Compd. 367, 2004, 137.
[27] T. Hara, T. Ohba, E. Okunishi and K. Otsuka, Mater. Trans. JIM 38, 1997.
[28] W. J. Moberly, J. L. Proft, T. W. Duerig and R. Sinclair, Acta Metall. et Mater. 38, 1990,
2601.
[29] J. Uchil, K. G. Kumara and K. K. Mahesh, Mater. Sci. Eng. A 332, 2002, 25.

121
[30] M. S. Choi, T. Fukuda, T. Kakeshita and H. Mori, Phil. Mag. 86, 2006, 67
[31] C. M. Hwang and C. M. Wayman, Scripta Metall. 17, 1983, 381.
[32] H. Hosoda, S. Hanada, K. Inoue, T. Fukui, Y. Mishima and T. Suzuki, Intermetall. 6,
1998, 291.
[33] K. Otsuka and X. Ren, Prog. Mater. Sci. 50, 2005, 511.
[34] G. Bozzolo, R. Noebe and H. Mosca, J. Alloys. Compd. 389, 2005, 80.
[35] ASTM, F 2004-05.
[36] M.-S. Choi, J. Ogawa, T. Fukuda and T. Kakeshita, Mater. Sci. Eng. A 438-440, 2006,
527.
[37] X. Ren, N. Miura, J. Zhang, K. Otsuka, K. Tanaka, M. Koiwa, T. Suzuki, Y. I.
Chumlyakov and M. Asai, Mater. Sci. Eng. A 312, 2001, 196.
[38] T. Fukuda, T. Saburi, K. Doi and S. Nenno, Mater. Trans. JIM 33, 1992, 271.
[39] V. Zel'dovich, G. Sobyanina and T. V. Novoselova, J. Phys. IV France 7, 1997, C5.
[40] S. Miyazaki and K. Otsuka, Metall. Mater. Trans. A 17, 1986, 53.
[41] C. Wojcik, presented at Proc. Intl. Conf. on Shape Memory and Superelastic
Technologies, Baden-Baden, Germany, 2004.
[42] A. Canales, F. Morales, R. Escudero and D. Rios-Jara, J. De Phys. IV 5, 1995, C2.
[43] C. Jiang and H. Xu, Mat. Sci. Forum 327-328, 2000, 111.
[44] Y. Murakami and D. Shindo, Phil. Mag. Lett. 81, 2001, 631.
[45] M. Nishida, K. Tanaka, S. Li, M. Kohshima, S. Miura and M. Asai, J. Phys. IV France
112, 2003, 803.
[46] V. G. Pushin, N. I. Kourov, T. E. Kuntsevich, N. M. Matveeva and V. V. Popov, Phys.
Metall. Metallgr. 92, 2001, 68.
[47] T. Tamiya, D. Shindo, Y. Murakami, Y. Bando and K. Otsuka, Mater. Trans. JIM 39,
1998, 714.
[48] O. Benafan and R. Vaidyanathan, presented at Proc. ASME Intl. Mech. Engg. Congress
and Exposition, Florida, 2009.
[49] D. S. Ford and S. R. White, Acta Mater. 44, 1996, 2295.
[50] C. R. Rathod, B. Clausen, M. A. M. Bourke and R. Vaidyanathan, Appl. Phys. Lett. 88,
2006, 201919.
[51] J. A. Shaw and S. Kyriakides, J. Mech. and Phys. of Solids 43, 1995, 1243.
[52] D. Favier, H. Louche, P. Schlosser, L. Orgéas, P. Vacher and L. Debove, Acta Mater 55,
2007, 5310.
[53] S. Rajagopalan, A. L. Little, M. A. M. Bourke and R. Vaidyanathan, Appl. Phys. Lett. 86,
2005, 081901.
[54] S. Miyazaki and K. Otsuka, Phil. Mag. A 50, 1984, 393
[55] G. B. Stachowiak and P. G. McCormick, Acta Metall. 36, 1988, 291.
[56] H. Tobushi, H. Iwanaga, K. Tanaka, T. Hori and T. Sawada, Cont. Mech. Thermod. 3,
1991, 79.
[57] H. Tobushi, S. Yamada, T. Hachisuka, A. Ikai and K. Tanaka, Smart. Mater. Struct. 5,
1996.
[58] H. Huang, H. Zhang, L. Zhou and H. Y. Zheng, J. Micromech. Microeng. 13, 2003.
[59] P. Wollants, M. D. Bonte and J. R. Roos, Z. Metall. 70, 1979.
[60] T. Fukuda, T. Saburi, K. Doi and S. Nenno, Mater. Trans. JIM 33, 1992.

122
[61] T. W. Duerig, Mat. Sci. Eng. A 440, 2006, 69.
[62] M. Krishnan and J. B. Singh, Acta Mater 48, 2000, 1325.
[63] Y. Fu, H. Du, W. Huang, S. Zhang and M. Hu, Sens. Actuators, A 112, 2004, 395.
[64] M. Kohl, Shape Memory Microactuators, Springer, Berlin 2004.
[65] C. P. Frick, S. Orso and E. Arzt, Acta Mater. 55, 2007, 3845.
[66] G. A. Shaw, J. S. Trethewey, A. D. Johnson, W. J. Drugan and W. C. Crone, Adv. Mater.
17, 2005, 1123.
[67] M. D. Uchic and D. M. Dimiduk, Mater. Sci. Eng., A 400-401, 2005, 268.
[68] H. Sehitoglu, J. Jun, X. Zhang, I. Karaman, Y. Chumlyakov, H. J. Maier and K. Gall,
Acta Mater. 49, 2001, 3609.
[69] R. Vaidyanathan, Kirk-Othmer Encyclopedia of Chemical Technology 2002.
[70] R. Vaidyanathan, M. Bourke and D. Dunand, Metall. Mater. Trans. A 32, March 2001.
[71] D. Kiener, C. Motz and G. Dehm, Mater. Sci. Eng., A 505, 2009, 79.
[72] H. Zhang, B. E. Schuster, Q. Wei and K. T. Ramesh, Scr. Mater. 54, 2006, 181.
[73] S. Miyazaki, T. Imai, Y. Igo and K. Otsuka, Metall. Trans. A 17, 1986, 115.
[74] M. A. M. Bourke, D. Dunand and E. Ustundag, Appl. Phys. A 74, 2002, S1707.
[75] X. Shi, G. Saada and P. Veyssiére, Philos. Mag., A 73, 1996, 1419
[76] J. F. Nye, Physical Properties of Crystals, Clarendon Press, Oxford 1985.
[77] O. Mercier, K. N. Melton, G. Gremaud and J. Hagi, J. Appl. Phys. 51, 1980, 1833.
[78] T. M. Brill, S. Mittelbach, W Assmus, M. Mullner and B. Luthi, J. Phys.: Condens.
Matter 3, 1991, 9621.
[79] K. Gall, H. Sehitoglu, Y. I. Chumlyakov and I. V. Kireeva, Acta Mater. 47, 1999, 1203.
[80] H. Sehitoglu, I. Karaman, R. Anderson, X. Zhang, K. Gall, H. J. Maier and Y.
Chumlyakov, Acta Mater. 48, 2000, 3311.
[81] K. Gall and H. Sehitoglu, Int. J. Plasticity 15, 1999, 69.
[82] S. Miyazaki, S. Kimura, K. Otsuka and Y. Suzuki, Scr. Metall. 18, 1984, 883.
[83] K. Gall, K. Juntunen, H. J. Maier, H. Sehitoglu and Y. I. Chumlyakov, Acta Mater. 49,
2001, 3205.
[84] K. Gall, H. Sehitoglu, Y. I. Chumlyakov, I. V. Kireeva and H. J. Maier, J. Engg. Mater.
Tech. 121, 1999, 28.
[85] K. Gall, H. Sehitoglu, Y. I. Chumlyakov, I. V. Kireeva and H. J. Maier, J. Engg. Mater.
Tech. 121, 1999, 19.
[86] T. Saburi and S. Nenno, Proceedings of International Conference on Solid-Solid Phase
Transformations 1981, 1455.
[87] D. Dunand, D. Mari, M. Bourke and J. Roberts, Metall. Mater. Trans. A 27, 1996, 2820.
[88] R. J. Salzbrenner and M. Cohen, Acta Metallurgica 27, 1979, 739.
[89] M. F. X. Wagner and W. Windl, Acta Mater. 56, 2008, 6232.
[90] A. Nagasawa, K. Enami, Y. Ishino, Y. Abe and S. Nenno, Scripta Metall. 8, 1974, 1055.
[91] P. Y. Manach and D. Favier, Scripta Metall. et Mater. 28, 1993, 1417.
[92] Y. Liu, Y. Liu and J. Van Humbeeck, Acta Mater. 47, 1998, 199.
[93] J. J. Wang, T. Omori, Y. Sutou, R. Kainuma and K. Ishida, Scripta Mater. 52, 2005, 311.
[94] Z. Wang, X. Zu, X. Feng and J. Dai, Mater. Lett. 54, 2002, 55.
[95] R. Stalmans, J. Van Humbeeck and L. Delaey, Acta Metall. Mater. 40, 1992, 2921.
[96] R. Stalmans, J. Van Humbeeck and L. Delaey, Acta Metall. Mater. 40, 1992, 501.

123
[97] J. Perkins and R. Sponholz, Metall. and Mater. Trans. A 15, 1984, 313.
[98] D. Ríos-Jara and G. Guénin, Acta Metall. 35, 1987, 109.
[99] T. Saburi and S. Nenno, Scripta Metall. 8, 1974, 1363.
[100] X. L. Meng, W. Cai, Y. F. Zheng, Y. B. Rao and L. C. Zhao, Mater. Lett. 57, 2003, 4206.
[101] E. Cingolani, M. Ahlers and M. Sade, Acta Metall. et Mater. 43, 1995, 2451.
[102] Y. Liu and P. G. McCormick, Acta Metall. et Mater. 38, 1990, 1321.
[103] Y. Zhang, Y.-T. Cheng and D. S. Grummon, Appl. Phys. Lett. 88, 2006, 131904.
[104] Y. Zhang, Y.-T. Cheng and D. S. Grummon, Appl. Phys. Lett. 89, 2006, 041912.
[105] X. Fei, C. O'Connell, D. S. Grummon and Y. T. Cheng, J. Mater. Eng. Perform(in
review).
[106] C. R. Rathod, S. Rajagopalan and R. Vaidyanathan, Shape Memory and Superelastic
Technologies 2003, 331.
[107] S. Rajagopalan and R. Vaidyanathan, JOM 54, 2002, 45.
[108] W. Ni, Y.-T. Cheng and D. S. Grummon, Appl. Phys. Lett. 80, 2002, 3310.
[109] W. Ni, Y.-T. Cheng and D. S. Grummon, Surf. Coat. Technol. 177-178, 2004, 512.
[110] J. F. Su, W. M. Huang and M. H. Hong, Smart Mater. Struct. 16, 2007.
[111] S. Miyazaki and A. Ishida, Mater. Sci. Eng. A 273-275, 1999, 106.
[112] H. Hiraga, T. Inoue, H. Shimura and A. Matsunawa, Wear 231, 1999, 272.
[113] J. Singh and A. T. Alpas, Wear 181-183, 1995, 302.
[114] K. L. Johnson, Contact Mechanics, Cambridge University Press, New York 1985.
[115] A. J. M. Wood and T. W. Clyne, Acta Mater. 54, 2006, 5607.
[116] Y. Zhang, Y. T. Cheng and D. S. Grummon, J. Mater. Res. 22, 2007, 2851.
[117] P. Filip and K. Mazanec, Scripta Mater. 35, 1996, 349.
[118] D. Favier and Y. Liu, J. Alloys Compd. 297, 2000, 114.
[119] H. Matsumoto, J. Mater. Sci. Lett. 10, 1991, 408.
[120] Y. Liu and D. Favier, Acta Mater. 48, 2000, 3489.
[121] C.-Y. Chang, D. Vokoun and C.-T. Hu, Metall. and Mater. Trans. A 32, 2001, 1629.
[122] G. B. Stachowiak and P. G. McCormick, Scripta Metall. 21, 1987, 403.
[123] R. Vaidyanathan, D. C. Dunand and U. Ramamurty, Mater. Sci. Eng. A 289, 2000, 208.
[124] D. A. Miller and D. C. Lagoudas, Smart Mater. Struct. 9, 2000.