lower lakes and murray river modelling (virtual weir presentation / discussion) canberra 11 february...
TRANSCRIPT
Lower Lakes and Murray River Modelling(Virtual Weir Presentation / Discussion)
Canberra11 February 2009
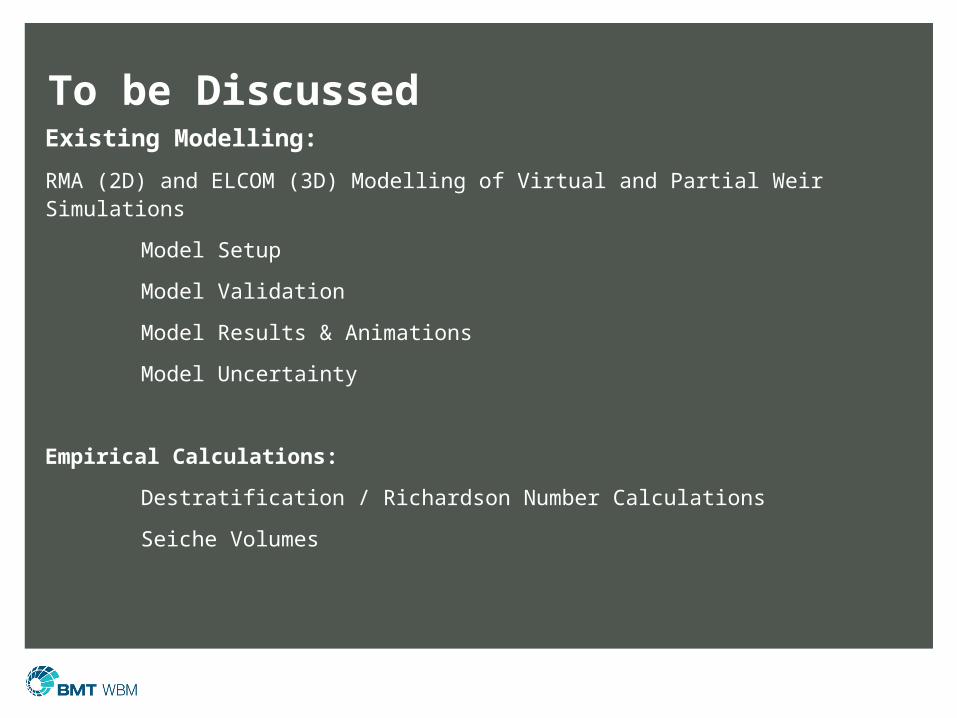
To be DiscussedExisting Modelling:
RMA (2D) and ELCOM (3D) Modelling of Virtual and Partial Weir Simulations
Model Setup
Model Validation
Model Results & Animations
Model Uncertainty
Empirical Calculations:
Destratification / Richardson Number Calculations
Seiche Volumes

Model Setup/Extents•RMA 2D (Blue) : All areas upstream of Tidal Barrages & Downstream of Lock 1, Lake Albert disconnected
•ELCOM 3D (Green) : From Pomanda Island (upstream of weir location) to Murray Bridge
•RMA simulation executed first, then results fed to ELCOM (U/S & D/S Boundaries)

Model Validation
Validation period 1/1/2008 – 14/7/2008
Objectives:
•Best match observed hydrodynamics (WL) and salinity
•Ensure key processes appropriately represented
•Understanding of model uncertainty
Key Uncertainties
•Additional salt load along length of River
•Additional irrigation demands / groundwater losses?

Predicted Water Levels – Poltalloch PlainsModel Validation - Poltalloch Plains Observed and Modelled Water Level Data
-0.75
-0.65
-0.55
-0.45
-0.35
-0.25
-0.15
-0.05
01/0
1/20
08
08/0
1/20
08
15/0
1/20
08
22/0
1/20
08
29/0
1/20
08
05/0
2/20
08
12/0
2/20
08
19/0
2/20
08
26/0
2/20
08
04/0
3/20
08
11/0
3/20
08
18/0
3/20
08
25/0
3/20
08
01/0
4/20
08
08/0
4/20
08
15/0
4/20
08
22/0
4/20
08
29/0
4/20
08
06/0
5/20
08
13/0
5/20
08
20/0
5/20
08
27/0
5/20
08
03/0
6/20
08
10/0
6/20
08
17/0
6/20
08
24/0
6/20
08
01/0
7/20
08
08/0
7/20
08
15/0
7/20
08
Wat
er L
evel
(m
AH
D)
Poltalloch Plains Observed
Additional 2m3/s Extraction & Enhanced Wind Stress
Additional 2m3/s Extraction
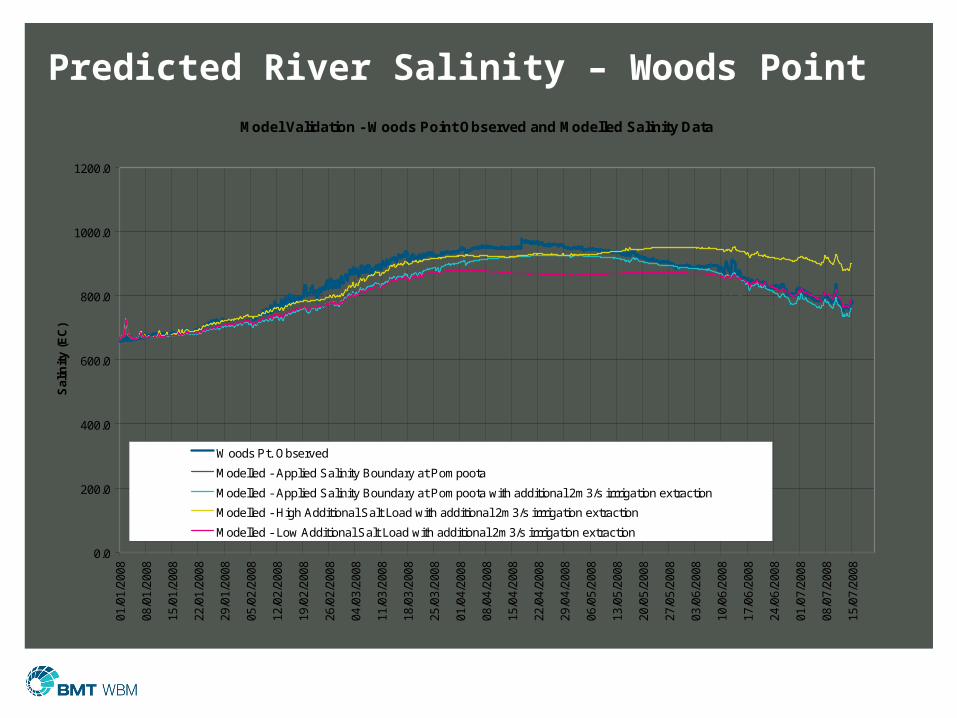
Predicted River Salinity – Woods PointModel Validation - Woods Point Observed and Modelled Salinity Data
0.0
200.0
400.0
600.0
800.0
1000.0
1200.0
01/0
1/20
08
08/0
1/20
08
15/0
1/20
08
22/0
1/20
08
29/0
1/20
08
05/0
2/20
08
12/0
2/20
08
19/0
2/20
08
26/0
2/20
08
04/0
3/20
08
11/0
3/20
08
18/0
3/20
08
25/0
3/20
08
01/0
4/20
08
08/0
4/20
08
15/0
4/20
08
22/0
4/20
08
29/0
4/20
08
06/0
5/20
08
13/0
5/20
08
20/0
5/20
08
27/0
5/20
08
03/0
6/20
08
10/0
6/20
08
17/0
6/20
08
24/0
6/20
08
01/0
7/20
08
08/0
7/20
08
15/0
7/20
08
Sal
init
y (E
C)
Woods Pt. Observed
Modelled - Applied Salinity Boundary at Pompoota
Modelled - Applied Salinity Boundary at Pompoota with additional 2m3/s irrrigation extraction
Modelled - High Additional Salt Load with additional 2m3/s irrrigation extraction
Modelled - Low Additional Salt Load with additional 2m3/s irrrigation extraction

Predicted Lake Salinity – Spatial Validation

Predicted Lake Salinity – Spatial ValidationMeasured and Predicted Salinities from Goolwa to Mouth Entrance at Wellington
(June 27, 2008)
0
2
4
6
8
10
12
14
16
18
20
0 10000 20000 30000 40000 50000 60000 70000
Chainage (m)
Sali
nit
y (
pp
t)
Measured Extractions as Provided Extractions + 2 m3/s Extractions + 4 m3/s
Measured and Predicted Salinities from Narrung to Mouth Entrance at Wellington(June 27, 2008)
0
0.5
1
1.5
2
2.5
40000 42000 44000 46000 48000 50000 52000 54000 56000 58000 60000 62000
Chainage (m)
Sali
nit
y (
pp
t)
Measured Extractions as Provided Extractions + 2 m3/s Extractions + 4 m3/s

Predicted 3D River Salinity – WellingtonWellington
0
200
400
600
800
1000
1200
1400
1600
1800
1/01/08 16/01/08 31/01/08 15/02/08 1/03/08 16/03/08 31/03/08 15/04/08 30/04/08 15/05/08 30/05/08 14/06/08 29/06/08 14/07/08
Sal
inity
(E
C)
Wellington Pontoon Recorded Salinity Near Bed Wellington Pontoon Recorded Salinity Near Surface
Modelled Near Bed Salinity 4m3/s Additional Extraction Modelled Near Surface Salinity 4m3/s Additional Extraction
Modelled Near Bed Salinity 2m3/s Additional Extraction Modelled Near Surface Salinity 2m3/s Additional Extraction

Predicted 3D River Temperature – Wellington
Wellington
9
11
13
15
17
19
21
23
25
27
29
1/01/08 16/01/08 31/01/08 15/02/08 1/03/08 16/03/08 31/03/08 15/04/08 30/04/08 15/05/08 30/05/08 14/06/08 29/06/08 14/07/08
Tem
pera
ture
(D
egC
)
Wellington Pontoon Recorded Temperature Near SurfaceModelled Near Surface Temperature ARGOSS Data in UTC timeModelled Near Surface Temperature with updated ARGOSS & Narrung Data

Comparison Measured vs Modelled River Salinity

2 yr “Prognostic Simulations”
Examining what may happen in the future, given continuing high net evaporation (1982) levels, and variations in the South Australia’s border allocation (Border Allocations of 696, 796 and 896 GL/yr), through to the end of 2010.
Simulations aimed at maintaining Lake Level at -1.3mAHD.
Salt water introduced through Goolwa Barrage in October 2009.
Stop logs positioned by-monthly based on water level balance calculation.
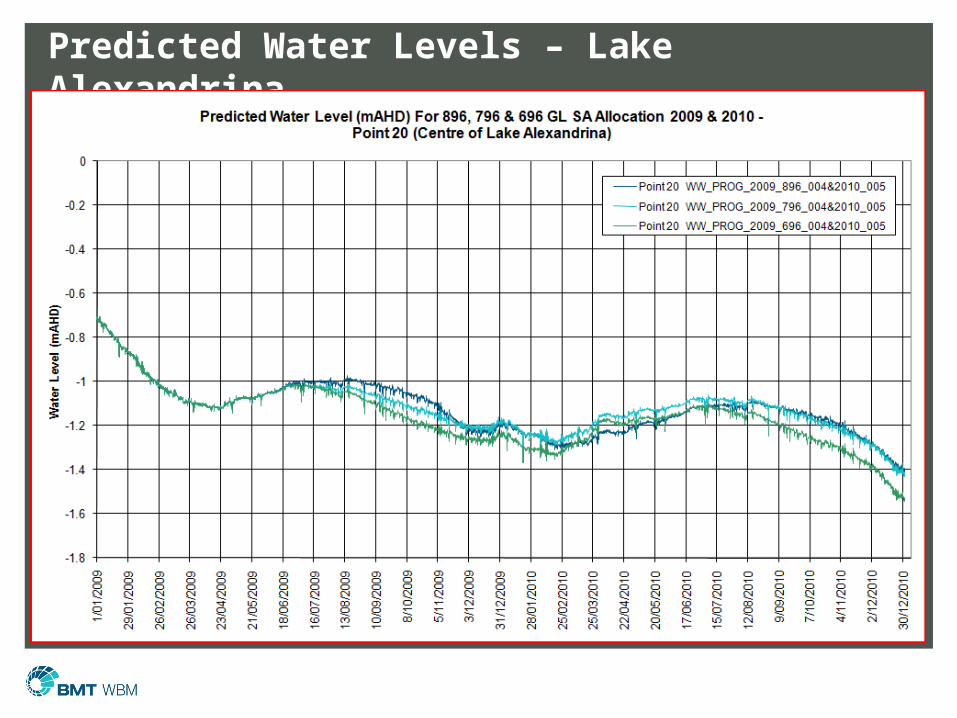
Predicted Water Levels – Lake Alexandrina
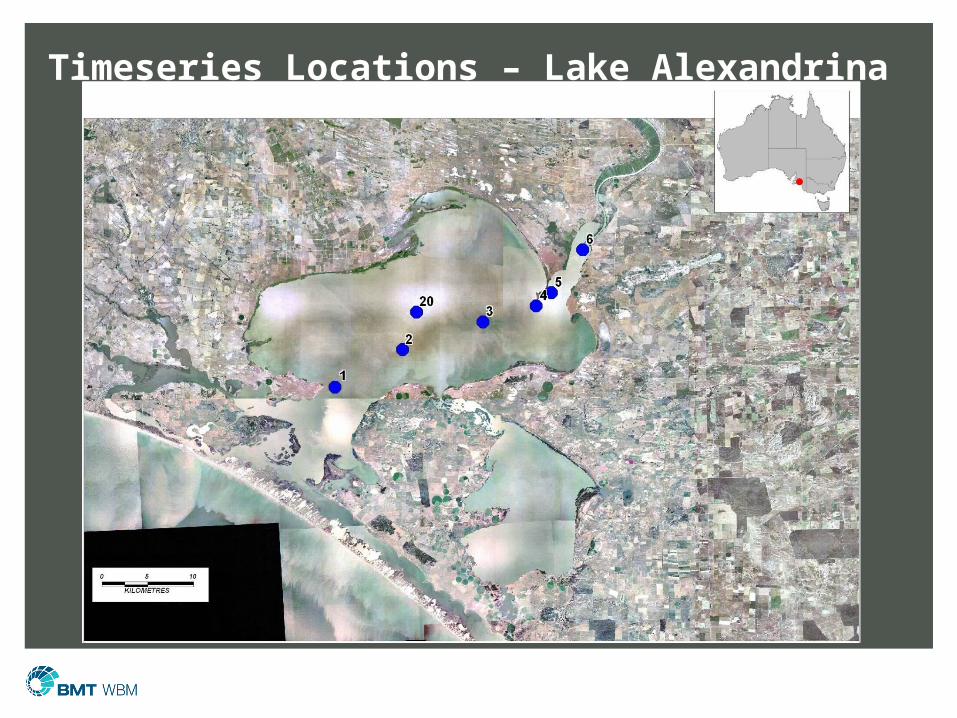
Timeseries Locations – Lake Alexandrina

Predicted Lake (2D) Salinities – Point 1
Predicted Specific Conductivity For 896, 796 & 696 GL SA Allocation 2009 & 2010 - Point 1
0
10000
20000
30000
40000
50000
60000
70000
80000
90000
1/01
/200
9
29/0
1/20
09
26/0
2/20
09
26/0
3/20
09
23/0
4/20
09
21/0
5/20
09
18/0
6/20
09
16/0
7/20
09
13/0
8/20
09
10/0
9/20
09
8/10
/200
9
5/11
/200
9
3/12
/200
9
31/1
2/20
09
28/0
1/20
10
25/0
2/20
10
25/0
3/20
10
22/0
4/20
10
20/0
5/20
10
17/0
6/20
10
15/0
7/20
10
12/0
8/20
10
9/09
/201
0
7/10
/201
0
4/11
/201
0
2/12
/201
0
30/1
2/20
10
Ele
ctri
cal
Co
nd
uct
ivit
y ( m S
/cm
)
896 GL/yr SA Border Allocation
796 GL/yr SA Border Allocation
696 GL/yr SA Border Allocation
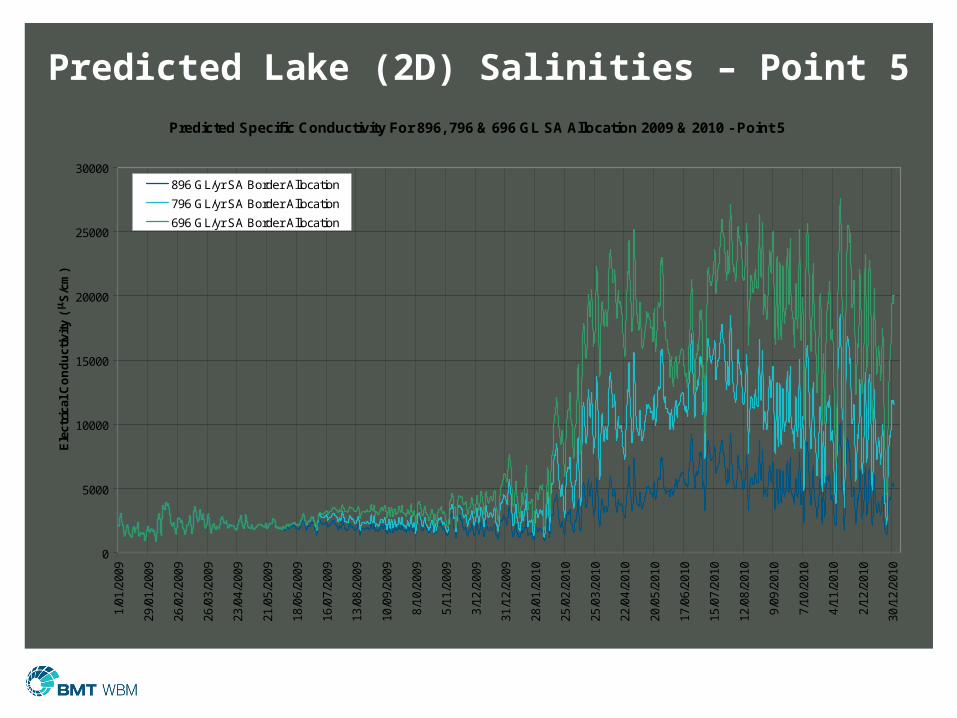
Predicted Lake (2D) Salinities – Point 5
Predicted Specific Conductivity For 896, 796 & 696 GL SA Allocation 2009 & 2010 - Point 5
0
5000
10000
15000
20000
25000
30000
1/01
/200
9
29/0
1/20
09
26/0
2/20
09
26/0
3/20
09
23/0
4/20
09
21/0
5/20
09
18/0
6/20
09
16/0
7/20
09
13/0
8/20
09
10/0
9/20
09
8/10
/200
9
5/11
/200
9
3/12
/200
9
31/1
2/20
09
28/0
1/20
10
25/0
2/20
10
25/0
3/20
10
22/0
4/20
10
20/0
5/20
10
17/0
6/20
10
15/0
7/20
10
12/0
8/20
10
9/09
/201
0
7/10
/201
0
4/11
/201
0
2/12
/201
0
30/1
2/20
10
Ele
ctri
cal
Co
nd
uct
ivit
y ( m S
/cm
)
896 GL/yr SA Border Allocation
796 GL/yr SA Border Allocation
696 GL/yr SA Border Allocation
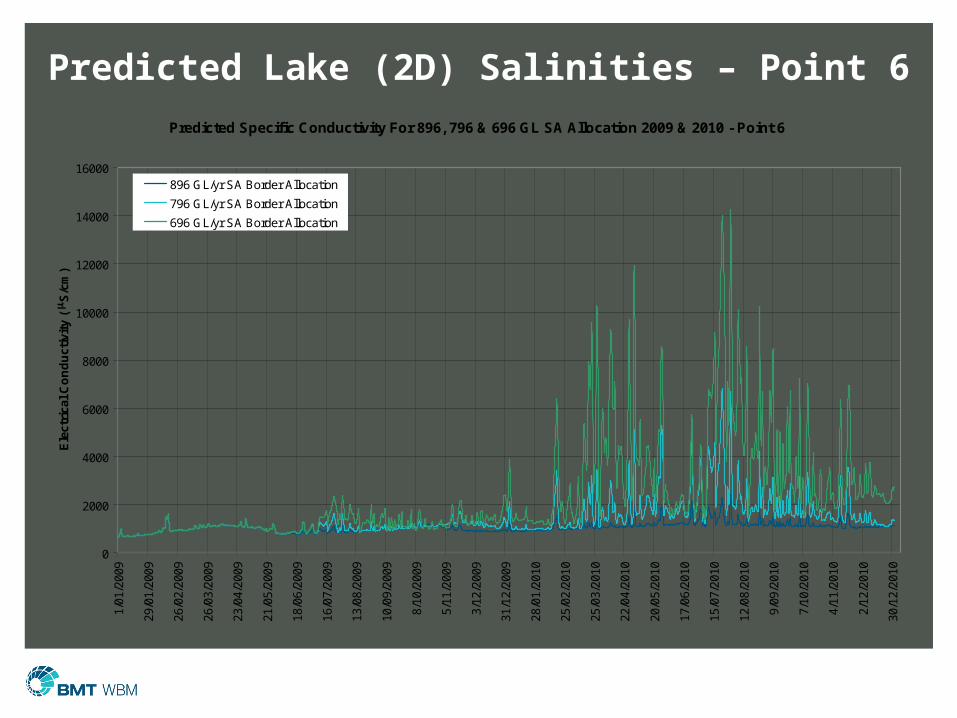
Predicted Lake (2D) Salinities – Point 6
Predicted Specific Conductivity For 896, 796 & 696 GL SA Allocation 2009 & 2010 - Point 6
0
2000
4000
6000
8000
10000
12000
14000
16000
1/01
/200
9
29/0
1/20
09
26/0
2/20
09
26/0
3/20
09
23/0
4/20
09
21/0
5/20
09
18/0
6/20
09
16/0
7/20
09
13/0
8/20
09
10/0
9/20
09
8/10
/200
9
5/11
/200
9
3/12
/200
9
31/1
2/20
09
28/0
1/20
10
25/0
2/20
10
25/0
3/20
10
22/0
4/20
10
20/0
5/20
10
17/0
6/20
10
15/0
7/20
10
12/0
8/20
10
9/09
/201
0
7/10
/201
0
4/11
/201
0
2/12
/201
0
30/1
2/20
10
Ele
ctri
cal
Co
nd
uct
ivit
y ( m S
/cm
)
896 GL/yr SA Border Allocation
796 GL/yr SA Border Allocation
696 GL/yr SA Border Allocation
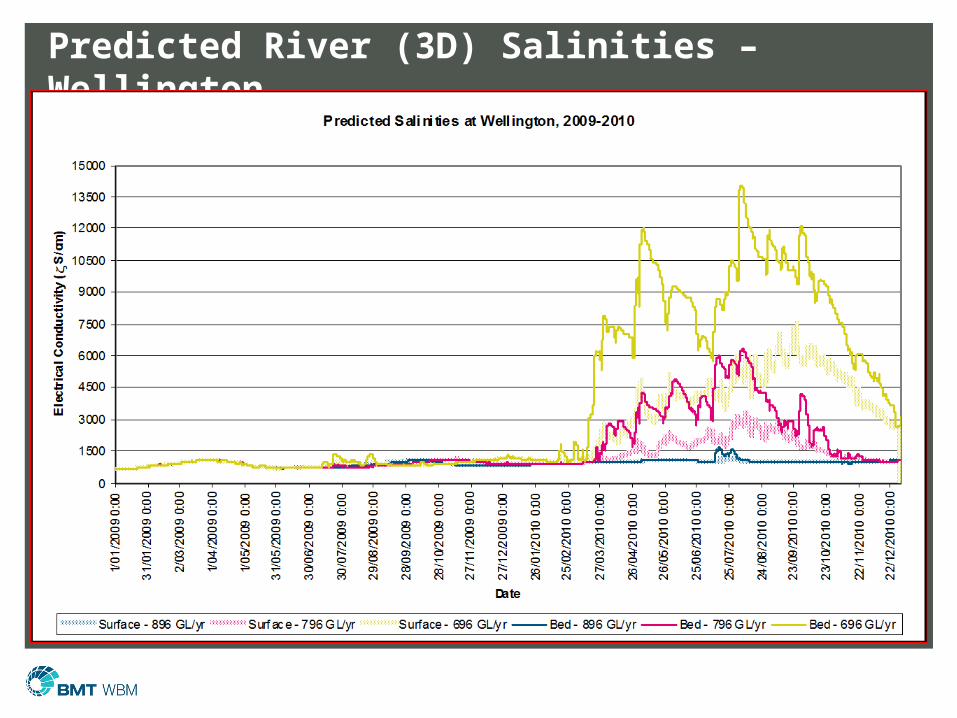
Predicted River (3D) Salinities – Wellington

Predicted River (3D) Salinities – Tailem Bend

Predicted River (3D) Salinities – Swanport
Animation: Lower Lakes 696 GL/yr

Animation: Lower Lakes 696 GL/yr

Animation: River (696 GL/yr)

Animation: River (696 GL/yr)
Animation: River (796 GL/yr)
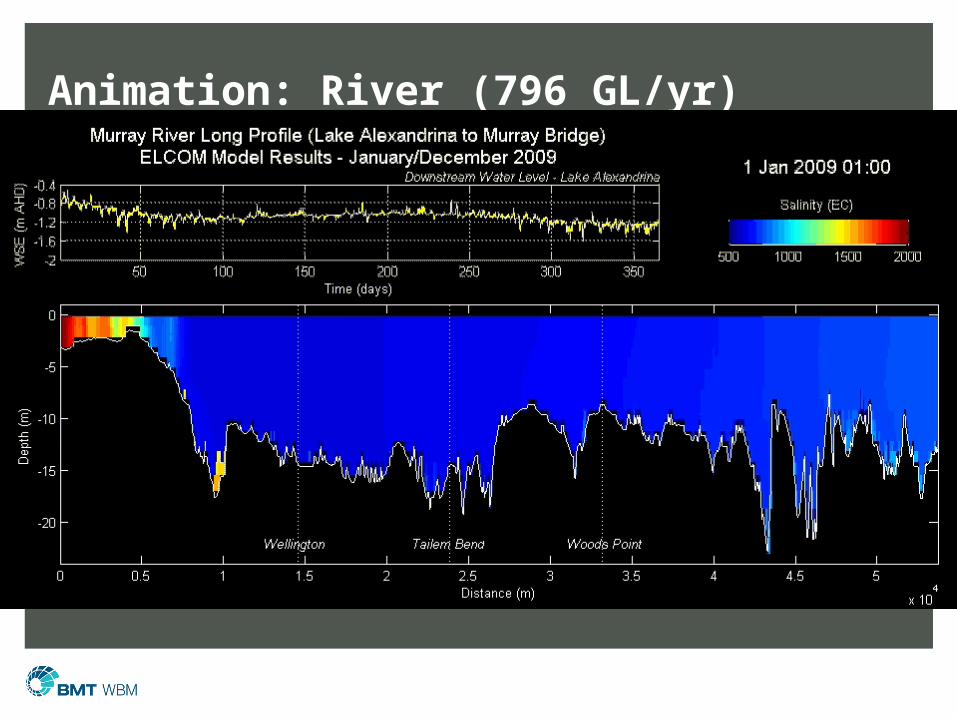
Animation: River (796 GL/yr)

Animation: River (896 GL/yr)

Animation: River (896 GL/yr)

Comparison at End 2010696 GL/yr
796 GL/yr
896 GL/yr

Uncertainty
•Model can still be improved
•Validation only currently till Mid July 2008 (no destratification period)
•No validation data for low level and high salt available
•Uses 1 year (2007) wind (cannot predict future wind conditions)
•Wind spatially homogenous
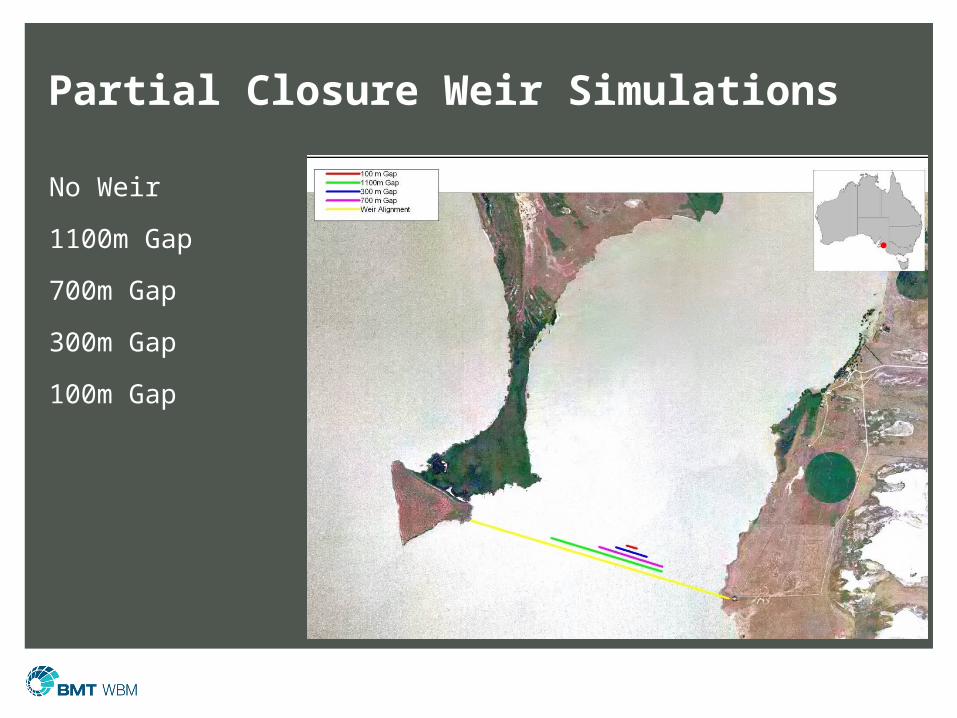
Partial Closure Weir Simulations
No Weir
1100m Gap
700m Gap
300m Gap
100m Gap

Simulated Water Level in Lake AlexandrinaSmoothed Water Level Time Series for Different 'Gap Scenarios'
Downstream of Weir (Location 3)
-1.1
-1.05
-1
-0.95
-0.9
-0.85
-0.8
-0.75
-0.7
-0.65
-0.6
-0.55
-0.5
1/01
/200
9 0:
008/
01/2
009
0:00
15/0
1/20
09 0
:00
22/0
1/20
09 0
:00
29/0
1/20
09 0
:00
5/02
/200
9 0:
0012
/02/
2009
0:0
019
/02/
2009
0:0
026
/02/
2009
0:0
05/
03/2
009
0:00
12/0
3/20
09 0
:00
19/0
3/20
09 0
:00
26/0
3/20
09 0
:00
2/04
/200
9 0:
009/
04/2
009
0:00
16/0
4/20
09 0
:00
23/0
4/20
09 0
:00
30/0
4/20
09 0
:00
7/05
/200
9 0:
0014
/05/
2009
0:0
021
/05/
2009
0:0
028
/05/
2009
0:0
04/
06/2
009
0:00
11/0
6/20
09 0
:00
18/0
6/20
09 0
:00
25/0
6/20
09 0
:00
2/07
/200
9 0:
009/
07/2
009
0:00
16/0
7/20
09 0
:00
23/0
7/20
09 0
:00
30/0
7/20
09 0
:00
6/08
/200
9 0:
0013
/08/
2009
0:0
020
/08/
2009
0:0
027
/08/
2009
0:0
03/
09/2
009
0:00
10/0
9/20
09 0
:00
17/0
9/20
09 0
:00
24/0
9/20
09 0
:00
1/10
/200
9 0:
008/
10/2
009
0:00
15/1
0/20
09 0
:00
22/1
0/20
09 0
:00
29/1
0/20
09 0
:00
5/11
/200
9 0:
0012
/11/
2009
0:0
019
/11/
2009
0:0
026
/11/
2009
0:0
03/
12/2
009
0:00
10/1
2/20
09 0
:00
17/1
2/20
09 0
:00
24/1
2/20
09 0
:00
31/1
2/20
09 0
:00
Date
Wat
er S
urf
ace
Ele
vati
on
(m
AH
D)
100m Gap 300m Gap 700m Gap 1100m Gap No Weir
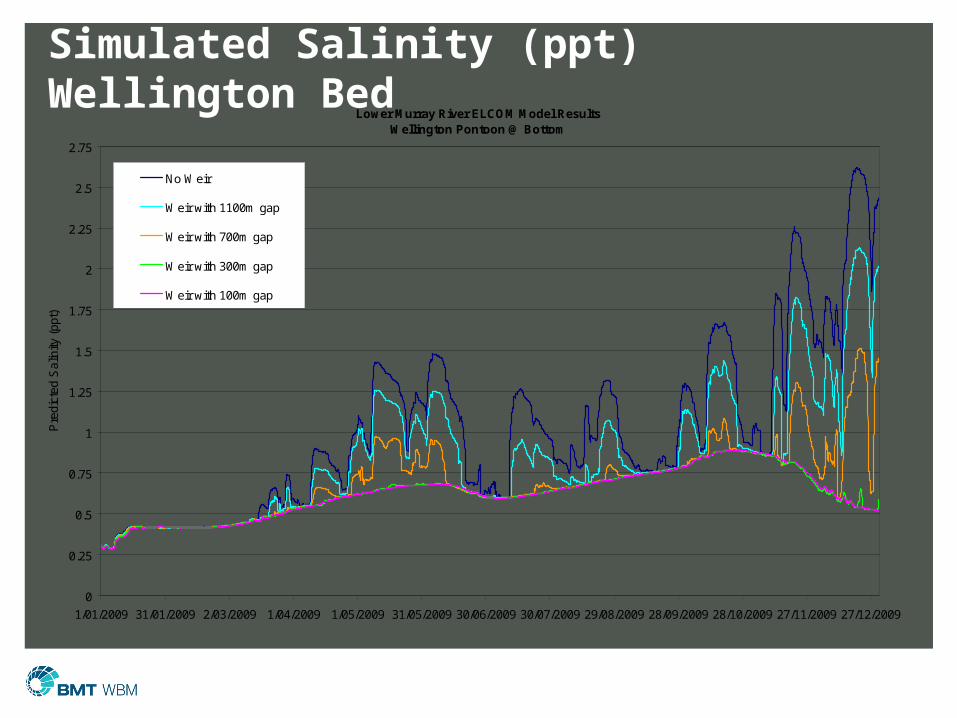
Simulated Salinity (ppt) Wellington BedLower Murray River ELCOM Model Results
Wellington Pontoon @ Bottom
0
0.25
0.5
0.75
1
1.25
1.5
1.75
2
2.25
2.5
2.75
1/01/2009 31/01/2009 2/03/2009 1/04/2009 1/05/2009 31/05/2009 30/06/2009 30/07/2009 29/08/2009 28/09/2009 28/10/2009 27/11/2009 27/12/2009
Pre
dict
ed S
alin
ity (
ppt)
No Weir
Weir with 1100m gap
Weir with 700m gap
Weir with 300m gap
Weir with 100m gap

Pomanda Embayment Bathymetry
River Channel
Pomanda IslandLake Alexandrina
N

Other Info